mechanical performance of polymer systems: the relation ... · and fatigue tests or izod impact...
TRANSCRIPT

Mechanical performance of polymer systems: The relation
between structure and properties
Han E.H. Meijer*, Leon E. Govaert
Materials Technology, Dutch Polymer Institute, Eindhoven University of Technology, W-hoog 4.140, P.O. Box 513,
5612 MB Eindhoven, The Netherlands
Accepted 24 March 2005
Abstract
A direct relation between molecular characteristics and macroscopic mechanical properties of polymeric materials was
subject of a vast number academic and industrial research studies in the past. Motivation was that an answer to this question
could, in the end, result in guidelines how to construct tailored materials, either on the molecular level or, in heterogeneous
materials, on the micro-scale, that could serve our needs of improved materials without the need of extensive trial and error
work. Despite all attempts, no real universally applicable success was reported, and it was only after the introduction of the
concept of the polymer’s intrinsic deformation behavior that some remarkable progress could be recognized. Thus, it is first
important to understand where intrinsic deformation behavior of polymeric materials stands for. Second, it is interesting to
understand why this intermediate step is relevant and how it relates to the molecular structure of polymers. Third and, in the end,
the most computational-modeling-based question to be answered is how intrinsic behavior relates to the macroscopic response
of polymeric materials. This is a multi-scale problem like encountered in many of our present research problems.
q 2005 Published by Elsevier Ltd.
Keywords: Amorphous polymers; Toughness; Intrinsic behavior; Mechanical properties; Constitutive modeling; Multi-level finite element
method; Structure–property relations
Contents
1. Introduction . . . . . . . . . . . . . . . . . . . . . . . . . . . . . . . . . . . . . . . . . . . . . . . . . . . . . . . . . . . . . . . . . . . . . . . . . . 916
2. Structure of polymers . . . . . . . . . . . . . . . . . . . . . . . . . . . . . . . . . . . . . . . . . . . . . . . . . . . . . . . . . . . . . . . . . . . 917
3. Intrinsic deformation . . . . . . . . . . . . . . . . . . . . . . . . . . . . . . . . . . . . . . . . . . . . . . . . . . . . . . . . . . . . . . . . . . . . 919
4. Physical ageing . . . . . . . . . . . . . . . . . . . . . . . . . . . . . . . . . . . . . . . . . . . . . . . . . . . . . . . . . . . . . . . . . . . . . . . . 922
5. From intrinsic behavior to macroscopic response . . . . . . . . . . . . . . . . . . . . . . . . . . . . . . . . . . . . . . . . . . . . . . . 924
6. Life time prediction . . . . . . . . . . . . . . . . . . . . . . . . . . . . . . . . . . . . . . . . . . . . . . . . . . . . . . . . . . . . . . . . . . . . 925
Prog. Polym. Sci. 30 (2005) 915–938
www.elsevier.com/locate/ppolysci
0079-6700/$ - see front matter q 2005 Published by Elsevier Ltd.
doi:10.1016/j.progpolymsci.2005.06.009
* Corresponding author.
E-mail address: [email protected] (H.E.H. Meijer).
URL: www.mate.tue.nl.

H.E.H. Meijer, L.E. Govaert / Prog. Polym. Sci. 30 (2005) 915–938916
7. Craze initiation . . . . . . . . . . . . . . . . . . . . . . . . . . . . . . . . . . . . . . . . . . . . . . . . . . . . . . . . . . . . . . . . . . . . . . . . 927
8. Heterogeneous systems . . . . . . . . . . . . . . . . . . . . . . . . . . . . . . . . . . . . . . . . . . . . . . . . . . . . . . . . . . . . . . . . . . 930
9. Optimal toughness modifier . . . . . . . . . . . . . . . . . . . . . . . . . . . . . . . . . . . . . . . . . . . . . . . . . . . . . . . . . . . . . . . 931
10. Brittle-to-tough transitions . . . . . . . . . . . . . . . . . . . . . . . . . . . . . . . . . . . . . . . . . . . . . . . . . . . . . . . . . . . . . . . . 933
11. Conclusions . . . . . . . . . . . . . . . . . . . . . . . . . . . . . . . . . . . . . . . . . . . . . . . . . . . . . . . . . . . . . . . . . . . . . . . . . . 934
Acknowledgements . . . . . . . . . . . . . . . . . . . . . . . . . . . . . . . . . . . . . . . . . . . . . . . . . . . . . . . . . . . . . . . . . . . . . 935
References . . . . . . . . . . . . . . . . . . . . . . . . . . . . . . . . . . . . . . . . . . . . . . . . . . . . . . . . . . . . . . . . . . . . . . . . . . . 935
1. Introduction
Bridging the gap between molecular and macro-
scopic properties, with as extra intermediate step the
processing history, see Fig. 1a, is a just as challenging
as impossible task. Reason is that the multi-scale
problems involved require far too much compu-
tational time and computational memory to be
resolved via ab initio analyses. Analyses on different
scales require averaging the resulting properties from
the analysis on the underlying scale, consequently
loosing detail. Therefore, alternatives are searched
Fig. 1. From molecular details to macroscopic response via th
for. A big step forward was made with the
development of a video-controlled tensile test by
Christian G’Sell at the Ecole des Mines in Nancy
[1,2]. This technique enabled the experimental
assessment of the intrinsic deformation behavior: the
polymer’s stress response measured during homo-
geneous deformation. More or less simultaneously,
Mary Boyce, at MIT, optimized the much more
practical uniaxial and plain strain compression tests to
obtain similar information in different loading
geometries [3,4]. Reason to be pleased with this
intermediate step is twofold. First, our present
e intermediate of the polymer’s intrinsic deformation.

1 About nature’s processing: What is the melting point of
ceramics? And that of metals? If these materials are to be processed
at ambient temperature and atmospheric pressure, then what is their
solubility? How does nature use chemistry to make teeth and bones?
Most of this is known and, interestingly, comes rather close to
techniques we use in polymer technology.
H.E.H. Meijer, L.E. Govaert / Prog. Polym. Sci. 30 (2005) 915–938 917
advanced computational tools and expertise can be
successfully used in the relation between the intrinsic
behavior and the macroscopic response, the right-
hand side of Fig. 1b. Prerequisite for the success of
this route was the development of constitutive models
that could capture the intrinsic behavior. So let start to
focus on this issue. It is known that it took the polymer
melt rheology community some half a century to
arrive at constitutive equations that are not only valid
in simple shear flows but also can deal with
extensional flows. The (extended) Pom Pom model
quantitatively describes the melt rheology for
branched, and even also for linear, polymers, in
complex flows and is based on molecular character-
istics [5–7]. Since rheology is based on fluid
mechanics, rheologists can be considered as succes-
sors of Isaac Newton, thus mathematically educated
scientists. Therefore, it is at least remarkable that it
took them that much time. The main topics of the
rheologist’s concern were the quantitative modeling
of the deformation rate dependent shear and elonga-
tional viscosity and first (and eventually second)
normal stress difference, in incompressible homo-
geneous time dependent start-up flows. Interesting
now is that the major problem encountered in the solid
state rheology of the same polymers is that they are
per definition tested in compressible inhomogeneous
start-up flows in extension. Solid state rheologists can
be considered as the successors of Robert Hooke.
They are practical engineers that have to deal with the
impossible interpretation of the most widely used test:
the tensile test on a normalized dogbone-shaped
sample that, at best, shows only a simple localization
behavior, like necking. All relatively recent progress
reported in solid state rheology made of course use of
the results obtained in the constitutive equations for
melts and the good news is that at present the
macroscopic response of amorphous polymers to
shear and tensile loading can now be quantitatively
described. In plain strain 2D, or even in completely
3D computations, in short and in long time loading, in
homogeneous and also in heterogeneous systems,
once the polymer’s intrinsic behavior (and its
microstructure in case of heterogeneous systems) is
known. Use is made of standard (e.g. Marc, Abaqus)
software combined with custom made (Multi-Level-
Finite-Element) analyses.
Second, the relation between molecular properties
of polymers and their intrinsic behavior, the left-hand
side of Fig. 1b, are accessible via well defined
experiments that are much easier interpretable than
when compared to the results of tensile tests, creep
and fatigue tests or Izod impact tests. So let us focus
now on the structure of polymers.
2. Structure of polymers
Polymers are different from other construction
materials like ceramics and metals, because of their
macromolecular nature. The covalently bonded, long
chain structure makes them macromolecules and
determines, via the weight averaged molecular
weight, Mw, their processability, like spin-, blow-,
deepdraw-, generally melt-formability. The number
averaged molecular weight, Mn, determines the
mechanical strength, and high molecular weights are
beneficial for properties like strain-to-break, impact
resistance, wear, etc. Thus, natural limits are met,
since too high molecular weights yield too high shear
and elongational viscosities that make polymers
inprocessable. Prime examples are the very useful
poly-tetra-fluor-ethylenes, PTFE’s [8,9], and ultra-
high-molecular-weight-poly-ethylenes, UHMWPE’s
[10], and not only garbage bags are made of poly-
ethylene, PE, but also high-performance fibers
[11–13] that are even used for bullet proof vests
(alternatively made from, also inprocessable in the
melt, rigid aromatic polyamides [14,15]). The
resulting mechanical properties of these high per-
formance fibers, with moduli of 150 GPa and
strengths of up to 4 GPa, represent the optimal use
of what the potential of the molecular structure of
polymers yields, combined with their low density.
Thinking about polymers, it becomes clear why living
nature used the polymeric concept to build its
structures. And not only in high strength applications
like wood, silk or spider-webs.1

Fig. 2. Diamond, PE and the notched impact test.
3
H.E.H. Meijer, L.E. Govaert / Prog. Polym. Sci. 30 (2005) 915–938918
Let us now consider diamond, a covalently bonded
structure of carbon atoms. What is the energy to create
new surfaces in diamond, known as the strongest
material in nature? The answer is 1 J/m2. How much is
that? It is the energy that comes free if ‘an ordinary
apple falls from an ordinary table’ [16]. And that is
shocking, especially because in this experiment we
splitted the two surfaces at once, without applying any
zipping process. It is the interaction potential that
quantifies the energy needed to split atoms, and thus
also to create ideal surfaces made of those atoms. How
thus this explain the impact toughness of a standard,
commodity polymer like PE, which is chemically
spoken diamond with two out of the four strongest
bonds in nature (covalent) replaced by two of the
weakest bonds (Van der Waals), and that measures, in
a standard Izod impact test, a value of 105 J/m2? The
answer to this question is delocalization. If a material
is able to delocalize its strain, out of the area of the
largest stress, it will undergo deformation in the
volume. This volume deformation is, in a standar-
dized test like Izod-impact, still attributed to the
geometrical cross-sectional area in the test bar, behind
the notch, see Fig. 2.2
2 We should define impact values only in J/m2. Either or not
correct, volume deformation is attributed to the surface energy. A
value of 100.000 J/m2 for PE is of course rather arbitrary. It
represents the maximum energy absorbed in the (optically stress-
whithening) volume during polymer testing using the Izod test-bar,
and it is partly determined by the sample geometry. A value like that
for PE means in practice: no-break.
In the glassy state the polymer’s secondary bonds
determine the elastic part of the mechanical properties,
modulus and yield stress, while the primary bonds in the
network potentially induce the necessary delocalization
of local strain that gives toughness. Given this
mechanism we conclude that all amorphous polymers
with a Tg above room temperature have roughly the
same elastic Young’s (not Hooke’s3) modulus of 3 GPa.
Low, compared to both competitors, ceramics and
metals, since controlled by their weak secondary bonds.
Even worse becomes the case for semicrystalline
polymers with a Tg below room temperature, that
should be considered as a gel of an amorphous fluid
physically kept together by higher melting crystals.
Only in high performance fibers, like UMWPE and
aromatic polyamides, the covalently bonded structure is
mechanically addressed during loading, provided that
sufficient length is given to the weak secondary
interactions to transfer the load from one molecule to
the other. This, of course, only works in the direction of
the processing-induced 100% main chain orientation.
Non-oriented polymers basically only strongly differ in
impact strength or, equivalently, their ability to
delocalize strain. Ceramics are intrinsically brittle but
some are less brittle, like man-made ceramic fiber
reinforced ceramics [17] or the natural multi-layered
tooth or seashell ceramics [18,19], the last with typically
400 nm sized layered structures. Delocalization in the
artifacts is realized because the ceramic fibers survive
the breaking and bridge the cracks, giving rise to both a
second dissipation mechanism via debonding along the
fibers and in the end a possibly local strain hardening via
cooperative fiber loading. This is also the way stone
reinforcement in concrete works. Delocalization in the
natural objects is induced by weakening the structure
perpendicular to the loading direction yielding a
multiple cracking mechanism, see Fig. 3. This principle
is comparable to the change of diamond into
‘The power of any springy body is in the same proportion
with the extension (Sic vis, sic extensio)’ was Hooke’s way in
1676 to express the constitutive equation for a solid that we now
write as sZGg, or sZG B in 3D, where Newton’s 1687
definition of the viscosity for fluids was ‘The resistance which
arises from the lack of slipperiness of the parts of the liquid,
other things being equal, is proportional to the velocity with
which the parts of the liquid are separated from one another’,
that we now write as sZhg_, or sZ2h D in 3D.

Fig. 3. Breaking of homogeneous (left) and heterogeneous (right) ceramics. The figure on the left shows catastrophic strain localization in a
Californian Giant Rock induced by thermal stresses from a nightly fire. The figure on the right shows delocalized strain in seashell ceramics, see
Refs. [18,19].
H.E.H. Meijer, L.E. Govaert / Prog. Polym. Sci. 30 (2005) 915–938 919
polyethylene, weakening the structure in some direc-
tions, thus suffering in mechanical bulk behavior like
modulus and yield strength and, where seashells are still
pretty hard and strong, polyethylene will never be
diamond anymore.
3. Intrinsic deformation
Our basic question was: where does the intrinsic
behavior of polymers originate from and can we
understand it? To answer that, we start with returning
to the original work of Haward and Thackray of 1965
who described the material’s response with two
parallel processes: (i) the initial non-linear elastic
total
inter-molecular
network
true strain
true
str
ess
1
1
2
2(b)(a)
log(
η) [M
Pa⋅
s]
Fig. 4. The stress decomposition proposed by Haward and Thackray [20] (
characteristic stress-dependence of the viscosity of the dashpot for PC at
response up to yield, controlled by the secondary,
intermolecular, interactions, combined with (ii) the
entanglement network response in parallel from the
primary intramolecular interactions which gives
an entropic contribution at large strains [20]. In
Hawards’ approach, see Fig. 4, the secondary
interactions were modeled via a Maxwell model
(fluid!), where all non-linearity was put into the stress-
activated viscosity function that followed an Eyring
model. The original model not only received a typical
polymer type of response in terms of citations with a
change in slope from 1 to 3 at the onset of the use of
continuum mechanics based computer modeling [21],
but also basically was at the cradle of the solid state
rheology. Its conceptual approach was followed and
100 1010
5
0
5
0
5
τeq [MPa]
a). For its present 3D formulation, see Table 1. Further we show the
room temperature [27] (b).
0 0.5 1 1.50
50
100
150
PC
PS
true strain [–]
true
str
ess
[MP
a]
1 1.05 1.1 1.150
25
50
75(b)(a)
λ [–]
eng.
str
ess
[MP
a]
PS, rolled
PC, rolled
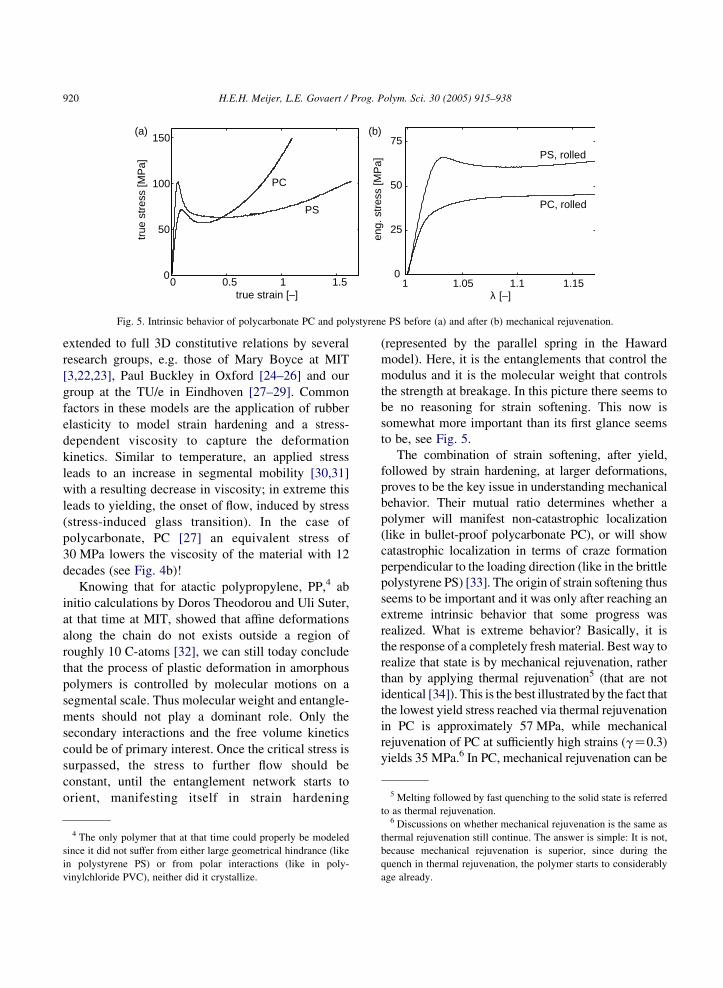
Fig. 5. Intrinsic behavior of polycarbonate PC and polystyrene PS before (a) and after (b) mechanical rejuvenation.
5 Melting followed by fast quenching to the solid state is referred
H.E.H. Meijer, L.E. Govaert / Prog. Polym. Sci. 30 (2005) 915–938920
extended to full 3D constitutive relations by several
research groups, e.g. those of Mary Boyce at MIT
[3,22,23], Paul Buckley in Oxford [24–26] and our
group at the TU/e in Eindhoven [27–29]. Common
factors in these models are the application of rubber
elasticity to model strain hardening and a stress-
dependent viscosity to capture the deformation
kinetics. Similar to temperature, an applied stress
leads to an increase in segmental mobility [30,31]
with a resulting decrease in viscosity; in extreme this
leads to yielding, the onset of flow, induced by stress
(stress-induced glass transition). In the case of
polycarbonate, PC [27] an equivalent stress of
30 MPa lowers the viscosity of the material with 12
decades (see Fig. 4b)!
Knowing that for atactic polypropylene, PP,4 ab
initio calculations by Doros Theodorou and Uli Suter,
at that time at MIT, showed that affine deformations
along the chain do not exists outside a region of
roughly 10 C-atoms [32], we can still today conclude
that the process of plastic deformation in amorphous
polymers is controlled by molecular motions on a
segmental scale. Thus molecular weight and entangle-
ments should not play a dominant role. Only the
secondary interactions and the free volume kinetics
could be of primary interest. Once the critical stress is
surpassed, the stress to further flow should be
constant, until the entanglement network starts to
orient, manifesting itself in strain hardening
4 The only polymer that at that time could properly be modeled
since it did not suffer from either large geometrical hindrance (like
in polystyrene PS) or from polar interactions (like in poly-
vinylchloride PVC), neither did it crystallize.
(represented by the parallel spring in the Haward
model). Here, it is the entanglements that control the
modulus and it is the molecular weight that controls
the strength at breakage. In this picture there seems to
be no reasoning for strain softening. This now is
somewhat more important than its first glance seems
to be, see Fig. 5.
The combination of strain softening, after yield,
followed by strain hardening, at larger deformations,
proves to be the key issue in understanding mechanical
behavior. Their mutual ratio determines whether a
polymer will manifest non-catastrophic localization
(like in bullet-proof polycarbonate PC), or will show
catastrophic localization in terms of craze formation
perpendicular to the loading direction (like in the brittle
polystyrene PS) [33]. The origin of strain softening thus
seems to be important and it was only after reaching an
extreme intrinsic behavior that some progress was
realized. What is extreme behavior? Basically, it is
the response of a completely fresh material. Best way to
realize that state is by mechanical rejuvenation, rather
than by applying thermal rejuvenation5 (that are not
identical [34]). This is the best illustrated by the fact that
the lowest yield stress reached via thermal rejuvenation
in PC is approximately 57 MPa, while mechanical
rejuvenation of PC at sufficiently high strains (gZ0.3)
yields 35 MPa.6 In PC, mechanical rejuvenation can be
to as thermal rejuvenation.6 Discussions on whether mechanical rejuvenation is the same as
thermal rejuvenation still continue. The answer is simple: It is not,
because mechanical rejuvenation is superior, since during the
quench in thermal rejuvenation, the polymer starts to considerably
age already.

H.E.H. Meijer, L.E. Govaert / Prog. Polym. Sci. 30 (2005) 915–938 921
achieved by twisting a cylindrical test bar to and fro over
7208 at room temperature prior to tensile testing [35].
For lower entanglement density polymers like PS this
does not work (crazes occur) and an alternative route
was explored in deforming the material at room
temperature under (compressive) stresses via a 30%
height reduction in a two-roll milling process [36,37].
For PC, 10% proves to be sufficient to induce
homogeneous deformation without neck formation.
Also, PS shows homogeneous deformation, without
neck, but also without craze formation, see Fig. 6.
Our understanding is that once the secondary bonds
are locally weakened by stress, the material must flow
under a constant stress up to the point that strain
hardening sets in. And that is exactly what we find in
rejuvenated materials. During the cold rolling process
we pushed the original, aged, material to a strain that
was sufficiently large that we entered the start the strain
hardening part of the intrinsic deformation curve. By
Fig. 6. Deformation in the quenched (a and c) and mechanically reju
the way, interestingly enough, the density of
the polymers increased during this process of mechan-
ical rejuvenation. After release of the stress and
reloading, the yield stress proved to be reduced to the
extent that no softening occurs anymore. The cause of
strain localization is thus removed and that explains the
no-necking for PC and the no-crazing of PS. The low
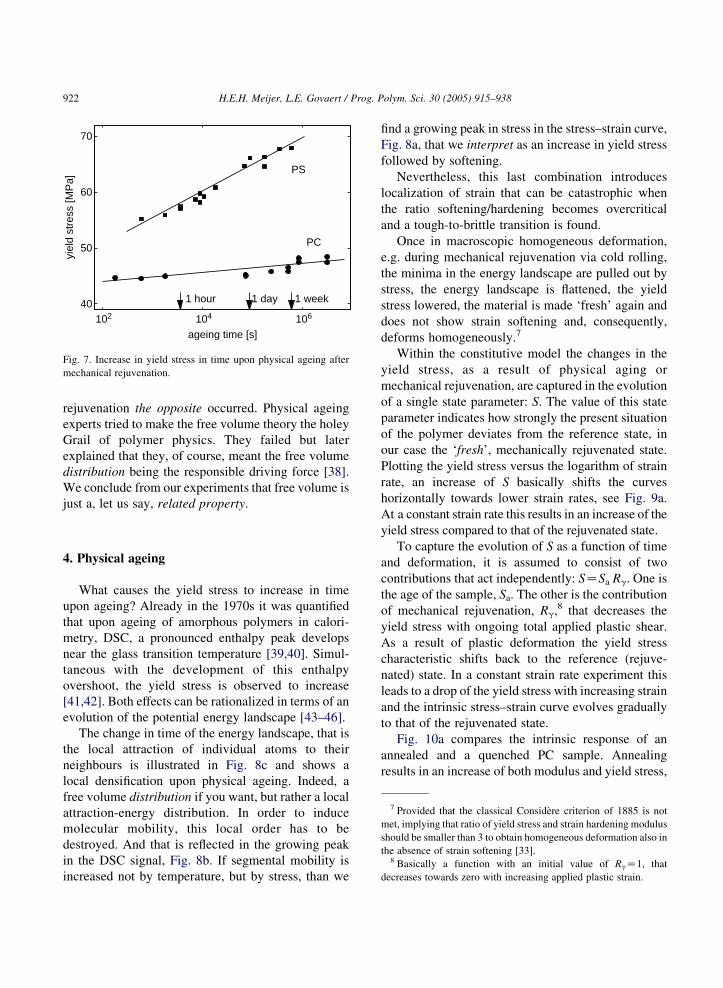
yield stress, though, does not remain and in time, ageing
time, it increases, leading to a return of softening and
thus the return of brittleness. For PS (with its low density
thus high free volume, low entanglement density, high
chain stiffness and thus high molecular weight between
entanglements of about 20.000), brittleness returns
within hours after rejuvenation and for PC (Mez2000)
it is a matter of months before necking is observed again,
see Fig. 7.
In classical free volume theories for ageing, an
increase in density is always accompanied with an
increase in yield stress. During mechanical
venated state (b and d) for PC (a and b) and PS (c and d) [33].
102 104 10640
50
60
70
PC
PS
1 hour 1 day 1 week
ageing time [s]
yiel
d st
ress
[MP
a]
Fig. 7. Increase in yield stress in time upon physical ageing after
mechanical rejuvenation.
H.E.H. Meijer, L.E. Govaert / Prog. Polym. Sci. 30 (2005) 915–938922
rejuvenation the opposite occurred. Physical ageing
experts tried to make the free volume theory the holey
Grail of polymer physics. They failed but later
explained that they, of course, meant the free volume
distribution being the responsible driving force [38].
We conclude from our experiments that free volume is
just a, let us say, related property.
7 Provided that the classical Considere criterion of 1885 is not
met, implying that ratio of yield stress and strain hardening modulus
should be smaller than 3 to obtain homogeneous deformation also in
the absence of strain softening [33].8 Basically a function with an initial value of RgZ1, that
decreases towards zero with increasing applied plastic strain.
4. Physical ageing
What causes the yield stress to increase in time
upon ageing? Already in the 1970s it was quantified
that upon ageing of amorphous polymers in calori-
metry, DSC, a pronounced enthalpy peak develops
near the glass transition temperature [39,40]. Simul-
taneous with the development of this enthalpy
overshoot, the yield stress is observed to increase
[41,42]. Both effects can be rationalized in terms of an
evolution of the potential energy landscape [43–46].
The change in time of the energy landscape, that is
the local attraction of individual atoms to their
neighbours is illustrated in Fig. 8c and shows a
local densification upon physical ageing. Indeed, a
free volume distribution if you want, but rather a local
attraction-energy distribution. In order to induce
molecular mobility, this local order has to be
destroyed. And that is reflected in the growing peak
in the DSC signal, Fig. 8b. If segmental mobility is
increased not by temperature, but by stress, than we
find a growing peak in stress in the stress–strain curve,
Fig. 8a, that we interpret as an increase in yield stress
followed by softening.
Nevertheless, this last combination introduces
localization of strain that can be catastrophic when
the ratio softening/hardening becomes overcritical
and a tough-to-brittle transition is found.
Once in macroscopic homogeneous deformation,
e.g. during mechanical rejuvenation via cold rolling,
the minima in the energy landscape are pulled out by
stress, the energy landscape is flattened, the yield
stress lowered, the material is made ‘fresh’ again and
does not show strain softening and, consequently,
deforms homogeneously.7
Within the constitutive model the changes in the
yield stress, as a result of physical aging or
mechanical rejuvenation, are captured in the evolution
of a single state parameter: S. The value of this state
parameter indicates how strongly the present situation
of the polymer deviates from the reference state, in
our case the ‘fresh’, mechanically rejuvenated state.
Plotting the yield stress versus the logarithm of strain
rate, an increase of S basically shifts the curves
horizontally towards lower strain rates, see Fig. 9a.
At a constant strain rate this results in an increase of the
yield stress compared to that of the rejuvenated state.
To capture the evolution of S as a function of time
and deformation, it is assumed to consist of two
contributions that act independently: SZSa Rg. One is
the age of the sample, Sa. The other is the contribution
of mechanical rejuvenation, Rg,8 that decreases the
yield stress with ongoing total applied plastic shear.
As a result of plastic deformation the yield stress
characteristic shifts back to the reference (rejuve-
nated) state. In a constant strain rate experiment this
leads to a drop of the yield stress with increasing strain
and the intrinsic stress–strain curve evolves gradually
to that of the rejuvenated state.
Fig. 10a compares the intrinsic response of an
annealed and a quenched PC sample. Annealing
results in an increase of both modulus and yield stress,

true strain
true
str
ess
ageing(a) (b)
(c)
temperature
Cp,
n
ageing
distance
ener
gy la
ndsc
ape
ageing
Fig. 8. Increase in yield stress (a) and DSC signal (b) in time upon physical ageing after mechanical rejuvenation and a sketch of the change in
energy landscape (c).
H.E.H. Meijer, L.E. Govaert / Prog. Polym. Sci. 30 (2005) 915–938 923
but upon plastic deformation the differences between
both curves disappear and they fully coincide at a
strain of approximately 0.3. All influence of thermal
history is erased at that strain and both samples are
transformed to the same mechanically rejuvenated
state.
From Fig. 10a it is clear that an increase of
yield stress, due to a thermal treatment, will
log(strain rate)
(a) (
yiel
d st
ress aged
rejuvenatedSa
Rγ
Fig. 9. Schematic representation of the influence of physical aging and s
Schematic representation of the intrinsic stress–strain curve indicating th
directly imply an increase in strain softening. The
influence of molecular weight on the intrinsic
response is usually small and negligible [29,47],
which makes thermal history the key factor in
influencing the intrinsic properties of a specific
polymer glass.
The influence of progressive physical aging is
included through a time-dependent evolution of the
b)
true strain
true
str
ess
aged
rejuvenated
Sa
train softening on the strain rate dependence of the yield stress (a).
e influence of physical aging and strain softening (b).

0 0.25 0.5 0.75 10
40
80
120(a) (b)
prior thermalhistory
true strain [–]
true
str
ess
[MP
a]
log(time)
Sa
processing related
servicerelated
ta
Fig. 10. True stress–strain curves for polycarbonate with two different initial states (quenched and annealed) (a). Schematic representation of the
evolution of Sa for different initial states (b).
H.E.H. Meijer, L.E. Govaert / Prog. Polym. Sci. 30 (2005) 915–938924
parameter Sa, schematically represented in Fig. 10b.
We proposed that the parameter Sa displays a
logarithmic evolution in time9 (see Table 1). The
influence of temperature and applied stress are
modeled in an effective time approach [29]. For
samples with an arbitrary (unknown) thermal history,
the determination of the yield stress at a single strain
rate is already sufficient to obtain the initial value of Sa
and thus to obtain a full, quantitative constitutive
description of the material.
5. From intrinsic behavior to macroscopic
response
The differences between the tough PC and brittle
PS are reflected in their intrinsic behavior, see Fig. 5a.
The main differences are that in PS the strain
softening is more pronounced, while the strain
hardening is (much) less. The last is directly related
to the entanglement density of PS that is, with an
entanglement molecular weight Me of 20.000 versus
2000 for PC, extremely low. If we just change this
entanglement density of PS, simply by mixing with
poly-phenylene-ether, PPE (with Me of 5000), we can
increase strain hardening [48] and change the
mechanical behavior of PS into that of PC, see Fig. 11.
9 It should be noted that the ageing sensitivity of the yield stress of
a polymer is not solely determined by the rate of change of the state
parameter Sa (the shift along the strain rate axis), but also by the
slope of yield stress versus the logarithm of strain rate.
A more precise investigation on the influence of the
intrinsic behavior of polymeric materials on their
resulting macroscopic response can now be performed.
We start with PC and use a cylindrical test bar, thus
allowing for a 2D calculation, with a standard tensile bar
shape. Upon loading, we plot the true stress in the mid
plane of the bar on different axial positions, see Fig. 12
that shows in cross-section a quarter of the test bar. We
conclude that softening after yield results in localization
via neck formation, but that the strain hardening in PC is
sufficient to make the neck run trough the whole sample,
until the diameter increase at the clamping position is
reached and the stress in the sample increases until
breakage occurs. Next, we compare the intrinsic, true
stress–true strain, behavior with the macroscopic
engineering stress-engineering strain curve as mon-
itored during testing, see Fig. 13. Fig. 13a plots the stress
in the mid plane of the tensile bar where the neck is
formed (because we introduced, like in the simulation of
Fig. 12, a small imperfection there). In Fig. 13b, the
macroscopic, so called stress–strain curve, is plotted as
measured on the clamping side of the test bar, see the
legend in Fig. 13. We recognize that as soon as yield is
past in the intrinsic behavior of Fig. 13a, softening
induces a decrease in stress which is reflected as a strong
decrease in the engineering stress in the macroscopic
part, Fig. 13b. When the neck runs through the
macroscopic sample, realized by the intrinsic strain
hardening, see Fig. 12, the true stress within the neck
remains constant. The length of the plateau found in the
macroscopic response of Fig. 13b depends on the
sample’s geometry, especially the length of the test bar,
and thus should never be considered to reflect strain! If

Table 1
A single-mode 3D, non-isothermal constitutive equation for polymer solids, for explanation and details please download the thesis [29]
sZssCsr hð �t;T ; p; SÞZh0;rðTÞ�t=t0
sinhð �t=t0Þexp mp
to
� �expðSðt; �grÞÞ
ss ZKðJK1ÞICG ~Bde ho;rðTÞZh0;r;ref$exp
DUy
R1T
K 1Tref
� �h i; t0 Z kT
V�y
sr ZGr~B
d Sðteffðt; T ; �tÞ; �gpÞZSaðteffðt; T ; �tÞÞ$Rgð �gpÞ
_JZJ trðDÞ Rgð �gpÞZ ð1C ðr0$expð �gpÞÞr1 Þ
r2K1
r1 =ð1Cr0r1 Þ
r2K1
r1
~Bo
e Z ðDd KDpÞ ~Be C ~BeðDd KDpÞ
Saðteffðt; T ; �tÞÞZc0 Cc1$logðteffðt;T ; �tÞC taÞ
Dp Z sds
2hð �t;T ;p;SÞ teff ZÐt0
aK1T ðTðt 0ÞÞaK1
s ð �tðt 0ÞÞdt 0
�tZffiffiffiffiffiffiffiffiffiffiffiffiffiffiffiffiffiffiffiffiffiffiffi12
trðsds $sd
s Þq
aT ðTÞZexp DUa
R1T
K 1Tref
� �h i
�gp Zffiffiffiffiffiffiffiffiffiffiffiffiffiffiffiffiffiffiffiffiffiffiffiffiffi2$trðDp$DpÞ
pasð �tÞZ
�t=ta
sinhð �t=taÞ; ta Z kT
V�a
H.E.H. Meijer, L.E. Govaert / Prog. Polym. Sci. 30 (2005) 915–938 925
the neck reaches the clamps, the stress starts to
increase until breakage occurs in the thinnest section
of the bar.
Performing the same analysis on PS, see Fig. 14, we
directly recognize that the strain hardening is not
sufficient to delocalize the region of the neck. This
remains the case even if we do not stop the intrinsic
behavior curve but continue to infinity, leading also to
infinite stresses within the fibril formed. Even then the
deformation remains localized, since the force
(the product of the stress times the fibrils cross-section)
that the fibril can exert on the remainder of the test bar is
insufficient. The stress can go to infinite, the cross-
section goes faster to zero. The conclusion is that PS is
basically too easy to flow, too ductile to be tough
(knowing that toughness is equivalent to delocalization
of strain). We now can understand that the arrow in
Fig. 1b on the right-hand side can only run in one
0 1 2 3 40
50
100
150
200(a) (b)
80/20
60/40
20/8040/60
λ2 - 1/λ [–]
true
str
ess
[MP
a]
eng.
str
ess
[MP
a]
Fig. 11. Norylw PS–PPE blends in compr
direction: from intrinsic to macroscopic and it illustrates
the difficulty of interpreting macroscopic tests.
6. Life time prediction
With the single state parameter SZSaRg we were
able to predict the polymer’s situation from the cradle
to the grave. In order to demonstrate this, both the
long-term behavior of polymers during static and
dynamic loading is investigated as well as the
influence of the processing conditions during the
formation of the polymer on the development of S and
thus on the yield stress. Before starting the long-term
loading experiments, the polymer’s age is first
determined by a single tensile test to find its yield
stress which was converted into the present value of
S. Next, long-term loading tests are performed under
1 1.05 1.1 1.15 1.2 1.250
25
50
75
100
80/20
60/40
20/8040/60
λ [–]
ession (a), and tensile loading (b).

Fig. 12. Tensile testing of PC. After neck formation at yield strain softening sets in, the stress in the remaining part of the test bar decreases
substantially due to unloading because of strain localization in the neck. Subsequently, strain hardening occurs in he neck, accompanied by an
increase in stress and the neck starts to extend to the whole test bar.
H.E.H. Meijer, L.E. Govaert / Prog. Polym. Sci. 30 (2005) 915–938926
different values of the (constant) stress applied, until
creep rupture occurs; see the symbols in Fig. 15a.
Then simulations are performed, the line in
Fig. 15a. Because stress-enhanced physical ageing
during the tests is incorporated in the simulations,
also the endurance limit can be predicted [49].
Remarkable is the accuracy of the predictions that
did not use any adjustable parameter. Similar
comments can be made on the fatigue loading
results, see Fig. 15b.
That was the grave, so how about the cradle? Using
a simple rectangular mould and a mould-filling and
cooling analysis (Moldflow), the place and thickness
dependent thermal history can be computed every-
where in the mould, see Fig. 16a. Subsequently, it is
assumed that the evolution of yield stress, during
cooling from the melt to below Tg, is governed by the
same evolution kinetics of the state parameter S, as
observed during progressive aging, Fig. 10b. This
enables us to translate the (local) thermal histories to
(local) values of the state parameter S and, with that,
predict the distribution of yield stress over the sample
[50], see Fig. 16b. As shown in Fig. 16c, the
distribution of yield stress depends strongly on the
mould temperature, that apart from the sample
thickness is the key parameter determining the local
cooling rate.
In Fig. 16d, the predictions are compared with
experiments using different mould temperatures. The
computed average yield stresses compare amazingly
well with the experimentally determined values, the
symbols in Fig. 16b. An extension of this results by
modeling polymers other than PC, such as e.g. PS,
PVC and later HDPE, is of our present research

Fig. 13. Tensile testing of PC. From intrinsic to macroscopic behavior. We plot the true stress in the middle of the test bar (the neck, left) as a
function of the local strain, (a), and the resulting engineering stress, which is the tensile force measured right at the clamping side over the initial
cross-section of the test bar, versus engineering strain, defined as the length of the test bar over the original length, see (b), at six different stages
of the test.
H.E.H. Meijer, L.E. Govaert / Prog. Polym. Sci. 30 (2005) 915–938 927
interest. Motivation is that this results clearly opens
the possibility to predict a polymer’s life time
performance without performing a single mechanical
test.
10 At the occasion of the 50th anniversary celebration of the
Journal of Polymer Science, the editors selected Henkee and
Kramer’s original break-through paper of 1984 [53] to be reprinted
in 1996. It is still today interesting to read Ed Kramer’s (and also
Hugh Brown’s) reflection written on this occasion [54]. Please taste
the following sentence: ‘Even today the idea that a linear
viscoelastic measurement of the rubbery plateau modulus in the
melt could elucidate the large strain plastic deformation behavior of
the glass seems nothing short of miraculous; but there were
certainly many hints in previous work that entanglements were
important for both deformation and fracture’.
7. Craze initiation
Although interesting so far, the polymer story is
not finished yet with the results obtained on the
intrinsic behavior that can reversibly at wish be
altered by physical ageing and mechanical rejuve-
nation. Neither are we finished after the quantifi-
cation of the polymers response, using advanced
constitutive equations that capture the physics
appropriately and allow us to predict the polymer’s
future in dependence of its past given the transient
stress and temperature profiles it will experience
during use. First reason to continue the analysis is
that if we scratch, e.g. bullet proof PC, upon
impacting the material breaks brittle via crazing.
Moreover, we also want to improve on brittle
polymers like PS, to prevent them from crazing and
introduce shear yielding. Crazing has been studied
in great detail by a large number of experts from
which Ed Kramer in Cornell, Itaca (now in Santa
Barbara) was, without any doubt, the most original
one.10 He designed beautiful experiments and
developed now well-established theories [51–59].
His general starting picture is that, after plastic
flow, a craze develops via the initiation of a cavity,
the growth of instabilities and finally
the coalescence of holes. In order to tackle the
problem here in a simple way, we will focus on
the initiation of the first hole in the material, underneath
a scratch or a surface defect. For that we need a craze-
initiation criterion and to identify that we performed
micro-indentation tests with a sphere of 250 mm pushed
into the surface of quenched and annealed PS samples
using different normal loads [60]. After the experiments

Fig. 14. Tensile testing of PS. After neck formation at yield strain softening sets in, the stress in the remaining part of the test bar decreases
substantially due to unloading because of strain localization in the neck. Subsequently, strain hardening occurs in he neck, but it is insufficiently
pronounced. Localization remains in the neck, until fibril failure there occurs.
H.E.H. Meijer, L.E. Govaert / Prog. Polym. Sci. 30 (2005) 915–938928
we counted the number of (radial) crazes that were
caused by indentation as a function of the load applied.
Extrapolating to zero crazes yielded critical normal
forces of ca. 1.5 and 2.5 N, respectively. Performing
101 103 105 107 10930
50
70
90(a) (b
time-to-failure [s]
appl
ied
stre
ss [M
Pa]
annealedquenched
Fig. 15. Life time prediction of PC during creep loading (a) and fatigue
model predictions without any adjustable parameter [49].
numerical simulations of the same tests, using the
advanced constitutive equations developed, we
computed the maximum values of the maximum
hydrostatic stress, somewhere in the sample, during
)
101 102 103 104 10545
50
55
60
65
time-to-failure [s]@1 Hz
appl
ied
mea
n st
ress
[MP
a] annealedquenched
loading (b) with symbols the experimental results and full lines the

0 5 10 15 20 25 30100
150
200
250
300(a) (b)
(c)(d)
time [s]
tem
pera
ture
[°C
]
from surfaceto center
0 0.25 0.5 0.75 1
55
60
65
70
center surface
normalized thickness [–]
yiel
d st
ress
[MP
a]
25
30
35
Sa
[–]
0 0.25 0.5 0.75 1
50
60
70
center surface
normalized thickness [–]
yiel
d st
ress
[MP
a]
50°C
80°C
100°C110°C120°C130°C
20 40 60 80 100 120 14055
60
65
70
75
Tg
150°C155°C
150°C155°C
mould temperature [°C]
yiel
d st
ress
[MP
a]
4mm1mmmodel predictions
25
30
35
40
Sa
[–]
Fig. 16. Thermal history within a simple rectangular mould (a) and resulting calculated yield stress (b) and comparison of the averaged
calculated and experimental yield stress as a function of mould temperature used during injection moulding (c and d).
H.E.H. Meijer, L.E. Govaert / Prog. Polym. Sci. 30 (2005) 915–938 929
loading as function of the normal force applied, see
Fig. 17a. For both, the quenched and annealed
samples, this leads to the same critical value for the
hydrostatic stress for PS of 40 MPa, above which a
cavity will form that will lead to the first craze.
Performing the same test for different amorphous
polymers, characterized by their entanglement density
new1/Me, resulted in a semi-log relation giving, e.g.
for PC a critical value of 90 MPa, see Fig. 17b.
Using these critical values, finite element simu-
lations can be performed on notched tensile bars, with
a small defect under the notch representing the fresh
cut of a quenched razor knife, see Fig. 18a.
Similar to the analysis of the micro-indentation
tests, we can compute the maximum hydrostatic
stress, somewhere in the sample, during loading. We
find cavity formation and thus craze initiation in PS
under the defect at low macroscopic strains [61], see
Fig. 18b, while PC survives this problem but exceeds
the critical hydrostatic stress of 90 MPa under the
notch at a macroscopic strain of ca. 1%, see Fig. 18c.
It is because of these problems that polymers need to
be made heterogeneous, e.g. by rubber modification.
What the heterogeneity (soft inclusions into the glassy
matrix) typically should taken care of is to prevent the
critical distance to occur everywhere in the glassy
matrix, such that the tri-axial stress state can not exist,
thus crazing can not start. The typical distance in PS is
very small, see Fig. 18b, and is given by the distance
from the surface to the place where the maximum
hydrostatic stress is found. Although FEM calcu-
lations bear no absolute dimensions, Robert Smit took
experiments as his starting point in modeling and
based thereupon, this distance could be very roughly
estimated using the amplitude of the defect, to be /1 mm, while for PC the critical distance could be

0 1 2 3 40
10
20
30
40
50annealed
quenched
load [N]
max
. hyd
r. s
tres
s [M
Pa]
100 101 10225
50
75
100(b)(a)
PS
PS/PPE
PC
network density [1025 m–3]
criti
cal h
ydr.
str
ess
[MP
a]
Fig. 17. Maximum hydrostatic stress in the sample during micro-indentation for quenched and annealed PS (a) and entanglement density
dependence of the critical value of this stress (b).
H.E.H. Meijer, L.E. Govaert / Prog. Polym. Sci. 30 (2005) 915–938930
estimated using the curvature of the notch to be /200 mm [61].
8. Heterogeneous systems
So, although critical distances apparently differ for
different polymers, characterized by the ratio of strain
hardening and strain softening after yield, the need for
heterogeneity is universal and its role is to prevent the
first cavity of the first craze to start to grow. Although
in practice usually rubber is used as impact modifier,
we will start the analysis with a zero modulus rubber,
holes, that should prevent the critical triaxial stress state
to occur. The problems met in analyzing heterogeneous
Fig. 18. Meshed notched tensile bar with defect under the notch (a). Resulti
stress of 40 MPa is reach for PS underneath the defect already at low macr
sensitivity, the critical hydrostatic stress of 90 MPa is reached below the
polymer systems were threefold: (i) the complex
behavior of the constituents, (ii) the complex geometry
of the microstructure, and (iii) the unknown relation
between micro events and macroscopic behavior. The
first problem was solved after the development of
reliable 3D quantitative constitutive equations, see
Table 1, the second problem by using FEM, finite
element methods, and for the last problem we developed
the MLFEM, multi-level finite element model [62–66].
Basically, MLFEM uses a FEM analysis of the
macroscopic structure and goes one level down in
every integration point of every finite element. The local
displacements in these integration points are enforced
on the edges of bi-periodic RVE’s, representative
volume elements, see Fig. 19.
ng stress profiles during loading, showing that the critical hydrostatic
oscopic strains of !0.2% (b) while for PC, that survives the defect
notch at a macroscopic strain of ca. 1% (c) [61].

Fig. 19. Loading representative volume elements, RVE’s, of PC (a) and PS (b). Gray is below yield, black represents places that are plastically
deformed [64].
H.E.H. Meijer, L.E. Govaert / Prog. Polym. Sci. 30 (2005) 915–938 931
The RVE’s are meshed and loaded, after which the
average RVE stress is computed and brought back to
the highest FEM level, to solve the balance equations.
The procedure repeats, until equilibrium is reached.
Then the next incremental strain step is applied. In
this way we use the RVE analysis as a non-closed
form of a constitutive equation for the complex
microstructure. Besides, a local check inside every
RVE on local failure is possible [87]. Fig. 19
compares the RVE responses of PC, Fig. 19a, and
PS, Fig. 19b, discriminating between elastically
loaded and plastically deformed regions. Of course
already at extremely low macroscopic strains,
localizations set in, there where two holes are
accidentally close such that a stress concentration
exists. The material starts to locally flow. In contrast
to PC, that eventually spreads plastic deformation
over the total RVE, in PS it still localizes in bands
perpendicular to the loading direction, Fig. 19b.
Reason is the lack of strain hardening in PS, given
its low entanglement density ne or high molecular
weight between entanglements Me, caused by its large
chain stiffness. As in Fig. 14, we again can conclude
via this RVE-analysis that PS is indeed too ductile to
be tough. The thin filaments formed are not able to
transfer load and strain keeps localized until the fibrils
break. The consequences of this RVE response are
clearly found on the macro-level when applying
MLFEM, see Fig. 20.
PC that homogeneously hits the 90 MPa hydro-
static stress criterion at low macroscopic strains,
Fig. 20b, is completely tough in the heterogeneous
case, Fig. 20d. In Fig. 20, 30% voids were used, but
also 5% voids prove to be sufficient for PC [65]. This
illustrates that it is quite easy to toughen PC. PS on the
contrary hits in its homogeneous state the 40 MPa
criterion already at very low strains, Fig. 20a, but only
slightly improves when made heterogeneous,
Fig. 20c. Although clearly improved and comparable
with plain PC, the deformation still localizes in a band
perpendicular to the drawing direction and eventually
the filaments in the RVE will break, see also Fig. 19b.
9. Optimal toughness modifier
Apparently for too ductile, too easy to flow,
polymers like PS, we need to do a little bit more. In
order to increase strain hardening, since that is what
we need, we can introduce a smaller Me by mixing PS
with PPE, which is the miscible Norylw blend of GEP
see Fig. 11, or alternatively chemically crosslinked PS
[53].
A more practical way is to let a rubber shell
locally support the straining filaments, not changing
the PS properties, but changing the local structure
properties to make it more strain-hardening, see
Fig. 21. This now seems to be successful. PS is

Fig. 20. MLFEM results on loading a notched, scratched tensile bar
of homogeneous and heterogeneous (30% voids) PC (b and d), and
PS (a and c). Strain localizations and delocalizations are shown,
explaining the toughness of these two extreme polymers [65].
Fig. 21. MLFEM results on loading a notched, scratched tensile bar
of homogeneous (a) and heterogeneous PS with 30% voids (b) or
with 30% precavitated rubber particles supporting the filaments (c).
Only in the last case delocalization of strain is found and toughness
is obtained [65].
H.E.H. Meijer, L.E. Govaert / Prog. Polym. Sci. 30 (2005) 915–938932
tough. During loading we did not meet a failure
criterion and it was only since we had to remesh on
the RVE level that we had to stop the computation.
The idea of precavitation of the rubber particles is
based on the fact that we do not want to rely on
the in situ cavitating capabilities of the rubbery
particles during impact loading under low tempera-
tures [67–72]. The last two conditions basically
increase the glass transition temperature of the
rubber, making it more and more difficult to cavitate,
which is necessary to prevent the occurrence of too
high tri-axial stresses. (If we let the material self
decide where to cavitate, it will form one localized
craze in the plane perpendicular to the loading
direction, making the polymer brittle.) Besides low
temperatures and high deformation rates, we more-
over want to apply extremely small particles of
the impact modifiers used, despite that they are
difficult to cavitate. Reason is that we than need less
rubber, so modulus and yield stress remain high, but
also that we still can keep optical clarity. An
illustrative example is found in Fig. 22 where for
an in situ copolymerized PMMA–aliphatic epoxy
system (80–20) with 30 nm dispersed phase, impact
toughness is found, only after precavitating the
samples at low deformation rates [73–76].
A second example of precavitating rubber
inclusions can be found in Clive Bucknalls work,
using thermal contraction tests where he supercooled
heterogeneous polymer systems for sufficiently long
times to induce rubber cavitation [77,78]. As a result,
experiments and simulations suggest that the universal
optimal impact modifier is a 3000–300–30–3 system
with in a matrix of 3000 MPa (all amorphous

Fig. 22. In situ X ray experiments on a PMMA–aliphatic epoxy system during slow and fast loading [75].
H.E.H. Meijer, L.E. Govaert / Prog. Polym. Sci. 30 (2005) 915–938 933
polymers) we add a 30 nm dispersion of a precavitated
core-shell rubber with a shell with a pretty high rubber
modulus of 300 MPa and a core that should be a hole,
so with a modulus /3 MPa. We tried to make these
structures via a CIPS process, chemically induced
phase separation, making use of a self-organizing
process in diblock copolymers [79–82]. Nanostruc-
tures were induced and in PS/PBA–PEB 75-25 blends
with poly-butylacrylate as a rubber shell and poly-
ethylene-(co)butylene as the liquid core, a change from
crazing to cavitation-induced shear yielding was found
[79,80] while the macroscopic strain of the triblock
system PMMA–PBA–PEB proved to increase to 140%
[81]. Using a crystallizable polymer as a core, also
cavitation can be obtained as was proven by the system
PS–PB–PCL, where polybutene was the shell of the
dispersed phase and polycaprolacton the crystallizing
core [82]. In all cases, we still needed a too large
amount of impact modifier. The first one to prove that
an optimal impact modifier indeed can be realized was
Christian Koulic from Jerome’s Liege group [83–86]
who found that cucumber-type of structures of PS-PIP
in PA, with a size of around 50 nm, gave maximum
toughness with only 4% rubber added, see Fig. 23.
10. Brittle-to-tough transitions
Finally, if we apply the craze initiation criterion
used in Sections 6–8, on the deformation of
heterogeneous systems, we can find both a
temperature induced brittle-to-tough transition, see
Fig. 24a, as well as a critical interparticle distance
induced transition, see Fig. 24b [87].
The critical interparticle distance originates
from the fact that the Tg of a polymer decreases
at a surface (and increases at a solid interface)
over a depth of 100 nm [88–91]. As a conse-
quence, Tg is at room temperature at the surface
and reaches its bulk value only at 100 nm. As a
result, the near-surface mechanical properties are
different from that in the bulk [92]. This now
gives an absolute scale in the microstructure, but
also in the finite element calculations, where we
replace a change in Tg by a change in
temperature from the surface into the bulk,
gradually changing over the same 100 nm. The
size of the (constant volume fraction) dispersed
phase now determines whether or not this layer
of lower Tg, thus lower yield stress sy percolates

Fig. 23. Rubber toughened polyamide demonstrating the existence of the optimal impact modifier [83–86].
H.E.H. Meijer, L.E. Govaert / Prog. Polym. Sci. 30 (2005) 915–938934
through the RVE yes or no, thereby determining
toughness.
11. Conclusions
The major conclusions to be drawn are that (i)
toughness is equivalent to delocalization of strain, (ii)
the two types of bonds present make all polymers
intrinsically tough, (iii) polystyrene is too ductile to be
Fig. 24. B–T transitions for heterogeneous PS as a function of te
tough (but supporting shells increase strain hardening
of the local structure), (iv) proper constitutive
modeling enables to quantitatively describe polymer
responses, including the effects of temperature, strain
rate, and time (ageing), (v) an independent craze
initiation criterion must be added in order to
numerically predict failure and this criterion can be
experimentally determined by using indentation tests,
(vi) all polymers must be made heterogeneous in order
to circumvent defect or notch sensitivity, (vii)
mperature (a), and critical interparticle distance (b) [87].

Fig. 25. Extension ratio in crazes and deformation zones (DZ’s) as a function of network density n (w1/Me) in (un)crosslinked PS films (a).
Similar plot for different polymers (PPO is the somewhat confusing old notation for poly-phenylene-ether, PPE) (b). Reproduced with
permission from [53].
H.E.H. Meijer, L.E. Govaert / Prog. Polym. Sci. 30 (2005) 915–938 935
modeling suggests that the ultimate toughness
modifier is a 3–30–300–3000 pre-cavitated core-
shell rubber with core /3 MPa modulus, 30 nm
diameter, shell 300 MPa modulus in a matrix of
3000 MPa, and finally (viii) modeling suggests the
presence of both a temperature induced as well as a
critical interparticle distance induced brittle-to-tough
transition in polymeric materials.
How do the present analyses cope with the
previously empirically determined relation between
chain stiffness and molecular weight between entan-
glements [93,94] and its relation with drawability and
the transition from crazing to shear yielding [53–59],
see Fig. 25.
The answer is straightforward. On the one hand,
the strain hardening modulus proves to be directly
related to Me, while a larger modulus gives less strain
softening thus less localization changing the defor-
mation behavior from crazing to shear yielding, see
Figs. 11–14. On the other hand, there exists a relation
between the critical stress for craze initiation and Me,
see Fig. 17b, making the higher entangled polymers
less sensitive for scratches and easier to rubber
modify, see Figs. 18–21.
Acknowledgements
This paper is based on a number of successive and
ongoing PhD studies in our group: Marco van der
Sanden (1993) on the concept of ultimate toughness,
Theo Tervoort (1996) on constitutive modeling, Peter
Timmermans (1997) on modeling of necking, Robert
Smit (1998) on the multi-level finite element method,
Bernd Jansen (1998) on microstructures for ultimate
toughness, Harold van Melick (2002) on quantitative
modeling, Bernard Schrauwen (2003) on semi-
crystalline polymers, Hans van Dommelen (2003)
on multi-scale semi-crystalline, Ilse van Casteren
(2003) on nanostructures for ultimate toughness,
Edwin Klompen (2005) on long-term prediction,
Jules Kierkels (2006) on toughness in films, Roel
Janssen (2006) on creep rupture and fatigue, and Tom
Engels (2007) on coupling of processing with proper-
ties. Theses are downloadable from (please select by
year) http://www.mate.tue.nl/mate/publications/
index.php/4. The research was sponsored by the
Dutch Polymer Insitute, DPI, the national science
foundation, STW, and the university, TU/e.
References
[1] G’Sell C, Jonas JJ. Yield and transient effects during the
plastic deformation of solid polymers. J Mater Sci 1981;16(7):
1956–74.
[2] G’Sell C, Hiver JM, Dahoun A, Souahi A. Video-controlled
tensile testing of polymers and metals beyond the necking
point. J Mater Sci 1992;27(18):5031–9.
[3] Arruda EM, Boyce MC. Evolution of plastic anisotropy in
amorphous polymers during finite straining. Int J Plast 1993;
9(6):697–720.

H.E.H. Meijer, L.E. Govaert / Prog. Polym. Sci. 30 (2005) 915–938936
[4] Boyce MC, Arruda EM, Jayachandran R. The large strain
compression, tension, and simple shear of polycarbonate.
Polym Eng Sci 1994;34(9):716–25.
[5] McLeish TCB, Milner ST. Entangled dynamics and melt flow
of branched polymers. Adv Polym Sci 1999;143(Branched
Polymers II):195–256.
[6] Read DJ, McLeish TCB. Molecular rheology and statistics of
long chain branched metallocene-catalyzed polyolefins.
Macromolecules 2001;34(6):1928–45.
[7] Swartjes FHM, Peters GWM, Rastogi S, Meijer HEH. Stress
induced crystallization in elongational flow. Int Polym Proc
2003;18(1):53–66.
[8] Tervoort TA, Visjager JF, Smith P. Melt-processable
poly(tetrafluoroethylene)-compounding, fillers and dyes.
J Fluorine Chem 2002;114(2):133–7.
[9] Tervoort TA, Visjager JF, Graf B, Smith P. Melt-processable
poly(tetrafluoroethylene). Macromolecules 2000;33(17):
6460–5.
[10] Tervoort TA, Visjager JF, Smith P. On abrasive wear of
polyethylene. Macromolecules 2002;35(22):8467–71.
[11] Smith P, Lemstra PJ, Kalb B, Pennings AJ. Ultrahigh-strength
polyethylene filaments by solution spinning and hot drawing.
Polym Bull 1979;1(11):733–6.
[12] Smith P, Lemstra PJ. Ultrahigh-strength polyethylene fila-
ments by solution spinning/drawing. 2. Influence of solvent on
the drawability. Makromolekulare Chemie 1979;180(12):
2983–6.
[13] Smith P, Lemstra PJ. Ultrahigh strength polyethylene
filaments by solution spinning/drawing. 3. Influence of
drawing temperature. Polymer 1980;21(11):1341–3.
[14] Kwolek SL, US Patent 3671 542; 1972.
[15] Yang HH. Aromatic high-strength fibers. New York: Wiley;
1989.
[16] Gordon JE. Structures, or why things don’t fall down.: Da
Capo Press; 1978 p. 74.
[17] Clyne TW, Phillipps AJ. Interfacial control and macroscopic
failure in long-fiber-reinforced and laminated inorganic
composites. Comp Sci Tech 1994;51(2):271–82.
[18] Smith BL, Schaffer TE, Viani M, Thompson JB,
Frederick NA, Kind J, et al. Molecular mechanistic origin of
the toughness of natural adhesives, fibers and composites.
Nature 1999;399(6738):761–3.
[19] Wang RZ, Suo Z, Evans AG, Yao N, Aksay IA. Deformation
mechanisms in nacre. J Mater Res 2001;16(9):2485–93.
[20] Haward RN, Thackray G. Use of a mathematical model to
describe isothermal stress-strain curves in glassy thermo-
plastics. Proc R Soc London Ser A 1967;302(1471):453–72.
[21] Govaert LE. Bob Haward, a chemist on the quest for strength.
J Polym Sci Part B 2004;42(11):iii–iiv.
[22] Boyce MC, Parks DM, Argon AS. Mech Mater 1988;7:
15–33.
[23] Hasan OA, Boyce MC. A constitutive model for the nonlinear
viscoelastic viscoplastic behaviour of glassy polymers. Polym
Eng Sci 1995;35:331–44.
[24] Buckley CP, Jones DC. Glass-rubber constitutive model for
amorphous polymers near the glass transition. Polymer 1995;
36:3301–12.
[25] Dooling PJ, Buckley CP, Hinduja S. The onset of nonlinear
viscoelasticity in multiaxial creep of glassy polymers: a
constitutive model and its application to PMMA. Polym Eng
Sci 1998;38:892–904.
[26] Gerlach C, Buckley CP, Jones DP. Development of an
integrated approach to modelling of polymer film orientation
processes. Trans Inst Chem Eng Part A 1998;76:38–44.
[27] Tervoort TA, Klompen ETJ, Govaert LE. A multi-mode
approach to finite, three-dimensional, nonlinear viscoe-
lastic behaviour of polymer glasses. J Rheol 1996;40:
779–97.
[28] Govaert LE, Timmermans PHM, Brekelmans WAM. The
influence of intrinsic strain softening on strain localisation in
polycarbonate: modeling and experimental validation. J Eng
Mater Technol 2000;122:177–85.
[29] Klompen ETJ, Engels TAP, Govaert LE, Meijer HEH.
Modelling of the post-yield response of glassy polymers:
influence of thermomechanical history. Macromolecules 2005,
38(16):6997–7008.
[30] Loo LS, Cohen RE, Gleason KK. Chain mobility in the
amorphous region of nylon 6 observed under active uniaxial
deformation. Science 2000;288(5463):116–9.
[31] Capaldi FM, Boyce MC, Rutledge GC. Enhanced mobility
accompanies the active deformation of a glassy amorphous
polymer. Phys Rev Lett 2002;89(17):175505.
[32] Theodorou DN, Suter UW. Local structure and the mechanism
of response to elastic deformation in a glassy polymer.
Macromolecules 1986;19(2):379–87.
[33] van Melick HGH, Govaert LE, Meijer HEH. Localization
phenomena in glassy polymers: influence of thermal and
mechanical history. Polymer 2003;44(12):3579–91.
[34] McKenna GB. Mechanical rejuvenation in polymer glasses:
fact or fallacy? J Phys Cond Matter 2003;15(11):S737–S63.
[35] Tervoort TA, Govaert LE. Strain-hardening behavior of
polycarbonate in the glassy state. J Rheol 2000;44(6):
1263–77.
[36] Govaert LE, van Melick HGH, Meijer HEH. Temporary
toughening of polystyrene through mechanical pre-condition-
ing. Polymer 2001;42(3):1271–4.
[37] van Melick HGH, Govaert LE, Raas B, Nauta WJ,
Meijer HEH. Kinetics of ageing and re-embrittlement of
mechanically rejuvenated polystyrene. Polymer 2003;44(4):
1171–9.
[38] Struik LCE. Private communications.
[39] Hodge IM. Enthalpy relaxation and recovery in amorphous
materials. J Non-Cryst Solid 1994;169:211–66.
[40] Hutchinson JM. Physical aging of polymers. Prog Polym Sci
1995;20:703–60.
[41] Struik LCE. Physical ageing of amorphous polymers and other
materials. Amsterdam: Elsevier; 1978.
[42] Aref-Azar A, Biddlestone F, Hay JN, Haward RN. The effect
of physical ageing on the properties of poly(ethylene
terephthalate). Polymer 1983;24(10):1245–51.
[43] Utz M, Debenedetti PG, Stillinger FH. Atomistic simulation of
aging and rejuvenation in glasses. Phys Rev Lett 2000;84(7):
1471–4.

H.E.H. Meijer, L.E. Govaert / Prog. Polym. Sci. 30 (2005) 915–938 937
[44] Nandagopal M, Utz M. Thermal versus deformation-induced
relaxation in a glass-forming fluid. J Chem Phys 2003;
118(18):8373–7.
[45] Lei Y, Cummins K, Lacks DJ. First-principles enthalpy
landscape analysis of structural recovery in glasses. J Polym
Sci, Part B 2003;41(19):2302–6.
[46] Lacks DJ, Osborne MJ. Energy landscape picture of overaging
and rejuvenation in a sheared glass. Phys Rev Lett 2004;
93(25):255501/1–255501/4.
[47] Wu JJ, Buckley CP. Plastic deformation of glassy polystyrene:
A unified model of yield and the role of chain length. J Polym
Sci Part B 2004;42(11):2027–40.
[48] van Melick HGH, Govaert LE, Meijer HEH. On the origin of
strain hardening in glassy polymers. Polymer 2003;44(8):
2493–502.
[49] Klompen ETJ, Govaert LE, Engels TAP, van Breemen LCA,
Schreurs PJG, Meijer HEH. Quantitative prediction of long-
term failure in polycarbonate, Macromolecules 2005;38(16):
7009–17.
[50] Govaert LE, Engels TAP, Klompen ETJ, Peters GWM, Meijer
HEH. Processing induced properties of glassy polymers: yield
stress development in polycarbonate. Int Polym Proc 2005;
20(2):170–7.
[51] Kramer EJ. Microscopic and molecular fundamentals of
crazing. Adv Polym Sci 1983;52–53:1–56.
[52] Kramer EJ, Berger LL. Fundamental processes of craze
growth and fracture. Adv Polym Sci 1990;91/92:1–68
[Crazing Polym., Vol. 2].
[53] Henkee CS, Kramer EJ. Crazing and shear deformation in
crosslinked polystyrene. J Polym Sci, Polym Phys Ed 1996;
22(4):721–37. Reprinted from J Polym Sci, Part B
1996;34(17) 2825–41.
[54] Kramer EJ. Reflections on “Crazing and shear deformation in
crosslinked polystyrene,” by Chris S. Henkee, Edward J.
Kramer. J Polym Sci, Polym Phys Ed, 1984;22:721. Comment.
J Polym Sci, Part B 1996:34(17) 2821–22.
[55] Donald AM, Kramer EJ. The mechanism for craze-tip advance
in glassy polymers. Philos Mag A 1981;43(4):857–70.
[56] Donald AM, Kramer EJ. Plane stress deformation zones
at crack tips in polycarbonate. J Mater Sci 1981;16(11):
2967–76.
[57] Donald AM, Kramer EJ. Effect of molecular entanglements on
craze microstructure in glassy polymers. J Polym Sci, Polym
Phys Ed 1982;20(5):899–909.
[58] Donald AM, Kramer EJ. Deformation zones and entangle-
ments in glassy polymers. Polymer 1982;23(8):1183–8.
[59] Donald AM, Kramer EJ, Kambour RP. Interaction of crazes
with preexisting shear bands in glassy polymers. J Mater Sci
1982;17(6):1739–44.
[60] Van Melick HGH, Bressers OFJT, Den Toonder JMJ,
Govaert LE, Meijer HEH. A micro-indentation method for
probing the craze-initiation stress in glassy polymers. Polymer
2003;44(8):2481–91.
[61] Smit RJM, Brekelmans WAM, Meijer HEH. Predictive
modelling of the properties and toughness of polymeric
materials. Part I. Why is polystyrene brittle and polycarbonate
tough? J Mater Sci 2000;35(11):2855–67.
[62] Smit RJM, Brekelmans WAM, Meijer HEH. Prediction of the
mechanical behavior of nonlinear heterogeneous systems by
multilevel finite element modeling. Comput Methods Appl
Mech Eng 1998;155:181–92.
[63] Smit RJM, Brekelmans WAM, Meijer HEH. Prediction of the
large-strain mechanical response of heterogeneous polymer
systems: local and global deformation behavior of a
representative volume element of voided polycarbonate.
J Mech Phys Solid 1999;47(2):201–21.
[64] Smit RJM, Brekelmans WAM, Meijer HEH. Predictive
modelling of the properties and toughness of polymeric
materials. Part II. Effect of microstructural properties on the
macroscopic response of rubber-modified polymers. J Mater
Sci 2000;35(11):2869–79.
[65] Smit RJM, Brekelmans WAM, Meijer HEH. Predictive
modelling of the properties and toughness of polymeric
materials part III simultaneous prediction of micro- and
macrostructural deformation of rubber-modified polymers.
J Mater Sci 2000;35(11):2881–92.
[66] Meijer HEH, Govaert LE, Smit RJM. A multi-level finite
element method for modeling rubber-toughened amorphous
polymers. ACS Symp Ser 2000;759(Toughening of Plastics):
50–70.
[67] Bucknall CB, Karpodinis A, Zhang XC. A model for particle
cavitation in rubber-toughened plastics. J Mater Sci 1994;
29(13):3377–83.
[68] Ayre DS, Bucknall CB. Particle cavitation in rubber-
toughened PMMA: experimental testing of the energy-balance
criterion. Polymer 1998;39(20):4785–91.
[69] Lin CS, Ayre DS, Bucknall CB. A dynamic mechanical
technique for detecting rubber particle cavitation in toughened
plastics. J Mater Sci Lett 1998;17(8):669–71.
[70] Bucknall CB, Rizzieri R, Moore DR. Detection of incipient
rubber particle cavitation in toughened PMMA using dynamic
mechanical tests. Polymer 2000;41(11):4149–56.
[71] Lazzeri A, Bucknall CB. Recent developments in the
modeling of dilatational yielding in toughened plastics. ACS
Symp Ser 2000;759(Toughening of Plastics):14–35.
[72] Bucknall CB. Blends containing core-shell impact modifiers
part 1. Structure and tensile deformation mechanisms. Pure
Appl Chem 2001;73(6):897–912.
[73] Jansen BJP, Rastogi S, Meijer HEH, Lemstra PJ. Rubber-
modified glassy amorphous polymers prepared via chemically
induced phase separation. 1. Morphology development and
mechanical properties. Macromolecules 2001;34(12):
3998–4006.
[74] Jansen BJP, Rastogi S, Meijer HEH, Lemstra PJ. Rubber-
modified glassy amorphous polymers prepared via
chemically induced phase separation. 2. Mode of microscopic
deformation studied by in-situ small-angle X-ray scattering
during tensile deformation. Macromolecules 2001;34(12):
4007–18.
[75] Jansen BJP, Rastogi S, Meijer HEH, Lemstra PJ. Rubber-
modified glassy amorphous polymers prepared via chemically
induced phase separation. 3. Influence of the strain rate on the
microscopic deformation mechanism. Macromolecules 1999;
32(19):6283–9.
H.E.H. Meijer, L.E. Govaert / Prog. Polym. Sci. 30 (2005) 915–938938
[76] Jansen BJP, Rastogi S, Meijer HEH, Lemstra PJ. Rubber-
modified glassy amorphous polymers prepared via
chemically induced phase separation. 4. Comparison of
properties of semi- and full-IPNs, and copolymers of
acrylate-aliphatic epoxy systems. Macromolecules 1999;
32(19):6290–7.
[77] Bucknall CB, Ayre DS, Dijkstra DJ. Detection of rubber
particle cavitation in toughened plastics using thermal
contraction tests. Polymer 2000;41(15):5937–47.
[78] Bucknall CB, Rizzieri R, Moore DR. Detection of cavitation in
rubber phase of rubber toughened poly(methyl methacrylate)
using thermal contraction measurements. Plast Rub Comp
2001;30(4):183–9.
[79] Van Casteren IA, Van Trier RAM, Goossens JGP,
Meijer HEH, Lemstra PJ. The influence of hydrogen
bonding on the preparation and mechanical properties of PS-
diblock copolymer blends. J Polym Sci, Part B 2004;42(11):
2137–60.
[80] van Asselen OLJ, van Casteren IA, Goossens JGP,
Meijer HEH. Deformation behavior of triblock copoly-
mers based on polystyrene: an FT-IR spectroscopy
study. Macromol Symp 2004;205(Polymer Spec-
troscopy):85–94.
[81] Van Casteren IA. Control of microstructures to induce
ductility in brittle amorphous polymers. Dissertation Eindho-
ven University of Technology; 2003. p. 103–14 [chapter 6]
(download at http://www.mate.tue.nl/mate/pdfs/3220.pdf).
[82] Van Casteren IA. Control of microstructures to induce
ductility in brittle amorphous polymers. Dissertation Eindho-
ven University of Technology; 2003. p. 115–38 [chapter 7]
(download at http://www.mate.tue.nl/mate/pdfs/3220.pdf).
[83] Koulic C, Jerome R. Nanostructure PMMA: from lamellar
sheets to double-layered vesicles. Macromolecules 2004;
37(3):888–93.
[84] Koulic C, Jerome R. Nanostructured polyamide by reactive
blending. 1. Effect of the reactive diblock composition.
Macromolecules 2004;37(9):3459–69.
[85] Koulic C, Jerome R. Nanostructured polyamide by reactive
blending: 2. Transition from nanovesicles to cucumber-like
core-shell nano objects. Prog Colloid Polym Sci 2004;129:
70–5.
[86] Koulic C. Reactive blending as a tool towards nanostructured
polymers. Dissertation University of Liege; 2004. p. 85–96
[chapter 5].
[87] van Melick HGH, Govaert LE, Meijer HEH. Prediction of
brittle-to-ductile transitions in polystyrene. Polymer 2003;
44(2):457–65.
[88] Forrest JA, Mattsson j. Reductions of the glass transition
temperature in thin polymer films: probing the length
scale of cooperative dynamics. Phys Rev E 2000;61(1):
R53–R6.
[89] Long D, Sotta P. How the shift of the glass transition
temperature of thin polymer films depends on the adsorption
with the substrate Los Alamos National Laboratory, Preprint
Archive, Condensed Matter 2003:arXiv:cond-mat/0301100
2003 p. 1–33.
[90] Sotta P, Long D. The crossover from 2D to 3D percolation and
its relationship to glass transition in thin films. Theory and
numerical simulations Los Alamos National Laboratory,
Preprint Archive, Condensed Matter 2003:arXiv:cond-
mat/0301120 2003 p. 1–15.
[91] van Zanten JH, Wallace WE, Wu W-L. Effect of strongly
favorable substrate interactions on the thermal properties
of ultrathin polymer films. Phys Rev E 1996;53(3):
R2053–R6.
[92] van Melick HGH, van Dijken A, den Toonder JMJ,
Govaert LE, Meijer HEH. Near-surface mechanical properties
of amorphous polymers. Philos Mag A 2002;82(10):
2093–102.
[93] Wu S. Chain structure and entanglement. J Polym Sci, Part B
1989;27(4):723–41.
[94] Wu S. Chain structure, phase morphology, and toughness
relationships in polymers and blends. Polym Eng Sci 1990;
30(13):753–61.