mechanical design and hydrodynamic analysis of … design and hydrodynamic analysis of sieve trays...
TRANSCRIPT

Chemical Engineering and Processing 97 (2015) 55–65
Mechanical design and hydrodynamic analysis of sieve trays in adividing wall column for a hydrocarbon mixture
Mario Alberto Rodríguez-Ángelesa, Fernando Israel Gómez-Castrob,*,Juan Gabriel Segovia-Hernándezb, Agustín Ramón Uribe-Ramírezb
aUniversidad Tecnológica del Suroeste de Guanajuato, Departamento de Procesos Alimentarios, Carretera Valle-Huanímaro km 6.5, Valle de Santiago,Guanajuato 38400, MexicobUniversidad de Guanajuato, Campus Guanajuato, División de Ciencias Naturales y Exactas, Departamento de Ingeniería Química, Noria Alta s/n, Guanajuato,Guanajuato 36050, Mexico
A R T I C L E I N F O
Article history:Received 27 May 2015Received in revised form 17 August 2015Accepted 1 September 2015Available online 3 September 2015
Keywords:Dividing wall columnMechanical designHydrodynamicsCFD analysis
A B S T R A C T
Distillation is one of the most widely used separation processes, mainly because it allows obtainingproducts with high purities. However, it has high energy requirements due to its low thermodynamicefficiency. Among the alternatives to reduce these energy requirements, the dividing wall column (DWC)is one of the most promising technologies, also allowing savings in capital costs compared toconventional distillation sequences. Even so, there is only little information about the physical design ofdividing wall columns, and most of the recent developments on this area have been achieved by privateindustry. Moreover, most of the reported information is for packed columns. Nevertheless, the design ofdividing wall columns with trays is important for systems with high vapor loads. Thus, a strategy for themechanical design of sieve trays for the separation of a hydrocarbon mixture in a dividing wall column ispresented in this work. Furthermore, an operational analysis of the trays using Computational FluidDynamics (CFD) is reported. Designed trays are tested in terms of weir flooding, active zone flooding andflow regime. Reported strategy allows obtaining operational designs for the trays of the whole column.
ã 2015 Elsevier B.V. All rights reserved.
Contents lists available at ScienceDirect
Chemical Engineering and Processing:Process Intensification
journal homepa ge: www.elsev ier .com/locate /cep
1. Introduction
Distillation is the most widely used separation process forliquid mixtures in the chemical and petrochemical industries,mainly because it allows obtaining high purities for the desiredproducts. Nevertheless, due to its inherent low thermodynamicefficiency, it requires high amounts of external energy to performthe separation. Thus, in the last century the structure of distillationcolumns has been modified in order to reduce their energyrequirements and environmental impact.
Although modern distillation equipment, i.e. the thermallycoupled distillation columns [1] and dividing wall columns [2], wasproposed in the early 20th century, the existing methods ofanalysis and mathematical models were not robust enough for acomprehensive study on such systems. The development of thePetlyuk column [3] was a breakthrough, because it was the firstwork that analyzes in detail thermally coupled equipment.
* Corresponding author.E-mail addresses: [email protected], [email protected] (F.I. Gómez-Castro).
http://dx.doi.org/10.1016/j.cep.2015.09.0020255-2701/ã 2015 Elsevier B.V. All rights reserved.
It was not until 1985 that the interest in this technology grew,due to the design and construction of the first industrial DWC byBASF. A year earlier, a patent about a dividing wall column for theseparation of a quaternary mixture appeared [4]. However, in thatwork the complete design methodology of the column is notreported. In recent years, other thermally coupled alternativeshave appeared for the separation of quaternary mixtures [5,6].
There are many works dealing with the design of DWC’s, interms of calculating the number of stages and location of thedividing wall. Triantafyllou and Smith [7] proposed the use ofshort-cut methods, but Amminudin and Smith [8] established thatthe use of the Kirkbride equation to estimate the coupling stageswas inappropriate, and proposed a semi-rigorous method.Halvorsen and Skogestad [9] proposed the method of minimumvapor flow. Other design alternatives include the use of stochasticoptimization techniques [10,11] and the response surfacemethodology [12,13].
Other studies are focused on the calculation of the column size,with particular interest on the diameter of the trays. Shah andKokossis [14] proposed using the sizing procedures available in thecommercial simulator Aspen Plus as a good initial approach. Olujicet al. [15] proposed using the simulator developed at Delft

Nomenclature
Symbols usedDT (m)) tray diameterAT (m2) total areaAD (m2) downcomer areaAN (m2) net areaAB (m2) bubbling areaAh (m2) hole areaLw (m) weir lengthWdc (cm) downcomer widthLFP (m) flow-path lengthS (m) tray spacingdH (cm) hole diameterAf fractional hole areahw (cm) outlet weir heighthcl (cm) clearance under downcomert (cm) tray deck thicknessp (cm) hole pitchvliq max (m/s) maximum liquid velocityvgas max (m/s) maximum gas velocityDP (Pa) pressure drop
Fig. 1. Sections of the dividing wall column.
56 M.A. Rodríguez-Ángeles et al. / Chemical Engineering and Processing 97 (2015) 55–65
University of Technology for packed DWC’s. Rix and Olujic [16]proposed a calculation method to predict the pressure drop in thecolumn taking into account the column internals, such ascollectors and distributors. Hernandez et al. [17] described thedesign and pilot-scale implementation of a DWC with non-structured packing. Rangaiah et al. [18] proposed the use of acommercial simulator for the design of a three-product DWC,considering the sections of the DWC as separated columns. Later,Dejanovic et al. [19] established that the better way to design aDWC with trays is considering the column as a combination ofvarious columns and performing the hydraulic design followingthe method proposed by Stichlmair and Fair [20]. Some otherworks remark the importance of the DWC at industrial level, andpresent an overview of the advances on research for suchequipment [19,21].
Many design methodologies for DWC’s have been publishedover the last years; however, there is little information about thedesign of the internal components of such columns. Olujic et al.[22] report that the mechanical design of packing and/or trays canbe obtained through a combination of CFD techniques and semi-empirical equations, which has been proved as a good approach foralready constructed columns.
Different CFD studies have been reported for conventionaldistillation columns. Krishna et al. [23] and Van Baten and Krishna[24] simulated the hydrodynamics of a sieve tray using a three-dimensional mesh. They analyzed circular and rectangular trays,using a two-phase transient flow model. The authors studied thedistribution of velocity, the clear liquid height and the volumetricfraction of liquid. Trujillo et al. [25] modelled mass and heattransfer for the evaporation phenomenon. They report the use ofdifferent turbulence models, concluding that the k–e RNG modelrepresents such systems in a better way. Wang et al. [26] simulatedthe liquid flow and mass transfer for a system air–water in acolumn with trays. Wang and Wang [27] studied the mass transferin bubbling columns using CFD-PBM techniques. Sun et al. [28]analyzed the distillation process using a simplified c2-ec masstransfer model and a k–e turbulence model. Noriler et al. [29]developed a CFD model using a eulerian–eulerian approach topredict momentum and heat transfer for a multiphase flow. Rahimi
et al. [30] analyzed, using CFD, the effect of the hole and bubble sizein the effectivity of the tray, validating their results with the datareported by Dribika and Bidduph [31]. Finally, Zarei et al. [32]evaluated the weep point for columns with sieve trays, usingrectangular and circular geometries.
It can be seen that, over the last decades, there have been manyadvances in the design and simulation of distillation columns;nevertheless, CFD studies for such systems are few. Furthermore, tothe best of the authors’ knowledge, there are no works reported onthe mechanical design of trays for dividing wall columns. Thus, amethodology for the mechanical design and hydrodynamic analysisfor sieve trays in a DWC is presented in this work. Mechanical designis performed through the adaptation of the methodology proposedby Kister [33], which is one of the most used methodologies fordesign of conventional distillation columns. The hydrodynamicanalysis is performed through CFD techniques, by using thecommercial software ANSYS Fluent v14.0. The trays are assumedto be at their normal operational conditions, where differentparameters have been tested, looking for the proper values of suchparameters to avoid flooding and irregular flow patterns.
2. Case of study
A mixture of n-pentane, n-hexane and n-heptane, with molarcompositions 0.4/0.2/0.4, separated in a dividing wall columnreported by Gómez-Castro et al. [11] has been taken as case ofstudy in this work. 45.35 kmol/h are fed to the column, whererecoveries of 99 mol% are desired and purities of 98.7, 98 and98.6 mol% for each component are expected. The main column has51 stages, 13 of these stages corresponding to the wall section. Thereflux ratio is 6.69, while the heat duty is 3773.6 GJ/h. Pressure atthe top of the column is 1.45 atm, with a pressure drop of 0.68 atmalong the column. The computed diameter for the main column is1.07 m. This design has been obtained in a previous work as the onewith the lowest heat duty through a multiobjective geneticalgorithm coupled to the commercial simulator Aspen Plus v. 7.2[11]. Sieve trays are used in the column because of their low costand high vapor capacity. Furthermore, for diameters of the column
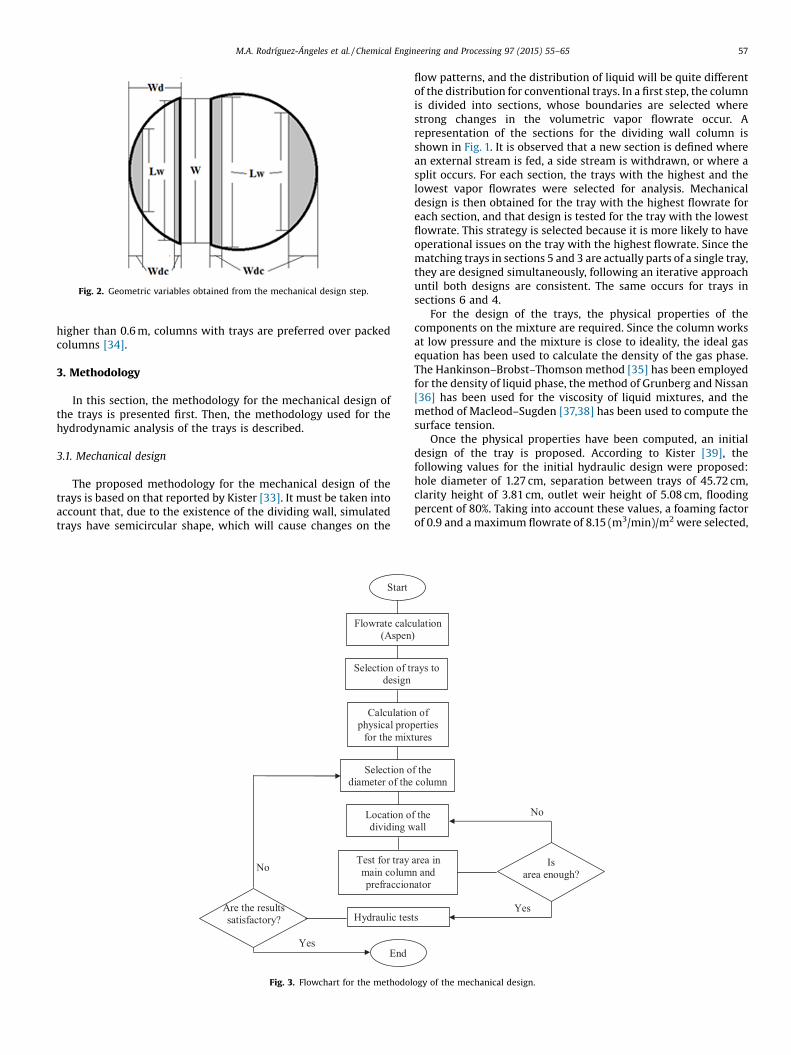
Fig. 2. Geometric variables obtained from the mechanical design step.
M.A. Rodríguez-Ángeles et al. / Chemical Engineering and Processing 97 (2015) 55–65 57
higher than 0.6 m, columns with trays are preferred over packedcolumns [34].
3. Methodology
In this section, the methodology for the mechanical design ofthe trays is presented first. Then, the methodology used for thehydrodynamic analysis of the trays is described.
3.1. Mechanical design
The proposed methodology for the mechanical design of thetrays is based on that reported by Kister [33]. It must be taken intoaccount that, due to the existence of the dividing wall, simulatedtrays have semicircular shape, which will cause changes on the
Test for tray main columprefraccion
Hydraulic tes
End
Are the resultssatisfac tory?
Yes
Selec tion odiameter of the
Loca tion odividing w
Start
Flowrate ca lc(Aspen
Selec tion of trdesign
Calculatiophysica l prop
for the mix
No
Fig. 3. Flowchart for the methodol
flow patterns, and the distribution of liquid will be quite differentof the distribution for conventional trays. In a first step, the columnis divided into sections, whose boundaries are selected wherestrong changes in the volumetric vapor flowrate occur. Arepresentation of the sections for the dividing wall column isshown in Fig. 1. It is observed that a new section is defined wherean external stream is fed, a side stream is withdrawn, or where asplit occurs. For each section, the trays with the highest and thelowest vapor flowrates were selected for analysis. Mechanicaldesign is then obtained for the tray with the highest flowrate foreach section, and that design is tested for the tray with the lowestflowrate. This strategy is selected because it is more likely to haveoperational issues on the tray with the highest flowrate. Since thematching trays in sections 5 and 3 are actually parts of a single tray,they are designed simultaneously, following an iterative approachuntil both designs are consistent. The same occurs for trays insections 6 and 4.
For the design of the trays, the physical properties of thecomponents on the mixture are required. Since the column worksat low pressure and the mixture is close to ideality, the ideal gasequation has been used to calculate the density of the gas phase.The Hankinson–Brobst–Thomson method [35] has been employedfor the density of liquid phase, the method of Grunberg and Nissan[36] has been used for the viscosity of liquid mixtures, and themethod of Macleod–Sugden [37,38] has been used to compute thesurface tension.
Once the physical properties have been computed, an initialdesign of the tray is proposed. According to Kister [39], thefollowing values for the initial hydraulic design were proposed:hole diameter of 1.27 cm, separation between trays of 45.72 cm,clarity height of 3.81 cm, outlet weir height of 5.08 cm, floodingpercent of 80%. Taking into account these values, a foaming factorof 0.9 and a maximum flowrate of 8.15 (m3/min)/m2 were selected,
area in n and ator
ts
Is area enough?
Yes
f the column
f the all
ulation )
ays to
n of erties
tures
No
ogy of the mechanical design.

Fig. 4. Geometry and meshing of a tray on the dividing wall section, (a) two-sections geometry, (b) three-dimensional geometry of the tray, (c) meshing for the tray in maincolumn, (d) meshing for the tray in prefractionator.
End
Postproce ssing
Change of parameters and flow conditions
Yes
Simulation of trays under operational conditions
Normalperformance ? No
Convergenceproblems?
Test simulations for the mesh
Boundaryconditions
Meshing of the trays
Start
Elaboration of geometries
Yes
Fig. 5. Flowchart for the methodology of the CFD analysis.
58 M.A. Rodríguez-Ángeles et al. / Chemical Engineering and Processing 97 (2015) 55–65

(a)
(b)
1.00E+01
1.00E+02
1.00E+03
1 6 11 16 21 26 31 36 41 46 51
VOLU
MET
RIC
FLO
W[m
3 /hr
]
TRAY NUMBER
Liqu id
Vapor
1.00E+00
1.00E+01
1.00E+02
1.00E+03
1 3 5 7 9 11 13
VOLU
MET
RIC
FLO
W[m
3 /hr
]
TRAY NUMBER
Liqu id
Vapor
Fig. 6. Volumetric flow rates across the column, (a) main column, (b) prefractionator.
Fig. 7. Distribution of sections in the dividing wall column.
M.A. Rodríguez-Ángeles et al. / Chemical Engineering and Processing 97 (2015) 55–65 59
which are values recommended for hydrocarbons at low pressure.Then, the following calculations are performed:
1. Gas velocity, net area and flooding percent for a given diameter.2. The fraction of the total area covered by the net area.3. The actual downcomer length and the weir width.
Once the calculations have been performed, the tray is testedfor flooding percent, following the procedures of Kister and Haasand Fair and Smith, as reported by Kister [33]. The tray isconsidered as operable is flooding percent is below 100%. Then, thetray is tested for liquid entrainment, which must be lower than 1%to avoid flooding. If liquid entrainment is higher than 1%, theefficiency of the tray is reduced [40]. Flooding percent is thenrecalculated by considering the height occupied by the liquid andthe froth.
Weeping point tests have also been performed, assuming areduction of 60% on the flow rates from their original value, tocalculate the weeping point. The value of weeping point must beslightly higher that 100%. The calculation of the liquid seals heightis also performed.
For the regions 3 and 5, next to the dividing wall, the trays aredesigned separately for each region, requiring that the total area ofthe matching trays corresponds to the area of a single tray inregions 1 and 2. It is important to notice that a matching pair oftrays in regions 3 and 5 is the same as a single tray in regions 1 and2, but separated by the dividing wall. The same occurs for a tray inregions 4 and 6. The wall is located such that its distance from thewall of the shell is proportional to the fraction of the area occupied

Table 1Maximum and minimum vapor flowrate for selected trays on each section.
Section Type Number ofstage
Mass flowrate(Kg/h)
Volumetric flowrate(m3/h)
1 Maximum 2 10,110 2400Minimum 13 10,520 2163
2 Maximum 27 11,463 2065Minimum 44 11,828 1850
3 Maximum 14 7739 1591Minimum 17 7897 1540
4 Maximum 18 7911 1530Minimum 26 7859 1428
5 Maximum 14 2806 758Minimum 17 2703 741
6 Maximum 18 3050 781Minimum 26 2651 723
60 M.A. Rodríguez-Ángeles et al. / Chemical Engineering and Processing 97 (2015) 55–65
by the section equivalent to the prefractionator. Nevertheless, thelocation of the dividing wall with respect to the shell wall wastreated as a degree of freedom, thus, it must be modified if the trayfails the flooding test. The selection of the best location of thedividing wall requires an optimization procedure, having asobjective the minimization of the total diameter. The procedurealso involves a systematic adjustment of the parameters whichdepend of the total area, such as the weir area, the active area, andeven the diameter and distribution of the holes in the tray. Toreduce the total diameter, those parameters should be reduced.Nevertheless, care must be taken with the lower boundaries, whichare those values for which the column shows operationalproblems. Different tray diameters were tested until the minimumvalue for which the column can be operated is obtained.
From the design stage, the main parameters computed were:the diameter of the tray, the location (Wd) and width (W) of thedividing wall, and the width (Wdc) and length (Lw) of thedowncomers, which are shown in Fig. 2. The width of the dividingwall column has a value of 1.18 m, and it is not modified throughthe simulations. A flowchart of the methodology used for themechanical design is presented in Fig. 3.
3.2. CFD analysis
CFD analysis has been performed using the software ANSYSFluent v. 14.0. The three-dimensional geometry of the trays(designed by following the method presented in the previoussection) was first created. The geometries for the trays with a
Table 2Design parameters for selected trays on each section.
Section 1 Section 2 Sect
DT (m) 1.37 1.37 1.22AT (m2) 1.48 1.48 0.48AD (m2) 0.16 0.19 0.13AN (m2) 1.32 1.28 0.35AB (m2) 1.16 1.09 0.22Lw (m) W–S 1.02 1.07 0.97Lw (m) S–W – – 1.15Wdc (cm) W–S 22.61 25.91 20.3Wdc (cm) S–W – – 3.08LFP (m) 0.92 0.85 0.96S (m) 0.46 0.46 0.46dH (cm) 1.27 1.27 1.27Af 0.1 0.1 0.1
hw (cm) W–S 5.08 5.08 5.08hw (cm) S–W – – 5.08hcl (cm) W–S 3.81 3.81 3.81hcl (cm) S–W – – 3.81t (cm) 0.34 0.34 0.34p (cm) 3.81 3.81 3.81
dividing wall were created first as separated sections, takingspecial care on ensuring the continuity required for a single tray. Atop view of the tray is shown in Fig. 4a. The holes in the tray werelocated in a triangular pitch to minimize the required space. Oncethe geometry of the trays was created, it is processed and the traysare discretized. For the meshing, the trays were divided in threeregions: two of them corresponding to the downcomers, andanother region for the active zone. It has been decided to meshsuch regions because of the following reasons:
1. The mixing of the phases and the mass and heat transfer takeplace only in the active zone of the tray, therefore, in this zonethe mesh should be refined. In the other two zones, there is onlyliquid flow.
2. The mesh on the active zone should take into account theexistence of the holes. Thus, different geometries of theelements may be required.
For the case of the trays in the dividing wall section, the activezone was further divided into two sub-regions: one equivalent tothe main column of a Petlyuk column, from where the side streamis withdrawn (Fig. 4b); and another corresponding to theprefractionator of a Petlyuk column, where feed stream enters(Fig. 4c). Weir regions were discretized using a mesh withhexahedral elements of 0.5 in; for the active zone, tetrahedralelements have been used because hexahedral elements cannot beadjusted, due to the presence of holes. For a better adjustment ofthe cells on the active zones, the holes were first meshed usingtriangular cells. The contour of the active zone is then meshed sothe space between nodes is the same than that of the holes mesh.Then, the other zones of the tray are meshed using triangular cells,mapping it to order the cells. Additional modifications to the size ofthe cells are performed to reduce its number, and, as aconsequence, the computational effort. This modification hasbeen done systematically, always taking care on the values of thecell aspect ratio and the skewness, which must take numericalvalues close to 1 to avoid convergence problems.
For the CFD simulations, the pressure-based solver was used,taking as reference the atmospheric pressure at the gas outlet. Forthe multiphase flow, the eulerian–eulerian model was used,because the bubbles are too small in comparison with the wholesystem. Turbulence was represented through the k–e RNG model.All the simulations were performed until the errors in the residualsreached a specified convergence value, checking periodically the
ion 3 Section 4 Section 5 Section 6
1.22 1.22 1.22 0.48 0.79 0.79
0.12 0.06 0.04 0.35 0.73 0.75 0.23 0.66 0.71
0.95 0.80 0.81 1.15 1.19 1.191 19.06 14.99 15.49 2.80 4.67 4.83 0.99 0.59 0.58 0.46 0.46 0.46
1.27 1.27 1.270.1 0.1 0.1
5.08 5.08 5.08 5.08 5.08 5.08 3.81 3.81 3.81 3.81 3.81 3.81 0.34 0.34 0.34 3.81 3.81 3.81

Fig. 8. Volumetric fraction contours for vapor phase in the trays with dividing wall under operational conditions (side view in a plane cutting through the downcomers).
Fig. 9. Volumetric fraction contours for vapor phase in the trays under operational conditions with modifications on weir area: (a) no modification, (b) reduction of 20%, (c)reduction of 40% (side view of the prefractionator section in a plane cutting through the downcomer).
M.A. Rodríguez-Ángeles et al. / Chemical Engineering and Processing 97 (2015) 55–65 61

Table 3Final design for the trays under maximum charge.
Prefractionator Main column
AT (m2) 0.48 1.00AD (m2) 0.02 0.05Ah (m2) 0.04 0.08Wdc (cm) 6.35 (S) 1.91 (W) 10.16 (S) 3.81 (W)hw (cm) 5.08 5.08hcl (cm) 3.81 3.81S (cm) 30.48 30.48dH (cm) 0.978 0.978p (cm) 2.95 2.95vliq max (m/s) 0.09 0.06Vgas max (m/s) 6.62 7.68DP (Pa) 381 480
62 M.A. Rodríguez-Ángeles et al. / Chemical Engineering and Processing 97 (2015) 55–65
flow rates, temperatures and volumetric fraction for both phases.When these criteria are achieved, it is considered that the columnworks in steady-state, which is taken as the normal operation stateof the column. Once the simulations were completed, the resultswere analyzed. If operational issues were observed, the trays werere-designed and tested again. A flowchart of the methodology usedfor the CFD analysis is presented in Fig. 5.
4. Results
In this section, the results for both parts, mechanical design andCFD analysis, are presented and discussed.
4.1. Mechanical design
To initialize the mechanical design of the trays, it is important toknow the volumetric flow rate for both phases across the stages.Volumetric flow rates for the main column and the prefractionatorsections are presented in Fig. 6. These data were obtained fromsteady-state, rate-based simulations in Aspen Plus v.7.2. Asaforementioned, the column was divided into sections, the trayscontained in each section are shown in Fig. 7, where Z1, Z2, etc., arethe zones or regions of the column; the numbers following theabbreviation ST indicate the number of stages (corresponding tothe main column on the Petlyuk-like structure) included in eachsection. The trays selected for analysis are presented in Table 1;these trays are the ones with the highest and lowest volumetric
Fig. 10. Streamlines of the liquid mixture in
vapor flowrate in each section. Data shown in Table 1 has beenobtained from the steady-state simulations. It is also important tonotice that the trays in sections 3 and 5 are the same in the DWC,but they have different flowrates due to the vapor split. The sameoccurs for sections 4 and 6. As aforementioned, the mechanicaldesign of the trays was carried out by proposing an initial designand then testing it until it is operable. This was done using a VisualBasic routine and Microsoft Excel worksheets. Final designs of thetrays are shown in Table 2, where W–S implies that the flow goesfrom the dividing wall to the shell, while S–W is the opposite. It isimportant to recall that sections 3 and 5 (and sections 4 and 6) arecomplementary, thus the diameter of 1.22 m in sections 3 and5 implies that the whole tray has a diameter of 1.22. Trays reportedin Table 2 have successfully overcome all the tests mentioned inSection 3.1.
4.2. CFD analysis
In order to test the mesh for convergence, transient simulationswere performed using the water-air system, running the systemuntil the values of residuals are small enough and it has beenproved that no convergence issues occur. Once those simulationshave been successfully finished, the hydrocarbons mixture isloaded to the geometry, re-initializing the system to continue withthe analysis. The tray in section 3 presented some problems whenit was charged, because the vapor stream caused the liquid to leavethe tray almost completely. Thus, the tray was redesigned, takinginto account the following considerations:
1. Since there was an excessive liquid entrainment, the area forvapor flow must be increased;
2. the liquid column in the weir was smaller than expected, thusthe distance between trays must be reduced; and
3. the vapor velocity in the holes was high, thus the hole area mustbe increased by reducing the diameter of the holes, thusreducing the pitch and increasing the number of holes.
Taking into account the previous ideas, distance between trayswas reduced to 30.48 cm (12 in), and the hole diameter wasmodified to 0.9525 cm. The trays were redesigned and a diameterof 1.37 m was obtained as the minimum diameter for which nooperational issues were observed. After these modifications, noexcessive liquid entrainment was further observed for this new
a top view at the gas-liquid interface.

M.A. Rodríguez-Ángeles et al. / Chemical Engineering and Processing 97 (2015) 55–65 63
design. The complete tray for sections 3 and 5 under operationalconditions is shown in Fig. 8, where a lengthwise projection of thetray can be observed. Patterns in Fig. 8 shows the volumetricfraction of the gas, where the darkest zones indicates a highervolumetric fraction.
The tray in section 3 operates under a bubbling regimen, whilethe tray in section 5 operates under a spray regimen. Since it isdesired that the trays operate under bubbling regimen, additionalmodifications were performed on the weir area, looking for anincrease on the active area. Two cases were examined: the first byreducing the weir area 20% and the second by reducing it 40%.Results of the simulations with those modifications are shown inFig. 9, where the volumetric fraction of the gas phase is observed.As the weir area is reduced, the liquid fraction increases. Meanliquid fraction for the basis case is 0.416. Once the reduction of 20%is applied, liquid fraction increases to 0.4639. When the reductionof 40% occurs, liquid fraction is 0.4844. Nevertheless, it is notpossible to reduce further the weir area because it would cause anexcessive pressure drop and capillarity phenomenon may occur.
Fig. 11. Temperature profiles (a)
Thus, the reduction of 40% has been taken as the maximumreduction for the weir area. The final design for the trays undermaximum charge is shown in Table 3.
Stream lines for the liquid phase are shown in Fig. 10. A high-turbulence region can be observed, due to the crossflow betweenthe liquid from the weir and the vapor entering to the tray. Theliquid emerges following a wave-like movement, causing aconstant contact between the particles along the tray. Thetemperature profiles for the liquid and the vapor phases areshown in Fig. 11. Liquid temperature profiles show a randomtemperature distribution on the tray in section 3, while a slowvariation on temperature is observed as the liquid pass by the trayin section 5. This is because in section 5 there is a higher contacttime between the phases. It can be observed that the temperaturedistribution is almost symmetric for the gas phase. Finally, thedesigned trays under operational conditions are presented inFig. 12, where the volumetric fraction of liquid is observed. Themixing between both phases is almost homogeneous, thus aproper operation of the distillation column is expected.
liquid phase, (b) gas phase.

Fig. 12. Volumetric fraction of the liquid mixture in the trays under operational conditions (3D view of the trays).
64 M.A. Rodríguez-Ángeles et al. / Chemical Engineering and Processing 97 (2015) 55–65
5. Conclusions
A methodology for the mechanical design and analysis of thetrays in a dividing wall column has been presented. Themethodology is divided in two steps: an initial design; and ahydraulic analysis of the trays using CFD. The proposed method isbased on a traditional design methodology for conventional trays,modified in this work to take into account the geometry of thetrays. The parameters have been adjusted for the dividing wallsection, taking into account the area of the main column and theprefractionator.
During the hydraulic tests, some flooding problems wereobserved; therefore the trays were systematically re-designed tomake them operable under the flow conditions reported. It hasbeen shown that, for a given diameter of the column, it is possibleto change the operational regimen by increasing the total area ofholes. This implies an increase on the pressure drop and the liquidhigh on the weir. Nevertheless, simulations show that, for amixture of low viscosity, the increase on such parameters isminimal.
The final trays were subjected to different hydraulic tests,showing a good performance in their operational point. Noflooding was observed, neither in the weir nor in the trays, anda good mixing resulted in an increase in the contact betweenphases. The temperature profiles showed a gradual increase alongthe tray, and an appropriate pressure drop. Thus, the designed traysare functional, and may operate properly in the dividing walldistillation column. Finally, it is important to notice that theoperational regimen of the trays has been supposed to be aquadratic function of the bubbling area. Nevertheless, additionaldata could be necessary to ensure the quadratic approach is goodenough for the studied system. Furthermore, the method should betested for pilot-scale systems, so that experimental validationcould be achieved; and for non-ideal mixtures.
Acknowledgements
The authors acknowledge the financial support provided by thePrograma de Mejoramiento del Profesorado (PROMEP), throughthe project UGTO-PTC-84; and the University of Guanajuato(México), through the project 419/2014.
References
[1] A.J. Brugma, Process and device for fractional distillation of liquid mixtures,more particularly petroleum, US Patent 2295256, (1942).
[2] E.W. Luster, Apparatus for fractionating cracked products, US Patent 1915681,(1933).
[3] F.B. Petlyuk, V.M. Platonov, D.M. Slavinski, Thermodynamically optimalmethod of separating multicomponent mixtures, Int. Chem. Eng. 5 (1965)555–561.
[4] G. Kaibel, Distillation columns with partitions, Chem. Eng. Technol. 10 (1987)92–98.
[5] B.G. Rong, I. Turunen, Synthesis of new distillation systems by simultaneousthermal coupling and heat integration, Ind. Eng. Chem. Res. 45 (2006) 3830–3842.
[6] M. Errico, B.G. Rong, Modified simple column configurations for quaternarydistillations, Comput. Chem. Eng 36 (2012) 160–173.
[7] C. Triantafyllou, R. Smith, The design and optimization of fully thermallycoupled distillation columns, Trans. Inst. Chem. Eng. 70 (1992) 118–132.
[8] K.A. Amminudin, R. Smith, D.Y.-C. Thong, G.P. Towler, Design and optimizationof fully thermally coupled distillation columns: Part 1: preliminary design andoptimization methodology, Chem. Eng. Res. Des. 79 (2001) 701–715.
[9] I.J. Halvorsen, S. Skogestad, Minimum energy consumption inmulticomponent distillation. 2. Three-product Petlyuk arrangements, Ind. Eng.Chem. Res. 42 (2003) 605–615.
[10] C. Gutiérrez-Antonio, A. Briones-Ramírez, Pareto front of ideal Petlyuksequences using a multiobjective genetic algorithm with constraints, Comput.Chem. Eng 33 (2009) 454–464.
[11] F.I. Gómez-Castro, M.A. Rodríguez-Ángeles, J.G. Segovia-Hernández, C.Gutiérrez-Antonio, A. Briones-Ramírez, Optimal designs of multiple dividingwall columns, Chem. Eng. Technol. 34 (2011) 2051–2058.
[12] N. Van Duc Long, M. Lee, Dividing wall column structure design using responsesurface methodology, Comput. Chem. Eng. 37 (2012) 119–124.
[13] S. Lee, N. Van Duc Long, M. Lee, Design and optimization of natural gasliquefaction and recovery processes for offshore floating liquefied natural gasplants, Ind. Eng. Chem. Res. 51 (2012) 10021–10030.
[14] P.B. Shah, A.C. Kokossis, New synthesis framework for the optimization ofcomplex distillation systems, AIChE J. 48 (2002) 527–550.
[15] Z. Olujic, A.M. Ali, P.J. Jansens, Effect of the initial gas maldistributionon the pressure drop of structured packings, Chem. Eng. Process. 43 (2004)465–476.
[16] A. Rix, Z. Olujic, Pressure drop of internals for packed columns, Chem. Eng.Process. 47 (2008) 1520–1529.
[17] S. Hernández, R. Sandoval-Vergara, F.O. Barroso-Muñoz, R. Murrieta-Dueñas,H. Hernández-Escoto, J.G. Segovia-Hernández, V. Rico-Ramírez, Reactivedividing wall distillation columns: simulation and implementation in a pilotplant, Chem. Eng. Process. 48 (2009) 250–258.
[18] G.P. Rangaiah, E.L. Ooi, R. Premkumar, A simplified procedure for quick designof dividing-wall columns for industrial applications, Chem. Prod. Process.Model. 4 (2009) 250–258.
[19] I. Dejanovic, L. Matijasevic, Z. Olujic, Dividing wall column – a breakthroughtowards sustainable distilling, Chem. Eng. Process. 49 (2010) 559–580.
[20] J.G. Stichlmair, J.R. Fair, Distillation: Principles and Practice, first ed., Wiley,New York, 1998.
[21] O. Yildirim, A.A. Kiss, E.Y. Kenig, Dividing wall columns in chemical processindustry: a review on current activities, Sep. Purif. Technol. 80 (2011) 403–417.
[22] Z. Olujic, M. Jödecke, A. Shilkin, G. Schuch, B. Kaibel, Equipment improvementtrends in distillation, Chem. Eng. Process. 49 (2009) 1089–1104.
[23] R. Krishna, J.M. Van Baten, J. Ellenberger, A.P. Higler, R. Taylor, CFD simulationsof sieve tray hydrodynamics, Chem. Eng. Res. Des. 77 (1999) 639–646.
[24] J.M. Van Baten, R. Krishna, Modelling sieve trays hydraulics usingcomputational fluid dynamics, Chem. Eng. J. 77 (2000) 143–151.
[25] F.J. Trujillo, S.J. Lovatt, M.B. Harris, J. Willix, Q.T. Pham, CFD modeling of theheat and mass transfer process during the evaporation of water from a circularcylinder, The Proceedings of the 3rd International Conference on CFD in theMinerals and Process Industries, CSIRO, Melbourne, Australia, 2003, pp. 99–104.
[26] X.L. Wang, C.J. Liu, X.G. Yuan, K.T. Yu, Computational fluid dynamics simulationof three-dimensional liquid flow and mass transfer on distillation columntrays, Ind. Eng. Chem. Res. 43 (2004) 2556–2567.
[27] T. Wang, J. Wang, Numerical simulations of gas-liquid mass transfer in bubblecolumns with CFD-PBM coupled model, Chem. Eng. Sci. 62 (2007) 7107–7118.
[28] Z.M. Sun, K.T. Yu, X.G. Yuan, C.J. Liu, A modified model of computational masstransfer for distillation columns, Chem. Eng. Sci. 62 (2007) 1839–1850.
[29] D. Noriler, H.F. Meier, A.A.C. Barros, M.R. Wolf Maciel, Thermal fluid dynamicsanalysis of gas–liquid flow on a distillation sieve tray, Chem. Eng. J. 136 (2008)133–143.
[30] R. Rahimi, M.M. Sotoodeh, E. Bahramifar, The effect of tray geometry on thesieve tray efficiency, Chem. Eng. Sci. 76 (2012) 90–98.
[31] M.M. Dribika, M.W. Biddulph, Scaling-up distillation efficiencies, AIChE J. 32(1986) 1864–1875.
[32] A. Zarei, S.H. Hosseini, R. Rahimi, CFD and experimental studies of liquidweeping in the circular sieve tray columns, Chem. Eng. Res. Des. 91 (2013)2333–2345.

M.A. Rodríguez-Ángeles et al. / Chemical Engineering and Processing 97 (2015) 55–65 65
[33] H. Kister, Distillation Design, first ed., McGraw-Hill, U.S.A, 199229.[34] J.D. Seader, E.J. Henley, Separation Process Principles, second ed., Wiley, U.S.A,
2006.[35] G.H. Thompson, K.R. Brobst, R.W. Hankinson, An improved correlation for
densities of compressed liquids and liquid mixtures, AIChE J. 28 (1982)671–676.
[36] L. Grunberg, A.H. Nissan, Mixture law for viscosity, Nature 164 (1949)799–800.
[37] D.B. Macleod, On a relation between surface tension and density, Trans.Faraday Soc. 19 (1923) 38–41.
[38] S. Sugden, A relation between surface tension, density, and chemicalcomposition, J. Chem. Soc. Trans. 125 (1924) 32–41.
[39] H. Kister, Distillation Operation, first ed., McGraw-Hill, U.S.A, 199035.[40] J.R. Fair, R.L. Matthews, Better estimate of entrainment from bubble caps, Pet.
Refiner. 37 (1958) 153–158.