mechanical behaviour of materials chapters 1-4
DESCRIPTION
Materials, Structure, Properties, and Performance. Elasticity and Plasticity. Imperfections: Point and Line Defects.TRANSCRIPT

Mechanical Behavior of Materials
Marc A. Meyers & Krishan K. Chawla
Cambridge University Press

Chapter 1 Materials, Structure, Properties, and
Performance

Thomas’s Iterative Tetrahedron

Properties of Main Classes of Materials

Biological Materials: Dental Implants in the Jawbone

Biological Materials: Typical Hip and Knee Prostheses
(a) Total hip replacement prosthesis (b) Total knee replacement prosthesis.

(a) Schematic representations of different classes of composites. (b) Different kinds of reinforcement in composite materials. Composite with continuous fibers made laminae in four different orientations.
Composites

Specific Modulus and Strength of Some Materials

Hierarchical Structure

Crystal Structure

Miller Indices

Hexagonal Structure

Some Common Crystal Structures

FCC and HCP Structures
(a) Layer of most closely packed atoms corresponding to (111) in FCC and (00.1) in HCP. (b) Packing sequence of most densely packed planes in AB and AC sequence. (c) Ball model showing the ABAB sequence of the HCP structure. (d) Ball model showing the ABCABC sequence of the FCC structure.

Different Structures of Ceramics

Structure of Glasses
(a) Ordered crystalline of silica (b) Random-network of glassy silica

Structure of Glasses
(c) Specific volume vs. temperature for glassy and crystalline forms of material
(c)
(d) (e)
(d) (e) Atomic arrangements in crystalline and glassy metals, respectively.

18
Trimodal Composite Composition
• Light weight structural composite. • Coarse grain additions increase ductility.
I.A. Ibrahim, et al., J. Mater. Sci. 26 p1137 (1991).
Density ρ (g/cc)
Young’s Modulus
(GPa)
CTE (1/°C)
Al 5083 2.66 70 26 x 10-6
B4C 2.51 460 6.1 x 10⁻⁶
ESK© Ceramics Tetrabor© Boron Carbide F1200
Al 5083 CG (~1 micron)
B4C (~1-7micron)
Cryomilled Al 5083 (~27-100 nm)
J. Ye et al. / Scripta Materialia 53 (2005) 481-486.

Trimodal Composite Microstructure
19 J. Ye et al. / Scripta Materialia 53 (2005) 481-486

TEM and HRTEM result of UFG/B4C interfaces (level 0)
(a)TEM image showing the B4C/UFG interface, (b) HRTEM image of B4C/UFG interface, the UFG grain is away from zone axis, (c) HRTEM image of B4C/UFG interface, the upper portion indicating an amorphous region between the B4C and UFG region, (d) HRTEM image indicates a lattice-level match between B4C and UFG Al.
Y. Li et al, Acta Materialia 59 (2011).

Classification of Polymers
Different types of molecular chain configurations.
(a) Homopolymer: one type of repeating unit. (b) Random copolymer: two monomers, A and B, distributed randomly. (c) Block copolymer: a sequence of monomer A, followed by a sequence of monomer B. (d) Graft copolymer: Monomer A forms the main chain, while monomer B forms the branched chains.

Tacticity in Polypropylene
Tacticity : Order of placement of side groups.
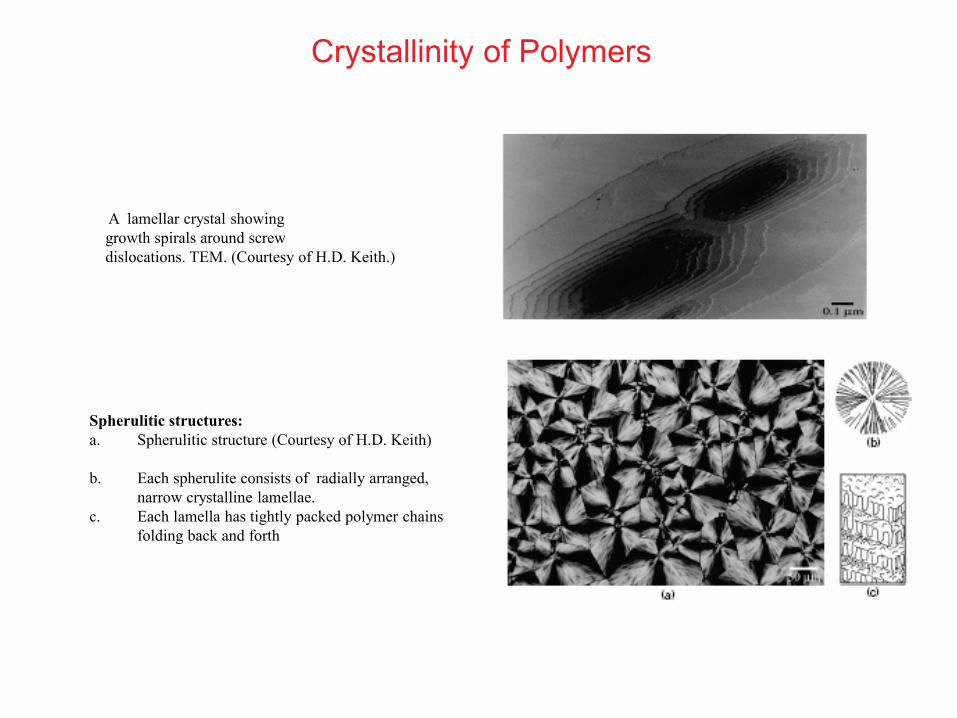
Crystallinity of Polymers
A lamellar crystal showing growth spirals around screw dislocations. TEM. (Courtesy of H.D. Keith.)
Spherulitic structures: a. Spherulitic structure (Courtesy of H.D. Keith)
b. Each spherulite consists of radially arranged, narrow crystalline lamellae. c. Each lamella has tightly packed polymer chains folding back and forth

Polymer Chain Configuration

Molecular Weight Distribution
Molecular weight distribution curve (schematic). Various molecular weight parameters are indicated.

Liquid Crystals
Different types of order in the liquid crystalline state.

Mechanical Behavior of Biological Materials
Stress–strain curves for biological materials. (a) Urether. (After F. C. P. Yin and Y. C. Fung, Am. J. Physiol. 221 (1971), 1484.) (b) Human femur bone. (After F. G. Evans, Artificial Limbs, 13 (1969) 37.)

Crack Propagation in an Abalone Shell
(a) Cross section of abalone shell showing how a crack, starting at left, is deflected by viscoplastic layer between calcium carbonate lamellae (mesoscale). (b) Schematic drawing showing arrangement of calcium carbonate in nacre, forming a miniature “brick and mortar” structure (microscale).

Porous and Cellular Materials
Compressive stress–strain curves for foams. (a) Polyethylene with different initial densities. (b) Mullite with relative density = 0.08. (Adapted
from L. J. Gibson and M. F. Ashby, Cellular Solids: Structure and Properties (Oxford, U.K.: Pergamon Press, 1988), pp. 124, 125.)
(c) Schematic of a sandwich structure.

Biomaterial: Toucan Beak
(a) Toucan beak; (b) external shell made of keratin scales.

Foams: Synthetic and Natural
Cellular materials: (a) synthetic aluminum foam; (b) foam found in the inside of toucan beak.(Courtesy of M. S. Schneider and K. S. Vecchio.)

Biomaterials: Atomic Structure
Atomic structure of hydroxyapatite: small white atoms (P), large gray atoms (O), black atoms (Ca). (b) Atomic structure of aragonite: large dark atoms (Ca), small gray atoms (C), large white atoms (O).

Amino Acids

DNA Structure
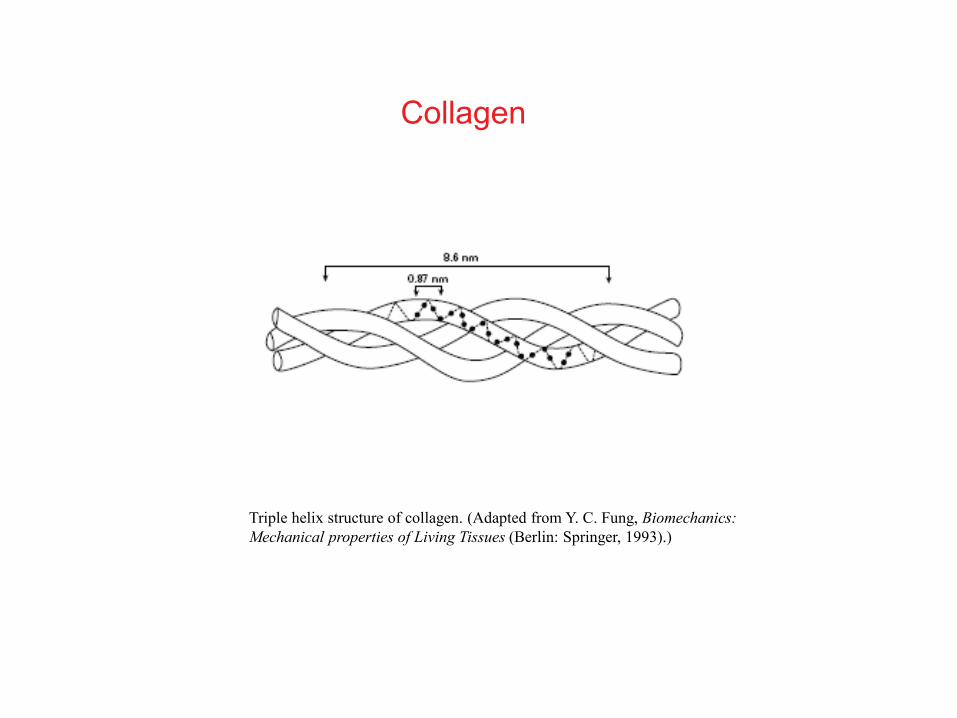
Collagen
Triple helix structure of collagen. (Adapted from Y. C. Fung, Biomechanics: Mechanical properties of Living Tissues (Berlin: Springer, 1993).)

Collagen: Hierarchical Structure
Hierarchical organization of collagen, starting with triple haelix, and going to fibrils. (From H. Lodish et al., Molecular Cell Biology, 4th ed. (New York, W.H. Freeman & Company, 1999).)

Mechanical Properties of a Collagen Fiber
Idealized configuration of a wavy collagen fiber.
Stress–strain curve of collagen with three characteristic stages.

Actin
Molecular structure of actin.

Muscle Structure
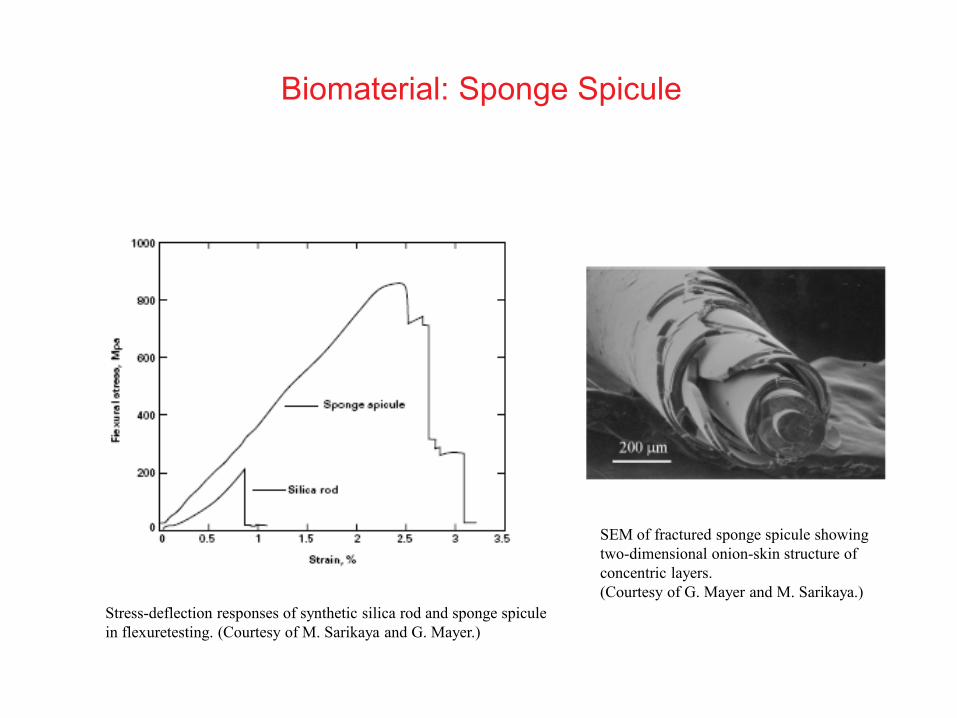
Biomaterial: Sponge Spicule
Stress-deflection responses of synthetic silica rod and sponge spicule in flexuretesting. (Courtesy of M. Sarikaya and G. Mayer.)
SEM of fractured sponge spicule showing two-dimensional onion-skin structure of concentric layers. (Courtesy of G. Mayer and M. Sarikaya.)

Active (smart) Materials
(a) Effect of applied field E on dimension of ferroelectric material. (b) Linear relationship between strain and electric field. (Courtesy of G. Ravichandran.)

Electronic Materials
Cross section of a complementary metal-oxide semiconductor (CMOS). (Adapted from W. D. Nix, Met. Trans., 20A (1989) 2217.)

Nanomaterials: Carbon Nanotubes
Three configurations for single wall carbon nanotubes: (a) arm chair; (b) “zig-zag”; (c) chiral. (Adapted from M. S. Dresselhaus, G. Dresselhaus and R. Saito,
Carbon, 33 (1995) 883.)
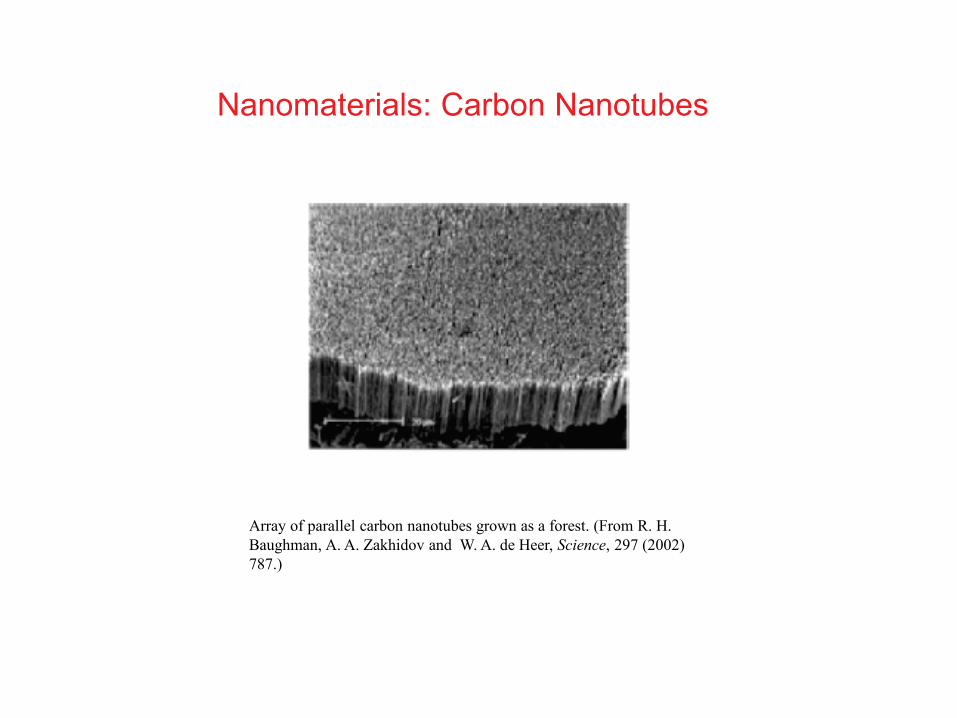
Nanomaterials: Carbon Nanotubes
Array of parallel carbon nanotubes grown as a forest. (From R. H. Baughman, A. A. Zakhidov and W. A. de Heer, Science, 297 (2002) 787.)

Chapter 2
Elasticity and
Plasticity

Mechanical Testing Machine

Elastic Behavior
Stress–strain curves in an elastic regime. (a) Linear elastic curve , typical for metals, ceramics,
and some polymers. (b) Nonlinear elastic curve, typical for rubber.

Strain Energy
Density

Shear Stress and
Shear Strain
(a) Specimen subjected to shear force.
(b) (b) Strain undergone by small cube in shear region.
(c) (c) Specimen (cylinder) subjected to torsion by a torque T.

Poisson’s Ratio
(a) Unit cube being extended in direction Ox3. (b) Unit cube
subjected to tridimensional stress; only stresses on the three
exposed faces of the cube are shown. Poisson’s ratio, ν, is
the negative ratio of the transverse strain and longitudinal
strain.

Generalized Hooke's Law

Mohr Circle
(a) Biaxial (or bidimensional) state of stress.
(b) Mohr circle construction, general orientation
(c) Mohr circle and construction, principal stresses and
maximum shear stresses (Method I).

Mohr Circle

Pure Shear

Hooke’s Law for Anisotropic Materials

Relations among Elastic Constants for Isotropic Materials

Elastic Compliance and Stiffness Matrixes

Compliance Matrix for a Cubic System

Relationships Among Elastic Constants
Young’s modulus
Shear modulus
Bulk modulus
Poisson’s ratio
Lame΄ constants
11
1E
S
11 12
1
2( )G
S S
11 22 33
11 22 33
1
1( )
3
BK
12
11
S
S
44 11 12
44
12
1 1( )
2C C C G
S
C

Young’s Modulus of Monocrystalline Cu

Young’s Modulus Monocrystalline Zirconia

Young’s Modulus of Monocrystalline Zirconium

Voigt and Reuss Averages for Polycrystals
Voigt average: isostrain
Reuss average: isostress
11 22 32
12 23 13
44 55 66
1 1(3 ' 3 ' ')
5
1' ( )
3
1' ( )
3
1' ( )
3
F G HE
F S S S
G S S S
H S S S

Effect of Porosity on Young’s Modulus
Watchman and Mackenzie:
2
0 1 2(1 )E E f f
1 21.9, 0.9f f

Effect of Microcracks on Young’s Modulus

Effect of Microcracks on Young’s Modulus
3 1
0
[1 1.63 ]E
NaE
3
0
1 1.63E
NaE
Salganik model
O’connell & Budiansky model

Young’s Modulus of Polymers
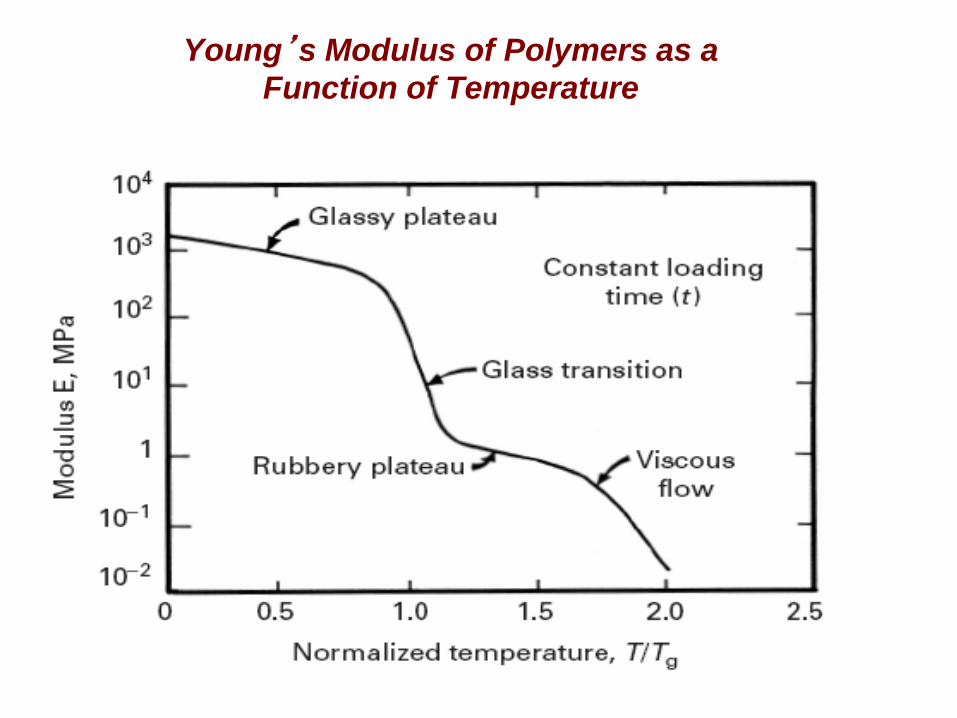
Young’s Modulus of Polymers as a
Function of Temperature

Viscoelasticity
n n = 0: plastic
n = 1: linear viscous (Newtonian)
n ≠1 : nonlinear
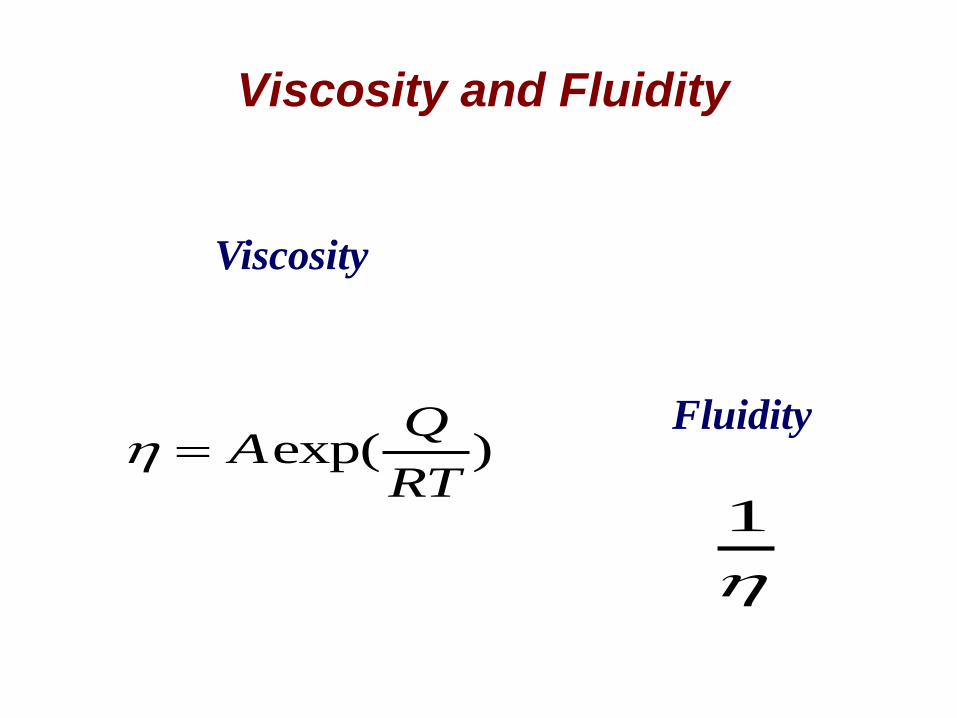
Viscosity and Fluidity
exp( )Q
ART
Viscosity
Fluidity
1

Viscoelasticity
0
0
0 0
0 0
exp[ ( )]
exp[ ( )]
exp (cos sin )
' "
e e i t
i t
E i ie e e
E iE

Viscoelasticity
Tensile storage modulus 0
0
0
0
' cos
" sin
Ee
Ee
Tensile loss modulus

Rubber
Elasticity
2 1
1 1[ ]nKT
11
0
l
l

Stress-Strain Behavior of Biological Materials
(a) Stress–strain response of human vena cava: circles-loading;
squares-unloading. (Adapted from Y. C. Fung, Biomechanics (New York:
Springer, 1993),p. 366.)
(b) Representation of mechanical response in terms of tangent modulus (slope
of stress–strain curve) vs. stress. (Adapted from Y. C. Fung. Biomechanics,
New York: Springer,1993), p. 329.)

Residual Stresses in Arteries

Cartilage

Mesostructure of Cartilage
(a) Mesostructure of cartilage (consisting of four zones) showing differences in
structure as a function of distance from surface; the bone attachment is at bottom.
(From G. L. Lucas, F. W. Cooke, and E. A. Friis, A Primer on Biomechanics (New
York: Springer, 1999), p. 273.)
(b) Cross-section of human cartilage showing regions drawn schematically in (a).
(Courtesy of K. D. Jadin and R. I. Sah.)

Mechanical Behavior of Superficial Zone of Cartilage
Stress–strain curve for samples from the superficial zone of articular cartilage. Samples
were cut parallel and perpendicular to collagen fiber orientation. (From G. E. Kempson,
Mechanical Properties of Articular Cartilage. In Adult Articular Cartilage, ed. M. A. R.
Freeman (London: Sir Isaac Pitman and Sons Ltd., 1973), pp. 171–228.)

Mechanical Testing of DNA
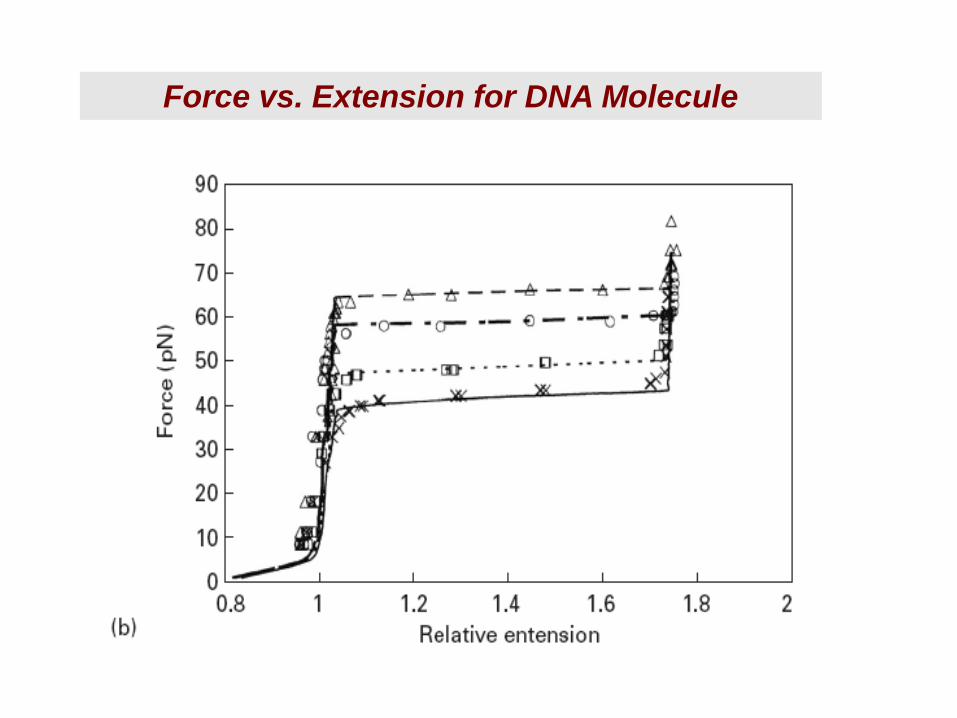
Force vs. Extension for DNA Molecule

Stresses in a Thin Film
Effect of stresses in a thin film on bending of
substrate; (a) tensile stresses in thin film; (b)
compressive stresses in thin film.

Elastic Constant and Bonding
Two atoms with an imaginary spring between them; (a)
equilibrium position; (b) stretched configuration under
tensile force; (c) compressed configuration under
compressive force.
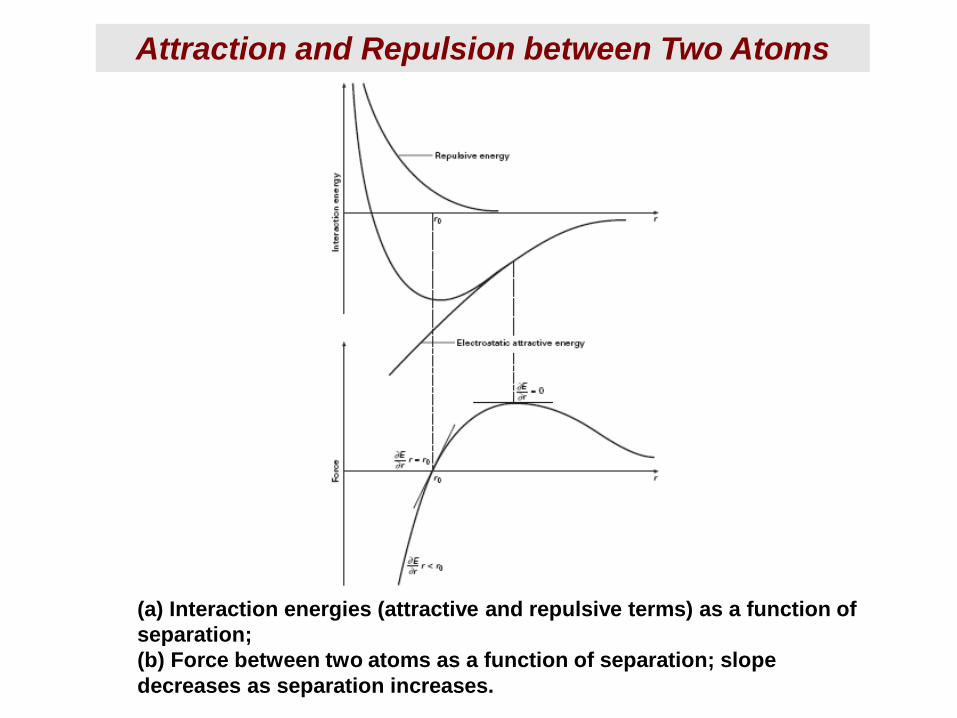
Attraction and Repulsion between Two Atoms
(a) Interaction energies (attractive and repulsive terms) as a function of
separation;
(b) Force between two atoms as a function of separation; slope
decreases as separation increases.

Chapter 3 Plasticity
Sections: 3.1-3.6; 3.8-3.9


Common tests used to determine the monotonic strength of materials. (a) Uniaxial tensile test. (b) Upsetting test. (c) Three-point bend test. (d) Plane-strain tensile test. (e) Plane-strain compression (Ford) test. (f) Torsion test. (g) Biaxial test.
Tests for Mechanical Strength of Materials

A servohydraulic universal testing machine linked to a computer. (Courtesy of MTS Systems Corp.)
Mechanical Testing: Servohydraulic Machine

Stress–strain curves for AISI 1040 steel subjected to different heat treatments; curves obtained from tensile tests.
Stress-Strain Curves of a Steel after Different Heat Treatments


Idealized shapes of uniaxial stress–strain curve. (a) Perfectly plastic. (b) Ideal elastoplastic. (c) Ideal elastoplastic with linear work-hardening. (d) Parabolic work-hardening (σ =σo + Kεn).
Idealized Uniaxial Stress-Strain Curves

Ludwik-Hollomon equation
Plasticity
Voce equation
Johnson-Cook equation


Schematic representation of the change in Poisson’s ratio as the deformation regime changes from elastic to plastic.
True Stress - True Strain Curve and Poisson’s ratio

True- and engineering-stress–vs. true -and engineering -strain curves for AISI 4140 hot-rolled steel. R. A. is reduction in area.
Stress-Strain Curves

Engineering- (or nominal-) stress–strain curves (a) without the yield point and (b) with a yield point.
Engineering Stress - Engineering Strain CurvesYield Point

Engineering Stress - Engineering Strain CurvesYield PointCORRECT DIAGRAM


Log dσ/dε versus log ε for stainless steel AISI 302. (Adapted with permission from A. S. de S. e Silva and S. N. Monteiro, Metalurgia-ABM, 33 (1977) 417.)
Work hardening vs. Strain
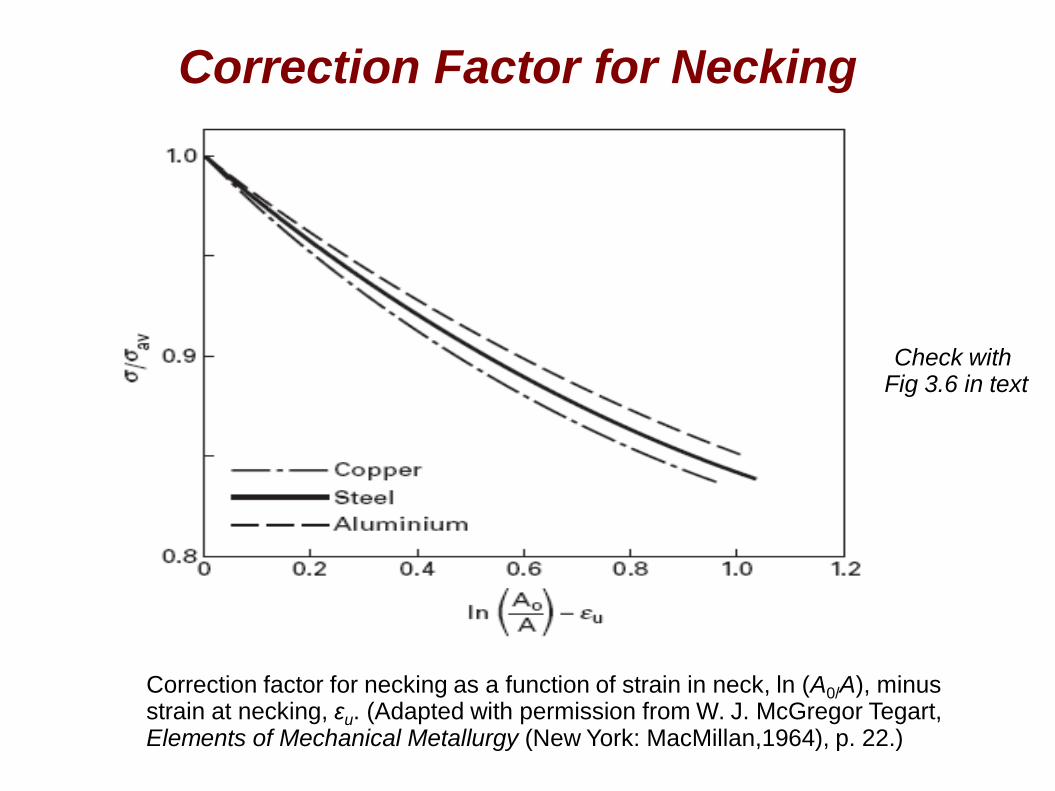
Correction factor for necking as a function of strain in neck, ln (A0/A), minus strain at necking, εu. (Adapted with permission from W. J. McGregor Tegart, Elements of Mechanical Metallurgy (New York: MacMillan,1964), p. 22.)
Correction Factor for Necking
Check with Fig 3.6 in text

Deformation due to Wire Drawing
Stress–strain curves for Fe–0.003% C alloy wire, deformed to increasing strains by drawing; each curve is started at the strain corresponding to the prior wire-drawing reduction. (Courtesy of H. J. Rack.)

(a) Effect of strain rate on the stress–strain curves for AISI 1040 steel.
(b) Strain-rate changes during tensile test. Four strain rates are shown.
Strain Rate Effects


(a) Compression specimen between parallel platens.
(b) Length inhomogeneity inspecimen.
Plastic Deformation in Compressive Testing

(a) Stress–strain (engineering and true) curves for 70–30 brass in compression. (b) Change of shape of specimen and barreling.
Stress-Strain Curve for Compression

(a) Distortion of Finite Element Method (FEM) grid after 50% reduction in height h of specimen under sticking-friction conditions. (Reprinted with permission from H. Kudoand S. Matsubara, Metal Forming Plasticity (Berlin: Springer, 1979),p. 395.)
(b) Variation in pressure on surface of cylindrical specimen being compressed.
Finite Element Method

Ratio of compressive flow stress (0.2% plastic strain) and tensile flow stress at different levels of plastic strain for different steels. (After B. Scholtes, O. Vöhringer, and E. Macherauch, Proc. ICMA6, Vol. 1 (New York: Pergamon, 1982), p. 255.)
Bauschinger Effect

Schematic of the different types of stress–strain curves in a polymer.
Effect of strain rate and temperature on stress–strain curves.
Plastic Deformation of Polymers

Schematic of necking and drawing in a semicrystalline polymer.
Necking and Drawing in Polymers

(a) Neck propagation in a sheet of linear polyethylene.
(b) Schematic of neck formation and propagation in a specimen,.
Neck Propagationin Polyethylene

Metallic Glasses

http://physics.aps.org/articles/v5/54
http://www.youtube.com/watch?v=Yg0hUqdzXGw
http://www.its.caltech.edu/~vitreloy/development.htm
http://www.popsci.com/technology/article/2011-01/new-metallic-glass-toughest-strongest-material-yet
http://scitechdaily.com/yale-engineers-develop-micro-fuel-cells-made-of-bulk-metallic-glasses/
METALLIC GLASSES - resources

Compressive stress–strain curves for Pd77.5CU6Si16.5.(Adapted with permission from C. A. Pampillo and H. S. Chen, Mater. Sci. Eng., 13 (1974) 181.)
Stress-Strain Curve of a Metallic Glass

Shear steps terminating inside material after annealing at 250◦C/h, produced by (a) bending and decreased by (b)unbending. Metglas Ni82.4Cr7Fe3Si4.5B3.1 strip. (Courtesy of X. Cao and J. C. M. Li.)
Shear Steps in a Metallic Glass

(a) Gilman model of dislocations in crystalline and glassy silica, represented by two-dimensional arrays of polyhedra. (Adapted from J. J. Gilman, J. Appl. Phys. 44 (1973)675 )
(b) Argon model of displacement fields of atoms (indicated by magnitude and direction of lines) when assemblage of atoms is subjected to shear strain of 5 ×10⁻², in molecular dynamics computation. (Adapted from D. Deng, A. S. Argon, and S. Yip, Phil. Trans. Roy. Soc. Lond. A329 (1989) 613.)
Dislocations

Viscosity of soda–lime–silica glass and ofmetallic glasses (Au–Si–Ge, Pd–Cu–Si, Pd–Si, C0P) as a function of normalized temperature. (Adapted from J. F. Shackelford, Introduction to Materials Science for Engineers, 4th ed. (Englewood Cliffs, NJ: Prentice Hall, 1991), p. 331, and F. Spaepenand D. Turnbull in Metallic Glasses, ASM.)
Viscosity of Glasses

Viscosity of three glasses as a function of temperature. 1 P=0.1 Pa · s.
Viscosity of Glasses

Comparison of the impression sizes produced by various hardness tests on a material of 750 HV. BHN = Brinell hardness number, HRC = Rockwell hardness number on C scale, HRN = Rockwell hardness number on N scale, VPN = Vickers hardness number. (Adapted with permission from E. R. Petty, in Techniques of Metals Research, Vol. 5, Pt. 2, R. F. Bunshah, ed. (New York: Wiley-Interscience, 1971), p. 174.)
Impressions Produced in Hardness Tests

Impression caused by spherical indenter on metal plate in a Brinell hardness test.
Brinell Impression

Procedure in using Rockwell hardness tester. (Reprinted with permission from H. E. Davis, G. E. Troxel, and C. T. Wiscocil, The Testing and Inspection of Engineering Materials, (NewYork: McGraw-Hill, 1941), p. 149.)
Rockwell Hardness Tester

Scales for Rockwell Hardness Tester

Vickers Hardness Test
Relationships Between Yield Stress and Hardness

(a) Hardness–distance profiles near a grain boundary in zinc with 100-atom ppm of Al and zinc with 100-atom ppm of Au (1-gf load). (b) Solute concentration dependence of percent excess boundary hardening in zinc containing Al, Au, or Cu (3-gf load). (Adapted with permission from K. T. Aust, R. E. Hanemann, P. Niessen, and J. H. Westbrook, Acta Met., 16 (1968) 291).
Hardness Profile near a Grain Boundary

Details of the Knoop indenter, together with its impression.
Knoop Indenter

Nanoindenter apparatus

An impression made by means of Berkovich indenter in a copper sample. (From X. Deng, M. Koopman, N. Chawla, and K.K. Chawla, Acta Mater., 52 (2004) 4291.) (a) An atomic force micrograph, showing the topographic features of the indentation on the sample surface. The scale is the same along the three axes. (b) Berkovich indentation as seen in an SEM.
Topographic Features of the Berkovich Indentation

Load vs. Indenter Displacement

Simple formability tests for sheets. (a) Simple bending test. (b) Free-bending test. (c) Olsen cup test. (d) Swift cup test. (e) Fukui conical cup test.
Simple Formability Tests for Sheets

“Ears” formed in a deep-drawn cup due to in-plane anisotropy. (Courtesy
of Alcoa, Inc.)
Earing in Deep Drawing

Impurities introduced in the metal as it was made become elongated into “stringers” when the metal is rolled into sheet form. During bending, the stringers can cause the sheet to fail by cracking if they are oriented perpendicular to the direction of bending (top). If they are oriented in the direction of the bend (bottom), the ductility of the metal remains normal. (Adapted with permission from S. S. Hecker and A. K. Ghosh, Sci. Am., Nov. (1976), p. 100.)
Fibering

Sheet specimen subjected to punch–stretch test until necking; necking can be seen by the clear line. (Courtesy of S. S. Hecker.)
Punch-Stretch Test

Schematic of sheet deformed by punch stretching. (a) Representation of strain distribution: ε1, meridional strain; ε2, circumferential strain; h, cup height.
b) Geometry of deformed sheet.
Punch-Stretch Test

Construction of a forming-limit curve (or Keeler–Goodwin diagram).
(Courtesy of S. S. Hecker.)
Forming-Limit Curve

Different strain patterns in stamped part. (Adapted from W.
Brazier, Closed Loop, 15, No. 1 (1986) 3.)
Different Strain Patterns in Stamped Part

ADDITIONAL – EXTRA RESOURCE SLIDES FOLLOW

Rankine, Tresca, and von Mises Criteria
Maximum-Stress Criterion
Maximum-Shear-Stress Criterion
Maximum-Distortion-Energy Criterion

(a) Rankine, von Mises, and Tresca criteria.
(b) Comparison of failure criteria with experimental results. (Reprinted with permission from E. P. Popov, Mechanics of Materials, 2nd ed. (Englewood Cliffs, NJ: Prentice-Hall, 1976), and G. Murphy, Advanced. Mechanics of Materials (New York: McGraw-Hill, 1964), p. 83.)
Comparison of Rankine, von Mises, and Tresca Criteria

Displacement of the yield locus as the flow stress of the material due to plastic deformation. (a) Isotropic hardening. (b) Kinematic hardening.
Displacement of the Yield Locus due to Plastic Deformation

Tensile and Compressive Curves for Al2O3

(a) Simple model for solid with cracks. (b) Elliptical flaw in elastic solid subjected to compression loading. (c) Biaxial fracture criterion for brittle materials initiated from flaws without (Griffith)and with (McClintock and Walsh) crack friction.
Failure Criteria for Brittle Materials

Mohr-Coulomb failure criterion
Griffith Failure Criterion
McClintock-Walsh Crtierion
Failure Criteria for Brittle Material

Translation of von Mises ellipse for a polymer due to the presence of hydrostatic stress. (a) No hydrostatic stress, (b) with hydrostatic stress.
von Mises Criterion for a Polymer
a b

Shear yielding and crazing for an amorphous polymer under biaxial stress. The thicker line(delineates the failure envelope when crazing occurs in tension.(After S. S. Sternstein and L. Ongchin, Am. Chem. Soc., Div. Of Polymer Chem., Polymer Preprints, 10 (1969), 1117.)
Shear Yielding and Crazing for Amorphous Polymer

Failure envelope for a unidirectional E-glass/epoxy composite under biaxial loading at different levels of shear stress. (After I. M. Daniel and O. Ishai, Engineering Mechanics of Composite Materials (New York: Oxford University Press, 1994), p. 121.)
Failure Envelope for a Fiber Reinforced Composite

Plane-stress yield loci for sheets with
planar isotropy or textures that are rotationally symmetric about the thickness direction, x3. (Values of R = σ2/σ1 indicate the degree of anisotropy.)
Plane-Stress Yield Loci for Sheets with Planar Isotropy

Stress vs. Strain Rate for Slow-Twitchand Fast Twitch Muscles

Stress–strain response for some biological materials.
Stress-Strain Cures of Some Biological Materials

Mechanical Properties of Biological Materials

Stress–strain response for elastin; it is the ligamentum nuchae of cattle (Adapted from Y.C. Fung and S. S. Sobin, J. Biomech. Eng., 1103 (1981) 121. Also in Y. C. Fung, Biomechanics: Mechanica l Properties of Living Tissues(NewYork: Springer, 1993) p. 244.)
Stress-Strain Response of Elastin

Tensile and compressive stress–strain curves for cortical bone in longitudinal and transverse directions. (Adapted from G. L. Lucas, F. W. Cooke, and E. A. Friis, A Primer on Biomechanics (New York: Springer, 1999).)
Stress-Strain Response of Cortical Bone

Strain-rate dependence of tensile response of cortical bone. (Adapted from J. H. McElhaney, J. Appl. Physiology, 21(1966) 1231.)
Effect of Strain Rate on Tensile Stress-Strain Curve of Cortical Bone

Chapter 4Imperfections: Point and Line
Defects

Dimensional Range for Different Classes of Defects
Types of Imperfections:
1. Point Defects – 0-Dimensional ImperfectionsLocalized (foreign atoms, vacancies, extra or missing e)
2. Line Defects – 1-Dimensional ImperfectionsExtend through crystal on a line (dislocations)
3. Interfacial Defects – 2-Dimensional or Planar ImperfectionsBoundaries between regions of order (order can be atomic,
magnetic, electronic, or chemical)
4. Bulk Defects – 3-Dimensional ImperfectionsMacroscopic or large scale defects (voids, cracks and inclusions)

Stress Required to Shear a Crystal

Theoretical Shear Strength of Some Materials
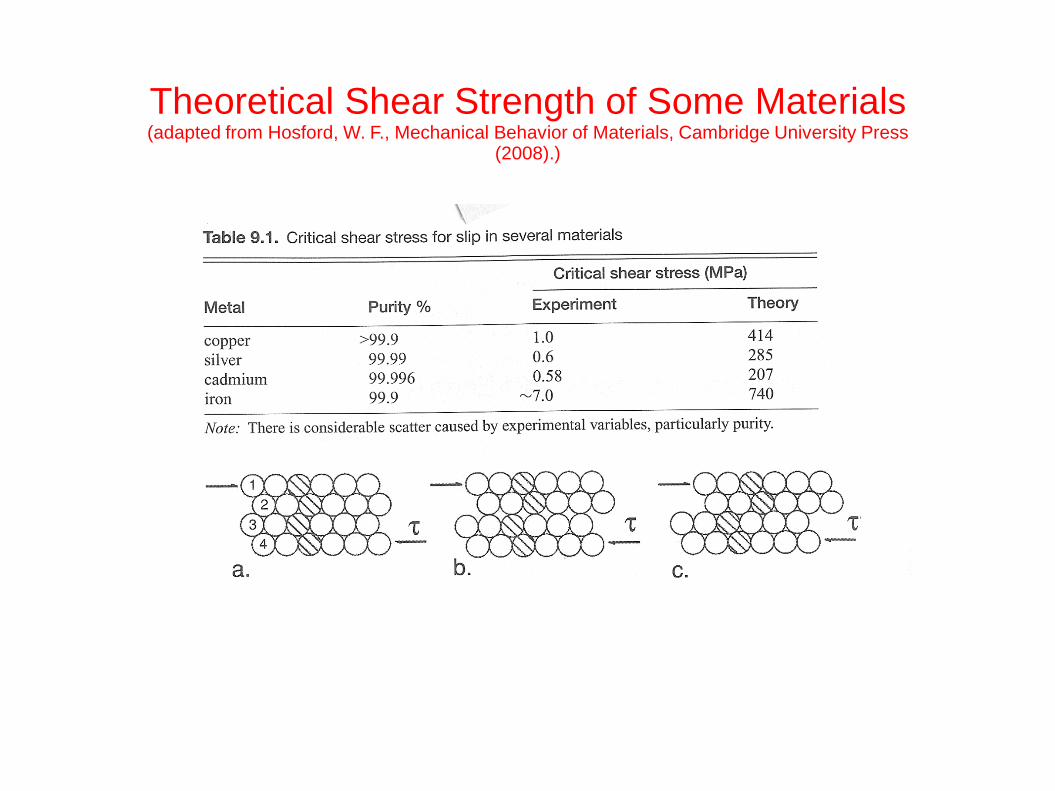
Theoretical Shear Strength of Some Materials (adapted from Hosford, W. F., Mechanical Behavior of Materials, Cambridge University Press
(2008).)

Atomic point defects.
Two most common point defects in compounds:
Schottky and Frenkel defects.
Point Defects

Atomic point defects.
Two most common point
defects in compounds:Schottky and Frenkeldefects.
Point Defects(adapted from Barrett, Nix and Tetelman, The Principles of Engineering Materials, Prentice Hall, Inc. (1973).)

Interstices in FCC structure. (a)
Octahedral void. (b) Tetrahedral void.
Interstices in the BCC structure. (a)
Octahedral void. (b) Tetrahedral void.
Interstices in the HCP structure. (a)
Octahedral void. (b) Tetrahedral void.
Point Defects

Formation of point defects by the annihilation of
dislocations. (a) Row of vacancies. (b) Row of interstitials.
Formation of Point Defects

Shear stress-versus-strain curves for aluminum
single crystals. The crystallographic orientation isshown in the stereographic triangle. (Adapted with permission from A. H. Cottrell, Phil. Mag., 46 (1955) p. 737.)
Shear stress-Shear Strain Curves for Aluminum Single Crystal
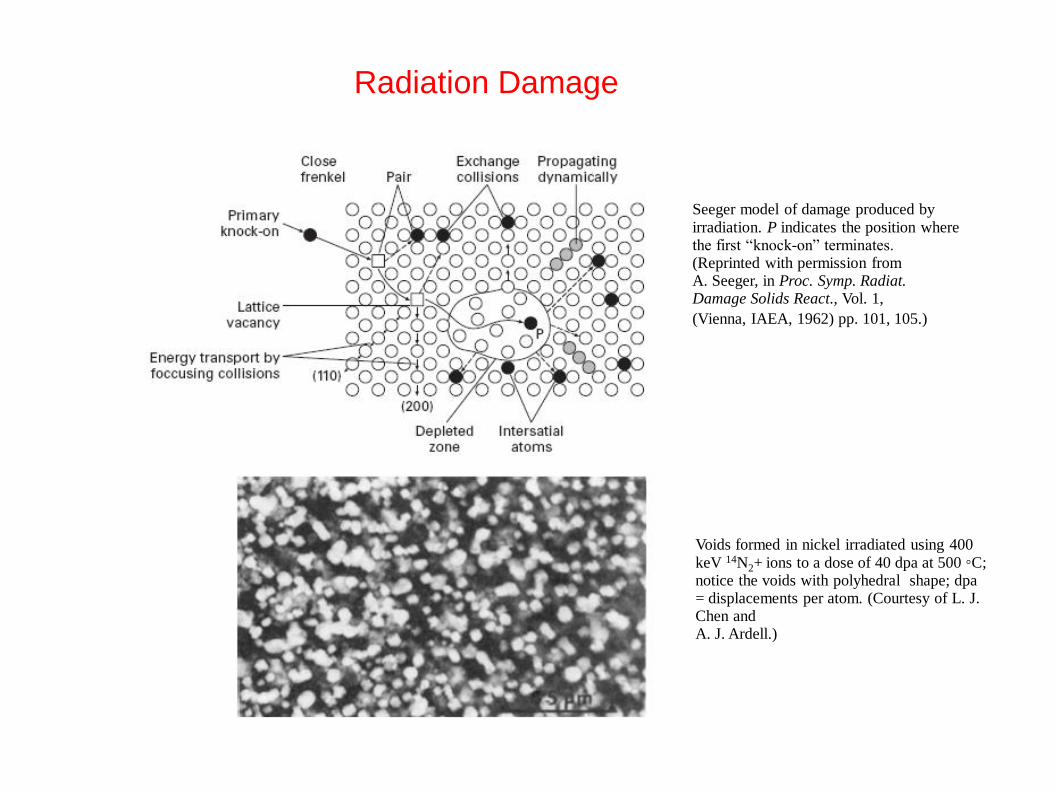
Seeger model of damage produced by
irradiation. P indicates the position where the first “knock-on” terminates.(Reprinted with permission fromA. Seeger, in Proc. Symp. Radiat.Damage Solids React., Vol. 1,
(Vienna, IAEA, 1962) pp. 101, 105.)
Voids formed in nickel irradiated using 400
keV 14N2+ ions to a dose of 40 dpa at 500 ◦C; notice the voids with polyhedral shape; dpa = displacements per atom. (Courtesy of L. J. Chen andA. J. Ardell.)
Radiation Damage

Stress–strain curves for irradiated and
unirradiated Zircaloy. (Adapted with permission from J. T. A. Roberts, IEEE Trans. Nucl. Sci., NS-22, (1975) 2219.)
Radiation Damage

Stress-free dilation in AISI 316 steel (20% cold
worked). (Adapted with permission from J.T. A. Roberts, IEEE Trans. Nucl. Sci., NS-22, (1975) 2219.)
Dependence of fast neutron-induced dilation
in stainless steel (Fe–Cr–Ni) as a function of Ni and Cr amounts. (Adapted with permission
from W. B. Hillig, Science, 191 (1976) 733.)
Radiation Damage

(a) Rug with a fold.
Caterpillar with a hump.
Line Defects

Arrangement of atoms in an edge dislocation and the Burgers vector b
that produces closure of circuit ABCDE.
Edge and Screw Dislocations
Arrangement of atoms in a screw dislocation with “parking garage”
setup. Notice car entering garage.

Edge and Screw Dislocations
.
(a) Perfect crystal. (b) Edge dislocation. (c) Screw dislocation.

Plastic deformation of a crystal by the
movement of a dislocation along a slip plane.
Plastic Deformation
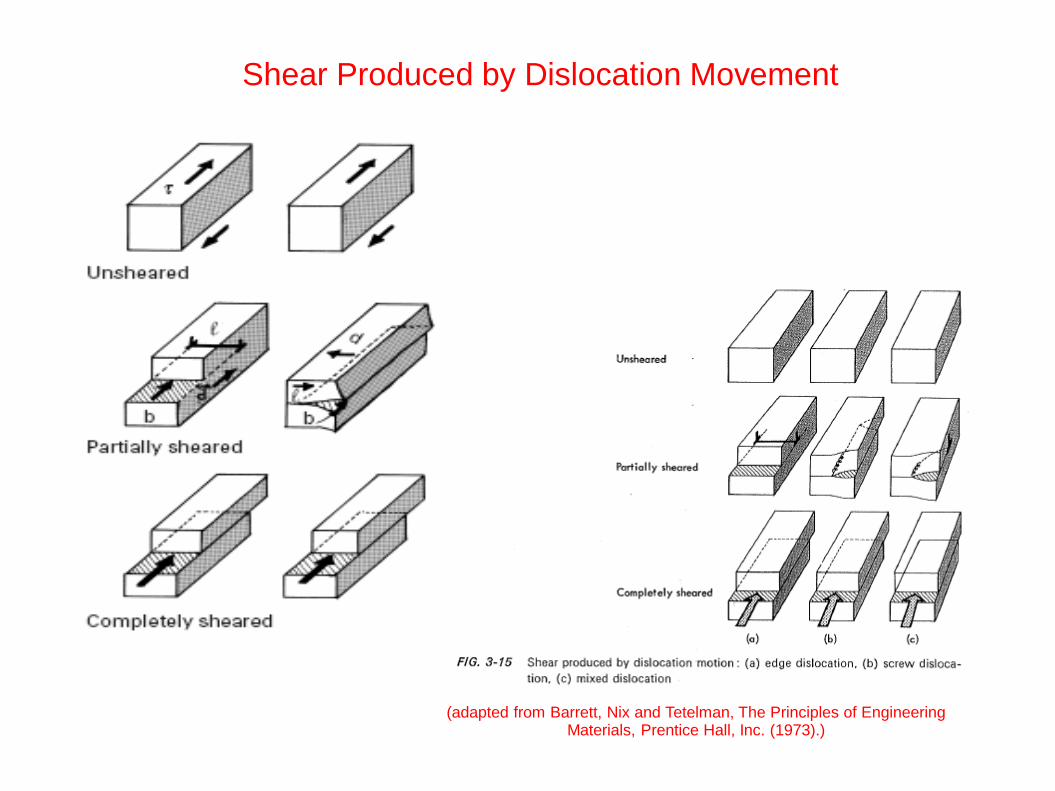
Shear Produced by Dislocation Movement
(adapted from Barrett, Nix and Tetelman, The Principles of Engineering Materials, Prentice Hall, Inc. (1973).)

Mixed dislocation obtained from cut-
and-shear operation; notice the anglebetween b and dislocation line.
Mixed Dislocation

(a) Titanium. (Courtesy of B. K. Kad.) (b) Silicon.
Dislocations in Metals

Dislocations in (a) Al2O3 and (b) TiC. (Courtesy of J. C. LaSalvia.)
Dislocations in Al2O3 and TiC

Atomic resolution transmission electron micrograph of dislocation inmolybdenum with a Burgers circuit around it. (Courtesy of R. Gronsky.)
Dislocation in Molybdenum

Square Dislocation Loop

Elliptic dislocation loop. (a) Intermediate position. (b) Final (sheared) position. (c) TEM of shear
loop in copper. (Courtesy of F. Gregori and M. S. Schneider.)
Elliptic Dislocation Loop

Prismatic loop produced by the introduction
of a disk into metal. (a) Perspective view. (b) Section AAAA. (c) Section BBBB.
Prismatic Loop

Slip produced by the movement of dislocation.
(a) Positive and negative edge dislocations. (b) Positive and negative screw dislocations.
Movement of Dislocation

Expansion of a Dislocation Loop

Stresses due to Dislocations
Screw Dislocation Edge Dislocation

Stress fields around an edge
dislocation. (The dislocation line is Ox3), (a) σ11; (b) σ22; (c) σ33; (d) σ12. (Adapted with permission from J. C. M. Li, in Electron Microscopy and Strength of Crystals, eds. G. Thomas and J. Washburn (New York: Interscience Publishers, 1963).)
Stress Fields Around a Edge Dislocation

Energy of a Dislocation

Schematic representation of an idealized dislocation array (a) in two dimensions (b) in three dimensions; note that dislocations on three perpendicular atomic planes define a volume V.
Dislocation Array

Bending of a Dislocation

Dislocations in an FCC Crystal

Peach-Koehler Equation

Decomposition of a dislocation b1 into two partial dislocations b2
and b3, separated by a distance d0.
Decomposition of Dislocation

Stacking Fault Energies of Some Metals

Short segment of stacking fault in AISI
304 stainless steel overlapping with coherent twin boundary. Differences in the nature of these defects are illustrated by fringe contrast differences.
Stacking Fault and Partial Dislocations
Dislocations in AISI 304 stainless steel splitting
into partials bounded by short stacking-fault region. Partials spacing marked as d. (Courtesy of L. E. Murr.)

Effect of stacking-fault energy on dislocation
substructure. (a) High-stacking-fault-energy material (pure copper); (b) Low-stacking-fault-energy material (copper–2 wt% aluminum).
Both materials were laser-shock compressed with an initial pressure of 40 GPa and pulse duration of 3 ns. (Courtesy of M. S. Schneider.)
Effects of Stacking-Fault Energy on Dislocation Substructure

Frank or Sessile dislocations.
(a) Intrinsic. (b) Extrinsic.
Frank or Sessile Dislocations

Cottrell–Lomer lock.
Stairway dislocation.
Cottrell –Lomer and Stairway Dislocations

Basal, pyramidal, and prism plane in HCP structure.
Important Planes in HCP Structure

Temperature for Macroscopic Plasticity in Some Ceramics

Slip Systems and Burgers Vectors in Some Ceramics

Screw Dislocation
Edge Dislocation
General Form
Expressions for Energy of Dislocation

Basal Plane in Al2O3

Elastic Energy for Dislocations in Ceramics

(a) Dislocations, dipoles, and loops in sapphire.
(b) Interaction between dislocations insapphire. (From K. P. D. Lagerdorf, B. J. Pletka, T. E. Mitchell, and A. H. Heuer, Radiation Effects, 74 (1983) 87).
Dislocations in Sapphire

Hexagonal array of dislocations in titanium diboride. (Courtesy of D. A. Hoke and G. T. Gray.)
Stacking faults in GaP.
(Courtesy of P. Pirouz.)
Dislocations in Titanium Diboride

Homogeneous Nucleation of Dislocations

Emission of dislocations from ledges in grain boundary, as observed in transmission electron microscopy during heating by electron beam.
(Courtesy of L. E. Murr.)
Grain Boundary as a Source of Dislocations

Effect of oxide layer on the tensile properties of niobium.(Reprinted with permission fromV. K. Sethi and R. Gibala, ScriptaMet. 9 (1975) 527.)
Effect of Oxide Layer on the Tensile Properties of Niobium

Formation of dislocation loop by the Frank–Read mechanism.
Frank-Read Mechanism
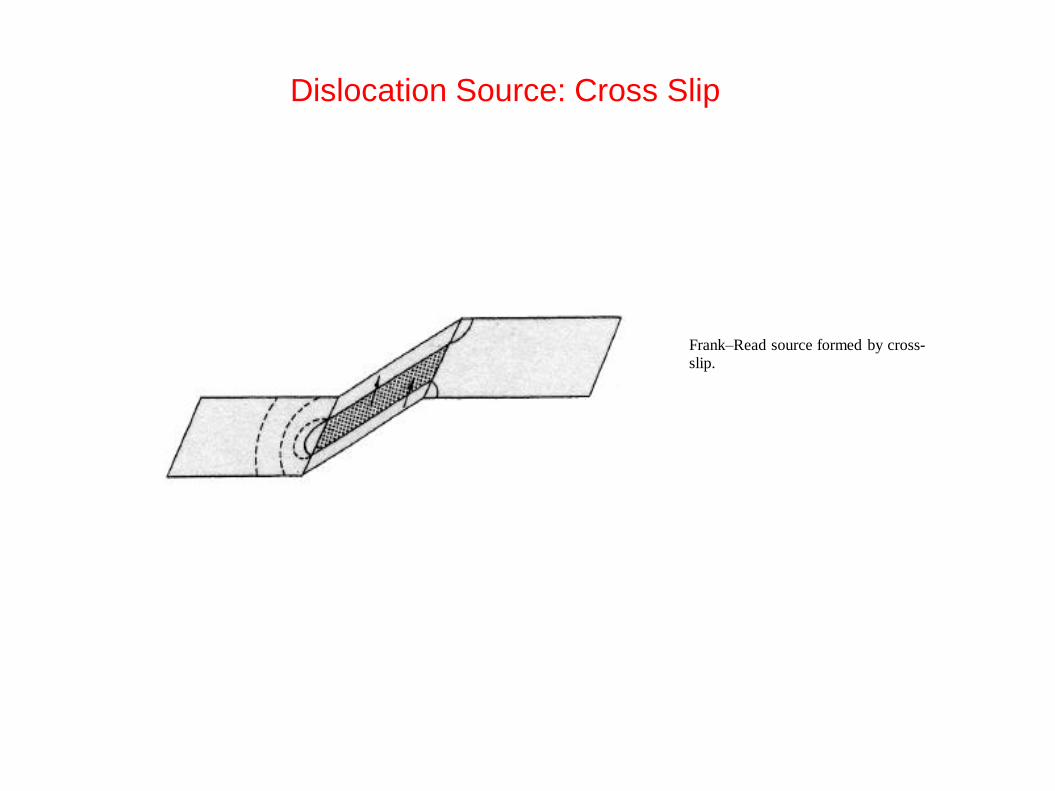
Frank–Read source formed by cross-
slip.
Dislocation Source: Cross Slip

Epitaxial growth of thin film. (a) Substrate.
(b) Start of epitaxial growth. (c) Formation ofdislocations.
Epitaxial Growth

Pileup of dislocations against a
barrier.
Pileup of dislocations against grain
boundaries (or dislocations being emitted from grain boundary sources?) in copper observed by etch pitting.
Dislocation Pileups

)a) Edge dislocation traversing “forest”
dislocation. (b) Screw dislocation traversing “forest” dislocations.
Dislocation Interactions

(a) Kink and jog in edge dislocation. (b)
Kink and jog in screw dislocation.
Loop being pinched out when jog is left behind
by dislocation motion.
Kinks and Jogs in Dislocations

Orowan’s Equation
k b

(a) Movement of dislocation away from its equilibrium position. (b) Variation of Peierls–Nabarro stress with distance. (Reprinted with permission from H. Conrad, J. Metals, 16 (1964), 583.)
Peierls-Nabarro Stress

Overcoming of Peierls barrier by Seeger kink pair mechanism.
(a) Original straight dislocation. (b) Dislocation with two kinks. (c) Kinks moving apart.
Overcoming of Peierls Barrier

Effect of temperature on Young’s modulus. (Adapted from J. B. Wachtman Jr.,W. E. Tefft, D. G. Lam, Jr., and C. S. Apstein, J. Res. Natl. Bur. Stand., 64A (1960) 213; and J. Lemartre and J. L. Chaboche, Mechanics of Solid Materials, Cambridge: Cambridge
University Press, 1990, p. 143.)
Temperature Effect on Young’s Modulus

Flow stress as a function of temperature for (a) an idealized material, (b) BCC metals, and (c) FCC metals. Notice the greater temperature dependence for Ta and Fe (BCC).
Flow Stress as a Function of Temperature

Stresses and dislocations generated at film-substrate interface; (a) Film and substrate with different lattice parameters; (b) elastic (coherent) accommodation of strains by film;(c) elastic + dislocation (semi-coherent) accommodation of strains at a film thickness greater than hc.(Adapted from W. D. Nix, Met. Trans., 20A (1989)2217.)
Dislocations on Film-Substrate Interface

Critical film thickness as a function of misfit strain;
the greater fraction Ge, the greater the misfit stain and the smaller hc. Predictions from van der Merwe Matthews theory; measurements from J. C. Bean, L. C. Feldman, A. T. Fiory, S. Nakahara, and I. K. Robinson, J. Vac. Sci. Technol. A, 2 (1984) 436.(Adapted from W. D. Nix., Met. Trans., 20A (1989) 2216.)
Critical Film Thickness vs. Atomic Fraction of Ge

Mechanisms of misfit dislocation generation; (a)
Freund mechanism in which a “threading”dislocation preexisting in substrate lays over interface creating misfit dislocation; (b) Nix mechanism, in which a surface source creates
half-loops that move toward interface.
Misfit Dislocation Generation