meat and potatoes - rockefeller university
TRANSCRIPT

Meat and Potatoes and theAmerican LandscapeJesse H. Ausubel
Sheriff ’s Meadow Foundation lecture
Old Whaling Church, Edgartown, Massachusetts8 July 2014

2
Meat and Potatoes and the American Landscape
AcknowledgmentsThanks to Adam Moore and the Sheriff’s Meadow Foundation for the opportunity
to offer this lecture. Sheriff’s Meadow accomplishes its goals because of a hard-working professional staff as well as volunteers, including Chris Alley, Rob McCarron, Leah Smith, and many others well known to people concerned with keeping nature vibrant on Martha’s Vineyard. I would also like to thank the Preservation Trust for the use of this historic Greek Revival building made yet more beautiful this year by the restoration of the trompe l’oeil murals painted in the 1840s. We are lucky to have Sheriff’s Meadow, Preservation Trust, and other organizations such as the Vineyard Conservation Society devoted to the health of the Island’s nature and culture.
This lecture is a companion to the essay “Peak Farmland and Potatoes,” http://phe.rockefeller.edu/docs/Peak%20Farmland%20and%20Potatoes.pdf.
For further information and references, please see:
Ausubel, J.H. “The great reversal: Nature’s chance to restore land and sea.” Technology in Society 22: 289–302, 2000.
Ausubel, J.H., and P.E. Waggoner. “Quandaries of forest area, volume, biomass, and carbon explored with the forest identity.” Connecticut Agricultural Experiment Station Bulletin 1011: 1–3, 2007.
Kauppi, P.E., J.H. Ausubel, J.-Y. Fang, A.S. Mather, R.A. Sedjo, and P.E. Waggoner. “Returning forests analyzed with the forest identity.” Proc Natl Acad Sci USA 103: 17574–17579, 2006. doi: 10.1073/pnas.0608343103.
Rautiainen, A., I. Wernick, P.E. Waggoner, J.H. Ausubel, and P.E. Kauppi. “A national and international analysis of changing forest density.” PLoS ONE 6(5): 2011.
Waggoner, P.E., J.H. Ausubel, and I.K. Wernick. “Lightening the tread of population on the land: American examples” (PDF). Population and Development Review 22(3): 531–545, 1996.
Thanks to Paul E. Waggoner (Connecticut Agricultural Experiment Station) and Iddo K. Wernick and Alan S. Curry (Rockefeller University) for their help in preparing this lecture, and H. Dale Langford for editorial assistance.
Jesse H. Ausubel is the director of the Program for the Human Environment at The Rockefeller University in New York City, http://phe.rockefeller.edu.
Suggested citation:
Ausubel, Jesse H. 2014. “Meat and Potatoes and the American Landscape.” Sheriff’s Meadow Foundation lecture, Old Whaling Church, Edgartown, Mass. 8 July 2014. http://phe.rockefeller.edu/docs/Meat&Potatoes_100514.pdf.

3
The essential business of the Sheriff’s Meadow Foundation is land use and land cover, the mix of forest, farm, and town, and that mix is my subject, particularly how our choices as consumers and eaters affect it. I will speak about America as a whole, and
relate American experience to the global experience as well as our experience here on the island of Martha’s Vineyard.
I would like to introduce you to some major concepts, including the forest transition, great reversal, peak farmland, precision agriculture, global greening, and re-wilding. I will also explain why humans have short stomachs and describe the state of potato and fish farming. In the end, I conclude that the outlook for the land of America and the world is actually quite good, but our little island of about a hundred square miles faces disproportionate pressures, in part because we have already taken the benefits of some of these trends.
Grey’s Raid Let me begin with a famous
episode in Vineyard history, Grey’s Raid. In September 1778, British Major General Charles Grey (Figure 1) raided Martha’s Vineyard. Between September 10 and 15 we surrendered 300 oxen and 10,000 head of sheep, as well as most of the Island’s weapons. Focus on the 10,000 sheep, which were only a portion of the Island’s herd. With good pasture, a farmer keeps about 5 sheep per acre, similar to present zoning for summer people, who are sometimes mistaken for sheep. Sheep provided not only meat but winter coats and blankets, and Islanders dammed Fulling Mill Brook to process the wool. And the residents, who had no choice but to be locavores, craved oranges and lemons, and rum.
Half the Island’s present State Forest might have been pastureland just for the sheep Grey seized. Many of you have probably seen a fascinating
compilation of photos of the Vineyard taken recently and a hundred years ago or so. The old photos show the Island had been stripped of its woods. Our many stone walls prove the land was all grazed and farmed.
Figure 1. Major General Charles Grey by Joseph Collyer. Source: Wikimedia Commons.

4
Meat and Potatoes and the American Landscape
Forests Now let’s advance to about 1900, the golden age
of railroads. Today rail transport enjoys a green and friendly image. Thinking back to the expansion of the railroads in the nineteenth century, we tend to think of coal and iron. But railroads were largely wooden systems in their early development. The “iron horse” was something of a misnomer. Much fuel for locomotives was wood, cars were wood, trestles were wood, and, most important, crossties were wood. President Theodore Roosevelt worried in 1905 at the American Forest Congress that a timber famine in the future was inevitable because of the demand for crossties. An industry leader in 1906 even described railroads as the “insatiable juggernaut of the vegetable world.”
America averted the forecast crisis, initially with creosote (distilled tar) and other technologies that tripled the life of crossties, and later by replacement of wooden ties by concrete ties. In the 1920s the length of the railroad network itself
reached saturation so that demand for both new and replacement ties decreased.
Since about 1950 both the area and the volume of wood in American forests has increased (Figure 2). This should not surprise New Englanders or Vineyarders. Regrowth of forests has happened here. Basically, the coast of New England is urbanized and the interior is once again a large forest, as it was at the time of European settlement. The shoreline of the Vineyard is likewise extensively settled, while the interior is a forest.
This change from loss to gain of forest is called the forest transition by professional foresters, and it has happened in 60 or more countries. The first recorded forest transition was in France about 1830 (Figure 3). Since then French population has doubled and so has forest area. The paradoxical pair demonstrates that people and forests can grow together.
After 1830 the forest transition spread from the lowlands of Denmark to the mountains of Switzerland and highlands of Scotland and on to
Russia. Consider 29 countries around the Mediterranean and Black seas that made up the Roman Empire. Since 1990, 26 of the 29 countries expanded the area of their forests. Of the 26 countries reporting forest density, which measures the volume of wood per unit of forest area, all but one reported increase. Spain again has forest fires because Spain again has forests, which it had largely cut a few hundred years ago. Since 1990 even the Asian forests of Vietnam, India, and China have expanded again.
Brazil’s net deforestation is slowing rapidly and its forests should be net gainers by 2020. Indonesia remains a tragic situation with large losses and few signs of reversal, and there are other nations, usually poor and
Forest transition
Forest cover
Population
Popu
latio
n (m
illio
ns)
70
60
50
40
30
20
10
0
40
35
30
25
20
15
10
5
01500 1600 1700 1800 1900 2000
Fore
st c
over
(per
cent
)
Figure 3. Trends in modern French forest area and population. The vertical bar marks France’s first recorded forest transition, about 1830. Forest area has more than doubled since its nadir.Source: Kauppi et al. (2006).
Figure 2. US forests: Volume grows since 1953, area since 1987. Data source: USDA Forest Service.
0
200,000
400,000
600,000
800,000
1,000,000
1,200,000
1950 1960 1970 1980 1990 2000 2010 2020
Growing stock, US 1953–2012
Mill
ions
of c
ubic
feet
490,000
495,000
500,000
505,000
510,000
515,000
520,000
525,000
530,000
1950 1960 1970 1980 1990 2000 2010 2020
Timberland area, US 1953–2012
Tho
usan
ds o
f acr
es

5
Jesse H. Ausubel
tropical, that have not yet entered the transition.
Back to the USA. By the end of the ninteenth century, population growth, increasing wealth, the Industrial Revolution, and expanding agriculture had shrunk the expanse of US forests about 30 percent from the pre-European settlement condition. Since 1900 American population has more than tripled. Combined, growing population and personal wealth multiplied gross domestic product almost 20 times. But US consumption of the embracing category of “roundwood” peaked at only about twice the 1900 level and fell more than 30 percent from the 1995 peak of about 538 million cubic meters to about 368 million cubic meters in 2011.
The main reason is that wood is losing its three big markets: fuel, solid products, and pulp and paper. Coal and oil and more recently electricity have undercut use of fuelwood. Steel, concrete, and plastic have superseded countless two-by-fours and wood in crossties, furniture, and barrels. Lots of people used to be named Cooper because they made barrels. Now I doubt anyone in the room knows a cooper with a small c. New preservatives for wood prevented fire and decay.
Early in the twentieth century, US paper use grew dramatically but recently iPADs and other devices overcame the growing population and affluence to cut pulpwood consumption. In only four years between 2008 and 2012, e-mail and the Internet caused US mail volume to drop by 500 billion letters, about one-quarter.
This example shows that sometimes help does come from unexpected places. Not many people expected Apple Computer to save forests. Some environmentalists have proposed distributing Viagra free in China to ruin the market for tiger bone and rhino horn.
Consumers also spare forests by recycling fiber to paper mills. Millers themselves use about 120 million fewer cubic meters of roundwood a year than they did four decades ago by making more complete use of what they do cut. And foresters reduce the hectares harvested by increasing the growth rate of trees per hectare, often by planting trees.
Although population and wealth multiplied, the changes in consumer behavior and producer practices, encouraged by the conservation movement and technology development, combined during the twentieth century to slow the clearing of forests and allowed forest regeneration. Former pastures in New England and the upper Great Lakes states
are now mature forests. While expanding cities and new logging will affect future forest clearing, the spatial extent of logging in the USA could drop by half in 50 years. Benefits of such sustained diligence include preserving a national treasure, sparing land for undisturbed nature, and sequestering carbon from the atmosphere.
Great Reversal Studying forests in the 1990s, I began to hypo-
thesize that humanity had reached an inflection point in development about 1970, when the rate of human population growth peaked. And during the past five years Earth has probably passed “peak child,” the year when the peak number of children arrived on the planet. Fertility rates have been dropping almost everywhere, and often steeply (Figure 4).
Examples not only from human population and forestry but also energy, materials, and water use suggest that a “Great Reversal” is under way. In the middle of the twentieth century, humans began to reverse the pattern they followed for millennia of extending further into Nature to meet needs for food and materials.
Peak Farmland In fact, in an article published in 2013, Paul
Waggoner, Iddo Wernick, and I reported that humanity’s use of cropland has also probably reached an inflection point we call “Peak Farmland” and that a large net global restoration of land to Nature is ready to begin. Farming is humanity’s biggest use of Nature. Farms use about ten times as much land as cities. We project that world farmers will release land in coming decades, gradually or quite fast. Happily, the cause is not exhaustion of arable land, as many have feared, but rather moderation of population and
Figure 4. Peak Child? Population growth slowing at all levels of development.Source: The European Financial Review, February 2013.
Tota
l fer
tilit
y ra
te

6
Meat and Potatoes and the American Landscape
tastes, and ingenuity of farmers aided by advances in technology.
First, consider how income changed in relation to food. While world GDP more than tripled, food supply increased only a little (Figure 5). Hunger does not explain the decoupling of food and income. Fewer people are starving today than in 1970, and billions more are well fed. Rather, as people become richer, after they get enough to eat, they spend their discretionary income on phones, health care, and education, not calories.
Moreover, the ingenuity of farmers means that less land can produce more calories. Let’s honor, for example, the incredible decoupling of American corn from American land (Figure 6). Until about 1940 our corn yields were steady and acreage determined our corn production. They were a tandem bicycle. Then, thanks to nitrogen fertilizer, better seeds, closer spacing of plants, and a family of other innovations, production and acreage decoupled. American corn farmers now grow about five times as many bushels on the same acreage as they did in 1940.
Can the remarkable rise of yields and fall of land area farmed per unit of crop production continue? Recent decades show a reassuring continuation of the rising yields and sparing of cropland. In 2013, the National Corn Growers Association reported that farmer David Hula in Virginia, not Iowa or Illinois, grew a record 454 bushels per acre, or 28 tons per hectare, three times more than the average American grower and almost six times more than the world average grower. The inside of Mr. Hula’s combine is instrumented like the cubicle of a Wall Street high-speed trader. As I will discuss later, Mr. Hula added lots of information to his farm.
Mr. Hula grew enough calories per acre to feed 100 people for a year. Early Vineyarders grew enough to feed 4 or 5. Humanity, on average, is nowhere near the limits to growth of corn or other crops.
For millennia food production tended to grow in tandem with land used for crops. Now land for food is flat. I believe humanity now stands at peak use of farmland, and the twenty-
0
2
4
6
8
10
12
14
16
18
1850 1870 1890 1910 1930 1950 1970 1990 2010
1866
= 1 Corn acreage
Corn production
Figure 6. Food: decoupling of USA bushels and acres. Source: US Census Bureau (1975, 2012).
0
200
400
600
800
1000
1200
1400
1600
1800
1960 1980 2000 2020 2040 2060
Mill
ion
hect
ares
Data 1961–2009
Projection 2010–60 (base case)
Projection 2010–60 (alternative)
Figure 7. Peak farmland? Global arable land 1961–2009 and projections to 2060. Source: Ausubel, Wernick, and Waggoner (2012).
0
1
2
3
4
1960 1970 1980 1990 2000 2010 2020
Food supply (kcal/capita/day)
World GDP
1970
= 1
Figure 5. Global decoupling of dollars and calories.Data sources: UNFAO (2013); Maddison Project (2013).

7
Jesse H. Ausubel
first century will see release of vast areas of land, hundreds of millions of hectares, many times the area of Iowa, for Nature (Figure 7).
With conservative assumptions, the world outlook is a net reduction in use of arable land in about 50 years totaling 10 times the area of Iowa, and shrinking global cropland to the level of 1960. If electric or natural gas vehicles win in the market and spoil the gasoline market for corn, soy, and sugar cane, the drop could be much larger, as I will explain.
Affluence and food consumptionLet’s now turn to the actual crops and how they
are used. Most land of course is used for staples,
especially wheat, corn, rice, and soy, say 80 percent. Per capita consumption of such staples does not rise in step with affluence and tempers the rise of food consumption. The response to wealth is caught between the limits of starvation below about 2,000 kilocalories per person per day and obesity near 4,000. We can supersize a market, but not for long.
Consumption of meat, more than calories, rises with affluence. Consumers may spend more in restaurants, and they may eat more meat and spend more per potato, but not eat more pounds of potatoes. Satiation will relieve a considerable portion of upward pressure of population and affluence on cropland expansion. Wallis Simpson, the one-
time American Duchess of Windsor, famously remarked, “You can never be too rich or too thin,” and some evidence suggests that style now favors diets leaner in calories and meats.
The second choice for consumers is whether to demand non-food products from land. Historically, non-food agricultural products included cotton and flax for clothing, hemp for rope, tobacco for smoking, and hay to fuel horses. Farmers are always searching for profitable crops.
Let’s now look at historical paths of the absolute use or consumption by weight of eight farm products to see where they might lead (Figure 8). Up to 1970, absolute crop use was increasing. The exception was cotton, a non-food crop and America’s largest export from 1805 to 1937, which peaked about 1940. Wheat, the classic food grain, fluctuated around a plateau after 1980. Potatoes hiked upward in the 1980s and 1990s but since have started downward. Pork, like potatoes, rose until about 2000, but has been flat since then. Beef has been flat since about 1970. Cotton consumption has dived the past 20 years. Since 1970, consumption of chickens, corn, and soybeans maintained steep upward trajectories.
Now let’s look at what Americans actually grow (Figure 9). About half the total tonnage is a tower of corn. The 314 million tons of corn and 84 million tons of soybeans overshadow the 54 million tons of wheat and dwarf the smaller tonnages of rice and meats, as well as potatoes. In practice most soybeans become meal for chickens
0.1
1
1900 1920 1940 1960 1980 2000
1970
= 1
Chicken
Corn
Soybeans
Wheat
Pork
Potatoes
Beef
Cotton
Figure 8. US consumption of eight crops and meats: Changing trends, semi-log scale. Note that chicken and corn lead the pack.Data source: USGS (2013); USDA (2013).
0.0
0.5
1.0
1.5
2.0
2.5
3.0
3.5
Potatoes Maize Soybeans Wheat Chicken Beef Pork Rice
Hun
dred
mill
ion
tons
Figure 9. Corn towers: US selected crops and meats produced 2011.Data sources: USDA; US Census Bureau. (1975, 2012).
8
Meat and Potatoes and the American Landscape
and only a few become tofu for people to eat directly.
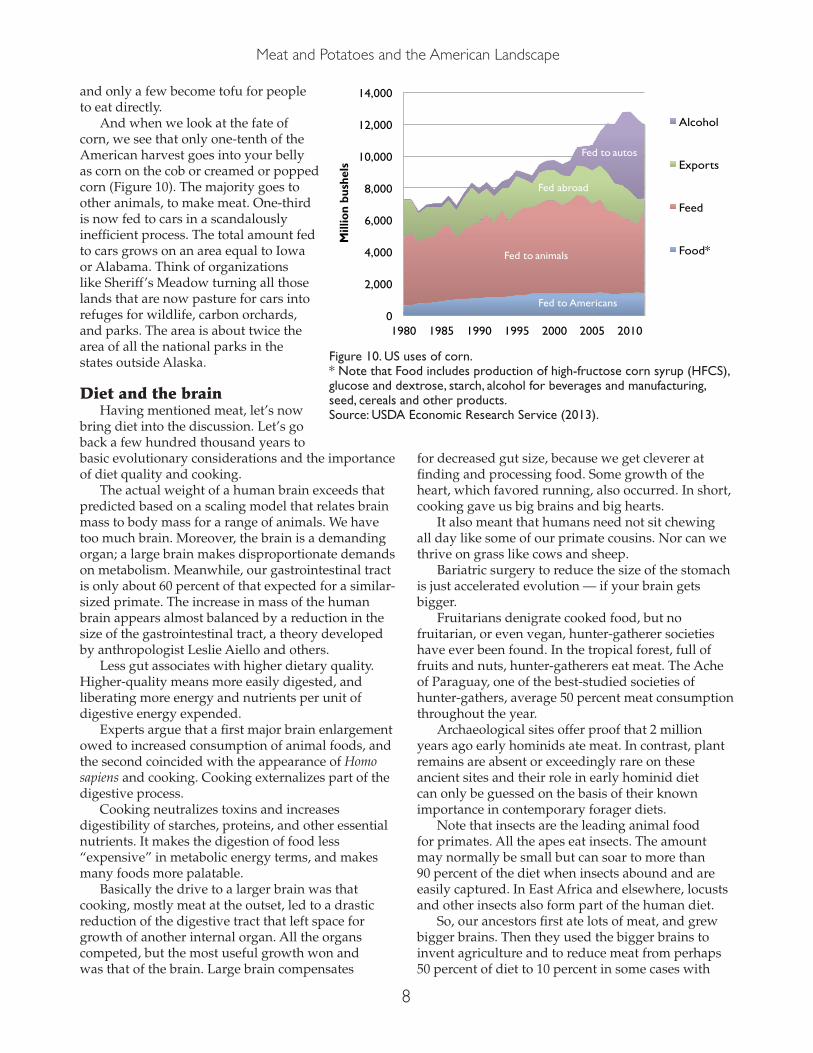
And when we look at the fate of corn, we see that only one-tenth of the American harvest goes into your belly as corn on the cob or creamed or popped corn (Figure 10). The majority goes to other animals, to make meat. One-third is now fed to cars in a scandalously inefficient process. The total amount fed to cars grows on an area equal to Iowa or Alabama. Think of organizations like Sheriff’s Meadow turning all those lands that are now pasture for cars into refuges for wildlife, carbon orchards, and parks. The area is about twice the area of all the national parks in the states outside Alaska.
Diet and the brain Having mentioned meat, let’s now
bring diet into the discussion. Let’s go back a few hundred thousand years to basic evolutionary considerations and the importance of diet quality and cooking.
The actual weight of a human brain exceeds that predicted based on a scaling model that relates brain mass to body mass for a range of animals. We have too much brain. Moreover, the brain is a demanding organ; a large brain makes disproportionate demands on metabolism. Meanwhile, our gastrointestinal tract is only about 60 percent of that expected for a similar-sized primate. The increase in mass of the human brain appears almost balanced by a reduction in the size of the gastrointestinal tract, a theory developed by anthropologist Leslie Aiello and others.
Less gut associates with higher dietary quality. Higher-quality means more easily digested, and liberating more energy and nutrients per unit of digestive energy expended.
Experts argue that a first major brain enlargement owed to increased consumption of animal foods, and the second coincided with the appearance of Homo sapiens and cooking. Cooking externalizes part of the digestive process.
Cooking neutralizes toxins and increases digestibility of starches, proteins, and other essential nutrients. It makes the digestion of food less “expensive” in metabolic energy terms, and makes many foods more palatable.
Basically the drive to a larger brain was that cooking, mostly meat at the outset, led to a drastic reduction of the digestive tract that left space for growth of another internal organ. All the organs competed, but the most useful growth won and was that of the brain. Large brain compensates
for decreased gut size, because we get cleverer at finding and processing food. Some growth of the heart, which favored running, also occurred. In short, cooking gave us big brains and big hearts.
It also meant that humans need not sit chewing all day like some of our primate cousins. Nor can we thrive on grass like cows and sheep.
Bariatric surgery to reduce the size of the stomach is just accelerated evolution — if your brain gets bigger.
Fruitarians denigrate cooked food, but no fruitarian, or even vegan, hunter-gatherer societies have ever been found. In the tropical forest, full of fruits and nuts, hunter-gatherers eat meat. The Ache of Paraguay, one of the best-studied societies of hunter-gathers, average 50 percent meat consumption throughout the year.
Archaeological sites offer proof that 2 million years ago early hominids ate meat. In contrast, plant remains are absent or exceedingly rare on these ancient sites and their role in early hominid diet can only be guessed on the basis of their known importance in contemporary forager diets.
Note that insects are the leading animal food for primates. All the apes eat insects. The amount may normally be small but can soar to more than 90 percent of the diet when insects abound and are easily captured. In East Africa and elsewhere, locusts and other insects also form part of the human diet.
So, our ancestors first ate lots of meat, and grew bigger brains. Then they used the bigger brains to invent agriculture and to reduce meat from perhaps 50 percent of diet to 10 percent in some cases with
0
2,000
4,000
6,000
8,000
10,000
12,000
14,000
1980 1985 1990 1995 2000 2005 2010 M
illio
n bu
shel
s
Alcohol
Exports
Feed
Food* Fed to animals
Fed to autos
Fed to Americans
Fed abroad
Figure 10. US uses of corn. * Note that Food includes production of high-fructose corn syrup (HFCS), glucose and dextrose, starch, alcohol for beverages and manufacturing, seed, cereals and other products.Source: USDA Economic Research Service (2013).

9
Jesse H. Ausubel
a large rise in grain consumption. And in the last century we achieved such large harvests of corn and soybeans that we could resume a meaty diet. Or, successful corn farmers forced the invention of hamburgers, and successful soy farmers forced the invention of chicken nuggets.
Meat and landObviously, meat production uses lots of land,
but has meat recently eaten more American land? Land used for meat depends on preference for meat, feed conversion efficiency (the kilograms of feed to produce a kilogram of meat), and yield or the hectares needed to produce a kilogram of feed. With Paul Waggoner and Iddo Wernick, I examined the USA between 1967 and 1990, when McDonald’s restaurants multiplied especially fast. Surprisingly, US land used to make meat actually shrank in that interval because the feed needed to make meat declined and the hectares needed to grow the feed lessened as yields rose. Net, about 2 percent less US land each year made meat.
Then there is the question of different kinds of meat. An average American annually eats about 50 kilograms of pork, beef, and lamb and 30 kilograms of poultry and consumes about 15 kilograms of eggs. Americans also drink more than 250 kilograms of milk in glasses or eat the equivalent cheese and ice cream. It is easy to appreciate the role of ice cream on a summer day on Martha’s Vineyard.
What does the world eat? In a year it now eats about 75 million tons of pigs; 50 of beef; and 10 of buffalo, goats, and sheep. It eats almost 200 million tons of poultry and 40 of eggs. Adding about 450 million tons of milk pushes the total over 800 million tons.
Chickens are winning, in the USA and globally, and it is easy to understand why. Think of cattle, pigs, and poultry as automobiles with different fuel efficiency. Relatively speaking, cattle get 12 miles per gallon (mpg), pigs 40 mpg, and chickens 60 mpg. It is not surprising that farmers are shifting to the biological machine with the high efficiency.
Obviously free-range is an option only for a tiny elite in a carnivorous world of 7 billon humans. Running wild, about four hogs can share an acre. Running wild, today’s world population of 1 billion hogs alone would require about 250 million hectares, more than one-fifth the
land of the USA. People complain about industrial hog farms, but running wild, growing herds denude landscapes. To decouple animal agriculture from damaging the land, farmers instead grow high yields of crops, such as corn and soybeans, to feed the animals.
Aquaculture Now let’s think a bit about the form of meat
called fish, like the blue fin tuna in the Tokyo fish market. Sea life is astonishingly delicious, and tastier and more varied in markets than ever, owing to improved storage and transport. Before the advent of refrigeration, fresh sushi was a delicacy for the emperor of Japan. We may say that the democratization of sushi has changed everything for sea life. Survival is hard, even if you can leap at 60 miles per hour like a swordfish.
Fish biomass in intensively exploited fisheries appears to be about one-tenth the level of the fish in those seas a few decades or hundred years ago. Diverse observations support this estimate. For example, the diaries of early European settlers describe marvelous fish sizes and abundance off New England in the 1600s. The average swordfish harpooned off our coast dropped in size from about 270 kilograms in 1860 to about 100 kilograms in 1930 (Figure 11).
How does world consumption of fish that depletes the oceans compare to the 800 million tons of animal products humanity eats? About 80 million tons of fish are taken wild from the sea and a fast-growing 60 million tons from fish farms and ranches.
Americans eat relatively little fish, only about 7 kilograms per person in a year. Much of that 7 kilograms, however, is taken from the wild schools of the sea, and that fraction of total diet, though small,
Figure 11. Decline of large marine animals. From 1860 to the present, the average weight of swordfish, Xiphias gladius, caught off the North American coast by either harpoons or lines declined from as much as 270 to near or less than 100 kilograms. A big drop occurred from 1860 to 1930. Source: Census of Marine Life (2010) p. 28.

10
Meat and Potatoes and the American Landscape
depletes the oceans. The ancient sparing of land animals by farming shows us how to spare the fish in the sea. We need to raise the share we farm and lower the share we catch.
Fish farming does not require invention. It has been around for a long time. The Chinese have been doing very nicely raising herbivores, such as carp, for centuries. Following the Chinese example, one feeds crops grown on land by farmers to herbivorous fish in ponds. Much aquaculture of catfish near the Gulf Coast of the US and of carp and tilapia in Southeast Asia and the Philippines takes this form. The fish grown in the ponds spare fish from the ocean. Like poultry, fish efficiently convert protein in feed to protein in meat. And because the fish do not have to stand, they convert calories in feed into meat even more efficiently than poultry. Let’s say 80 miles per gallon.
All the improvements such as breeding and disease control that have made poultry production more efficient can be and have been applied to aquaculture, improving the conversion of feed to meat and sparing wild fish.
In some fish ranching, notably most of today’s ranching of salmon, the salmon effectively graze the oceans, as the razorback hogs of a primitive farmer would graze the oak woods. Such aquaculture consists of catching wild “junk” fish or their oil to feed to our herds, such as salmon in pens. We change the form of the fish, adding economic value, but do not address the fundamental question of the tons of stocks. A shift from this ocean ranching and grazing to true farming of parts of the ocean can spare others from the present, ongoing depletion. So would persuading salmon to eat tofu.
I have already described fish farming in ponds, and much the same applies for the filter feeders, the oysters, clams, and mussels. With due care for effluents, pathogens, and other concerns, this model can multiply sea meat many times in tonnage. Eventually we might grow fish in closed silos at high density, feeding them proteins made by microorganisms grown on hydrogen, nitrogen, and carbon. The fish could be sturgeon filled with caviar. In fact, much caviar now sold in Moscow comes from sturgeon farmed in tanks in northern Italy.
The point is that the high levels of harvest of wild fishes and destruction of marine habitat to capture them need not continue. The 40 percent of seafood already raised by aquaculture signals the potential for Great Reversal. With
smart aquaculture, we can multiply life in the oceans while feeding humanity and restoring nature.
Potatoes Now after meats, consider potatoes, a vegetable
that I love. I had the privilege in January 2014 of participating in the annual meeting of the United Potato Growers of America. I learned much from the growers as well as the processors and retailers who work with them, and cannot resist sharing some of it. Most important is that American potato farmers grow about 40 percent more tons, while planting about 20 percent fewer acres, than they did 40 years ago. Potato growers are releasing land for other crops and other purposes (Figure 12).
Idaho grows about a third of American potatoes, while other important grower states include Colorado (12%), Washington, Wisconsin, Maine, Michigan, and Florida. So, the success of potato growers affects many landscapes. Parenthetically, many potatoes are irrigated, so fewer acres mean more water in rivers and wells.
Of all the potatoes grown in the USA, about 96 percent are “white” and 4 percent sweet. Of the white potatoes, most are russets (70%), 15 percent are red, and most of the rest are whites and yellows. Fingerlings are only 0.8 percent and purple/blue 0.1 percent, though a much larger fraction at the West Tisbury Farmer’s Market, where Vineyard farmers smartly earn $5 a pound for novel-looking potatoes. Potatoes called organic get 1.8 percent of market.
Another way of looking at the market is that in 2013 about 39 percent of US potatoes were sold frozen, 28 percent delivered fresh to the table, 13 percent sold as chips, 13 percent sold dehydrated,
0
1
2
1950 1960 1970 1980 1990 2000 2010 2020
1970
= 1
Area harvested
Production
Yield
Figure 12. Potato story: US yield, production, and harvested area.Data source: USDA (2013).

11
Jesse H. Ausubel
6 percent used as seed, and 1 percent used in soup. Seventy-five percent of lunch potatoes are fries and 11 percent chips; 68 percent of dinner potatoes are fries, and 25 percent are mashed, baked, and boiled.
As an earlier chart suggested, potato growers had a good American market into the 1990s. The frequency of occurrence over 50 years of the phrases “french fries” and “potato chips” in an enormous collection of 10 million books scanned by Google suggests why (Figure 13). These two products surged into popularity during the 1970s, 1980s, and 1990s. By the way, chips are great for processors and retailers but a tease for growers, who sell by weight, and a big bag of chips is only a few ounces.
In his amusing 1992 autobiography, Grinding It Out, Ray Kroc, the founder of McDonald’s, admits that he was not in the hamburger business; he was in the french fry business. His real genius was finding a way to charge a lot of money for a potato. Kroc rode a wave of social change shown by the surge of fries and chips.
The wave affected not only what but how and where we eat. In 1900, 50 percent of an American’s income went to food, while in 2012 it was less than 10 percent, but an American adult now goes to a restaurant about 200 times per year. Restaurants get about half of the US food dollar. Of the $620 billion Americans spent last year on food, only $175 billion, less than a quarter, went to producers. Of the dollar you spend at Stop & Shop Supermarket or Ben & Bill’s Chocolate Emporium or The Black Dog restaurant, 23 cents on average goes to the farmer or fisher.
It is no wonder people want to be chefs or restaurant managers and not farmers. There are now one million food service establishments in the US. According to the 2007 USDA Census of Agriculture, there are only about 700,000 real farms in the US, and about 60 percent of the farmers are older than 55.
The spectrum of national restaurants both reflects and determines American land and diet. About 8 billion pounds of potatoes go to restaurants (80% to chains) and only 1 billion pounds to retail. And contrary to wishful thinking, all vegetable consumption in North America is falling, including potatoes. Total Canadian vegetable consumption declined from 418 pounds per person in 1987 to 380 pounds per person in 2011, a drop of more than 1.5 pounds per year. All produce is only 12 percent of grocery sales, and 10-pound bags of potatoes are selling a lot less, even 5-pound bags. As a child, I
recall every kitchen had plenty of potatoes, but now they have Chinese take-out menus or a Yelp app.
A fat reason is that consumers now suffer, or feel they suffer, time poverty. Total average adult American food preparation now is only 20 minutes a day and shopping 15 minutes a day. Preparing fresh potatoes and the rest of a meal within 20 minutes is not easy. Convenience is winning, and for the potato this means mainly french fries, mainly served in restaurants. McDonald’s opened in Vietnam this year, and KFC will open 500 restaurants in India in 2015.
While the oil and salt associated with large orders of fries might not be healthy, potatoes are a deeply green vegetable in the sense of land sparing. Potato farmers can grow four to five times as many tons per acre as corn growers grow corn. For calories, the ratio is smaller, but still from the perspective of acres saved, potatoes are a deeply green crop. Land sparing makes the potato an ecological champion.
Before leaving diet, I would like to add a few words about food waste. Until recently and even today in poor nations, “gleaners” filtered fields for the last few potatoes and other crops. While rats and poor storage still cause food losses in poor countries, rich countries discard a scandalous fraction of what we grow. Recent studies suggest that one-third of food purchased both by restaurants and households is discarded. Reducing such food waste is another way to spare land for Nature.
Precision agriculture The news from potato land would be mostly grim
if growers had not also become more efficient in the absolute consumption of major inputs to agriculture (Figure 14). Until about 1980, farmers used sharply more fertilizers and more water each year to grow their crops. But for the last 30 years growers held
“french fries”
“potato chips”
1965 1970 1975 1980 1985 1990 1995 2000 2005
0.0000550
0.0000500
0.0000450
0.0000400
0.0000350
0.0000300
0.0000250
0.0000200
0.0000150
0.0000100
0.0000050
0
Freq
uenc
y (p
erce
nt)
Figure 13. Market penetration of potato chips and french fries. Frequency with which phrases appear in Google’s 10 million book (500 billion word) archive.Source: Google Ngram Viewer.

12
Meat and Potatoes and the American Landscape
absolute use of these inputs flat, while producing much more. Farmers’ economical use of inputs has been amazing. Reducing inputs and thus costs can lift profits just as lifting sales can.
Above all, farmers have been substituting information for material inputs through precision agriculture while sparing use of energy, nitrogen, and other materials. Precision agriculture includes
improved weather forecasts, seeds, spacing of plants, applications of herbicides and pesticides, precision irrigation, and GIS-based machinery, all integrated by farmers working smarter. Basically the strategy for high yields is more technology and information going into agriculture, like David Hula’s combine, that is, more bits, not more gallons or tons.
In fact, you can use not just the same but less. American farmers reported using one-third less lime after putting fields on square-foot satellite grids detailing which areas would benefit from fertilizer. Now, drones, self-steering machines that plant seeds using GPS, can plant a field economically at different depths and spacings, varying according to the weather. Reducing losses through improved storage and processing also spares land.
Importantly, sparing land usually means sparing water. In the mid-1970s six out of seven expert forecasts predicted growing US water use and water shortage, as Teddy Roosevelt had forecast timber famine. A great achievement of Americans during the past 30 plus years is to hold national water withdrawals flat (Figure 15). During this interval our population rose by 80 million, about the population of the nation of Turkey, the economy measured by GDP multiplied two and a half times, and tons of corn and soybeans rose 300 percent, wheat 60 percent, and potatoes 25 percent. Growers get more value from each gallon of water. In the West, of course, water is especially precious, and incentives to spare even more water remain strong.
Technology revolutionized agriculture twice in the twentieth century. The tractor and other machines caused the first revolution,
replacing the 300 oxen that General Grey seized, and eliminating the need to keep about one-quarter of our land for hay for farm horses and other work animals. Nitrogen and other chemicals and improved plant breeding responsible for lifting yields made the second revolution. A third agricultural revolution is coming from information. What do the past and future agricultural revolutions mean for land?
0.1
1
10
1940 1960 1980 2000
Water ABS Water IOU
Figure 15. US water withdrawals: absolute (ABS) and relative to GDP (IOU). Absolute withdrawals have been flat since about 1975, while relative withdrawals have fallen fast.Data source: USGS (2013); Williamson (2014).
0.1
1
1900 1920 1940 1960 1980 2000
1970
= 1
Nitrogen (ammonia)
Potash
Phosphate rock
Water
Cropland
Figure 14. Absolute US consumption of five agricultural inputs. More efficient and precise use shaves cost and raises profit.Data source: USGS (2013); USDA (2013).

13
Jesse H. Ausubel
Global greeningThe vegetation of Earth is never in equilibrium,
but always changing. At present, deforestation and forest degradation still dominate in many low-income, tropical countries, while in high-income countries and most middle-income countries, generally in temperate regions, the forests expand, as we discussed earlier. Experts now refer to the net expansion of forest area and plant biomass as “global greening.”
Researchers first observed global greening in Arctic and boreal regions using satellite images giving a kind of time-lapse picture of the biosphere during the 1980s and 1990s. They interpreted the greening as a sign of longer growing seasons associated with climatic warming. More recently, greening has been observed at the global scale, including in dry Australia, based on analysis of trends in atmospheric chemistry, for example, increasing amounts of carbon dioxide in the atmosphere and also nitrogen in the air and deposited from the atmosphere into soils.
In parallel with the sequence of satellite images of a greener Earth, indications of large-scale greening were reported from field measurements on the ground in the USA and Europe. These earlier observations were not impacts of weather and climate but responses to changing agriculture, forestry, and land management. The largest instance is in Eastern
Europe and the former Soviet Union, where at least 30 million hectares and possibly as much as 60 million hectares of land have been abandoned by farmers and are reverting to woodlands and other landscapes. Thirty million hectares is the area of Poland or Italy or Arizona, a huge opportunity for counterparts of the Sheriff’s Meadow Foundation.
Moreover, in many areas, as we discussed in the forest transition, forests have become denser as well as more extensive. Some combination of the processes
is leading to the phenomenon of global greening. In may not be surprising that Sweden is greening, but a recent report established that Colombia, which earlier suffered extensive deforestation, has enjoyed net greening in the last couple of decades. Chinese colleagues prepared a map of changes in a vegetation index for Europe and Asia using American satellite images taken between 1982 and 2003 (Figure 16). The map shows in blue some areas of net loss, but it shows in red many more areas of net gain, from Portugal through the Balkans and Russia to Japan, and even in China and India.
Global greening affects the carbon budget of the atmosphere, the reflectivity of the land surface, and other important phenomena. We need to understand better why it is happening, and how much further it may go if, for example, we continue to lift yields, reject biofuels, eat less meat, reduce food waste, and spread adoption
of eReaders. The onset of global greening gives environmentalists, who have tended to be defensive, the confidence to propose means for a great restoration of Nature, even as, or especially as, the climate changes.
Re-wildingAbout 25 years ago, American geographers
Deborah and Frank Popper proposed the return of the Great Plains to the buffalo. Their Buffalo Commons proposal would create a vast nature preserve by returning much of the drier portion of the Great Plains to native prairie, and by reintroducing the American bison (“buffalo”), that once grazed the shortgrass prairie. The idea seemed crazy at the time, but now it is actually starting to happen.
This is part of a broader movement of “re-wilding,” in which animals return to habitats from
Figure 16. Global greening: forest loss and gain in Eurasia. Change in normalized density vegetation index (NDVI).Source: National Oceanic and Atmospheric Administration, Advanced Very High Resolution Radiometer (AVHRR) satellite measurements, 1982–2003. Courtesy of Jing-yun Fang.

14
Meat and Potatoes and the American Landscape
which humans have excluded them. There are in fact salmon again in the Seine and Rhine rivers in Europe, seals and whales in New York harbor, and, more problematically, coyotes on Boston Common.
A movement called Revive and Restore has discussed the return of the heath hen to Martha’s Vineyard.1 Globally extinct since 1932, the last heath hen perished here on the Island in 1932, and some researchers think they could use DNA from museum specimens to bring the species back. The proposition raises complex ethical and ecological issues. Whatever the Island decides, the movement may signal a new phase in environmentalism.
ConclusionLet me conclude by bringing back not the heath
hen but rather Major General Charles Grey, 236 years after his visit.
General Grey would be shocked in many ways. He would find neither 300 oxen nor 10,000 sheep. He would find large houses of many rooms occupied by small families with very few children, only a few farms, and lots of forest where sheep had grazed. He would probably be shocked that wood goes unused for timber and fuel. He would be saddened at the
1 Recent events were held on 23 and 24 July 2014 in Chilmark and West Tisbury.
disappearance of cod. He might miss a good boiled potato but enjoy french fries and potato chips. He would be grateful for the diversity of food products available from all over the world throughout the year. In Stop & Shop, though he might miss cheap mutton and wonder at the popularity of chicken, he would puzzle over tofu.
Tourism and the huge seasonal fluctuation in population would also be a shock, as would golf courses and the ratio of about 200 restaurants on the Island to 20 farms. He would find the opportunity for greening created by abandonment of farming and grazing exhausted and a strong desire to sustain the farms the Island has preserved.
These outcomes result from global phenomena that we have discussed — the forest transition, great reversal, peak farmland, precision agriculture, global greening, dietary change — creating pressures and opportunities for a small island.
Most important, General Grey would appreciate that Nature is still the essential business of Martha’s Vineyard. However, the challenge is no longer overgrazing but rather urbanization of the coastline and loss of the rural qualities that attract people and money to the Island. He would make a large donation to the Sheriff’s Meadow Foundation, seize 100,000 cell phones, thus immobilizing the population, and sail away.
SourcesAusubel, J.H., I.K. Wernick, and P.E. Waggoner.
2012. “Peak farmland and the prospect for land sparing,” Population and Development Review 38 (Supplement): 217–238.
Census of Marine Life. 2010. “First Census of Marine Life 2010: Highlights of a Decade of Discovery.”Census of Marine Life International Secretariat, Washington, D.C.
Maddison Project. 2013. Groningen Growth and Development Centre, University of Groningen. http://www.ggdc.net/maddison/maddison-project/home.htm (accessed 2/2/14).
Kauppi, P.E., et al. 2006. PNAS 103:17574–17579.United Nations Food and Agriculture Organization
(UNFAO). 2013. FAOStat database. United States Bureau of the Census. 1975. “Acreage,
production, price, and stocks for selected crops,” Series K 502–516 in Historical Statistics of the United States, Colonial Times to 1970. Washington, DC: US Government Printing Office. http://www2.census.gov/prod2/statcomp/documents/Ct1970p1-01.pdf (accessed 2/2/14).
United States Bureau of the Census. 2012. Statistical Abstract of the United States. Web site of US Bureau of the Census, statistics from the eighteenth century to the present, http://www.census.gov/prod/www/abs/statab.html (accessed 2/2/14).
United States Department of Agriculture (USDA). 2013. Web site of the National Agriculture Statistics Service, http://www.nass.usda.gov/ (accessed 2/2/14).
United States Department of Agriculture (USDA). 2013. Web site of the Economic Research Service, http://www.ers.usda.gov/ (accessed 2/2/14).
United States Geological Survey (USGS), Mineral Information Division. 2013. US Geological Survey Data Series 140 (Supersedes Open-File Report 01-006) Historical Statistics for Mineral and Material Commodities in the United States, http://minerals.usgs.gov/ds/2005/140/#data.
Williamson, S.H. 2014. “What was the U.S. GDP then?” MeasuringWorth. http://www.measuringworth.org/usgdp/ (accessed 2/3/14).
World Bank. 2012. World Databank. http://databank.worldbank.org/ddp/home .do?Step=1&id=4# (accessed 2/2/14).