measuring trypsin inhibitor in soy meal: suggested ... · pdf filesuggested improvements in...
TRANSCRIPT

Measuring Trypsin Inhibitor in Soy Meal:Suggested Improvements in the Standard Method
CLYDE E. STAUFFER'
ABSTRACT Cereal Chem. 67(3):296-302
The parameters involved in the Trypsin Inhibitor Assay (AACC method Michaelis-Menten parameters for the reaction of porcine trypsin with71-10) were examined. The peak absorbance of the difference spectrum substrate at 250C, pH 8.2, 10 mM CaCl2 are determined. For the reactionis at 385 nm rather than 410 nm as presently used; absorbance is 40% with the L-isomer (substrate) KM = 2.20 mM and kcat = 8.92 sec-'. Thegreater at the lower wavelength. The formation of product during the D-isomer is a competitive inhibitor with Ki = 2.33 mM. Methods forincubation of N-benzoyl-DL-arginine p-nitroanilide was not linear with expressing the amount of trypsin used per assay tube in SI units bytime. The effect this has on the numbers derived from the analysis was performing a titration assay on stock trypsin and by a rate assay usingexplored, and it is shown that the inhibitor concentration in a soy extract N-benzoyl-L-arginine ethyl ester are presented. Certain modifications inis underestimated by about 5%. A better method of treating the data the present standard method of trypsin inhibitor assay are suggested thatderived from the assay is given, namely making a direct linear fit to allow determination of inhibitor concentration in soy samples in SI unitsthe absorbance found in the presence of varying amounts of inhibitor. (moles per gram) rather than the present arbitrary TI units.
Measuring trypsin inhibitor, a major antinutritional factor insoy meal, is of importance to soy processors who are concernedwith providing a high-quality product for animal feed. At thistime the standard method uses N-benzoyl-DL-arginine p-nitroanilide as a chromogenic substrate for trypsin, and the abilityof aliquots of soy meal extract to inhibit the activity of trypsintowards this substrate is utilized to estimate the amount of trypsininhibitor in a soy meal sample (AACC 1983; Kakade et al 1969,1974). The amount of p-nitroaniline formed during a 10-min in-cubation is measured spectrophotometrically, and the absorbancevalues in the presence and absence of soy extract are used incalculations that give a number for trypsin inhibitor units (TIU)per gram of original soy sample.
The calculations used to derive TIU from absorbance mea-surements have been questioned (Hamerstrand et al 1981). Theyare somewhat convoluted, requiring more numerical manipulationthan seems necessary. Furthermore, each assay requires severaltrial dilutions, attempting to arrive at a dilution such that thestandard aliquot of 2 ml will give 40-60% inhibition of trypsin.Finally, the definition of one TIU is arbitrary, being the amountof inhibitor that produces a decrease of 0.01 in absorbance.
In this paper I will discuss some of the theoretical and actualshortcomings in the present standard assay method, show howthe experimental data can be treated in a theoretically soundmanner, and indicate how to calculate the concentration of trypsininhibitor in SI units, i.e., moles per gram of sample.
MATERIALS AND METHODS
MaterialsN-benzoyl-DL-arginine p-nitroanilide hydrochloride (BAPA),
N-benzoyl-L-argininep-nitroanilide hydrochloride (B-L-APA), N-carbobenzoxy-L-lysine p-nitrophenyl ester hydrochloride (Z-Lys-pNP), N-benzoyl-L-arginine ethyl ester hydrocholoride (BAEE),dimethylsulfoxide (DMSO), glacial acetic acid (HOAc), and cry-stallized porcine trypsin were all obtained from Sigma ChemicalCo. Citric acid, tris-(hydroxymethyl)-aminomethane (Tris), 1 NHCl, 1 N NaOH, and CaCl2 were purchased from Fisher Scientific.Enzyme-active defatted soy flour was obtained from ADMCompany.
Buffers and stock solutions. A stock solution of 1M Tris-HCl,0.2M CaCl2 buffer contained 12.1 g of Tris, 2.9 g of CaCl2 2H2O,and 37 ml of IN HCl in 100 ml total volume. A 20-fold dilution
'Technical Foods Consultants, Cincinnati, OH 45231.
© 1990 American Association of Cereal Chemists, Inc.
296 CEREAL CHEMISTRY
of this stock had a pH of 8.2, 0.05M Tris-HCl, 0.01M Ca++,and was used for all the enzyme assays to be described. Forthe titration assay of trypsin, the buffer was 0.05M citric acid,adjusted to pH 3.0 with IN NaOH. BAPA stock solution was40.0 mg dissolved in 1.00 ml of DMSO, 92 mM BAPA. ForB-L-APA, the stock solution was 20.0 mg in 1.00 ml of DMSO,46 mM. The stock solution of trypsin titration substrate Z-Lys-pNP was 60 mM, 26.3 mg in 1.00 ml of DMSO. BAEE stocksolution was 150 mM, 51.4 mg in 1.00 ml of DMSO.
Trypsin stock solution. The stock solution for the titration assaywas 50 mg trypsin per milliliter in 0.001N HCl or in 0.05M citratebuffer pH 3.0. Dilutions for measuring absorbance at 280 nmand for enzyme assays were made in 0.OON HCl.
Soy extract. To 0.2 g enzyme-active defatted soy flour wasadded 9.9 ml of water and 0.1 ml IN NaOH. After 3 hr withintermittent stirring, 0.1 ml of the suspension was added to 9.9ml of pH 8.2 buffer and filtered through a 0.45-,um filter.
Enzyme Initial Rate MeasurementsRate measurements were made in a total volume of 3 ml at
25°C in a double-beam Spectronic 2000 spectrophotometer. Foreach run, 8-10 absorbances were recorded. Because the rate ofproduct formation slows down during the run due to substratedepletion, a program written in QuickBasic for a personalcomputer was used to obtain the initial rate. After entering thedata pairs, a quadratic least squares fit was made of Abs as afunction of t, and Abs at zero time was found. Each Abs wascorrected for this blank value, the data pairs (AbScorr/t, t) werecalculated, and a linear least squares fit was made to find theextrapolated value of Abscorr/ t at time zero (Stauffer 1989). Theseinitial rates, in terms of absorbance units per minute, were laterconverted to rates in millimoles per liter per minute by dividingby the appropriate e for the substrate in question.
Standard Trypsin Inhibitor AssayThe assay was run according to the standard method, with
two slight exceptions. The diluted soy extract was filtered beforethe runs were made, thus obviating the need for filtering eachsample after stopping the reaction with 30% aqueous HOAc (Liuand Markakis 1989b). The volumes used were half that specifiedin the standard method. The blank tube (HOAc added beforeenzyme) was placed in the reference beam of the spectropho-tometer and all other readings were made relative to it.
Computer Simulation of Enzyme Reaction ProgressThe formation of product during the course of the enzyme-
catalyzed reaction can be readily modeled with a program forthe personal computer that carries out a numerical integrationof the Michaelis-Menten equation: A[P]/At = V[S]/(K + [S]).

Input from the keyboard consists of K, V, initial [S], the sizeof At, how frequently to print out the current value of [P], andhow long to run the program. Typical inputs for a run in thiswork might have V = 0.07, K = 2.44, [S] = 0.257, At = 0.01,print out every 100 cycles and run until t = 10. The calculationsare: A[P] = AtV[S]/(K + [S]); [P] = [P] + A[P]; [S] = [S]- A[P]; t = t + At; and the cycle is repeated.
RESULTS AND DISCUSSION
The Reaction of Trypsin with BAPAWavelength of measurement. In their original publication re-
garding the use of BAPA as a chromogenic substrate for trypsin,Erlanger et al (1961) recommended measuring the absorbanceof p-nitroaniline at 410 nm and gave a value for e = 8.8 mM-'cm '. The product p-nitroaniline has an absorbance peak at 380nm (e = 13.5 mM-' cm-1), but the substrate anilide also absorbsmodestly at this wavelength, hence the authors recommendedreading at a wavelength at which BAPA is transparent. In re-examining the product of complete hydrolysis of BAPA by trypsin,I found that the peak of the difference spectrum (the referencecuvette contained 0.20 mM BAPA; the sample beam contained0.10 mM N-benzoyl-D-arginine p-nitroanilide, 0.10 mM p-nitroaniline, and 0.10 mM N-benzoyl-L-arginine) occurs at 385nm with a value of E 11.1 mM- cm-' (Fig. 1). In comparingabsorbances of several samples during the course of this work,I found that A385 is 40% higher than A410. This point is not in-significant. A spectrophotometer error of 1 nm at 385 nm intro-duces a relative error of less than 0.1% (0.001/1.114), whereasa similar instrumental error at 410 nm gives a relative error ofmore than 3.0% (0.025/0.788). Reading absorbance of product
1.L
UI)0
-0
(n-Q
1.0
0.8
0.6
0.4
0.2
0.0
from hydrolysis of BAPA at 385 nm increases sensitivity by 40%and markedly decreases spectrophotometer error in the method.
Michaelis-Menten parameters. The D-isomer of BAPA is a com-petitive inhibitor of trypsin (Erlanger et al 1961). In consideringthe kinetics of the reaction, it is important to correct for thisfactor, but the correction requires a knowledge of Ki for theD-isomer as well as the true KM for the L-isomer substrate. Todetermine these two values as well as to obtain a value for kcatfor the reaction, I measured the initial rate of hydrolysis at 250 Cin 0.05M Tris buffer, pH 8.2, 0.01M in Ca+ at several con-centrations of BAPA and also of B-L-APA and used the HYPERcomputer program (Cleland 1970, 1979; Stauffer 1989) to estimateVapp (maximum rate) and Kapp (substrate concentration at halfthat rate) for each substrate (Fig. 2).
In considering the significance of the equation parameters, itis important to remember that in the measurements with BAPA,as substrate concentration increases so does inhibitor concen-tration (the reaction with B-L-APA does not have this compli-cation). Since the inhibition by D-isomer is competitive, and inthis case [I] = [S0] in all runs, we have:
Vmax [SO] Vmax [So]V= =
KM (I + [I1l K;) + [SO] KM + KM [So]l K, + [SO]
Vmax [So] VaPP [SO]vK= +
KM + [SO] (I + Km/ Ki) Kapp + [SO]
(1)
(2)
where Vapp = Vmax/(l + KM/Ki) and Kapp = KM/(I + KMIKj).Treating the data in this fashion, it is not necessary to use
the isolated D-isomer of BAPA as an inhibitor to find Ki aswas done by Erlanger et al (1961).
For the experiment with B-L-APA Vmax = 73.3 ,uM min-'(standard error [SE] 8.7) and KM = 2.20 mM (SE 0.39). Fromthe run with BAPA, Vapp = 37.1 ,M min-' (SE 2.5) and Kapp= 1.15 mM(SE 0.15). From the ratios
Vmax/ Vapp = 1 + KM/Ki = 1.976; Ki = 2.41
and
KM/Kapp 1 + KM/Ki = 1.913; Ki = 2.25
I found a value for Ki of 2.33 mM at 25°C, pH 8.2. In thestandard method assay [I] = [S0 ] - 0.257 mM. Kapp in this assayequals KM(l + 0.257/2.33) = 2.44 mM, calculated at 250C. Grantand Hermon-Taylor (1979) found 2.65 mMfor Kapp using BAPA.
E
0)4-I,
Cy
370 380 390 400 410 420 430
Wavelength, nmFig. 1. Difference absorption spectrum of BAPA and enzyme-hydrolyzedproduct. Reference cell contained 0.2 mM N-benzoyl-DL-arginine p-nitroanilide. Sample cell contained 0.1 mM each N-benzoyl-D-argininep-nitroanilide, N-benzoyl-L-arginine, and p-nitroaniline (0.2 mM BAPAreacted with trypsin until hydrolysis was complete). Both solutions werein pH 8.2 buffer, 0.05M Tris-HCl, 0.01 M CaCl2 .
35
30
25
20
15
10
5
0.0 0.4 0.8 1.2 1.6
[sO], mMFig. 2. Initial rates of hydrolysis of N-benzoyl-DL-arginine p-nitroanilide(B-DL-APA) and N-benzoyl-L-arginine p-nitroanilide (B-L-APA) by 0.211,M porcine trypsin at 250C, 0.05M Tris-HCl buffer pH 8.2, 10 mMin CaC12-
Vol. 67, No. 3,1990 297

Erlanger et al (1961) reported KM = 0.94 mM on B-L-APA and
Ki = 0.80 mM for the D-isomer, both results at 150 C. Usingan activation energy of 8,800 cal (Harmon and Niemann 1949)for the binding constants, these values at 250 C are 1.55 and 1.32mM, respectively.
In these runs [EO] = 0.137 ,M, so from Vmax = kcat[EO] I calculatekcat = 535 minm , or 8.92 sec'. Grant and Hermon-Taylor (1979)reported kcat of 2.72 sect1 for the DL racemate, which multipliedby the factor 1.976 equals 5.37 sec '. Erlanger et al (1961) founda value of 0.611 at 150C. Using 11,200 cal for the activationenergy Ea (Schwert and Eisenberg 1949), we can calculate this
value to be 2.45 sec-'; the authors assumed the trypsin they wereusing was 100% active, but a more likely estimate of 50% activitywould make their value for kcat 4.9 sec-l.
TABLE IFormation of Product from BAPA as a Function of Time of Reaction
Time Product Concentration (AM)(min) A 385 Experimental Calculated
1 0.043 3.8 3.8
2 0.082 7.4 7.53 0.124 11.2 11.24 0.163 14.7 14.85 0.205 18.5 18.46 0.243 21.9 21.97 0.282 25.4 25.4
8 0.320 28.8 28.89 0.358 32.3 32.2
10 0.395 35.6 35.6
0.4
Le)co
0.3
0.2
0.1
Po0
x
to0=0
a,
0Txx
0.043210
-1-2-3-4
Time, minFig. 3. Analysis of the time course of hydrolysis by trypsin of BAPA
at pH 8.2, 25 0C showing gradual slowing of the reaction due to substratedepletion. [SO] = 0.257 mrM, [E] = 0.077 MAM. The upper frame shows
the experimental data with the straight line fitted by linear least squares.The middle frame plots the residuals of each point from the LLS line.The lower frame is a plot of [P]/ t (i.e., rate to that time) versus time,
showing the decrease in apparent rate.
298 CEREAL CHEMISTRY
For the standard assay at 370C, using the values of Ea of 11.2kcal for rate and 8.8 kcal for binding, the results from the presentwork are estimated to be kcat = 1,110 minm, KM = 3.83 mM,Ki = 4.06 mM, and Kapp = 4.07 mM ([I] = 0.257 mM).
Nonlinearity of the enzyme reaction. Because [SO] is below Kapp,one would expect the instantaneous rate to decrease during thereaction due to substrate depletion. In fact this is what happens.To 2.95 ml of Tris buffer at 25 0C was added 33.3 ,u1 of a stockenzyme ([E] = 0.244 ,AM), and the reaction was started by adding16.7 Ml of BAPA stock in DMSO. The A385 was recorded at1 min intervals for 10 min (Table I). The absorbance values areplotted in the top frame of Figure 3. The line represents thelinear least squares fit, and appears to depict a high degree oflinearity. Plotting the residuals from the fit (Fig. 3, middle frame)shows a definite "hump,", characteristic of a set of data thatis better fit by a quadratic regression. This is made even moreapparent when [P]/ t is plotted versus time (Fig. 3, bottom frame).If one just measures A385 at the end of the reaction, then the"rate" would appear to be 0.0395 absorbance units (AU) perminute, while the actual initial velocity of the reaction is 0.042AU/min. The overall "rate" is only 94% of the initial rate. InTable I A385 is converted to [P] in micromoles per liter, and anumerical integration was done to see if the decrease in [P]/t
is strictly due to substrate depletion. Using K = 2.44, [SO] =
0.257, and V = 0.0402, the values of [P] listed in the table werecalculated. The agreement is excellent; no cause (e.g., productinhibition or enzyme denaturation) other than substrate depletionneed be invoked. While the point may seem minor, in fact ithas implications for the nature of the plot of rate versus amountof trypsin inhibitor in the standard method assay.
Three similar runs were also made incorporating amounts ofsoy extract that gave approximately 25, 50, and 75% inhibition.In all cases the progress curves could be fit exactly in the sameway as the uninhibited curve, changing only V to correspondto the degree of inhibition. The presence of inhibitor does notaffect the nature of the decrease in rate due to substrate depletion.
Analysis of Data from High-Affinity Inhibitor AssaysTheory. The mathematical relationships applying to enzyme
reactions in the presence of a high-affinity inhibitor of the enzymehave been developed and published (Goldstein 1944, Bieth 1974,
1
CN0Tl-
x
.ELC)00
r)
-+X00•
00 2 4 6 8 10 12 14 16
Soy Flour Extract, [lFig. 4. Inhibition by an extract of soy flour of the initial rate of hydrolysis
of BAPA by trypsin at pH 8.2, 0.01 M CaC12 , 250 C. Total reaction volumewas 3 ml, [E] = 0.165MM, [SO] = 0.257 mM. The initial rate was determinedby extrapolating [P]! t versus t to zero time to correct for the decreasein rate due to substrate depletion. The straight line was fitted using linearleast squares statistics.
0
0 a0 0~~0
0
0 00
Stauffer 1989). The analysis of data consisting of rates measuredin the presence of various amounts of soy extract, as we areconsidering here, is straightforward. No arbitrary assignmentsneed be made in defining units of trypsin inhibitor activity.
The key point in the analysis is that the total concentrationof inhibitor ([IJ]) is roughly equal to total concentration of enzyme([EJ]) so that the formation of enzyme-inhibitor complex (El)significantly depletes the inhibitor concentration. Denoting theconcentrations of free inhibitor and free enzyme by [I] and [E]respectively, we have:
K; = [E][I]/[E1] = ([EJ]-[E1])[IJ - [Efl)/[E1] (3)
= [Et][I1]/[EI] - [EJ - [IJ] + [EI] (4)
The measured rates are proportional to the amount of free enzymein the assay tube, and we can take v0 = [EJ], vi = [E], andV -vi = [EI]. Substituting these into equation 4 gives:
Ki = [It]vol(vo - v) -[I] - v0 + (v0 - vi) (5)
The terms containing [IJ] are gathered, and the last two termsare collected and multiplied by [Et]/vo (equals 1) to give:
K- = [It][vi/(vo - vi)] - [Et]vij/vo (6)
Rearranging this gives:
vi = v- [It]vi/(Ki + [Et]vi/vo) (7)
[EJ] is usually around 1 X 10⁻⁷M, and Ki for soy trypsin inhibitorsis of the order of 1-5 X 10- 'M (Liener and Kakade 1980) so[Et]v-/ v0>> Ki, and we arrive at the final equation:
vi = v- [I1Jv0/[EJ] (8)
A plot of vi versus [IJ] is a straight line with y-intercept v0,a slope of -vo/[EJ, and an x-axis intercept of [EJ] = [IJ]. Theunits for [1] do not affect this plot. If, for example, they weremilliliters of (diluted) soy extract, and the amount of enzymepresent in each assay tube was expressed in arbitrary assay units,e.g. "BAEE units," then [IJ] would be reported in "BAEE unitsper milliliter." As will be discussed below, it is just as easy touse absolute terms, picomoles for trypsin and microliters for theamount of undiluted soy extract, calculating the value of [Ii]in the extract in micromolar units. This should improve the repro-ducibility of the assay between laboratories, in addition to bringingthe method in line with accepted SI designation.
Two points should be raised about gathering the data for makingthis plot. The first relates to choosing the levels of inhibitionto use. My experience is that with soy flour extract the plot islinear up to at least 50% inhibition. Hamerstrand et al (1981)reported similar data as did Liu and Markakis (1989b). On theother hand, with other inhibitor sources the plot may becomenonlinear at somewhat lower degrees of inhibition (Richardson1981). Collaborative work to modify the present method wouldbe needed to give better guidance for selecting the points to makethe linear least squares (LLS) fit.
The second point is more fundamental; the data are used directlyfor the LLS fit as was done, for example, by Smith et al (1980).There is no reason to plot the difference v0 - vi versus amountof inhibitor as the standard method prescribes. Presumably theexperimental error of the inhibitor-free determination is no lessthan that of each of the assays containing inhibitor. Taking thedifference just doubles the error in each point, which is thenused to find the concentration [I] (Hamerstrand et al 1981).Rather, the control determination is treated merely as one ofthe set of data pairs; it should have no more weight in determiningthe best straight line than any other point. (This point is exem-plified in the high-enzyme run shown below.) Also, it shouldbe noted that the x-axis intercept is not measured graphically.Rather, from the parameters of the LLS straight line y = A(0)
+ A(1) X x, the x-intercept is calculated, xint = -A(0)/A(I).Initial rate (vo) measurements. As is apparent in the theoretical
development presented above, the rates are considered to be initialvelocities, i.e., d[P]/dt when substrate concentration is 0.257 mM.It is quite possible to use methods that assay trypsin inhibitorbased on initial rates. Figure 4 shows the results of one suchexperiment. After placing 0-0.7 ml of soy flour extract (diluted1:100 in buffer) and Tris buffer to a total of 2.93 ml in the cuvette,0.05 ml of stock trypsin solution followed by 16.7 ,ul of stockBAPA in DMSO was added to start the reaction, and the initialrate was determined as described under Methods. The stock tryp-sin concentration was 9.9 ,uM, so each reaction cuvette contained495 pmol of enzyme. From the LLS fit to the data, the x-axisintercept was 14.4 ,ul, so the absolute concentration of trypsininhibitor in the original soy extract was [Ij] = 495/14.4 = 34.4JAM.
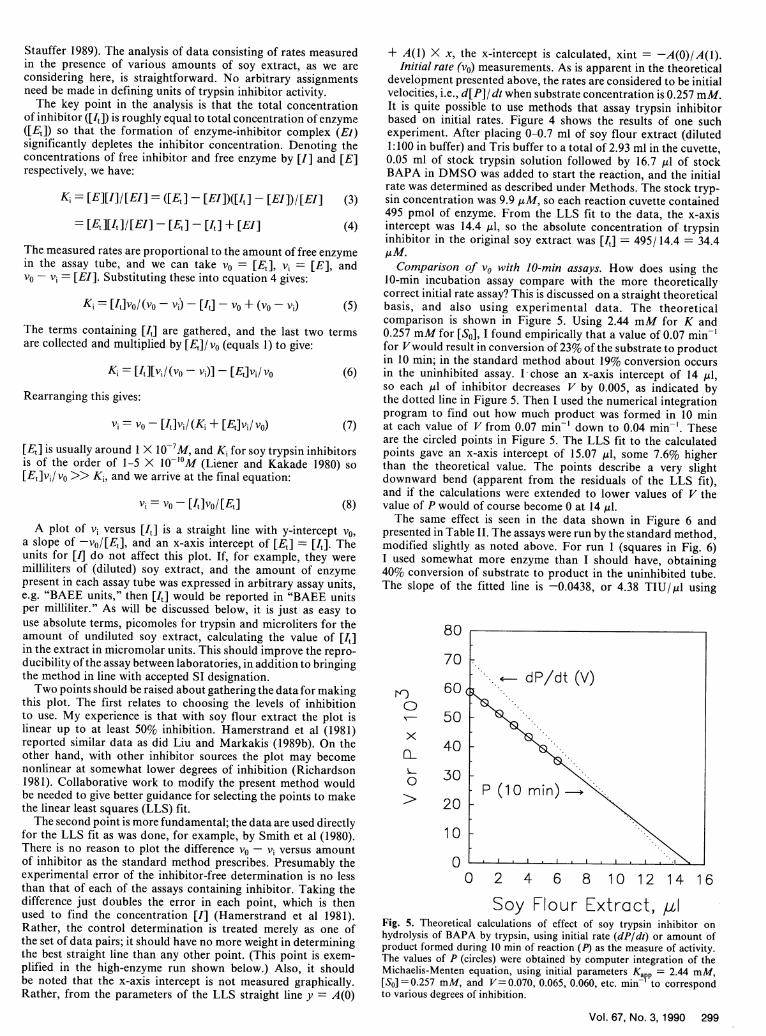
Comparison of vo with 10-min assays. How does using the10-min incubation assay compare with the more theoreticallycorrect initial rate assay? This is discussed on a straight theoreticalbasis, and also using experimental data. The theoreticalcomparison is shown in Figure 5. Using 2.44 mM for K and0.257 mM for [S0 ], I found empirically that a value of 0.07 min-'for Vwould result in conversion of 23% of the substrate to productin 10 min; in the standard method about 19% conversion occursin the uninhibited assay. I chose an x-axis intercept of 14 ,ul,so each ,ul of inhibitor decreases V by 0.005, as indicated bythe dotted line in Figure 5. Then I used the numerical integrationprogram to find out how much product was formed in 10 minat each value of V from 0.07 min- down to 0.04 min-'. Theseare the circled points in Figure 5. The LLS fit to the calculatedpoints gave an x-axis intercept of 15.07 ,ul, some 7.6% higherthan the theoretical value. The points describe a very slightdownward bend (apparent from the residuals of the LLS fit),and if the calculations were extended to lower values of V thevalue of P would of course become 0 at 14 ,l.
The same effect is seen in the data shown in Figure 6 andpresented in Table II. The assays were run by the standard method,modified slightly as noted above. For run 1 (squares in Fig. 6)I used somewhat more enzyme than I should have, obtaining40% conversion of substrate to product in the uninhibited tube.The slope of the fitted line is -0.0438, or 4.38 TIU/,ul using
80
70
0
x
0
60
50
40
30
20
10
0 I I I I I I I . '-1 I
0 2 4 6 8 10 12 14 16
Soy Flour Extract, ,aIFig. 5. Theoretical calculations of effect of soy trypsin inhibitor onhydrolysis of BAPA by trypsin, using initial rate (dP/dt) or amount ofproduct formed during 10 min of reaction (P) as the measure of activity.The values of P (circles) were obtained by computer integration of theMichaelis-Menten equation, using initial parameters KaVp = 2.44 mM,[SO] =0.257 mM, and V=0.070, 0.065, 0.060, etc. min- to correspondto various degrees of inhibition.
Vol. 67, No. 3,1990 299
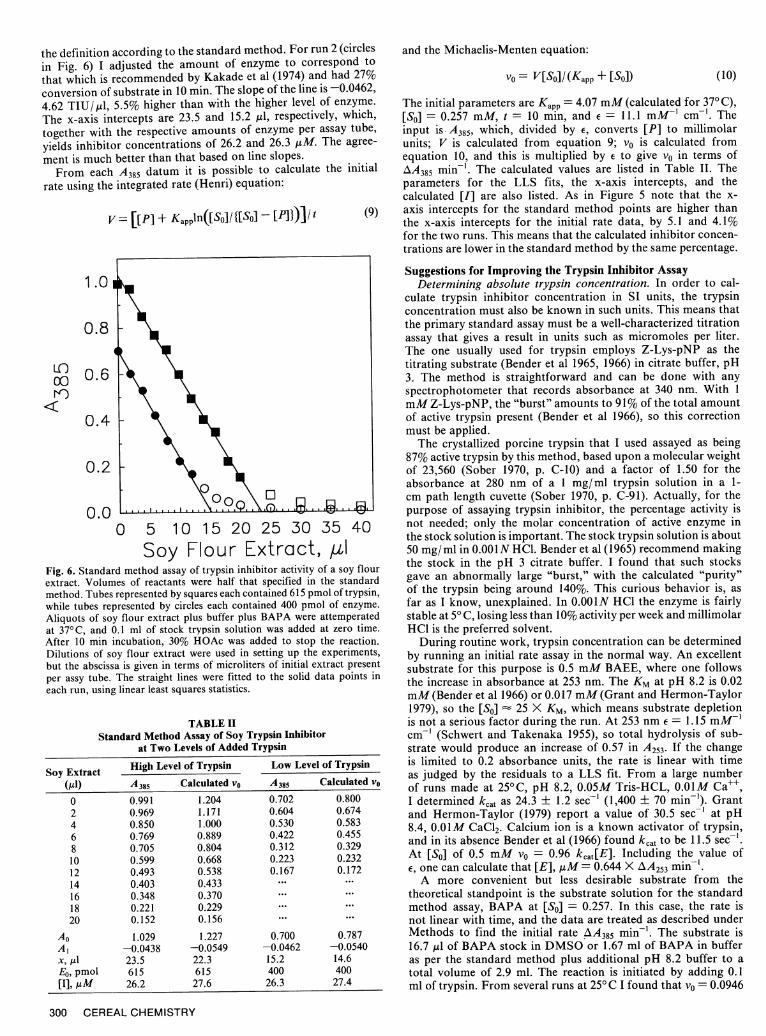
the definition according to the standard method. For run 2 (circles
in Fig. 6) I adjusted the amount of enzyme to correspond to
that which is recommended by Kakade et al (1974) and had 27%
conversion of substrate in 10 min. The slope of the line is -0.0462,
4.62 TIU/ jl, 5.5% higher than with the higher level of enzyme.
The x-axis intercepts are 23.5 and 15.2 IAl, respectively, which,
together with the respective amounts of enzyme per assay tube,
yields inhibitor concentrations of 26.2 and 26.3 ,uM. The agree-
ment is much better than that based on line slopes.From each A385 datum it is possible to calculate the initial
rate using the integrated rate (Henri) equation:
V= [[P] + Kappln([So]/ [So] - [P]]/t (9)
1.0
0.8
0.6
0.4
0.2
0.00 5 10 15 20 25 30 35 40
Soy Flour Extract, ,xlFig. 6. Standard method assay of trypsin inhibitor activity of a soy flourextract. Volumes of reactants were half that specified in the standardmethod. Tubes represented by squares each contained 615 pmol of trypsin,while tubes represented by circles each contained 400 pmol of enzyme.Aliquots of soy flour extract plus buffer plus BAPA were attemperatedat 370C, and 0.1 ml of stock trypsin solution was added at zero time.After 10 min incubation, 30% HOAc was added to stop the reaction.Dilutions of soy flour extract were used in setting up the experiments,but the abscissa is given in terms of microliters of initial extract presentper assy tube. The straight lines were fitted to the solid data points ineach run, using linear least squares statistics.
TABLE IIStandard Method Assay of Soy Trypsin Inhibitor
at Two Levels of Added Trypsin
Soy Extract(MI)
02468101214161820
AOAlx, J1A
E0, pmol[I], AM
High Leve
A 3 8 5
0.9910.9690.8500.7690.7050.5990.4930.4030.3480.2210.152
1.029-0.043823.5615
26.2
I of Trypsin Low Level of Trypsin
Calculated vo A385 Calculated vo
1.204 0.702 0.8001.171 0.604 0.6741.000 0.530 0.5830.889 0.422 0.4550.804 0.312 0.3290.668 0.223 0.2320.538 0.167 0.1720.433 .. ...0.370 ..0.229 ...0.156 ... ..
1.227-0.054922.3615
27.6
0.700-0.046215.2400
26.3
0.787-0.054014.6400
27.4
and the Michaelis-Menten equation:
Vo = V[So]/(Kapp + [SO]) (10)
The initial parameters are Kapp = 4.07 mM (calculated for 370 C),
[SO] = 0.257 mM, t = 10 min, and E = 11.1 mM-' cm-'. Theinput is A38 5, which, divided by o, converts [P] to millimolarunits; V is calculated from equation 9; vo is calculated fromequation 10, and this is multiplied by e to give vo in terms ofAA38 5 min-. The calculated values are listed in Table II. Theparameters for the LLS fits, the x-axis intercepts, and thecalculated [I] are also listed. As in Figure 5 note that the x-axis intercepts for the standard method points are higher thanthe x-axis intercepts for the initial rate data, by 5.1 and 4.1%for the two runs. This means that the calculated inhibitor concen-trations are lower in the standard method by the same percentage.
Suggestions for Improving the Trypsin Inhibitor AssayDetermining absolute trypsin concentration. In order to cal-
culate trypsin inhibitor concentration in SI units, the trypsinconcentration must also be known in such units. This means thatthe primary standard assay must be a well-characterized titrationassay that gives a result in units such as micromoles per liter.The one usually used for trypsin employs Z-Lys-pNP as thetitrating substrate (Bender et al 1965, 1966) in citrate buffer, pH3. The method is straightforward and can be done with anyspectrophotometer that records absorbance at 340 nm. With 1mM Z-Lys-pNP, the "burst" amounts to 91% of the total amountof active trypsin present (Bender et al 1966), so this correctionmust be applied.
The crystallized porcine trypsin that I used assayed as being87% active trypsin by this method, based upon a molecular weightof 23,560 (Sober 1970, p. C-10) and a factor of 1.50 for theabsorbance at 280 nm of a 1 mg/ml trypsin solution in a 1-cm path length cuvette (Sober 1970, p. C-91). Actually, for thepurpose of assaying trypsin inhibitor, the percentage activity isnot needed; only the molar concentration of active enzyme inthe stock solution is important. The stock trypsin solution is about50 mg/ml in 0.OOIN HCl. Bender et al (1965) recommend makingthe stock in the pH 3 citrate buffer. I found that such stocksgave an abnormally large "burst," with the calculated "purity"of the trypsin being around 140%. This curious behavior is, asfar as I know, unexplained. In O.OO1N HCl the enzyme is fairlystable at 5° C, losing less than 10% activity per week and millimolarHCl is the preferred solvent.
During routine work, trypsin concentration can be determinedby running an initial rate assay in the normal way. An excellentsubstrate for this purpose is 0.5 mM BAEE, where one followsthe increase in absorbance at 253 nm. The KM at pH 8.2 is 0.02mM (Bender et al 1966) or 0.0 17 mM (Grant and Hermon-Taylor1979), so the [So] 25 X KM, which means substrate depletionis not a serious factor during the run. At 253 nm e = 1.15 mM-1cm-' (Schwert and Takenaka 1955), so total hydrolysis of sub-strate would produce an increase of 0.57 in A253. If the changeis limited to 0.2 absorbance units, the rate is linear with timeas judged by the residuals to a LLS fit. From a large numberof runs made at 250 C, pH 8.2, 0.05M Tris-HCL, 0.O1M Ca++I determined kcat as 24.3 ± 1.2 sect (1,400 ± 70 min'). Grantand Hermon-Taylor (1979) report a value of 30.5 sect at pH8.4, 0.O1M CaCl2. Calcium ion is a known activator of trypsin,and in its absence Bender et al (1966) found kcat to be 11.5 sects.At [So] of 0.5 mM vo = 0.96 kcat[E]. Including the value ofE, one can calculate that [E], gAM = 0.644 X AA253 minm .
A more convenient but less desirable substrate from thetheoretical standpoint is the substrate solution for the standardmethod assay, BAPA at [SO] = 0.257. In this case, the rate isnot linear with time, and the data are treated as described underMethods to find the initial rate z\A385 mmnk. The substrate is
16.7 1.d of BAPA stock in DMSO or 1.67 ml of BAPA in bufferas per the standard method plus additional pH 8.2 buffer to atotal volume of 2.9 ml. The reaction is initiated by adding 0.1ml of trypsin. From several runs at 25° C I found that vo = 0.0946
300 CEREAL CHEMISTRY
Ln00

kcat[E] = 49.1 ± 1.0 min '[E]. Using As = 11.1 mM l cm-',this gives [E], ,uM = 1.835 X AA 38 5 min-. One can also estimatethe enzyme concentration in a standard assay tube from theabsorbance of the control. For example, in the two runs shownin Figure 6, in the high level [E] = 0.137 AiM (615 pmol/4.5ml) and A385 = 1.029, whereas in the lower level [E] = 0.089(400 pmol/4.5 ml) and A385 = 0.700. The correspondence is notexact, but this is a good internal check to make sure that a decimalpoint hasn't been slipped or an improper dilution made duringroutine operation.
Summarizing, the titration with Z-Lys-pNP is the primarystandard for determining active enzyme concentration. The assaywith BAEE is an excellent secondary standard, and the initialrate assay using BAPA is a useful day-to-day standard for moni-toring the stability of concentrated stock solution stored in thecold. It is definitely not the case that "the actual molar concentra-tion of enzyme or inhibitor is difficult to determine" (Liu andMarkakis 1989b).
Filtration of diluted soy extract. Kakade et al (1974) reportedthat filtering the soy extract before running the assay resultedin decreased inhibitor concentration. Liu and Markakis (1989b)investigated the extraction of inhibitor and found that 30 minextraction using water or buffer was as effective as the 3 hr ex-traction using 0.01N NaOH specified in the standard method,and that filtering the extract before beginning the assay did notchange the concentration of inhibitor. I made a few preliminarytrials of this sort, and my observations are in agreement withtheir report.
Relationship of TIU to absolute inhibitor concentration. Asindicated above (Fig. 6 and Table II), when we know the molaramount of active trypsin used in the assay tube, it is a simplematter to calculate the molar concentration of trypsin inhibitorin the soy flour extract. To calculate the ratio between the trypsininhibitor unit as defined in the present standard method and themolar concentration of inhibitor in extract, I will refer to TableII as an illustration. One trypsin inhibitor unit equals an amountthat will increase by 0.01 the quantity A410,0 -A410,i. If the soyextract contains 1 TIU per microliter, the slope of the line fitteddirectly to the data is -0.01, or -0.014 if the absorbance mea-surement is at 385 nm. The soy flour extract in Table II contained3.2 TIU/gl, taking the average of the slopes of the two assaysthat used the standard 10-min incubation. By dividing thepicomoles of trypsin per assay tube by the x-intercept, the molarconcentration of trypsin inhibitor was 26.24 X 10-'2 mol/,ul. Thus,at pH 8.2, 0.01M CaCl2 , 37°C, I TIU = 8.2 X 10⁻¹² mol oftrypsin inhibitor.
Three points need to be made about this relationship. First,as long as the molar stoichiometry of the trypsin-inhibitor reactionis 1:1, the actual molecular weight of the inhibitor is irrelevant.One mole of inhibitor reacts with one mole of enzyme whetherthe molecular weight is 21 kDa (Kunitz inhibitor) or 8 kDa(Bowman-Birk inhibitor). Second, since the incubation assayunderestimates inhibitor concentration by about 5%, 1 TIUactually equals 8.6 X 10⁻¹² mol of inhibitor. Third, the definitionof TIU is for assay at 370 C and is strongly temperature dependent,whereas the determination of absolute inhibitor concentrationfrom the x-intercept of the LLS fit is independent of temperature.A change in the temperature of the assay will affect the rateof enzyme reaction proportionately the same in all the assay tubes,so the y-intercept and the slope will both change in the samedirection but the x-intercept will remain the same, as will theestimation of the molar concentration of inhibitor in the extractbeing assayed.
Methodology changes recommended. An old, sound adage is"If it ain't broke, don't fix it!" While the present standard methodfor trypsin inhibitor assay is not "broke," it is apparent that manyresearchers feel that it could at least use some preventivemaintenance, as discussed by Liu and Markakis (1989b). Thefollowing points should be taken into account by any collaborativegroup that may be involved in such an examination of the methodwith a view to updating it.
1) Make the absorbance readings at 385 nm. While the sensitivityis increased by 40%, this is not the main reason for this recommen-dation. The overriding consideration ought to be for reproduci-bility between laboratories as affected by spectrophotometricerror. Liu and Markakis (1989b) found a value of E4 1 0 for p-nitroanilide of 7.76 mM-' cm-'. Erlanger et al (1961) reported8.8 for this value, and in this work I found a value of 7.93.If we assume that the spectrophotometer used by Liu andMarkakis was accurately set at 410 nm, then my instrument settingwas in truth 409.4 nm, and the one used by Erlanger et al wasset at 405.5 nm. Discrepancies of this size are not unrealisticin day-to-day laboratory operation. Put another way, an instru-mental error of 5 nm will produce an error of 15% in calculatingTIU by the present method. A similar 5 nm error in the 385nm region will produce a 0.5% error in TIU.
2) Standardize the stock trypsin solution in absolute molarityconcentration units. This is not difficult to do. A particularlaboratory should initially run a titration assay using Z-Lys-pNPand then make initial rate assays using BAEE to establish theirown factor for converting BAEE "units" to trypsin concentration.(I do not recommend using any other reported conversion factorwithout at least checking it out.) Once that is done, the establish-ment of trypsin concentration would be a simple routine asay,performed at the start of each day's work.
3) Measure the amount of p-nitroanilide formed during a 10-min incubation with trypsin in the presence of several aliquotsof soy extract, chosen to give 0-50% inhibition. Fit a straightline to these data using linear least squares methods, calculatethe intercept on the x-axis, and use this value plus the knownnumber of moles of trypsin per assay tube to calculate the concen-tration of trypsin inhibitor in the original soy extract in micro-molar units. This procedure has two advantages over the presentstandard assay, one philosophical and one practical. The firstadvantage is that the measurements are in SI units, free of arbitrarydefinitions, and comparable among various approaches to mea-suring trypsin inhibitor. The practical advantage is that the mea-surement becomes independent of temperature, thus removingone more source of experimental error between laboratories.
4) Add the enzyme last to initiate the 10-min incubation periodas proposed by Liu and Markakis (1989b). Viswantha and Liener(1954) and Liu and Markakis (1989a,b) state that this producesa larger slope to the plot of rate versus amount of soy extractcompared with the present method of adding substrate last, whileBirk (1967) claims this is not so. Leytus et al (1984) analyzedthe kinetics that govern the interaction of enzyme-substrate-inhibitor during the early stages of the reaction, and from thatanalysis adding the enzyme last should produce less rather thanmore apparent inhibition. I am presently investigating the tran-sient kinetics of this system and have confirmed their predictionsusing BAEE but find that with BAPA the pre-steady statedeviations are negligible (unpublished). In any event, my reasonfor this recommendation is practical, not theoretical. Trypsin in0.001N HCl inactivates more rapidly at 37°C than at 5°C. Bymaintaining the stock trypsin solution at the lower tempertureduring the day's work and initiating the assay by adding a smallaliquot (say, 0.1 ml) to the attemperated solution of inhibitorplus substrate, the amount of enzyme inactivation following thestandardization runs at the beginning of the day would be neg-ligible. This minimizes one more source of experimental error.
5) The 10-min incubation assay is much more convenient thaninitial rate assays when a large number of samples is to be run,so I recommend continuing to use it. For practical purposes,e.g., comparing the effectiveness of various treatments in de-creasing trypsin inhibitor in soy meals or for production qualitycontrol, this is perfectly adequate. A determination of the exactamount by which this procedure underestimates the true amountof inhibitor present could be the subject of a collaborative study,and the revised official method could include a note that statesthe extent of underestimation, so that researchers who wish tocompare measurements by different methods of molar amountsof trypsin inhibitor could correct the results from the incubationassay by this amount.
Vol. 67, No. 3,1990 301

LITERATURE CITED
AMERICAN ASSOCIATION OF CEREAL CHEMISTS. 1983.Approved Methods of the American Association of Cereal Chemists.Method 71-10, approved November 1973. The Association: St. Paul,MN.
BENDER, M. L., KILLHEFFER, J.V., JR., and ROESKE, R. W. 1965.The determination of the normality of a trypsin solution by a specifictitration. Biochem. Biophys. Res. Commun. 19:161.
BENDER, M. L., BEGUE-CANTON, M. L., BLAKELY, R. L.,BUBACHER, L. J., FEDER, J., GUNTER, C. R., KEZDY, F. J.,KILLHEFFER, J. V., MARSHALL, T. H., MILLER, C. G.,ROESKE, R. W., and STOOPS, J. K. 1966. The determination of
the concentration of hydrolytic enzyme solutions, a-chymotrypsin,trypsin, papain, elastase, subtilisin and acetylcholinesterase. J. Am.Chem. Soc. 88:5890.
BIETH, J. 1974. Some kinetic consequences of the tight binding of protein-proteinase inhibitors to the proteolytic enzymes and their applicationto the determination of dissociation constants. Pages 463-469 in:Proteinase Inhibitors. Proc. Int. Res. Conf., 2nd (Bayer Symp. V) H.Fritz, H. Tschesche, L. J. Greene, and E. Truscheit, eds. Springer-Verlag: New York.
BIRK, Y. 1967. Chemistry and nutritional significance of proteinaseinhibitors from plant sources. Ann. N. Y. Acad. Sci. 146:388.
CLELAND, W. W. 1970. Steady state kinetics. Pages 1-65 in: TheEnzymes, 3rd ed. P. D. Boyer, ed. Academic Press: New York.
CLELAND, W. W. 1979. Statistical analysis of enzyme kinetic data.Methods Enzymol. 63:103.
ERLANGER, B. F., KOWOSKY, N., and COHEN, W. 1961. Thepreparation and properties of two new chromogenic substrates of tryp-sin. Arch. Biochem. Biophys. 95:271.
GOLDSTEIN, A. 1944. Mechanism of enzyme-inhibitor-substrate reac-
tions. Cholinesterase-eserine-acetylcholine system. J. Gen. Physiol.27:529.
GRANT, D. A. W., and HERMON-TAYLOR, J. 1979. Hydrolysis of
artificial substrates by enterokinase and trypsin and the developmentof a sensitive specific assay for enterokinase in serum. Biochim. Biophys.Acta 567:207.
HAMERSTRAND, G. E., BLACK, L. T., and GLOVER, J. D. 1981.Trypsin inhibitors in soy products: modification of the standard analyti-cal procedure. Cereal Chem. 58:42.
HARMON, K. M., and NIEMANN, C. 1949. The hydrolysis of N-
benzoyl-L-argininamide by crystalline trypsin. J. Biol. Chem. 178:743.KAKADE, M. L., SIMONS, N., and LIENER, I. E. 1969. An evaluation
of natural versus synthetic substrates for measuring the antitrypticactivity of soybean samples. Cereal Chem. 46:518.
KAKADE, M. L., RACKIS, J. J., MCGHEE, J. E., and PUSKI, G.1974. Determination of trypsin inhibitor activity of soy products: Acollaborative analysis of an improved procedure. Cereal Chem. 51:376.
LEYTUS, S. P., TOLEDO, D. L., and MANGEL, W. F. 1984. Theoryand experimental method for determining individual kinetic constantsof fast-acting, irreversible proteinase inhibitors. Biochim. Biophys. Acta788:74.
LIENER, I. E., and KAKADE, M. L. 1980. Protease inhibitors. Pages7-71 in: Toxic Constituents of Plant Foodstuffs. I. E. Liener, ed.Academic Press: New York.
LIU, K., and MARKAKIS, P. 1989a. Trypsin inhibition assay as relatedto limited hydrolysis of inhibitors. Anal. Biochem. 178:159.
LIU, K., and MARKAKIS, P. 1989b. An improved colorimetric methodfor determining antitryptic activity in soybean products. Cereal Chem.
66:415.RICHARDSON, M. 1981. Protein inhibitors of enzymes. Food Chem.
6:235.SCHWERT, G. W., and EISENBERG, M. A. 1949. The kinetics of the
amidase and esterase activities of trypsin. J. Biol. Chem. 179:665.SCHWERT, G. W., and TAKENAKA, Y. 1955. A spectrophotometric
determination of trypsin and chymotrypsin. Biochim. Biophys. Acta16:570.
SMITH, C., MEGEN, W. V., TWAALFHOVEN, L., and HITCHCOCK,C. 1980. The determination of trypsin inhibitor levels in foodstuffs.J. Sci. Food Agric. 31:341.
SOBER, J. A. 1970. Handbook of Biochemistry, 2nd ed. CRC Press:Cleveland, OH.
STAUFFER, C. E. 1989. Enzyme Assays for Food Scientists. VanNostrand Reinhold: New York.
VISWANATHA, T., and LIENER, I. 1954. Inhibition of trypsin: I.Sequence of mixing the reactants. J. Biol. Chem. 210:97.
[Received August 14, 1989. Accepted November 30, 1989.]
302 CEREAL CHEMISTRY