“measuring the technological and economic value ... - … · the proposed measures aim to...
TRANSCRIPT

85 | MEASURING THE TECHNOLOGICAL AND ECONOMIC VALUE OF PATENTS
ENQUIRIES INTO INTELLECTUAL PROPERTY'S ECONOMIC IMPACT © OECD 2015
CHAPTER 2. MEASURING THE TECHNOLOGICAL AND ECONOMIC VALUE OF PATENTS
This chapter proposes a set of indicators that assess the economic and technological value of patented inventions, as well as the impact they might have on subsequent technological developments. The proposed measures can facilitate analysis both at the level of individual patents and at the aggregate patent portfolio level. The chapter thus lays a foundation for potential work on policy-relevant challenges such as quantifying patents’ contributions to innovation and growth; identifying the types of firms that bring high value patents to the market; improving financing for innovative firms; comparing firms’ innovation strategies and performance; and measuring the output of R&D activities and the returns to R&D investments.
So far, the indicators have been “test-driven” with statistics compiled from patent applications that were filed with the European Patent Office during the period 1990-2009. Each indicator suggests that some countries have relatively strong innovative abilities and that some have relatively average or weak abilities. Several experimental composite indices, based on groups of relevant factors, generated consistent results. They all suggest that a) the average technological and economic value of inventions protected by patents has eroded over time; b) patented micro and nano technologies have the highest value; and c) Australia, Canada, Norway, South Africa, and the United Kingdom tend to generate patents with the highest average value.
The statistical data for Israel are supplied by and under the responsibility of the relevant Israeli authorities or third party. The use of such data by the OECD is without prejudice to the status of the Golan Heights, East Jerusalem and Israeli settlements in the West Bank under the terms of international law.
It should be noted that statistical data on Israeli patents and trademarks are supplied by the patent and trademark offices of the relevant countries.

86 | MEASURING THE TECHNOLOGICAL AND ECONOMIC VALUE OF PATENTS
ENQUIRIES INTO INTELLECTUAL PROPERTY'S ECONOMIC IMPACT © OECD 2015
ABSTRACT
This work contributes to the definition and measurement of the technological and economic value of patents. It proposes a wide array of indicators capturing the technological and economic value of patented inventions and the possible impact that these might have on subsequent technological developments. The measures proposed build extensively upon recent literature, rely on information contained in the patent documents, and are calculated on patent cohorts defined by the combination of the technology field and the year of filing of patents. This is done to account for possible time- and technology-related shocks. The description of the indicators is accompanied by statistics compiled on patents from the European Patent Office, as well as tests aimed at addressing the sensitivity of the measures to alternative specifications and the correlations that may exist among them. The indicators proposed, which can be constructed on all patents, have the advantage of relying on a homogeneous set of information and of being comparable across countries and over time. To facilitate their compilation on data from other Intellectual Property (IP) offices, the SQL-based program codes used to calculate the indicators are also supplied. The paper is further accompanied by a dataset – to be obtained upon request – containing the indicators calculated on EPO patent documents published during the period 1978-2012, as well as some cohort specific statistics (i.e. main moments and key percentiles).

87 | MEASURING THE TECHNOLOGICAL AND ECONOMIC VALUE OF PATENTS
ENQUIRIES INTO INTELLECTUAL PROPERTY'S ECONOMIC IMPACT © OECD 2015
EXECUTIVE SUMMARY
This work contributes to the definition and measurement of the technological and economic value of patents. It proposes a number of indicators and an experimental composite indicator aimed at capturing the technological and economic value of patented inventions, and the possible impact that these might have on subsequent technological developments. The measures proposed build extensively upon recent literature and rely on information contained in the patent documents.
The description of each indicator is accompanied by statistics compiled on patents from the European Patent Office (EPO), as well as tests aimed at showing the sensitivity of the measures to alternative specifications and the correlations that may exist among different indicators. The measures proposed, which can be constructed on any patent, have the advantage of relying on a homogeneous set of information and of being comparable across countries and over time.
The proposed measures aim to facilitate analysis both at the level of the individual patent and at the aggregate patent portfolio level. They are intended to help address policy-relevant questions related to topics such as: firms’ innovation strategies and performance; enterprise dynamics, including the drivers of enterprise creation and of mergers and acquisitions; the determinants of productivity; financing innovative enterprises; the output of R&D activities and the returns to R&D investments; R&D depreciation; and the output of universities and public research organisations.

88 | MEASURING THE TECHNOLOGICAL AND ECONOMIC VALUE OF PATENTS
ENQUIRIES INTO INTELLECTUAL PROPERTY'S ECONOMIC IMPACT © OECD 2015
Introduction
It has been long argued that the “quality” of patented inventions varies widely from patent to patent and that the likelihood to patent inventions of a given quality varies at both firm and industry levels (Scherer, 1965). Simple as it may seem, the concept of patent quality has over time acquired a wide array of meanings. The many definitions that exist are not exclusive, nor do they perfectly overlap, and users tend to bridge them into somewhat intuitive notions of quality. For patent attorneys and engineers a high quality patent can be a well written patent, whose content is clearly described, or a patent protecting a major invention rather than an incremental step or technology. Legal scholars conversely tend to interpret quality as the ability of a patent to withstand a legal challenge without being invalidated. For economists a good patent is generally one that fulfils the key objectives of the patent system, i.e. to reward and incentivise innovation while enabling diffusion and further technological developments (see Guellec and van Pottelsberghe de la Potterie, 2007, for a discussion).
Recently, there has been much discussion about patent quality, its meaning and definitions, as well as how to measure it in practice and what it entails for innovation, entrepreneurship and technology development73.Whatever the definition of patent quality proposed, most stakeholders seem to agree about the necessity to “raise the bar”, i.e. to raise the overall quality level of patents granted worldwide. Low patent quality is widely perceived to generate uncertainty, to lower incentives to innovate, to stifle technology development and to trigger a number of market failures that ultimately harm innovation, entrepreneurship, employment and growth, as well as consumers’ welfare (see Hall et al., 2003, for a discussion). For instance, it is well known that patents increase the likelihood of obtaining venture capital and securing liquidity (Hall and Harhoff, 2012). However venture capitalists would not finance firms against which patent infringement cases have been raised by another company or by a non-practising entity (NPE)74. As the likelihood of getting challenged in court is related to factors like the extent to which patent claims are narrowly or broadly defined and the technological details of the patented invention, i.e. to patent quality-related features, increasing the quality of these intellectual property rights (IPR) would help mitigate market failures triggered by low patent quality.
This chapter starts from the premise that patent quality means the technological and economic value of patented inventions (hereinafter, “patent value”). It contributes to the measurement of patent value and the possible impact it might have on subsequent innovations. The chapter proposes a wide array of indicators which mirror different – albeit often interrelated – aspects of patent value, sometime having a mainly technological (e.g. backward citations) or preponderantly economic connotation (e.g. patent renewals), or both (e.g. forward citations, generality). Also, depending on the indicator considered, the meaning of patent value might be closer to that of private value or of social value. Addressing these conceptual issues in more detail would go beyond the scope of this paper and its main empirical focus. Interested readers are invited to refer to citations in the paper and to the OECD Patent Statistics Manual (2009) for more information on the indicators and their possible interpretation.
The indicators proposed use pieces of information contained in the patent documents and are compiled in such a way as to take into account the possible shocks that can occur over time in different technology fields - for example, the sudden rise in patent application in some areas. The measures proposed rely extensively upon recent literature and on earlier work carried out by the OECD Working Party on Industry Analysis. All the indicators detailed in the present document can be constructed for all patents applied under any jurisdiction, and have the advantage of relying on a homogeneous set of information. This makes them generally comparable across countries and over time, and therefore suitable for cross-country analysis.
The patent-based indicators herein should nevertheless be considered as proxies, since they do not contain information about market transactions or the real use of the (patented) technologies. Moreover,

89 | MEASURING THE TECHNOLOGICAL AND ECONOMIC VALUE OF PATENTS
ENQUIRIES INTO INTELLECTUAL PROPERTY'S ECONOMIC IMPACT © OECD 2015
almost all the measures detailed in the present work are retrospective in nature, and can only be compiled ex-post, i.e. once the pieces of information they rely upon are included in the patent file. Also, the length of period of observation for certain indicators inevitably depends on the underlying patent information from which they are constructed. For instance, indicators based on backward citations, i.e. the citations to prior art made in a patent, require a much shorter window of observation, and are thus more timely, than measures based on forward citations i.e. the citations a patent receives from subsequent patents, which are subject to ‘truncation’ effects.
The figures and statistics shown in the present document have been compiled using EPO patent applications data contained in the April 2012 version of the EPO Worldwide Patent Statistical Database (PATSTAT) and are presented according to the year in which the patent was filed, and according to the country of residence of the applicants. The choice to focus on patent applications filed at one patent office only is motivated by the awareness that intellectual property offices have to comply with country-specific legislations and with a wide array of administrative regulations. These may ultimately lead to office-specific practices and to differences in terms of e.g. patent classes assigned to applications, propensity to cite prior art, and number and length of claims contained in a patent document. Considering data from several offices at a time would thus inevitably lead to biased indicators, as (at least) part of the figures would be due to differences in office practices and regulations, rather than to the value of the patents considered. Patent value indicators relying on data belonging to intellectual property offices other than the EPO can nevertheless be easily calculated, as the piece of information on which the indicators rely are contained in all patent files applied worldwide. Future research will investigate the differences that may arise from the use of diverse data sources, and its main determinants.
In this paper, statistics are generally presented in the form of normalised indexes ranging between zero and one. These are obtained by dividing the initial results by the maximum score obtained by any patent in the same year and technology field cohort. Moreover, and in order to reduce the potential distortion that the presence of extreme values, i.e. spurious outliers, may cause, indexes are sometime constructed over a 98% winsorized distribution. This entails transforming the indicators below the 1st percentile into values corresponding to the 1st percentile, and having the indicators above the 99th percentile set to the 99th percentile.
Unless otherwise specified, technology fields are defined according to Schmoch’s (2008) classification (as updated in 2010 and 2011) which relies on the International Patent Classification (IPC) codes contained in the patent documents. This taxonomy features six main technology sectors, subdivided into 35 fields of balanced size, structured so as to maximise within-sector homogeneity and across-sector differences75. Using alternative technology classifications would change the value of the indicators and the statistics proposed.
The following sections describe the proposed thirteen indicators according to the same format. Each time, an outline of the type of information provided by the indicator at hand is accompanied by the relevant literature on which it relies. An operational definition of the indicator follows, as well as a brief description of the way it has been constructed, and a discussion of possible challenges and shortcomings. Descriptive statistics showing the value that the indicator takes over time and across countries and technology fields complement this part.
The original working paper76 (of which this chapter is an excerpt) contains the program codes used to build the indicators and is accompanied by a database containing the indicators proposed, calculated at the individual patent level. The working paper also includes a number of robustness tests aimed at better understanding the behaviour of the indicator, as well as its sensitivity to alternative specifications.

90 | MEASURING THE TECHNOLOGICAL AND ECONOMIC VALUE OF PATENTS
ENQUIRIES INTO INTELLECTUAL PROPERTY'S ECONOMIC IMPACT © OECD 2015
Supplying the dataset and the program codes to compile the indicators aims at facilitating a peer review of the indicators proposed, and trigger an open source-like development, whereby users might help to fine-tune the indicators, test their robustness, and verify their ability to capture the economic and technological value of patented inventions.
Patent scope
Background and definition
The scope of patents is often associated with the technological and economic value of patents. Lerner (1994) observes that the technological breadth of patents in a firm’s portfolio significantly affects the valuation of the firm, and that broad patents are more valuable when many possible substitutes in the same product class are available. Matutes, Régibeau and Rockett (1996) also look at patent protection regimes, and in particular at the length and scope77 of patent protection, and suggest that the scope of a patent should be used to foster the early disclosure of fundamental innovations.
The index proposed here follows Lerner (1994) and defines the scope of a patent in terms of the number of distinct 4-digit subclasses of the International Patent Classification78 the invention is allocated to. For each patent document P, the patent scope index is defined as:
𝑆𝑆𝑆𝑆𝑆𝑃 = 𝑛𝑝 ; 𝑛 ∈ �𝐼𝑆𝑆14; … ; 𝐼𝑆𝑆𝑖4; 𝐼𝑆𝑆𝑗4; … ; 𝐼𝑆𝑆𝑛4� & 𝐼𝑆𝑆𝑖4 ≠ 𝐼𝑆𝑆𝑗4,
where np denotes the number of distinct 4 digit IPC subclasses listed in the patent p document. Data refers to the latest edition of the IPC (8th edition). The index is normalised according to the maximum scope value of the patents in the same cohort, with cohorts being defined according to year of filing and technology field. The larger the number of distinct 4-digit IPC classes, the broader the scope index, and the higher the potential technological and market value of a patent79.
Indicator overview
In PATSTAT, IPC codes of patent documents are converted into the latest available edition of the IPC classification, i.e. 8th edition, entered into force in 2006. Patents based on previous editions of the IPC classification have thus been re-classified accordingly. Also, due to the emergence of new technologies, sometimes no one-to-one correspondence exists between old and new IPC editions, and older IPC codes may correspond to many IPC 8th edition codes. Hence, patents filed before the mid-2000s may feature a broader range of IPC-7 codes than later patents: five codes on average for patents filed in 2000 compared to around 2.5 codes per patent in the late 2000s. As can be seen from the figure below, each IPC code in force at the date of patenting has been allocated in PATSTAT to around two codes of the IPC 8th edition.
Figure 2.1. Average number of IPC classes per EPO patent document, by IPC edition
Source: OECD, calculations based on PATSTAT (EPO, April 2012) and OECD, Patent database, October 2012.
As a consequence, the patent scope index tends to be overestimated before the mid-2000s. For example, the patent scope index of micro- and nano-technology patents gets seemingly divided by three between 1999 and 2009.
0
2
4
6
1978 1980 1982 1984 1986 1988 1990 1992 1994 1996 1998 2000 2002 2004 2006 2008 2010
Re-classification to IPC 8 Current IPC edition at publication

91 | MEASURING THE TECHNOLOGICAL AND ECONOMIC VALUE OF PATENTS
ENQUIRIES INTO INTELLECTUAL PROPERTY'S ECONOMIC IMPACT © OECD 2015
Patents in the pharmaceuticals, control-technologies or biotechnology fields conversely report the largest indices in 2009, corresponding to 0.31, 0.29 and 0.26 respectively, as compared to 0.21 on average observed for all patents. Australia, Canada, Japan and Finland rank above the world’s average patent scope index in 2009.
Figure 2.2. Patent Scope, index, 1990-2009
Patent Scope, average index by technology field Patent Scope, average index by economy
Note: The patent scope index is normalised according to the maximum scope value of the patents in the same cohort (filing date and technology fields). The average by economy is provided only for economies reporting the index for more than 200 patents in 2009. The small numbers on the right hand of the average by technology table show the number of observations on which statistics rely.
Source: OECD, calculations based on PATSTAT (EPO, April 2012), October 2012.
0.0
0.1
0.2
0.3
1990 1991 1992 1993 1994 1995 1996 1997 1998 1999 2000 2001 2002 2003 2004 2005 2006 2007 2008 2009
Average Median 75th percentile
3313
203920434907349420662883
202739842719342714272693
152
175121603089
965
2886539337514513
834917221209
565128463268
9716747865
6469365943058145
115888
0.0 0.1 0.2 0.3 0.4
Civil engineeringOther consumer goods
Furniture, gamesTransport
Mechanical elementsThermal processes and apparatus
Other special machinesTextile and paper machines
Engines, pumps, turbinesMachine tools
HandlingEnvironmental technology
Chemical engineeringMicro & nano-technology
Surface technology, coatingMaterials, metallurgy
Basic materials chemistryFood chemistry
Macromolecular chemistryPharmaceuticals
BiotechnologyOrganic fine chemistry
Medical technologyControl
Biological materialsMeasurement
OpticsSemiconductors
IT methods for managementComputer technologyBasic communication
Digital communicationTelecommunications
Audio-visual technologyElectrical machinery
All sectors
1999 2009
0.6
EPO patents, 2009
0.0 0.1 0.2 0.3
Korea
Turkey
Israel
Chinese Taipei
Brazil
United States
China
India
Ireland
Germany
Netherlands
United Kingdom
Italy
World average
Austria
Norway
Switzerland
Luxembourg
Belgium
France
Denmark
Sweden
Spain
Singapore
Finland
Japan
Canada
Australia
1999 2009

92 | MEASURING THE TECHNOLOGICAL AND ECONOMIC VALUE OF PATENTS
ENQUIRIES INTO INTELLECTUAL PROPERTY'S ECONOMIC IMPACT © OECD 2015
Patent family size
Background and definition
Owing to the Paris Convention (1883), applicants have up to 12 months from the first filing of a patent application (typically in the country of origin) to file applications in other jurisdictions regarding the same invention and claim the priority date of the first application. The set of patents filed in several countries which are related to each other by one or several common priority filings is generally known as patent family. The value of patents is held to be associated with the geographical scope of patent protection, that is, with the number of jurisdictions in which patent protection has been sought (Lanjouw et al., 1998) and large international patent families have been found to be particularly valuable (Harhoff et al., 2003). Applicants might be willing to accept additional costs and delays of extending protection to other countries only if they deem it worthwhile.
The size of patent families is proxied here by the number of patent offices at which a given invention has been protected. Because of differences in the legal procedures of offices worldwide, and of the delays that these might determine, patent family related indicators may suffer from timeliness. The family size index presented here has been normalised with respect to the maximum value exhibited by other patents in the same cohort, with cohorts that are determined by the pair technology–year.
Indicator overview
The statistics shown below relate to EPO patents only. Filing for a European patent allows obtaining protection in all the countries designated in the European Patent Convention (EPC) that have been indicated in the application. A granted EPO patent ultimately represents a "bundle" of national patents, and needs to be validated by the different national patent offices for it to be protected in the designated EPC member countries (OECD, 2009). Patents applications filed to the EPO are by their very nature more prone to broader geographical coverage, i.e. exhibit larger patent families than patents applied for in national patent offices. Hence, compiling patent family indicators over patents originated in e.g. Japan or the United States would very likely lead to different results.
As knowledge about the size of a patent family depends on the delays of publication of the patent offices involved, patent family indicators calculated on recent years may not provide an accurate picture of the geographical breadth of patented inventions. Hence, although the normalised family size index shown below seems to have increased over time, also and especially in recent years, the figures relating to 2004 onwards should be interpreted with care, as they may suffer from truncation. With respect to breadth of the patent families of different technological fields, it emerges that, along with the patents in the micro- and nano-technology fields, patents in the semi-conductors and basic communication technologies are, on average, the most broadly protected worldwide, in 2004. Country-wise, data seems to suggest that patents originating from Norway, Australia, Sweden and the Netherlands tend to get the most extensive coverage worldwide (in 2004).

93 | MEASURING THE TECHNOLOGICAL AND ECONOMIC VALUE OF PATENTS
ENQUIRIES INTO INTELLECTUAL PROPERTY'S ECONOMIC IMPACT © OECD 2015
Figure 2.3. Family size, index, 1990-2009
Family size, average index by technology field Family size, average index by economy
Note: The family size index is normalised according to the maximum family size of the patents in the same cohort (filing date and technology fields). The index has been winsorised to correct for extreme values. The average by economy, provided only for economies with more than 200 patents reporting the index in 2004. The small numbers on the right hand of the average by technology table show the number of observations on which statistics rely.
Source: OECD, calculations based on PATSTAT (EPO, April 2012), October 2012.
0.00
0.10
0.20
0.30
0.40
0.50
0.60
1990 1991 1992 1993 1994 1995 1996 1997 1998 1999 2000 2001 2002 2003 2004 2005 2006 2007 2008 2009
Average Median 75th percentile
31912017
21295443374416423155
295538773086
377413262942
1923
206126931111306760494559589778261910
11905703
35853035
8057339
1194
62904802
68477349
124576
0.0 0.1 0.2 0.3 0.4 0.5
Civil engineeringOther consumer goods
Furniture, gamesTransport
Mechanical elementsThermal processes and apparatus
Other special machinesTextile and paper machines
Engines, pumps, turbinesMachine tools
HandlingEnvironmental technology
Chemical engineeringMicro & nano-technology
Surface technology, coatingMaterials, metallurgy
Basic materials chemistryFood chemistry
Macromolecular chemistryPharmaceuticals
BiotechnologyOrganic fine chemistry
Medical technologyControl
Biological materialsMeasurement
OpticsSemiconductors
IT methods for managementComputer technologyBasic communication
Digital communicationTelecommunications
Audio-visual technologyElectrical machinery
All sectors
1994 2004
EPO patents, 2004
600.6
0.0 0.1 0.2 0.3 0.4 0.5
Chinese Taipei
India
Italy
Germany
Spain
China
Austria
Japan
Belgium
Israel
World total
France
Switzerland
Denmark
Singapore
Canada
Finland
United Kingdom
Korea
United States
Ireland
Luxembourg
Netherlands
Sweden
Australia
Norway
1994 2004

94 | MEASURING THE TECHNOLOGICAL AND ECONOMIC VALUE OF PATENTS
ENQUIRIES INTO INTELLECTUAL PROPERTY'S ECONOMIC IMPACT © OECD 2015
Grant lag
Background and definition
Recent evidence (Harhoff and Wagner, 2009; Régibeau and Rockett, 2010) suggests the existence of an inverse relationship between the value of a patent and the length of the grant lag period - defined as the time elapsed between the filing date of the application and the date of the grant. This literature puts forward a revealed preference argument whereby applicants try to accelerate the grant procedure for their most valuable patents, e.g. by means of well documenting their applications and following closely the work of the patent office. Harhoff and Wagner (2009) find that more controversial claims lead to slower grants and that well-documented applications are approved faster. In addition Régibeau and Rockett (2010) suggest that the time required to reach a granting decision depends on the effort made by the filing party, and remark the importance of accounting for the position of patents in the technology cycle. They conclude that important patents are approved more quickly, and the granting delay decreases as industries move from the early stage of their innovation cycle to later stages. Anecdotal evidence gathered from patent examiners tends to support such empirical findings.
The grant lag index we propose builds on these recent insights. It relies on patents that are stratified by year and technology field and is defined as follows: for each patent p, the grant lag index GrantPi is:
𝐺𝐺𝐺𝑛𝐺𝑃𝑖 = 1 − ∆𝐺 𝑀𝐺𝑀(∆𝐺𝑖)⁄
where Δt is the number of days elapsing between application and granting date; and Max(Δti) is the maximum number of days it has taken any patent belonging to the same cohort i to be granted. The normalisation of the index attempts to control for the possible examination backlogs and increasing workload that may characterise certain years. By construction, the grant lag index is highest when the decision to grant has been taken very rapidly relative to the other patents in the cohort.
Indicator overview
The way the grant lag index has been constructed leads truncation to artificially lower the values of the index for the last available years. For the latest cohorts in fact, e.g. from 2005, the maximum grant lag that can be observed will never be larger than a few years, e.g. six years in the case of patents applied in 2005. This leads to grant lag index values that are seemingly much smaller than those observed in previous years, where much larger variation characterises the time elapsed between the filing date of the application and the date of the grant.

95 | MEASURING THE TECHNOLOGICAL AND ECONOMIC VALUE OF PATENTS
ENQUIRIES INTO INTELLECTUAL PROPERTY'S ECONOMIC IMPACT © OECD 2015
Figure 2.4. Grant lag, index, 1990-2009
Grant lag, average index by technology field Grant lag, average index by economy
Note: The grant lag index is compiled according to the maximum grant lag of patents in the same cohort (filing date and technology fields). The index has been winsorised to correct for extreme values. The average by economy is provided only for economies with more than 50 patents reporting the index in 2004. The small numbers on the right hand of the average by technology table show the number of observations on which statistics rely.
Source: OECD, calculations based on PATSTAT (EPO, April 2012), October 2012.
0.0
0.2
0.4
0.6
0.8
1990 1991 1992 1993 1994 1995 1996 1997 1998 1999 2000 2001 2002 2003 2004 2005 2006 2007 2008 2009
Average Median 75th percentile
1380789926
3336
213659614701447188516971980541
1139
25663768
961408
12971589116719912746616
3111863
104369525
1757455
218814641587
273045671
0.0 0.2 0.4 0.6 0.8
Civil engineeringOther consumer goods
Furniture, gamesTransport
Mechanical elementsThermal processes and apparatus
Other special machinesTextile and paper machines
Engines, pumps, turbinesMachine tools
HandlingEnvironmental technology
Chemical engineeringMicro & nano-technology
Surface technology, coatingMaterials, metallurgy
Basic materials chemistryFood chemistry
Macromolecular chemistryPharmaceuticals
BiotechnologyOrganic fine chemistry
Medical technologyControl
Biological materialsMeasurement
OpticsSemiconductors
IT methods for managementComputer technologyBasic communication
Digital communicationTelecommunications
Audio-visual technologyElectrical machinery
All sectors
1994 2004
EPO patents, 2004
0.0 0.2 0.4 0.6 0.8
Australia
Israel
United States
Singapore
Ireland
Korea
Denmark
Sweden
Japan
Finland
India
Canada
China
Luxembourg
Brazil
Norway
United Kingdom
World total
South Africa
Netherlands
Spain
Belgium
Switzerland
Chinese Taipei
Germany
Italy
France
Austria
1994 2004

96 | MEASURING THE TECHNOLOGICAL AND ECONOMIC VALUE OF PATENTS
ENQUIRIES INTO INTELLECTUAL PROPERTY'S ECONOMIC IMPACT © OECD 2015
Backward citations
Background and definition
In order to evaluate the novelty of the innovation seeking patent protection, patent applicants are asked to disclose the prior knowledge on which they have relied. This entails listing the possible patents, scientific work and other sources of knowledge at the basis of the invention. Such references, also called backward citations, are then checked by the patent examiner during the technical examination. They can be integrated by means of citing additional relevant prior art, or otherwise removed, if deemed unrelated to the invention under exam (see Alcacer and Gittelman, 2006, in this respect). Backward citations are used to assess an invention’s patentability and define the legitimacy of the claims stated in the patent application (OECD, 2009). At the EPO, backward citations are classified according to their relevance for the patent under exam. Of particular importance are “X” and “Y” citations, as they may question the inventive step of the filed patent (X references if taken alone; Y references if combined with others).
Indicators based on the number of citations made to prior patents and prior non-patent literature in a patent can help assess the degree of novelty of an invention and investigate knowledge transfers in terms of citations networks (see e.g. Criscuolo and Verspagen, 2008). In addition, aggregating citation data at the country, technology or firm level may be informative of the dynamics of the inventive process. Controlling for self-citations - i.e. citations made to inventions belonging to the same agent – further allows assessing the technological cumulativeness of a firm, i.e. the extent to which new inventions rely on the company’s prior innovative activities. Backward citations either to the patent or to non-patent literature (e.g. scientific papers) have been found to be positively related to the value of a patent (Harhoff et al., 2003). However, large numbers of backward citations may signal the innovation to be more incremental in nature (Lanjouw and Schankerman, 2001)80. Finally, it is worth remarking that, as citation practices and disclosure rules may differ across patent offices, indicators compiled from alternative data sources are generally not comparable.
In the statistics shown below the number of backward citations per patent is normalised according to the maximum value received by patents in the same year-and-technology cohort. References to non-patent literature have been excluded from the count, whereas self-citations have not.
Indicator overview
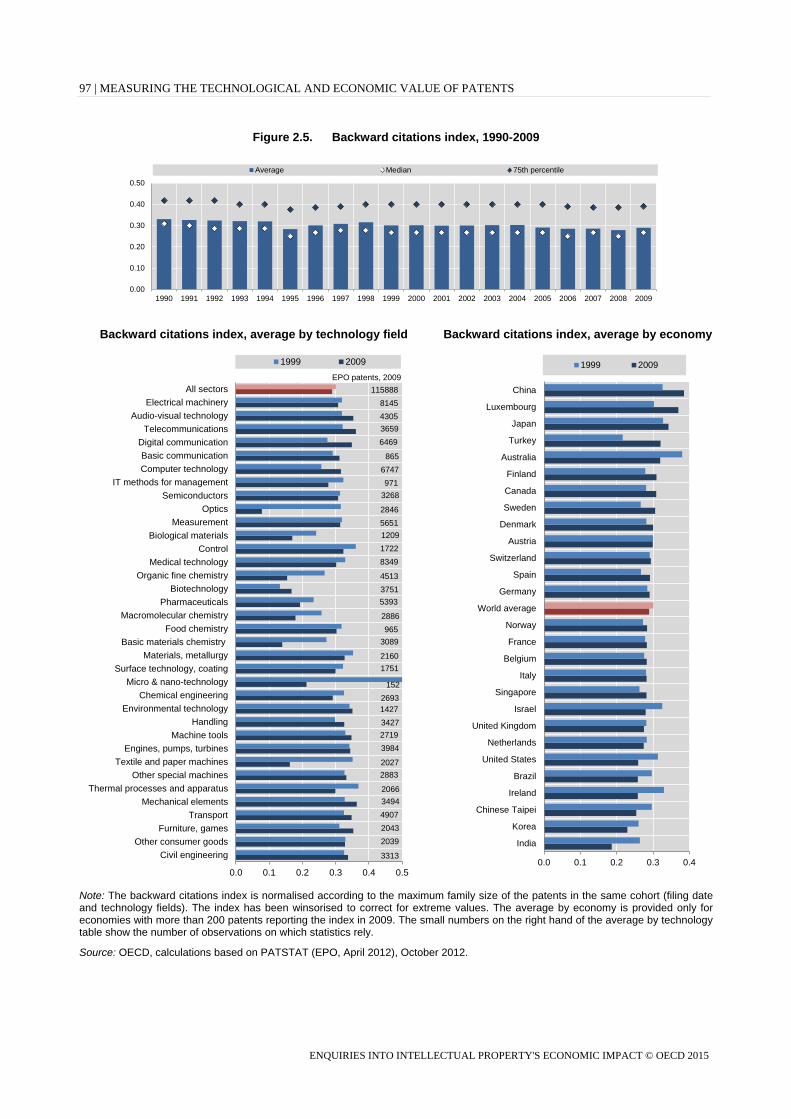
The backward citation indicator does not suffer much from truncation, as backward citations are typically included in the patent document within the first two years since application. The figure shown below suggests that the distribution of the backward citation index is generally left skewed and that it does not change much over time. Average values are always around 0.3 and 75th percentile values are around 0.4. This implies that the average patent features 30% of the maximum number of backward citations contained in the patents belonging to the same cohort. It further entails that the distribution of backward citations has a very long right tail, as can also be seen from the 2009 figures shown below.
97 | MEASURING THE TECHNOLOGICAL AND ECONOMIC VALUE OF PATENTS
ENQUIRIES INTO INTELLECTUAL PROPERTY'S ECONOMIC IMPACT © OECD 2015
Figure 2.5. Backward citations index, 1990-2009
Backward citations index, average by technology field Backward citations index, average by economy
Note: The backward citations index is normalised according to the maximum family size of the patents in the same cohort (filing date and technology fields). The index has been winsorised to correct for extreme values. The average by economy is provided only for economies with more than 200 patents reporting the index in 2009. The small numbers on the right hand of the average by technology table show the number of observations on which statistics rely.
Source: OECD, calculations based on PATSTAT (EPO, April 2012), October 2012.
0.00
0.10
0.20
0.30
0.40
0.50
1990 1991 1992 1993 1994 1995 1996 1997 1998 1999 2000 2001 2002 2003 2004 2005 2006 2007 2008 2009
Average Median 75th percentile
3313
20392043490734942066
28832027
39842719342714272693
152
17512160
3089965
2886
539337514513
83491722120956512846
3268971
6747865
6469365943058145
115888
0.0 0.1 0.2 0.3 0.4 0.5
Civil engineeringOther consumer goods
Furniture, gamesTransport
Mechanical elementsThermal processes and apparatus
Other special machinesTextile and paper machines
Engines, pumps, turbinesMachine tools
HandlingEnvironmental technology
Chemical engineeringMicro & nano-technology
Surface technology, coatingMaterials, metallurgy
Basic materials chemistryFood chemistry
Macromolecular chemistryPharmaceuticals
BiotechnologyOrganic fine chemistry
Medical technologyControl
Biological materialsMeasurement
OpticsSemiconductors
IT methods for managementComputer technologyBasic communication
Digital communicationTelecommunications
Audio-visual technologyElectrical machinery
All sectors
1999 2009
EPO patents, 2009
0.0 0.1 0.2 0.3 0.4
India
Korea
Chinese Taipei
Ireland
Brazil
United States
Netherlands
United Kingdom
Israel
Singapore
Italy
Belgium
France
Norway
World average
Germany
Spain
Switzerland
Austria
Denmark
Sweden
Canada
Finland
Australia
Turkey
Japan
Luxembourg
China
1999 2009

98 | MEASURING THE TECHNOLOGICAL AND ECONOMIC VALUE OF PATENTS
ENQUIRIES INTO INTELLECTUAL PROPERTY'S ECONOMIC IMPACT © OECD 2015
Citations to non-patent literature (NPL)
Background and definition
Most patent applications include a list of references – citations – to earlier patents and to non-patent literature (NPL), e.g. scientific papers that set the boundaries of patents’ claims for novelty, inventive activity and industrial applicability. Non-patent literature consists of peer-reviewed scientific papers, conference proceedings, databases (e.g. DNA structures, gene sequences, chemical compounds, etc.) and other relevant literature. References are added to reflect the prior art that inventions have built upon. Backward citations to NPL can be considered as indicators of the contribution of public science to industrial technology (Narin et al., 1997). They may reflect how close a patented invention is to scientific knowledge and help depict the proximity of technological and scientific developments (Callaert et al., 2006). Cassiman et al. (2008) suggest that patents that cite science (i.e. NPL) may contain more complex and fundamental knowledge, and this in turn may influence the generality of patents. Branstetter (2005) further finds that patents citing NPL are of significantly higher value than patents that do not cite scientific literature.
Indicator overview
The citation to NPL index is calculated here as the number of NPL citations included in a patent divided by the maximum number of NPL citations of patents belonging to the same year and technology cohort. The NPL index captures the relative importance of NPL citations in a patent document vis-à-vis the other patents in its cohort. We further calculate a NPL share index which reflects the propensity of a patent document to cite NPL relative to the whole prior art cited in that same document. This index has been normalised, so that it always ranges between zero and one. References to certain types of NPL such as patent abstracts and commercial patent databases have in both cases been excluded.
The NPL index and NPL share index do not suffer much from truncation – NPL citations represent a subset of the backward citations included in a patent document. As the citations to NPL index chart shows, the majority of patents generally do not cite any non-patent literature as prior art, the distribution of NPL citations is skewed and it features a very long right tail. Over the 1998 to 2009 period relatively very few patents cite NPL, and the 75th percentile values of the NPL index are often zero or anyway very close to zero.

99 | MEASURING THE TECHNOLOGICAL AND ECONOMIC VALUE OF PATENTS
ENQUIRIES INTO INTELLECTUAL PROPERTY'S ECONOMIC IMPACT © OECD 2015
Figure 2.6. Citations to NPL, index, 1990-2009
The charts of NPL index by technology field and by country highlight that different technologies and countries seemingly rely on non-patent literature to a different extent. This may mirror differences in countries’ technological specialisations, and in the stage of development of technologies.
Citations to NPL, index, average by technology field Citations to NPL, index, average by economy
Note: The NPL citation index is normalised according to the maximum family size of the patents in the same cohort (filing date and technology fields). The index has been winsorized to correct for extreme values. The average by economy is provided only for economies with more than 200 patents reporting the index in 2009. The small numbers on the right hand of the average by technology table show the number of observations on which statistics rely.
Source: OECD, calculations based on PATSTAT (EPO, April 2012), October 2012.
0.00
0.05
0.10
0.15
1990 1991 1992 1993 1994 1995 1996 1997 1998 1999 2000 2001 2002 2003 2004 2005 2006 2007 2008 2009
Average Median 75th percentile
331320392043490734942066
28832027398427193427
14272693
15217512160
3089965
2886
539337514513834917221209565128463268971
6747865
646936594305
8145115888
0.00 0.05 0.10 0.15 0.20
Civil engineeringOther consumer goods
Furniture, gamesTransport
Mechanical elementsThermal processes and apparatus
Other special machinesTextile and paper machines
Engines, pumps, turbinesMachine tools
HandlingEnvironmental technology
Chemical engineeringMicro & nano-technology
Surface technology, coatingMaterials, metallurgy
Basic materials chemistryFood chemistry
Macromolecular chemistryPharmaceuticals
BiotechnologyOrganic fine chemistry
Medical technologyControl
Biological materialsMeasurement
OpticsSemiconductors
IT methods for managementComputer technologyBasic communication
Digital communicationTelecommunications
Audio-visual technologyElectrical machinery
All sectors
1999 2009
EPO patents, 2009
0.00 0.05 0.10 0.15
Turkey
Italy
Luxembourg
Chinese Taipei
United States
Korea
Austria
Germany
Norway
Switzerland
India
World average
Australia
Canada
United Kingdom
Israel
Denmark
Brazil
Japan
Sweden
China
Netherlands
Belgium
Finland
Singapore
France
Ireland
Spain
1999 2009

100 | MEASURING THE TECHNOLOGICAL AND ECONOMIC VALUE OF PATENTS
ENQUIRIES INTO INTELLECTUAL PROPERTY'S ECONOMIC IMPACT © OECD 2015
Claims
Background and definition
Claims determine the boundaries of the exclusive rights of a patent owner, given that only the technology or aspects covered in the claims can be legally protected and enforced. The number and content of the claims thus determine the breadth of the rights conferred by a patent (OECD, 2009). Moreover, as the structure of the patent fee is generally based on the number of claims contained in the document, a large number of claims might also imply higher fees. Hence, the number of claims in a patent document may not only reflect the technological breadth of a patent, but also its expected market value: the higher the number of claims, the higher the expected value of the patent (Tong and Davidson, 1994; Lanjouw and Schankerman, 200181, 2004).
We propose here a claim-based indicator that relies on EPO patent data stratified by year of filing and technology field. We further construct an indicator of the number of claims over backward citations. We do so following Lanjouw and Schankerman (2001b), who suggest that backward citations are a sign that a patent belongs to a relatively well-developed technology area, and that property rights are less uncertain. For brevity, we call this latter index the “adjusted” index.
In the statistics below the indicator of the number of claims per patent, as well as the indicator capturing the number of claims over backward citations, has been normalised with respect to the maximum value of the patents in the same cohort.
Indicator overview
The number of claims contained in a patent very much depends upon the rules and regulations of different patent offices. Therefore, indicators relying on claims may vary depending on the data source used. For instance, because of the one claim rule which prevailed in Japan until 1975, applications to the Japan Patent Office still have a significantly lower number of claims than those of patents filed in other offices. Moreover, the number of claims in a patent is influenced by the claim-related fees structure and the changes that may have happened over the years. For instance, in the case of EPO patents, before 1st April 2008 excess claims fees amounting to EUR 45 were charged starting from the 11th claim. After that date, excess claims fees have been raised to EUR 200 but charged starting from the 16th claim.
The claim indicator may be sensitive to truncation, given that claims are reviewed during the examination process, e.g. claims may be dropped or redefined by examiners. Hence, latest patent cohorts, where a relatively higher number of patents may still be under examination, may feature higher mean values of the index.
Technology fields seem to vary in the average number of claims per patent. The same happens by the time patent claims by country are considered. Caution should be used when comparing the 1999 and the 2009 figures, as higher averages of the normalised indicator (displayed below) might simply reflect the different type of distributions that claims exhibit over time. For instance, on average biotech patents feature 22 claims per patent in 1999 and 13 in 2009, and the standard deviation of the distribution of claims is above 16 in 1999 and 12 in 2009. Conversely, micro and nano-tech patents contain on average 20 claims in 1999 and only 12 in 2009, and the standard deviation of their distributions goes from 17 in 1999 to 8 in 2009.

101 | MEASURING THE TECHNOLOGICAL AND ECONOMIC VALUE OF PATENTS
ENQUIRIES INTO INTELLECTUAL PROPERTY'S ECONOMIC IMPACT © OECD 2015
Figure 2.7. Number of claims, index, 1990-2009
Claims, average index by technology field Claims, average index by economy
Note: The claims index is normalised according to the maximum family size of the patents in the same cohort (filing date and technology fields). The index has been winsorized to correct for extreme values. The average by economy is provided only for economies with more than 200 patents reporting the index in 2009. The small numbers on the right hand of the average by technology table show the number of observations on which statistics rely.
Source: OECD, calculations based on PATSTAT (EPO, April 2012), October 2012.
0.0
0.1
0.2
0.3
0.4
0.5
1990 1991 1992 1993 1994 1995 1996 1997 1998 1999 2000 2001 2002 2003 2004 2005 2006 2007 2008 2009
Average Median 75th percentile
3306
20362034489134872063
287420223973
2712341014232686152
17502151
3085964
288053813742
449782931713
1206563628353251
9706714865
64143645
42858119
115465
0.0 0.1 0.2 0.3 0.4 0.5
Civil engineeringOther consumer goods
Furniture, gamesTransport
Mechanical elementsThermal processes and apparatus
Other special machinesTextile and paper machines
Engines, pumps, turbinesMachine tools
HandlingEnvironmental technology
Chemical engineeringMicro & nano-technology
Surface technology, coatingMaterials, metallurgy
Basic materials chemistryFood chemistry
Macromolecular chemistryPharmaceuticals
BiotechnologyOrganic fine chemistry
Medical technologyControl
Biological materialsMeasurement
OpticsSemiconductors
IT methods for managementComputer technologyBasic communication
Digital communicationTelecommunications
Audio-visual technologyElectrical machinery
All sectors
1999 2009
EPO patents, 2009
0.0 0.1 0.2 0.3 0.4
Turkey
India
China
Sweden
Japan
Brazil
Norway
Spain
Finland
France
Denmark
Israel
World average
Luxembourg
Netherlands
United States
Italy
Singapore
Austria
Australia
Switzerland
United Kingdom
Belgium
Korea
Canada
Ireland
Germany
Chinese Taipei
1999 2009

102 | MEASURING THE TECHNOLOGICAL AND ECONOMIC VALUE OF PATENTS
ENQUIRIES INTO INTELLECTUAL PROPERTY'S ECONOMIC IMPACT © OECD 2015
Figure 2.8. Claims over backward citations index, 1990-2009
Claims over backward citations, average index by technology field
Claims over backward citations, average index by economy
Note: The adjusted claims index is normalised according to the maximum family size of the patents in the same cohort (filing date and technology fields). The index has been winsorized to correct for extreme values. The average by economy is provided only for economies with more than 200 patents reporting the index in 2009. The small numbers on the right hand of the average by technology table show the number of observations on which statistics rely.
Source: OECD, calculations based on PATSTAT (EPO, April 2012), October 2012.
0.0
0.1
0.2
0.3
1990 1991 1992 1993 1994 1995 1996 1997 1998 1999 2000 2001 2002 2003 2004 2005 2006 2007 2008 2009
Average Median 75th percentile
2900
1870192946193323176027201953
33852609329113782596136
1701
20943041930
2863
5169341943138174
159610785220
27423035784
5933800
58053415
40037527
108111
0.0 0.1 0.2 0.3
Civil engineeringOther consumer goods
Furniture, gamesTransport
Mechanical elementsThermal processes and apparatus
Other special machinesTextile and paper machines
Engines, pumps, turbinesMachine tools
HandlingEnvironmental technology
Chemical engineeringMicro & nano-technology
Surface technology, coatingMaterials, metallurgy
Basic materials chemistryFood chemistry
Macromolecular chemistryPharmaceuticals
BiotechnologyOrganic fine chemistry
Medical technologyControl
Biological materialsMeasurement
OpticsSemiconductors
IT methods for managementComputer technologyBasic communication
Digital communicationTelecommunications
Audio-visual technologyElectrical machinery
All sectors
1999 2009
EPO patents, 2009
0.0 0.1 0.2 0.3
Turkey
China
Japan
Luxembourg
India
Spain
Norway
Australia
Sweden
Denmark
Austria
Italy
World average
Switzerland
France
Finland
Israel
Belgium
United States
Germany
Netherlands
United Kingdom
Singapore
Korea
Canada
Ireland
Chinese Taipei
1999 2009
103 | MEASURING THE TECHNOLOGICAL AND ECONOMIC VALUE OF PATENTS
ENQUIRIES INTO INTELLECTUAL PROPERTY'S ECONOMIC IMPACT © OECD 2015
Forward citations
Background and definition
The number of citations a given patent receives (forward citations) mirrors the technological importance of the patent for the development of subsequent technologies, and also reflects, to a certain extent, the economic value of inventions (see Trajtenberg, 1990; Hall, et al., 2005; Harhoff et al., 2003). The guidelines for examination in the European Patent Office require that the references to prior art are classified according to their relevance for the patent application in question. While prior art can be cited as documents defining the non-infringing state of the art in a technology field, there also exist three types of citations that restrict the patentability of a patent application. These are:
• X citations: documents that are particularly important when taken alone, to the point that a claimed invention cannot be considered novel (where “novel” means new, i.e. not previously known or used by others);
• I citations: documents that are particularly important when taken alone, to the point that a claimed invention cannot be considered to involve an inventive step or to be non-obvious. The inventive step/non-obvious requirement means that, to be patentable, an invention must not be an obvious variation or combination of previously known subject matter and has to ‘adequately’ differ from the state of the art82;
• Y citations: documents that are particularly relevant if combined with one or more documents of the same category, as such a combination would be obvious to a person skilled in the art.
Forward citation counts presented here are based on EPO patents citations and take into account patent equivalents – that is, patent documents protecting the same invention at several patent offices (see Webb et al., 2005). Forward citations are counted over a period of five or seven years after the publication date. Publication typically occurs 18 months after the filing date of the patent. The windows for observation used should allow capturing the different citation patterns of the technology fields considered. However, the 5/7 years citation lag decreases the timeliness of the indicator: only patents published up to the mid 2000s can thus be considered.
Counts also include self-citations following the findings of Hall et al. (2005) suggesting that self-citations are generally more valuable than citations from external patents. Statistics are shown both with respect to the total number of citations received (all categories of citations) and for citations received as X, I or Y. X-I-Y forward citations signal the cited patent to be of higher technological value. The number of forward citations can be written as:
𝑆𝐼𝐶𝑖,𝑇 = ∑ ∑ 𝑆𝑗,𝑖𝑗∈𝐽(𝑡)𝑃𝑖+𝑇𝑡=𝑃𝑖 ; 𝐶 ≤ 5 or 𝐶 ≤ 7
where CITi,T is the number of forward citations received by patent application i published in year Pi within T years from its publication (in the present case, within five years). Cj,i is a dummy variable that gets value 1 if the patent document j is citing patent document i, and 0 otherwise. J(t) is the set of all patents applications published in year t. The number of forward citations per patent has been normalised with respect to the maximum value observed in the cohort (i.e. in the group of patents filed in the same year and belonging to the same technology field).

104 | MEASURING THE TECHNOLOGICAL AND ECONOMIC VALUE OF PATENTS
ENQUIRIES INTO INTELLECTUAL PROPERTY'S ECONOMIC IMPACT © OECD 2015
Indicator overview
In the mid-2000s, new guidelines for EPO examiners recommended keeping to the legally most relevant citations (i.e. to those potentially invalidating part of the application, i.e. X and Y citations) and to reduce references to “the general state of the art” (type A citations).
Moreover, in 2012 EPO introduced the new citation category I in the PATSTAT database, to distinguish those citations that are particularly relevant for the novelty of a patent (i.e. code X) from those that are particularly important in order to assess the inventive step involved (i.e. code I).
Table 2.1. below shows all the search codes that can be attributed to a patent citation, according to EPO rules. These encompass codes signalling the extreme relevance of prior art for the patent under examination, as well as codes cited for a better understanding of the invention (i.e. code T).
Table 2.1. Search codes allocated to patent citations, EPO
X Particularly relevant documents when taken alone (a claimed invention cannot be considered novel) I Particularly relevant documents when taken alone (a claimed invention cannot be considered to involve an
inventive step) Y Particularly relevant documents if combined with one or more other documents of the same category – such a
combination being obvious to a person skilled in the art A Documents defining the general state of the art (but not belonging to X, I or Y) O Documents which refer to non-written disclosure P Intermediate documents - documents published between the date of filing of the application being examined
and the date of priority claimed T Documents relating to the theory or principle underlying the invention (documents which were published after
the filing date and are not in conflict with the application, but were cited for a better understanding of the invention)
E Potentially conflicting documents – Any patent document bearing a filing or priority date earlier than the filing date of the application searched but published later than that date, and the content of which would constitute prior art
D Documents cited in the application (i.e. already mentioned in the description of the patent application) L Documents cited for other reasons (e.g. a document that may throw doubt on a priority claim)
Note: Category “I” was introduced in 2012. The former X category was split up into 2 categories: X and I. Up to three codes can be allocated to a citation (e.g. AD, XD, XP, YP, APD, XPD).
Source: EPO, PATSTAT data catalog, April 2012.
The forward citation index has decreased over time throughout the period considered, although the statistics related to the last 5 to 7 years should be interpreted with care, due to truncation. The way median and 75th percentile values behave signal that distributions have become progressively more dispersed over time, and that only a very small subset of patents typically receives a large number of forward citations.
Moreover the charts by technology field and by country further highlight the substantial heterogeneity that characterises forward citation patterns, and the changes that seem to have occurred over time. The increasing number of patents filed over the years, coupled with the progressively greater dispersion of forward citation distributions and the different maturity of the technology fields considered may help explain the stylised facts that emerge.
Korea, Belgium, Italy, Switzerland and Spain appear as top scoring countries in terms of average forward citation index by country for the year 2004 when all citations are taken into account as well as when only X, I, and Y citations are considered. No similarly consistent picture can be obtained at the technology field level, where “Computer technology” scores highest in terms of forward citation index in 2004 and “Surface technology, coating”, “Micro and nano-technologies” and “Mechanical elements” appear the most cited when X, I, and Y citations only are considered.

105 | MEASURING THE TECHNOLOGICAL AND ECONOMIC VALUE OF PATENTS
ENQUIRIES INTO INTELLECTUAL PROPERTY'S ECONOMIC IMPACT © OECD 2015
Figure 2.9. Forward citations, index, 1990-2009
Forward citations, average index by technology field Forward citations, average index by economy
Note: The forward citations index is normalised according to the maximum family size of the patents in the same cohort (filing date and technology fields). The index has been winsorised to correct for extreme values. The average by economy is provided only for economies with more than 100 patents reporting the index in 2004. The small numbers on the right hand of the average by technology table show the number of observations on which statistics rely.
Source: OECD, calculations based on PATSTAT (EPO, April 2012), October 2012.
0.00
0.05
0.10
0.15
0.20
1990 1991 1992 1993 1994 1995 1996 1997 1998 1999 2000 2001 2002 2003 2004 2005 2006 2007 2008 2009
Average Median 75th percentile
7349
68474802629011947339805
30353585
5703119019107826
5897455960493067
1111269320611923
602942132637743086
3877295531551642
37445443212920173191
124576
0.00 0.05 0.10 0.15
Civil engineeringOther consumer goods
Furniture, gamesTransport
Mechanical elementsThermal processes and apparatus
Other special machinesTextile and paper machines
Engines, pumps, turbinesMachine tools
HandlingEnvironmental technology
Chemical engineeringMicro & nano-technology
Surface technology, coatingMaterials, metallurgy
Basic materials chemistryFood chemistry
Macromolecular chemistryPharmaceuticals
BiotechnologyOrganic fine chemistry
Medical technologyControl
Biological materialsMeasurement
OpticsSemiconductors
IT methods for managementComputer technologyBasic communication
Digital communicationTelecommunications
Audio-visual technologyElectrical machinery
All sectors
1994 2004
EPO patents, 2004
0.00 0.05 0.10 0.15
Brazil
Australia
New Zealand
South Africa
Norway
Israel
Ireland
Russian Federation
United Kingdom
Netherlands
India
Denmark
United States
Sweden
Luxembourg
Austria
Singapore
Finland
Canada
Chinese Taipei
World average
China
France
Germany
Spain
Switzerland
Italy
Belgium
Korea
1994 2004

106 | MEASURING THE TECHNOLOGICAL AND ECONOMIC VALUE OF PATENTS
ENQUIRIES INTO INTELLECTUAL PROPERTY'S ECONOMIC IMPACT © OECD 2015
Figure 2.10. Forward citations, citations received as X, I or Y, index, 1990-2009
Forward citations, received as X, I or Y, average index by technology field
Forward citations, received as X, I or Y, average index by economy
Note: The forward citations index is normalised according to the maximum family size of the patents in the same cohort (filing date and technology fields). The index has been winsorised to correct for extreme values. The average by economy is provided only for economies with more than 100 patents reporting the index in 2004. The small numbers on the right hand of the average by technology table show the number of observations on which statistics rely.
Source: OECD, calculations based on PATSTAT (EPO, April 2012), October 2012.
0.00
0.05
0.10
0.15
0.20
1990 1991 1992 1993 1994 1995 1996 1997 1998 1999 2000 2001 2002 2003 2004 2005 2006 2007 2008 2009
Average Median 75th percentile
319120172129544337441642315529553877308637741326
294260
19232061
2693111130676049455958977826
191011905703
35853035805
733911946290480268477349
124576
0.00 0.05 0.10 0.15
Civil engineeringOther consumer goods
Furniture, gamesTransport
Mechanical elementsThermal processes and apparatus
Other special machinesTextile and paper machines
Engines, pumps, turbinesMachine tools
HandlingEnvironmental technology
Chemical engineeringMicro & nano-technology
Surface technology, coatingMaterials, metallurgy
Basic materials chemistryFood chemistry
Macromolecular chemistryPharmaceuticals
BiotechnologyOrganic fine chemistry
Medical technologyControl
Biological materialsMeasurement
OpticsSemiconductors
IT methods for managementComputer technologyBasic communication
Digital communicationTelecommunications
Audio-visual technologyElectrical machinery
All sectors
1994 2004
EPO patents, 2004
0.00 0.05 0.10 0.15
Brazil
Australia
New Zealand
South Africa
Norway
Russian Federation
Ireland
Israel
India
United Kingdom
Netherlands
Denmark
Sweden
Austria
United States
Luxembourg
Finland
Singapore
China
World average
France
Canada
Germany
Chinese Taipei
Switzerland
Italy
Spain
Belgium
Korea
1994 2004

107 | MEASURING THE TECHNOLOGICAL AND ECONOMIC VALUE OF PATENTS
ENQUIRIES INTO INTELLECTUAL PROPERTY'S ECONOMIC IMPACT © OECD 2015
Breakthrough inventions
Background and definition
Breakthrough inventions are high-impact innovations which serve as a basis for future technological developments, new products or services. Breakthrough inventions have been found to be strongly associated with entrepreneurial strategies and with further technological development, and are at the centre of many recent studies.
Ahuja and Lampert (2001) explore the relationship between the organisation of established firms and the creation of breakthrough inventions. To this end, they define breakthrough inventions as the top 1% of cited patents (i.e. the most highly cited patents) and find that three organisation-related “traps” generally hinder breakthrough inventions: the familiarity, the maturity and the propinquity traps83. Srivastava and Gnyawali (2011) investigate the tension between value creation and value protection, and find that the quality and diversity of the technological resources of a firm are positively correlated with breakthrough innovations. Kerr (2010) relies on Ahuja and Lampert’s definition of breakthrough invention in order to investigate the speed at which clusters of technology-related inventions migrate spatially in the aftermath of breakthrough inventions. He finds evidence in support of significantly higher patenting growth in cities and technologies where breakthrough inventions have occurred. Finally, Popp at al. (2012) analyse the return to R&D in some energy technology sectors and find, among other results, that high value (i.e. breakthrough) patents may induce subsequent innovations in those sectors.
We follow here the definition of breakthrough invention à la Ahuja and Lampert, i.e. as the top 1% cited patents. Similarly to the way in which the different forward citation indicators have been constructed, breakthrough inventions may also be identified by means of restricting the type of citations considered to those coded as X, I and Y.
Statistics related to breakthrough indicators built on all citations, as well as on X, I and Y citations only are shown below. Counts of breakthrough inventions are aggregated at the country and at the technological field level using fractional counts.
Indicator overview
Being built on forward citations, the breakthrough invention indicators also suffer from timeliness: a 5 (or 7) year period after publication needs to be allowed to identify the top cited patents in a certain technology field and year cohort.
From the figure below, it can be seen that the share of breakthrough patents in the total number of patents has persistently decreased over time. This may be due to the distribution of patents across technology fields and to the fact that a proportionally higher number of patents never get cited: as the overall number of cited patents decreases, also the number of top 1% cited patents decreases.

108 | MEASURING THE TECHNOLOGICAL AND ECONOMIC VALUE OF PATENTS
ENQUIRIES INTO INTELLECTUAL PROPERTY'S ECONOMIC IMPACT © OECD 2015
Figure 2.11. Share of breakthrough patents in total, 1990-2009
Technology fields seem to differ markedly with respect to the number of breakthrough inventions they feature, with Japan, the United States, and Germany that most contribute to generate breakthrough inventions. New entrants like Korea also appear in 2004.
Share of breakthrough patents in total, by technology field (percentages)
Share of economies in breakthrough patents, percentages
Source: OECD, calculations based on PATSTAT (EPO, April 2012), October 2012. The small numbers on the right hand of the average by technology table show the number of observations on which statistics rely.
0.0
0.2
0.4
0.6
0.8
1990 1991 1992 1993 1994 1995 1996 1997 1998 1999 2000 2001 2002 2003 2004 2005 2006 2007 2008 2009
% Breakthrough patents Breakthrough patents (X,I,Y)
873
18
7
587
128
848
57
43
1044
10184
1107
10
114
218
13
1720
286
0 0.2 0.4 0.6 0.8 1
Civil engineeringOther consumer goods
Furniture, gamesTransport
Mechanical elementsThermal processes and apparatus
Other special machinesTextile and paper machines
Engines, pumps, turbinesMachine tools
HandlingEnvironmental technology
Chemical engineeringMicro & nano-technology
Surface technology, coatingMaterials, metallurgy
Basic materials chemistry Food chemistry
Macromolecular chemistryPharmaceuticals
BiotechnologyOrganic fine chemistry
Medical technologyControl
Biological materialsMeasurement
OpticsSemiconductors
IT methods for managementComputer technologyBasic communication
Digital communicationTelecommunications
Audio-visual technologyElectrical machinery
All sectors
1994 2004
Breakthrough patents, 2004
1.7 (1)
1.1
0 10 20 30 40
Belgium
Denmark
Australia
United Kingdom
Spain
Chinese Taipei
Sweden
Austria
Canada
Finland
Italy
France
Netherlands
Switzerland
Korea
Germany
United States
Japan
1994 2004
109 | MEASURING THE TECHNOLOGICAL AND ECONOMIC VALUE OF PATENTS
ENQUIRIES INTO INTELLECTUAL PROPERTY'S ECONOMIC IMPACT © OECD 2015
Generality index
Background and definition
Forward patent citations can be used to assess the range of later generations of inventions that have benefitted from a patent, by means of measuring the range of technology fields – and consequently industries - that cite the patent (Bresnahan and Trajtenberg, 1995). The patent generality index à la Trajtenberg et al. (1997) has been used in a variety of studies aimed to e.g. identify general purpose technologies (Hall and Trajtenberg, 2004); investigate the role of universities as sources of commercial technologies (Henderson et al., 1998); study participation and rent sharing in patent pools (Layne-Farrar and Lerner, 2011); and understand the functioning of the market for innovation and the way patent rights are enforced (Galasso et al, 2011).
The patent generality index proposed here is based on a modification of the Hirschman-Herfindahl Index (HHI) and relies on information concerning the number and distribution of citations received (forward citations) and the technology classes (IPC) of the patents these citations come from. Differently from the way in which generality has been calculated in previous studies (e.g. Hall et al, 2001b) we consider all IPC classes contained in the citing patent documents and account for the number and distribution of both 4-digit and n-digit IPC technology classes contained in citing patents, where n refers to the highest level of disaggregation possible (e.g. A61K 31/5575). Citation measures are built on EPO patents and patent equivalents have been consolidated. Forward citations cover all categories of citations, and are restricted to a 5-year citation window.
Let X be the focal patent with Yi patents citing the focal patent X, with i = 1, ….., N and let 𝛽𝑗𝑖 be defined as follows:
𝛽𝑗𝑖 = 𝑇𝑗𝑖𝑛
𝑇𝑖𝑛
where 𝐶𝑖𝑛 is the total number of IPC n-digit classes in yi
𝐶𝑗𝑖𝑛 is the total number of of IPC n-digit classes in the jth IPC4 digit class in yi and
j=1… Mi is the cardinal of all IPC4-digit classes in yi
Our generality index is defined as:
𝐺𝑋 = 1 − ∑ �1𝑁∑ 𝛽𝑗𝑖𝑁𝑖=1 �
2 𝑀𝑖
𝑗=1
As 𝛽𝑗𝑖 =𝑇𝑗𝑖n
𝑇𝑖n , the generality index can be rewritten as:
𝐺𝑋 = 1 − ∑ �1𝑁∑
𝑇𝑗𝑖𝑛
𝑇𝑖𝑛
𝑁𝑖=1 �
2 𝑀𝑖
𝑗=1
Which has a denominator equal to 𝐶𝑖𝑛 ∗ 𝑁.
Indicator overview
The proposed generality index is defined between zero and one, and the measure is high if a patent is cited by subsequent patents belonging to a wide range of fields – i.e. the considered invention has been relevant for a number of later inventions, and not only in its own technology class. Conversely, if most citations are concentrated in a few fields the generality index is low, i.e. close to zero. As suggested by Hall et al. (2001a), the generality measure may be biased when the number of patents on which it is based

110 | MEASURING THE TECHNOLOGICAL AND ECONOMIC VALUE OF PATENTS
ENQUIRIES INTO INTELLECTUAL PROPERTY'S ECONOMIC IMPACT © OECD 2015
is small. However, as we account for all IPC n-digit classes contained in the citing patent documents our denominator becomes 𝐶𝑖𝑛 ∗ 𝑁, and our generality indicator suffers less from this small number of observation bias.
Generality measures strongly depend on the patent classification scheme used: the finer the level of classification the higher the measures. Moreover, the generality index treats technologies that are closely related but are not in the same class in the same way as they treat very distant technology fields. This may lead to overestimate or underestimate the generality of patents (Hall and Trajtenberg, 2004).
Figure 2.12. Generality index, 1990-2009
Generality Index, average by technology field Generality Index, average by economy
Note: The average by economy is provided only for economies with more than 20 patents reporting the index in 2004.
Source: OECD, calculations based on PATSTAT (EPO, April 2012), October 2012. The small numbers on the right hand of the average by technology table show the number of observations on which statistics rely.
0.0
0.2
0.4
0.6
0.8
1990 1991 1992 1993 1994 1995 1996 1997 1998 1999 2000 2001 2002 2003 2004 2005 2006 2007 2008 2009
Average Median 75th percentile
649462
4451553
892448673691
1083
650
81632148813
393463
565206
717587
406
762
1338416
126115282064280
1273188
13571165
16241728
25193
0.0 0.2 0.4 0.6
Civil engineeringOther consumer goods
Furniture, gamesTransport
Mechanical elementsThermal processes and apparatus
Other special machinesTextile and paper machines
Engines, pumps, turbinesMachine tools
HandlingEnvironmental technology
Chemical engineeringMicro & nano-technology
Surface technology, coatingMaterials, metallurgy
Basic materials chemistry Food chemistry
Macromolecular chemistryPharmaceuticals
BiotechnologyOrganic fine chemistry
Medical technologyControl
Biological materialsMeasurement
OpticsSemiconductors
IT methods for managementComputer technologyBasic communication
Digital communicationTelecommunications
Audio-visual technologyElectrical machinery
All sectors
1994 2004
EPO patents, 2004
0.0 0.2 0.4 0.6
Norway
Chinese Taipei
China
Singapore
Austria
Italy
Korea
Israel
France
Australia
Luxembourg
Sweden
Spain
Switzerland
Germany
Canada
World average
United Kingdom
Japan
Ireland
Netherlands
United States
India
Denmark
Belgium
Finland
1994 2004

111 | MEASURING THE TECHNOLOGICAL AND ECONOMIC VALUE OF PATENTS
ENQUIRIES INTO INTELLECTUAL PROPERTY'S ECONOMIC IMPACT © OECD 2015
Originality index
Background and definition
Patent originality refers to the breadth of the technology fields on which a patent relies. The patent originality measure, first proposed by Trajtenberg et al. (1997), operationalises this concept of knowledge diversification and its importance for innovation: inventions relying on a large number of diverse knowledge sources (i.e. on patents belonging to a wide array of technology fields) are supposed to lead to original results. Patent originality has been used in a wide range of studies, e.g. on the creation of venture-backed start-ups (Gompers et al., 2005); the duration and outcome of the patent examination procedure at the European Patent Office (Harhoff and Wagner, 2009); and the value of post-merger patents vis-à-vis pre-merger ones (Stahl, 2010).
Building on Hall at al. (2001b), we define the originality indicator as:
𝑆𝐺𝑂𝑂𝑂𝑛𝐺𝑂𝑂𝐺𝑂𝑃 = 1 −� 𝑠𝑝𝑗2𝑛𝑝
𝑗
where spj is the percentage of citations made by patent p to patent class j out of the np IPC 4-digit (or 7-digit) patent codes contained in the patents cited by patent p. Citation measures are built on EPO patents and account for patent equivalents.
The construction of the patent originality indicator follows a logic that is very similar to the one used to construct the generality index, the main difference being that generality measures rely on forward citations, whereas originality relies on backward cites. The specification proposed here further differentiates the generality and the originality indicators, as the former accounts for the distribution of 7-digit subclasses within the 4 digit classes they belong to, as well as for the distribution of the 4-digit classes contained in citing documents; whereas the latter only accounts for the distribution of citations made at the 4-digit (or 7-digit, in the alternative specification proposed) level.
Indicator overview
Differently from Hall at al. (2001b), we rely on all the IPC classes contained in the patent documents that the focal patent cites, and compute the indicator at the 8-digit level. We do so in order to minimise the bias typically arising when the number of citations is small.
The figures below show statistics related to the patent originality index, i.e. to values of the patent originality indicator normalised with respect to the maximum value of patents in the same technology and year cohort. As can be seen, patent originality index values and distributions seem to have remained pretty stable over the years, although denoting a progressive small increase. This is not true however for the different technology fields, which appear to vary greatly in the extent to which they rely or broad or narrow prior art. Country specific differences in the average values of the index also emerge, although they are not as marked as those noted by technology field. It is also worth noticing that both the indices by sector and those by country barely change between 1999 and 2009.

112 | MEASURING THE TECHNOLOGICAL AND ECONOMIC VALUE OF PATENTS
ENQUIRIES INTO INTELLECTUAL PROPERTY'S ECONOMIC IMPACT © OECD 2015
Figure 2.13. Originality index, 1990-2009
Originality, average index by technology field Originality, average index by economy
Note: The average by economy is provided only for economies with more than 200 patents reporting the index in 2009. The small numbers on the right hand of the average by technology table show the number of observations on which statistics rely.
Source: OECD, calculations based on PATSTAT (EPO, April 2012), October 2012.
0.00
0.20
0.40
0.60
0.80
1.00
1990 1991 1992 1993 1994 1995 1996 1997 1998 1999 2000 2001 2002 2003 2004 2005 2006 2007 2008 2009
Average Median 75th percentile
29021868
1937463233291760272819573395
26133305
13792601136
1702
21013043930
286951703419
43258223
1602107952302752
3045784
5956800
5832342140217549
108395
0 0.2 0.4 0.6 0.8 1
Civil engineeringOther consumer goods
Furniture, gamesTransport
Mechanical elementsThermal processes and apparatus
Other special machinesTextile and paper machines
Engines, pumps, turbinesMachine tools
HandlingEnvironmental technology
Chemical engineeringMicro & nano-technology
Surface technology, coatingMaterials, metallurgy
Basic materials chemistry Food chemistry
Macromolecular chemistryPharmaceuticals
BiotechnologyOrganic fine chemistry
Medical technologyControl
Biological materialsMeasurement
OpticsSemiconductors
IT methods for managementComputer technologyBasic communication
Digital communicationTelecommunications
Audio-visual technologyElectrical machinery
All sectors
1999 2009
EPO patents, 2009
0.0 0.2 0.4 0.6 0.8
Turkey
Chinese Taipei
Italy
Ireland
Norway
Korea
Singapore
Austria
Sweden
France
Luxembourg
Germany
Spain
United Kingdom
Netherlands
Denmark
Belgium
Switzerland
World average
Finland
United States
Australia
China
Canada
Israel
Japan
India
1999 2009

113 | MEASURING THE TECHNOLOGICAL AND ECONOMIC VALUE OF PATENTS
ENQUIRIES INTO INTELLECTUAL PROPERTY'S ECONOMIC IMPACT © OECD 2015
Radicalness index
Background and definition
Although the concept of radicalness may appear intuitive and easy to grasp, as it evokes something completely different from what exists, defining and measuring the technological radicalness of inventions remains challenging. An index of patent radicalness has been proposed by Shane (2001), where the radicalness of a patent is measured as a time invariant count of the number of IPC technology classes in which the patents cited by the given patent are, but in which the patent itself is not classified. He argues that the more a patent cites previous patents in classes other than the ones it is in, the more the invention should be considered radical, as it builds upon paradigms that differ from the one to which it is applied.
This definition has been adapted in this paper to account for the relative weight of each 4-digit technology class contained in the cited patents. The indicator has further been normalised with respect to the total number of IPC classes listed in the backward citations, so that its value ranges from zero to one. This entails that the overall number of citations, i.e. the denominator of the index, corresponds to the count of citations at the most disaggregated level available, e.g. H05B 41/231. The numerator instead reflects the number of the IPC 4-digit classes contained in the cited documents, weighted by the times these classes appear at the more disaggregated level. The OECD radicalness indicator à la Shane is therefore compiled as follows:
𝑅𝐺𝑅𝑂𝑅𝐺𝑂𝑛𝑅𝑠𝑠𝑃 = � 𝑆𝐶𝑗𝑛𝑝
𝑗𝑛𝑝� ; 𝐼𝑆𝑆𝑝𝑗 ≠ 𝐼𝑆𝑆𝑝
where CTj denotes the count of IPC-4 digit codes IPCpj of patent j cited in patent p that is not allocated to patent p, out of n IPC classes in the backward citations counted at the most disaggregated level available (up to the 5th hierarchical level). The higher the ratio, the more diversified the array of technologies on which the patent relies upon.
Indicator overview
The indicator proposed by Shane (2001) is fundamentally backward-looking in nature as it captures the radicalness of a patent in terms of the extent to which it differs from the predecessors it relies upon. It nevertheless remains silent about whether a patent is also radical compared to other patents filed in the same field during the very same period – that is whether it is ‘unique’ compared to contemporaneous inventions – and with respect to the change that the invention might have brought about in terms of subsequent technological developments.
Dahlin and Behrens (2005) conversely propose a definition of radicalness that relies on the novelty, uniqueness and impact on future technological developments that patented inventions might have. They analyse the citation patterns observed before, during and after the filing of a patent, in order to assess whether it can be considered a radical invention. However the indicator they propose is binary in nature, i.e. a patent is considered radical or not, and does not assess the degree of radicalness of an invention. Continuous indicators rather than discrete ones nevertheless prove extremely useful to assess, among others, the overall value of patent portfolios, and the innovative activity and output of firms over time. The OECD is currently working with external experts to propose and operationalise a definition of radicalness that builds on Dahlin and Behrens’ work and takes into account radicalness with respect to previous, contemporaneous and future developments. The ultimate goal is to construct a continuous radicalness indicator that can be calculated for all patents. Waiting for these new developments, the indicator shown below follows the radicalness definition by Shane (2001).
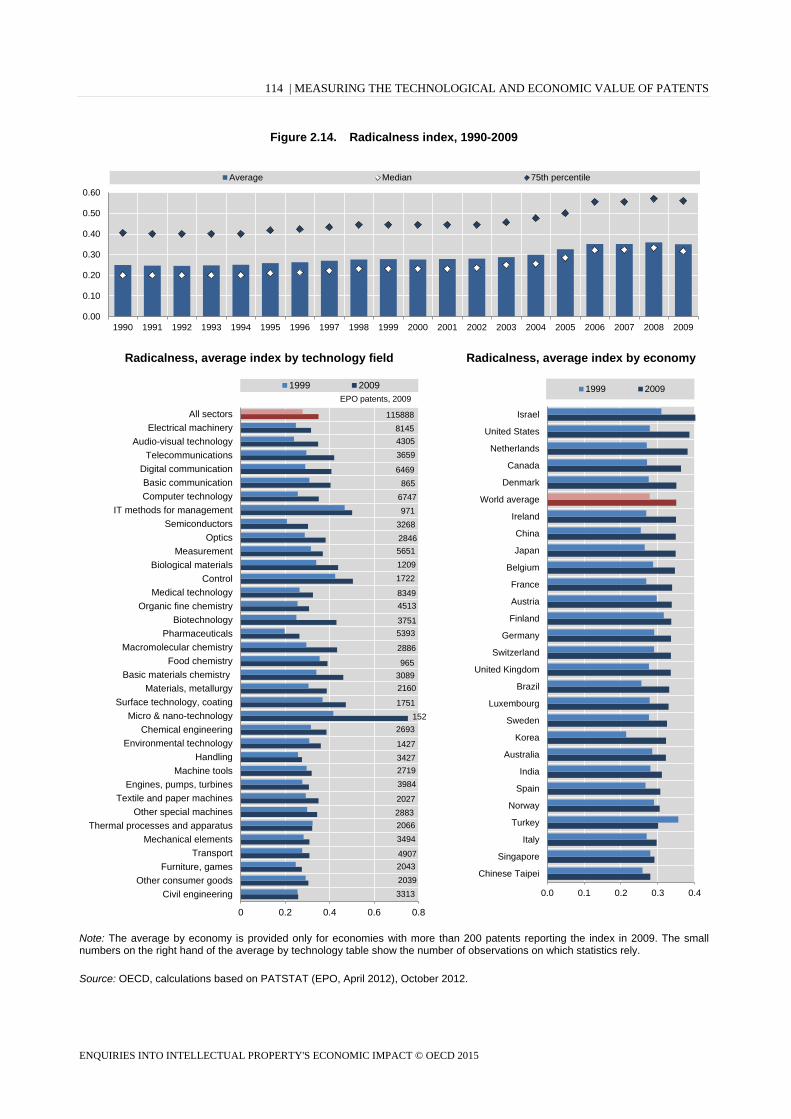
114 | MEASURING THE TECHNOLOGICAL AND ECONOMIC VALUE OF PATENTS
ENQUIRIES INTO INTELLECTUAL PROPERTY'S ECONOMIC IMPACT © OECD 2015
Figure 2.14. Radicalness index, 1990-2009
Radicalness, average index by technology field Radicalness, average index by economy
Note: The average by economy is provided only for economies with more than 200 patents reporting the index in 2009. The small numbers on the right hand of the average by technology table show the number of observations on which statistics rely.
Source: OECD, calculations based on PATSTAT (EPO, April 2012), October 2012.
0.00
0.10
0.20
0.30
0.40
0.50
0.60
1990 1991 1992 1993 1994 1995 1996 1997 1998 1999 2000 2001 2002 2003 2004 2005 2006 2007 2008 2009
Average Median 75th percentile
3313203920434907
3494206628832027
3984271934271427
2693152
1751
21603089965
2886
53933751
45138349
17221209565128463268971
6747865
6469
365943058145
115888
0 0.2 0.4 0.6 0.8
Civil engineeringOther consumer goods
Furniture, gamesTransport
Mechanical elementsThermal processes and apparatus
Other special machinesTextile and paper machines
Engines, pumps, turbinesMachine tools
HandlingEnvironmental technology
Chemical engineeringMicro & nano-technology
Surface technology, coatingMaterials, metallurgy
Basic materials chemistryFood chemistry
Macromolecular chemistryPharmaceuticals
BiotechnologyOrganic fine chemistry
Medical technologyControl
Biological materialsMeasurement
OpticsSemiconductors
IT methods for managementComputer technologyBasic communication
Digital communicationTelecommunications
Audio-visual technologyElectrical machinery
All sectors
1999 2009EPO patents, 2009
0.0 0.1 0.2 0.3 0.4
Chinese Taipei
Singapore
Italy
Turkey
Norway
Spain
India
Australia
Korea
Sweden
Luxembourg
Brazil
United Kingdom
Switzerland
Germany
Finland
Austria
France
Belgium
Japan
China
Ireland
World average
Denmark
Canada
Netherlands
United States
Israel
1999 2009

115 | MEASURING THE TECHNOLOGICAL AND ECONOMIC VALUE OF PATENTS
ENQUIRIES INTO INTELLECTUAL PROPERTY'S ECONOMIC IMPACT © OECD 2015
Patent renewal
Background and definition
The renewal of a patent signals that the invention described in the patent document is still useful, i.e. that it has some value, as no rational agent would be willing to pay money for a right that is worthless.
Information about the renewal of patents has been used in a wide array of studies, which generally suggest that more valuable patents are renewed for longer periods (e.g. Pakes, 1986). Following the pioneering work of Pakes and Schankerman (1984), patent renewal data have been used to estimate the private value of patent protection. These models rely on the assumption that patent owners make profit-maximising renewal decisions, and that patent renewals’ rates can be used to estimate the private value of patent protection. Patent renewal data have also been used to weight patent counts, and to obtain more precise measures of innovative output. This is the path followed by e.g. Lanjouw, Pakes and Putnam (1998), who hold that more valuable inventions generate larger and/or longer lived patent families. More recently, Svensson (2012) investigates the relationship that exists between the commercialisation and the renewal of patents, and finds a positive correlation between commercialisation and the use of patents for defensive purposes on the one hand and patent renewal on the other hand. He further finds that the value of patents influences both commercialisation and renewal decisions.
The OECD patent renewal indicator corresponds to the simple count of years during which a granted patent has been kept alive, i.e. the latest year in which it has been renewed or until it has lapsed or has been withdrawn. Years are counted starting from the year in which a patent has been applied.
Indicator overview
The box 2.1. below highlights the patent codes used to measure patent renewal. In the case of patent renewals no robustness checks are presented, as the indicator is the simple count of years during which a patent has been renewed.
Box 2.1. Identifying the length of patent renewal
The EPO worldwide legal status database (INPADOC) contains information related to any administrative act or action concerning a patent document, from application onwards, including the post-grant phase. A variety of codes is typically allocated to each legal event, as it depends on the specific patent authority responsible for the act or action. The codes listed below refer to events related to EPO patent applications only. For alternative patent authorities, other codes apply.
List of events relating to the length of EPO patent renewal in the INPADOC legal status database
The life duration of a patent can be assessed by the latest legal event that occurred, namely the withdrawal, the renewal (payment of fees) or the lapse of patents. Hence, it is critical to respect the events’ chronology for each patent in the database.
• Granted EPO patent: Publn_first_grant = 1 (in PATSTAT, PAT_PUBLN table);
• Renewed EPO patent: prs_code = PGFP (annual fees paid to national office) and latest payment date;
• Withdrawn EPO patent: prs_code = 18D (patent deemed withdrawn) or prs_code = 18W (patent withdrawn) and either date in force or withdrawal date variables; D18D and D18W codes cancel the former 18D and 18W events. If any D18D or D18W event occurred after 18D or 18W, then the patent is not considered as withdrawn;
• Lapsed EPO patent: prs_code = PG25 (lapsed in a contracting state announced via postgrant information from national office to EPO) and earliest date in force.

116 | MEASURING THE TECHNOLOGICAL AND ECONOMIC VALUE OF PATENTS
ENQUIRIES INTO INTELLECTUAL PROPERTY'S ECONOMIC IMPACT © OECD 2015
Figure 2.15. Share of patents renewed at least 5 or 7 years in total granted patents, 1978-2009
Patent renewal, average duration of patents in number of years, by technology field
Patent renewal, average duration of patents in number of years, by economy
Note: The average by economy is provided only for economies with more than 50 patents filed in 1998 and renewed. The small numbers on the right hand of the average by technology table show the number of observations on which statistics rely.
Source: OECD, calculations based on PATSTAT (EPO, April 2012) and INPADOC Legal Status (EPO, April 2012), October 2012.
0
25
50
75
100
% At least 5 years At least 7 years
1589787
8911887
1762659
20191706
14021711
1991682
1481
948
15391581512
25671649150832392020733402
263818941156
211530779347
1037
2161
291449743
0 5 10 15
Civil engineeringOther consumer goods
Furniture, gamesTransport
Mechanical elementsThermal processes and apparatus
Other special machinesTextile and paper machines
Engines, pumps, turbinesMachine tools
HandlingEnvironmental technology
Chemical engineeringMicro & nano-technology
Surface technology, coatingMaterials, metallurgy
Basic materials chemistryFood chemistry
Macromolecular chemistryPharmaceuticals
BiotechnologyOrganic fine chemistry
Medical technologyControl
Biological materialsMeasurement
OpticsSemiconductors
IT methods for managementComputer technologyBasic communication
Digital communicationTelecommunications
Audio-visual technologyElectrical machinery
All sectors
1978 1988EPO patents, 1988
0 5 10 15
Chinese Taipei
Hungary
South Africa
Spain
Luxembourg
Israel
Italy
United Kingdom
Canada
Finland
Australia
Germany
Austria
Netherlands
Switzerland
France
United States
Sweden
Belgium
World average
Denmark
Ireland
Norway
Japan
1978 1988

117 | MEASURING THE TECHNOLOGICAL AND ECONOMIC VALUE OF PATENTS
ENQUIRIES INTO INTELLECTUAL PROPERTY'S ECONOMIC IMPACT © OECD 2015
The top figure above shows the percentage of patents renewed for at least 5 (or 7) years, by year cohort. This is done to minimise the effect of truncation over the statistics proposed, as patents have a life of up to 20 years.
Patent value: composite index
Background and definition
Patent value indicators try to capture both the technological and the economic value of innovations, and are typically based on patent citations, claims, patent renewals and patent family size. They are considered meaningful measures of research productivity and are found to be correlated with the social and private value of the patented inventions. The difference in average patent value across firms is generally associated with the market’s evaluation of firms, including their market capitalisation, the assessments made by financing institutions and prospective acquirers, and so on.
The patent value composite index presented here is an experimental one and may be subject to further refinement. The patent value index is a composite indicator based on four to six dimensions of patents’ underlying value: forward citations; patent family size; number of claims; generality index; plus backward citations and grant lag. It builds on Lanjouw and Shankerman (2004) and incorporates the generality measure, and a measure accounting for the length of the examination process (i.e. the grant lag index). All components are normalised according to patent cohorts stratified by year and technological field and are given equal importance (no weights).
Three alternative definitions of the experimental patent value indicator are proposed, in order to better see the impact of the grant lag index and the backward citations index on the indicator:
i. Patent value index 4 – 4 components: number of forward citations (up to 5 years after publication); patent family size; number of claims; and the patent generality index. Only granted patents are covered by the index.
ii. Patent value index 4b – 4 components, bis: number of forward citations (up to 5 years after publication); patent family size; corrected claims; and the patent generality index. Only granted patents are covered by the index.
iii. Patent value index 6 – 6 components: covers the same components as above, plus the number of backward citations and the grant lag index.
Indicator overview
As the patent value measure proposed is based on indicators like forward citations and grant lags, it suffers from timeliness. It should also be noted that using alternative data sources, e.g. US Patent and Trademark Office or Japan Patent Office, different methodologies or observation periods may affect patents’ scores, countries’ rank and sectors’ positions.
The three specifications proposed exhibit somewhat different time trends, although not marked ones. Whatever the specification though, micro and nano technologies seemingly feature the highest patent value - although the numbers rely on a very small set of observations. South Africa, Australia, Canada, Norway and the United Kingdom appear as top patent value countries according to all specifications proposed.

118 | MEASURING THE TECHNOLOGICAL AND ECONOMIC VALUE OF PATENTS
ENQUIRIES INTO INTELLECTUAL PROPERTY'S ECONOMIC IMPACT © OECD 2015
Figure 2.16. Patent Value Index (4) Index, 1990-2009
Patent Value Index (4), average by technology field Patent Value Index (4), average by economy
Note: The patent value composite index is based on the average value of its normalised component, by cohort of filing date and technology fields. The average by economy is provided only for economies with more than 50 patents reporting the index in 2004.
Source: OECD, calculations based on PATSTAT (EPO, April 2012), October 2012. The small numbers on the right hand of the average by technology table show the number of observations on which statistics rely.
0.00
0.10
0.20
0.30
0.40
1990 1991 1992 1993 1994 1995 1996 1997 1998 1999 2000 2001 2002 2003 2004 2005 2006 2007 2008 2009
Average Median 75th percentile
1380789926
33362136596
14701447
188516971980541
113925
663768
961408
129715891167
1991
2746616
31118631043695
25
1757455
2188146415872730
45671
0.0 0.1 0.2 0.3 0.4
Civil engineeringOther consumer goods
Furniture, gamesTransport
Mechanical elementsThermal processes and apparatus
Other special machinesTextile and paper machines
Engines, pumps, turbinesMachine tools
HandlingEnvironmental technology
Chemical engineeringMicro & nano-technology
Surface technology, coatingMaterials, metallurgy
Basic materials chemistry Food chemistry
Macromolecular chemistryPharmaceuticals
BiotechnologyOrganic fine chemistry
Medical technologyControl
Biological materialsMeasurement
OpticsSemiconductors
IT methods for managementComputer technologyBasic communication
Digital communicationTelecommunications
Audio-visual technologyElectrical machinery
All sectors
1994 2004
EPO patents, 2004
0.0 0.1 0.2 0.3 0.4
Chinese Taipei
Austria
Germany
India
China
Spain
Japan
Singapore
Brazil
World average
Belgium
Italy
Switzerland
Netherlands
France
Israel
Luxembourg
Finland
United States
Sweden
Korea
Ireland
Denmark
United Kingdom
Norway
Canada
Australia
South Africa
1994 2004

119 | MEASURING THE TECHNOLOGICAL AND ECONOMIC VALUE OF PATENTS
ENQUIRIES INTO INTELLECTUAL PROPERTY'S ECONOMIC IMPACT © OECD 2015
Figure 2.17. Patent Value Index (4b), 1990-2009
Patent Value Index (4b), average by technology field Patent Value Index (4b), average by economy
Note: The patent value composite index is based on the average value of its normalised component, by cohort of filing date and technology fields. The average by economy is provided only for economies with more than 50 patents reporting the index in 2004.
Source: OECD, calculations based on PATSTAT (EPO, April 2012), October 2012.
0.00
0.10
0.20
0.30
0.40
1990 1991 1992 1993 1994 1995 1996 1997 1998 1999 2000 2001 2002 2003 2004 2005 2006 2007 2008 2009
Average Median 75th percentile
0.0 0.1 0.2 0.3 0.4
Civil engineeringOther consumer goods
Furniture, gamesTransport
Mechanical elementsThermal processes and apparatus
Other special machinesTextile and paper machines
Engines, pumps, turbinesMachine tools
HandlingEnvironmental technology
Chemical engineeringMicro & nano-technology
Surface technology, coatingMaterials, metallurgy
Basic materials chemistry Food chemistry
Macromolecular chemistryPharmaceuticals
BiotechnologyOrganic fine chemistry
Medical technologyControl
Biological materialsMeasurement
OpticsSemiconductors
IT methods for managementComputer technologyBasic communication
Digital communicationTelecommunications
Audio-visual technologyElectrical machinery
All sectors
1994 2004
0.0 0.1 0.2 0.3 0.4
Chinese Taipei
Austria
China
Germany
Spain
Singapore
India
Japan
Brazil
World average
Belgium
Italy
Israel
Switzerland
Netherlands
Luxembourg
Ireland
France
United States
Australia
Finland
Denmark
Korea
Sweden
Canada
United Kingdom
Norway
South Africa
1994 2004

120 | MEASURING THE TECHNOLOGICAL AND ECONOMIC VALUE OF PATENTS
ENQUIRIES INTO INTELLECTUAL PROPERTY'S ECONOMIC IMPACT © OECD 2015
Figure 2.18. Patent Value Index (6), 1990-2009
Patent Value Index (6), average by technology field Patent Value Index (6), average by economy
Note: The patent value composite index is based on the average value of its normalised component, by cohort of filing date and technology fields. The average by economy is provided only for economies with more than 50 patents reporting the index in 2004.
Source: OECD, calculations based on PATSTAT (EPO, April 2012), October 2012.
0.00
0.10
0.20
0.30
0.40
1990 1991 1992 1993 1994 1995 1996 1997 1998 1999 2000 2001 2002 2003 2004 2005 2006 2007 2008 2009
Average Median 75th percentile
0.0 0.1 0.2 0.3 0.4
Civil engineeringOther consumer goods
Furniture, gamesTransport
Mechanical elementsThermal processes and apparatus
Other special machinesTextile and paper machines
Engines, pumps, turbinesMachine tools
HandlingEnvironmental technology
Chemical engineeringMicro & nano-technology
Surface technology, coatingMaterials, metallurgy
Basic materials chemistry Food chemistry
Macromolecular chemistryPharmaceuticals
BiotechnologyOrganic fine chemistry
Medical technologyControl
Biological materialsMeasurement
OpticsSemiconductors
IT methods for managementComputer technologyBasic communication
Digital communicationTelecommunications
Audio-visual technologyElectrical machinery
All sectors
1994 2004
EPO patents, 2004
0.0 0.1 0.2 0.3 0.4
India
Chinese Taipei
Singapore
Brazil
Spain
Japan
China
Germany
Israel
Austria
Belgium
Switzerland
World average
Netherlands
Ireland
Sweden
Australia
United States
Finland
Korea
Denmark
Luxembourg
Italy
France
United Kingdom
Norway
Canada
South Africa
1994 2004

121 | MEASURING THE TECHNOLOGICAL AND ECONOMIC VALUE OF PATENTS
ENQUIRIES INTO INTELLECTUAL PROPERTY'S ECONOMIC IMPACT © OECD 2015
It should be noticed that the original formulation of Lanjouw and Schankerman (2004) weighted the different components of the composite indicator using factor analysis. The OECD experimental patent value indicators conversely assume all components to play an equally important role, i.e. they are assigned equal weights. This choice is motivated by the results of the exploratory analysis carried out when designing the indicator, which suggests that weights differ across technology fields and depend on the time span considered. Hence, for comparability purposes the composite value indicators presented here assign equal importance to all components, and we leave it to future empirical analysis to determine the coefficients that would best mirror the relative importance of the different value factors.
Needless to say, while the experimental OECD indicator tries to summarise a complex and multidimensional issue like patent value, it nevertheless suffers from the typical drawbacks of all composite indicators, and should therefore be interpreted with care84.

122 | MEASURING THE TECHNOLOGICAL AND ECONOMIC VALUE OF PATENTS
ENQUIRIES INTO INTELLECTUAL PROPERTY'S ECONOMIC IMPACT © OECD 2015
ANNEX TECHNOLOGY FIELDS
The IPC-Technology concordance table developed by the WIPO in 2010 and revised in 2011 has been used to group patents by main technology fields. The taxonomy is articulated in 6 sectors and 35 fields, as follows:
1. Electrical engineering
1. Electrical machinery, apparatus, energy
2. Audio-visual technology
3. Telecommunications
4. Digital communication
5. Basic communication processes
6. Computer technology
7. IT methods for management
8. Semiconductors
2. Instruments
9. Optics
10. Measurement
11. Analysis of biological materials
12. Control
13. Medical technology
3. Chemistry
14. Organic fine chemistry
15. Biotechnology
16. Pharmaceuticals
17. Macromolecular chemistry, polymers
18. Food chemistry
19. Basic materials chemistry
20. Materials, metallurgy
21. Surface technology, coating
22. Micro-structural and nano-technology
23. Chemical engineering
24. Environmental technology
4. Mechanical engineering
25. Handling
26. Machine tools
27. Engines, pumps, turbines
28. Textile and paper machines
29. Other special machines
30. Thermal processes and apparatus
31. Mechanical elements
32. Transport
5. Other fields
33. Furniture, games
34. Other consumer goods
35. Civil engineering
Source: WIPO, 2011.

123 | MEASURING THE TECHNOLOGICAL AND ECONOMIC VALUE OF PATENTS
ENQUIRIES INTO INTELLECTUAL PROPERTY'S ECONOMIC IMPACT © OECD 2015
NOTES
73. Among the many initiatives discussing these issues there have been the Knowledge Networks and Markets
(KNM) “Expert Workshop on Patent Practice and Innovation” organised at the OECD in May 2012, and the Patent Quality Workshop organised in May 2012 by the European Patent Office's (EPO) Economic and Scientific Advisory Board (ESAB), in which the OECD participated. The report of the EPO-ESAB workshop can be found at www.epo.org/about-us/office/esab/workshops.html
74. Non-practicing entities, also known as patent assertion entities, are firms that hold patents that they do not use in order to produce or “practice” (i.e. “non-practicing” or “non-competing” firms). See Geradin at al. (2012) for a discussion about non-practicing entities and their possible role as patent owners.
75. Annex 1 lists the technology fields considered, whereas a detailed list of the IPC classes contained in each technology field can be found at www.wipo.int/ipstats/en/statistics/patents/pdf/wipo_ipc_technology.pdf
76. Mariagrazia Squicciarini, Hélène Dernis & Chiara Criscuolo, “Measuring Patent Quality: Indicators of Technological and Economic Value,” OECD Science, Technology and Industry Working Papers 2013/03, available at http://dx.doi.org/10.1787/5k4522wkw1r8-en.
77. The definition of scope in Matutes et al. (1996) differs from Lerner’s (1994) and refers to both legal- and product-related aspects. In terms of product definition, scope refers to the type of protection granted to the innovator with respect to the possible uses of the basic technology.
78. The International Patent Classification provides for a hierarchical system for the classification of patents and utility models according to the areas of technology they pertain to. See www.wipo.int/classifications/ipc/en
79. The definition of scope adopted here is completely unrelated to the extent to which claims may be narrowly or broadly defined, as the word ‘scope’ may also seem to imply.
80. Harhoff et al. (2003) explicitly discuss this argument with patent lawyers and examiners and find them not to be supportive of it.
81. Lanjouw and Schankerman (2001a) investigate the cost of engaging in litigations over intellectual property assets and find that patents with more claims and more citations by subsequent patentees are substantially more likely to be involved in litigations. They suggest patent claims to be an indicator of the value of patents and of the technology or product "space" protected by the patent.
82. The term “inventive step” is predominantly used in Europe, while “non-obviousness" is predominantly used in the United States.
83. The familiarity trap refers to favouring familiar technological solutions over unfamiliar ones; the maturity trap refers to favouring mature technologies over emerging ones; the propinquity trap is a condition that relates to the originality of the technological solution used, and consists in trying to modify an available technology rather than focusing on novel solutions.
84. See OECD and EC-JRC 2008 manual on composite indicators for an exhaustive discussion.

124 | MEASURING THE TECHNOLOGICAL AND ECONOMIC VALUE OF PATENTS
ENQUIRIES INTO INTELLECTUAL PROPERTY'S ECONOMIC IMPACT © OECD 2015
REFERENCES
Alcacer, J. and M. Gittelman (2006), “Patent Citations as a Measure of Knowledge Flows: The Influence of Examiner Citations”, The Review of Economics and Statistics 88(4): 774–779.
Ahuja, G. and C.M. Lampert (2001), “Entrepreneurship in the Large Corporation: A Longitudinal Study of How Established Firms Create Breakthrough Inventions”, Strategic Management Journal 22 (6-7): 521-543.
Branstetter L. (2005), “Exploring the Link between Academic Science and Industrial Innovation”, Annals of Economics and Statistics, 79/80: 119-142.
Bresnahan T. F and M. Trajtenberg (1995), “General Purpose Technologies. ‘Engines of Growth’?”, Journal of Econometrics, Vol. 65: 83-108.
Callaert J., B. Van Looy, A. Verbeek, K. Debackere, and B. Thijs (2006), “Traces of Prior Art: An Analysis of Non-Patent References Found in Patent Documents”, Scientometrics, 69(1): 3-20.
Cassiman, B., R.Veugelers, and P. Zuniga (2008). “In search of performance effects of (in)direct industry science links”, Industrial and Corporate Change, 17(4): 611–646.
Criscuolo, P. and B. Verspagen (2008), “Does it Matter where Patent Citations Come from? Inventor vs. Examiner Citations in European Patents”, Research Policy, Elsevier, No. 37 (10): 1892-1908.
Dahlin, K. and D. Behrens (2005), “When is an Invention Really Radical? Defining and Measuring Technological Radicalness”, Research Policy, Elsevier, No. 34 (2005): 717–737.
European Patent Office (2012). “Report – Workshop on Patent Quality Initiated by the EPO Economic and Scientific Advisory Board. 7 May 2012, European Patent Office, Munich”. www.epo.org/about-us/office/esab/workshops.html (last visited October 2012).
Galasso, A., Schankerman, M., and C. J. Serrano (2011). “Trading and Enforcing Patent Rights”. NBER Working Papers No. 17367, National Bureau of Economic Research, Inc., www.nber.org/papers/w17367 (Revised August 2012).
Geradin D., Layne-Farrar A., and A. J. Padilla (2012). “Elves or Trolls? The Role of Nonpracticing Patent Owners in the Innovation Economy”, Industrial and Corporate Change, vol. 21(1): 73–94.
Gompers, P., Lerner, J., and D. Scharfstein (2005). “Entrepreneurial Spawning: Public Corporations and the Genesis of New Ventures, 1986 to 1999”, The Journal of Finance, 60(2), 577-614.
Guellec, D., and B. van Pottelsberghe de la Potterie (2007). “The Economics of the European Patent System: IP Policy for Innovation and Competition”. Oxford University Press, Oxford (UK).
Hall, B. H., Graham S. J. H., Harhoff D., and D. C. Mowery (2003). “Prospects for Improving U.S. Patent Quality via Post-Grant Opposition”, NBER Working Papers No. 9731, National Bureau of Economic Research, Inc., www.nber.org/papers/w9731.
Hall, B. H., and D. Harhoff (2012). “Recent Research on the Economics of Patents”. NBER Working Papers No. 17773, National Bureau of Economic Research, Inc., www.nber.org/papers/w17773
Hall, B.H., Jaffe A. and M. Trajtenberg (2001a), “Market Value and Patent Citations: A First Look”, Economics Department Working Paper E00-277, University of California.

125 | MEASURING THE TECHNOLOGICAL AND ECONOMIC VALUE OF PATENTS
ENQUIRIES INTO INTELLECTUAL PROPERTY'S ECONOMIC IMPACT © OECD 2015
Hall, B.H., Jaffe A. and M. Trajtenberg (2001b), “The NBER Patent Citation Data File: Lessons, Insights and Methodological Tools”, NBER Working Papers No. 8498, National Bureau of Economic Research, Inc., www.nber.org/papers/w8498.
Hall, B.H., Jaffe A. and M. Trajtenberg (2005), “Market Value and Patent Citations”, Rand Journal of Economics, No. 36, Spring.
Hall, B.H., and M. Trajtenberg (2004), “Uncovering GPTS with Patent Data”, NBER Working Papers, No. 10901, National Bureau of Economic Research, Inc., www.nber.org/papers/w10901.
Harhoff, D., and S. Wagner (2009), “The Duration of Patent Examination at the European Patent Office”, Management Science, Vol. 55 (12): 1969-1984.
Harhoff, D., F. M. Scherer, and K. Vopel (2003), “Citations, Family Size, Opposition and the Value of Patent Rights”, Research Policy, 32(8): 1343-1363.
Henderson, R., Jaffe, A. and M. Trajtenberg (1998). "Universities as a Source of Commercial Technology: A Detailed Analysis of University Patenting, 1965-1988." Review of Economics and Statistics, 80(1): 119-27.
Kerr, W. R. (2010). “Breakthrough Inventions and Migrating Clusters of Innovation”, Journal of Urban Economics, 67(1): 46-60.
Lanjouw J. O., A. Pakes, and J. Putnam (1998), “How to Count Patents and Value Intellectual Property: The Uses of Patent Renewal and Application Data”, Journal of Industrial Economics, 46(4): 405-432.
Lanjouw, J. O. and M. Schankerman (2001a), “Characteristics of Patent Litigation: A Window on Competition”, RAND Journal of Economics, 32(1): 129-151
Lanjouw, J. O. and M. Schankerman (2001b), “Enforcing Intellectual Property Rights”. NBER Working Papers No. 8656, National Bureau of Economic Research, Inc., www.nber.org/papers/w8656 .
Lanjouw, J. and M. Schankerman (2004), “Patent Quality and Research Productivity: Measuring Innovation with Multiple Indicators”, The Economic Journal, 114(495): 441-465.
Layne-Farrar, A., and J. Lerner (2011). “To Join or not to Join: Examining Patent Pool Participation and Rent Sharing Rules”. International Journal of Industrial Organization, 29(2): 294–303.
Lerner, J. (1994), “The Importance of Patent Scope: An Empirical Analysis”, RAND Journal of Economics, 25(2): 319-333.
Matutes, C, P. Regibeau, and K. Rockett (1996), “Optimal Patent Design and the Diffusion of Innovations”, RAND Journal of Economics, 27 (1): 60-83.
Martinez, C. (2010), “Insight into Different Types of Patent Families”, OECD Science, Technology and Industry Working Papers, No. 2010/2, OECD, Paris.
Narin, F., K.S. Hamilton, and D. Olivastro (1997), “The increasing linkage between U.S. technology and public science”. Research Policy, 26: 317-330
OECD and European Union, Joint Research Centre- European Commission (2008), Handbook on Constructing Composite Indicators: Methodology and User Guide. OECD Publishing, Paris. DOI: http://dx.doi.org/10.1787/9789264043466-en .
OECD (2009), OECD Patent Statistics Manual, OECD Publishing, Paris. Doi: http://dx.doi.org/10.1787/9789264056442-en.
Pakes, A. (1986), “Patents as Options: Some Estimates of the Value of Holding European Patent Stocks”, Econometrica, 54(4): 755-784.

126 | MEASURING THE TECHNOLOGICAL AND ECONOMIC VALUE OF PATENTS
ENQUIRIES INTO INTELLECTUAL PROPERTY'S ECONOMIC IMPACT © OECD 2015
Pakes, A. and M. Schankerman (1984), “The Rate of Obsolescence of Patents, Research Gestation Lags, and the Private Rate of Return to Research Resources”, in Griliches, Z. (ed) “R&D, Patents, and Productivity”, University of Chicago Press.
Popp, D., Santen, N., Fisher-Vanden, K., and M. Webster (2012), “Technology Variation vs. R&D Uncertainty: What Matters Most for Energy Patent Success?” NBER Working Papers No. 17792, National Bureau of Economic Research, Inc., www.nber.org/papers/w17792 .
Régibeau, P. and K. Rockett (2010), “Innovation Cycles and Learning at the Patent Office: Does the Early Patent Get the Delay?”, The Journal of Industrial Economics, 58 (2): 222-246.
Scherer, F. M. (1965). “Firm Size, Market Structure, Opportunity, and the Output of Patented Inventions”, American Economic Review, 55(5): 1097-1125.
Schmoch, U. (2008), “Concept of a Technology Classification for Country Comparisons”, Final Report to the World Intellectual Property Organisation (WIPO), revised August 2011, WIPO, www.wipo.int/export/sites/www/ipstats/en/statistics/patents/pdf/wipo_ipc_technology.pdf (last accessed 30 October 2012).
Shane, S. (2001), “Technological Opportunities and New Firm Creation”, Management Science, 47 (2): 205–220.
Srivastava, M. K., and D. R. Gnyawali (2011). “When Do Relational Resources Matter? Leveraging Portfolio Technological Resources for Breakthrough Innovation”. Academy of Management Journal, 54(4): 797-810.
Svensson, R. (2012), “Commercialization, renewal, and quality of patents”, Economics of Innovation and New Technology, 21(2): 175-201.
Stahl, J. C. (2010). “Mergers and Sequential Innovation: Evidence from Patent Citations”. Finance and Economics Discussion Series, No. 2010-12. Division of Research and Statistics and Monetary Affairs Federal Reserve Board, Washington, DC.
Tong, X and J. Davidson (1994), “Measuring national technological performance with patent claims data”, Research Policy, 23: 133-141.
Trajtenberg, M. (1990), “A Penny for Your Quotes: Patent Citations and the Value of Innovation”, RAND Journal of Economics, 21 (1): 172-187.
Trajtenberg, M, Jaffe, A., and R. Henderson (1997). “University versus Corporate Patents: A Window on the Basicness of Inventions”, Economics of Innovation and New Technology, 5(1): 19-50.
Webb, C., H. Dernis, D. Harhoff and K. Hoisl (2005), “Analysing European and International Patent Citations: A Set of EPO Patent Database Building Blocks”, OECD Science, Technology and Industry Working Papers, No. 2005/9, OECD, Paris.
World Intellectual Property Organization (WIPO). International Patent Classification (IPC). www.wipo.int/classifications/ipc/en/ (last accessed 30 October 2012).