measuring the sustainable return on investment (sroi) … · measuring the sustainable return on...
TRANSCRIPT
MEASURING THE SUSTAINABLE RETURN ON INVESTMENT (SROI) OF WASTE TO
ENERGY
Co-Authors
John F. Williams SVP National Director - Sustainable Development,
HDR Engineering, Inc.
500 Seventh Avenue, Suite 1501
New York, New York 10018
USA
Tel. 212 545 5461, FAX 212 542 6200,
John C. Parker VP Department Manager – HDR Decision
Economics
HDR Corporation
480 University Avenue, Suite 404
Toronto, ON M5G1V2
Canada
Tel. 416 595 6267, FAX 416 595 9822,
ABSTRACT
Waste to Energy facilities serve their communities in
a number of important ways. Our industry does a
terrific job reducing volumes that would have
otherwise been destined for landfills. Energy
recovery is an important and positive byproduct of
that process but not the only one. Beyond these two
obvious attributes you seldom hear of anything else.
This is unfortunate because there are significant
social, environmental, and economic benefits
associated with the technology. Industry ―silence‖
can be attributed to an inability to describe those
benefits in ways people understand or see a dollar
value in. In other words, we have a tough time
measuring the value of ―Green.‖
This paper describes a framework through which we
can make the case for sustainable benefits associated
with Waste to Energy. It begins with discussion of
why it is important to seek a connection with the
―triple bottom line‖ including the social,
environmental, and economic attributes of a given
program/project/facility. It sheds light on the need to
think beyond traditional life cycle cost analysis
techniques that focus on direct cash benefits. It
describes a process through which noncash and
external costs and benefits can be calculated and
presented in monetary terms, referred to as the
Sustainable Return on Investment or SROI (direct
cash + noncash + external costs and benefits =
SROI). This paper should help readers make an
aggressive case to reveal the FULL VALUE of
Waste to Energy across the sustainability triple
bottom line.
INTRODUCTION
We are living in a transformational period. Economic
growth and consumption are down. Jobs are rapidly
moving offshore. Consumer and government debt are
at record levels. There is growing concern with
regard to climate change. The long-term
ramifications of this ―perfect storm‖ of circumstances
are staggering. They are also exciting, since together
they open the door to action that could bring about
change leading to a promising future. We are already
seeing action. Congress passed ARRA 2009 in
February of last year. Commonly known as Stimulus
II, there is significant funding for programs that
closely align with the waste management and Waste
to Energy industry. In addition, funding for energy-
related programs has been made available through the
2009 Omnibus Spending Bill and proposed in the
President’s budget for 2010. Looking further out,
there are provisions in cap and trade legislation that
could also support investments in waste management
and Waste to Energy. Most political observers would
agree that to a great degree, President Obama has
Proceedings of the 18th Annual North American Waste-to-Energy Conference NAWTEC18
May 11-13, 2010, Orlando, Florida, USA
NAWTEC18-3552
1 Copyright © 2010 by ASME

staked his presidency on the success of his
transformational vision, policy, and investments.
Jobs, Energy, and GHG Reductions
These investments have the potential to lead to large
numbers of new ―green‖ jobs linked to long-term
growth of domestic industries that are difficult to
move off shore. Further, they have the potential to
create a new generation of energy-related programs
that could increase efficiency, reduce demand, and
shift emphasis away from fossil-fuel dependence to
renewable energy and low-carbon solutions. The
ability to make a credible and robust case for
initiatives involving the combination of job creation,
reduced dependency on fossil fuels, and reductions in
greenhouse gas emissions can lead to favorable
funding decisions by the federal government as well
as state and local energy programs (generously
funded via weatherization and Energy Efficiency and
Conservation Block Grants).
Leverage, Transparency, and Specific Results
The up-side potential of recent government
investments is significant; however, the down side is
that even at current record spending levels, there may
not be enough money set aside to jump-start a new,
green economy. The administration is aware of the
shortage and has taken significant steps to increase
the odds of success. The White House is demanding
results in exchange for federal funding as evidenced
in the performance measurement, monitoring and
reporting requirements accompanying the EECBG
program. Communities that applied for grants are
expected to make a compelling case including
commitments achieving minimum leverage ratios of
5 local dollars to every grant dollar. Also, demands
for transparency will help identify applicants who are
most likely to be effective in their use of federal
funds.
Additional evidence of the importance of making a
case for specific results was provided on October 5,
2009 when the White House issued Executive Order
13514, Federal Leadership in Environmental, Energy,
and Economic Performance, which took an
unprecedented step by directing federal agencies to
make a full accounting of the social and economic
costs and benefits of their sustainability programs.
The goal behind this mandate is to evaluate programs
based on their sustainable performance beyond
financial returns on investment to include results
associated with the sustainability triple bottom line.
According to the EO, programs that show positive
results will be favored for additional funding. Those
that do not will see funding reductions or
terminations.
Waste management systems, specifically Waste to
Energy, are excellent examples of outcomes of
leverage, transparency, and documented results. Most
of these systems/facilities involve some form of
public /private/partnership, shared investment, risk,
and results. They involve detailed service agreements
describing performance expectations. Their
permitting and performance monitoring requirements
provide comprehensive information about facility
input (including source and nature of the fuel
feedstock and that portion that is biogenic) and
output (including energy, emissions, recovered
materials, and residuals). Further, municipal waste
management programs keep track of material
collection, shipping, and disposition data that can be
useful in establishing and managing related GHG
emissions (or avoided emissions).
Competition and Green Business Case
Competition for federal funding is intense and will
continue to grow. For example, demand for $1.5
Billion in ARRA TIGER Grant funds topped $54
billion, which tells us there will be a few winners and
many losers. Those ―losers‖ will demand justification
for decisions made, and transparency will grow in
importance. It will not take long for applicants to
refine the tactics needed to succeed in a competitive
field. They will quickly learn they need to craft a
―Green‖ Business Case around the total objective
merit of a proposal to attain a score sufficient for a
grant.
2 Copyright © 2010 by ASME

Successful applicants will pay careful attention to the
policy objectives accompanying a grant program and
the need to make a detailed case around projected
results aligning with that policy. Waste management
system and Waste to Energy facility operators are
among many users with access to federal funding and
will need to make a clear and compelling case for the
environmental costs and benefits associated with
investment in specific programs. As mentioned
earlier, this field is full of ideal candidates for
funding but short on specific examples of applicants
making a detailed case.
How Will WTE Fare?
The Waste to Energy industry has traditionally been
quiet regarding the performance metrics emerging
federal policy is focused on: jobs, energy, reduced
GHG emissions. Yet, compared to other renewable
energy sources(aside from nuclear energy), no other
alternatives come close to the scale, reliability,
efficiency, and net GHG emissions benefits
associated with Waste to Energy. The direct, indirect,
and induced jobs involved in planning and
developing new facilities, operating and maintaining
existing plants, and retrofitting and expanding aging
equipment involve significant and well-paid workers
with knowledge and skill that cannot be furnished
from a distant land. The energy produced in a typical
facility surpasses the potential of many dozens of
large-scale wind turbines that would have to operate
24/7/365 to match Waste to Energy performance. It
would take thousands of solar PV cells and 24 hours
of sun to produce comparable results.
These characteristics make Waste to Energy a good
candidate to base-load electric power that cannot be
provided by wind or solar sources. Approximately
60% of the post recycling municipal solid waste
stream is biogenic and the source of low-carbon
energy. The ability to generate 50+ megawatts of
power continuously from a waste-material-based fuel
stream can offset emissions from fossil-fueled
facilities while avoiding emissions from long-haul
waste transport and methane produced in MSW
landfills. In addition, the record is clear that
integrated waste management systems have higher
recycling and material recovery rates and less
dependence upon landfills that produce methane
emissions. With all of these environmental benefits it
is ironic that these systems are typically judged by
one single number: the tipping fee, which hardly tells
the story of environmental costs and benefits or the
complete degree of ―Green‖ contributed by these
efforts.
Are We Prepared to Measure Green Value?
Waste to Energy is clearly associated with benefits
that match the administration’s transformational
objectives. But there is even more to the story. What
is the full ―Green‖ value of a Waste to Energy
facility? How does it contribute to social, economic,
and environmental costs and benefits? Are we
measuring Waste to Energy’s triple bottom line to
determine the direct cash, noncash and external costs
and benefits of its social, environmental, and
economic attributes? Are we finding ways to craft the
Green Business Cases that could attract federal
funding and a greater willingness to invest? Are we
prepared to make our case when comparing this
technology to the other choices available to public
policy makers?
So far, the answer has been NO because the industry
lacked a means to calculate its triple bottom line.
Sustainable Return on Investment, or SROI, provides
that means. It is a methodology and transparent
framework through which Waste to Energy can be
objectively evaluated with results reported in
monetary and probabilistic terms.
MEASURING THE TRIPLE BOTOM LINE AT WASTE TO ENERGY FACILITIES
Recently, the SWANA Applied Research Foundation
released a study entitled, ―Waste-to-Energy as a
Green Solid Waste Management Option for Non-
Recycled Waste.‖ The December 2009 study (see
http://swana.org) set out to ―quantify the
environmental benefits associated with the processing
of non-recycled waste through WTE plants for
3 Copyright © 2010 by ASME
electricity generation rather than disposing of this
non-recycled waste in landfills.‖ [Note: a co-author
of this paper was among a group of SWANA ARF
subscribers who provided funding for a series of
applied research activities related to WTE].
The SWANA ARF effort used an environmental life
cycle assessment approach to quantify and evaluate
the environmental benefits and impacts, as well as
sustainability characteristics associated with WTE as
an alternative to landfilling non-recycled municipal
solid waste and fossil-fuel-based energy production.
The study assumed that aggressive measures are
being taken with regard to material recovery and
composting programs. It found that CO2 and other air
emissions are significantly reduced when non-
recycled waste is processed through WTE electricity
generation rather than disposed of in MSW landfills.
It stated that emissions reductions can be achieved as
follows:
Carbon dioxide – 728 pounds of CO2-E
(Carbon dioxide equivalents) per ton of
waste combusted;
Carbon monoxide – 1.50 pounds per ton;
Nitrogen oxides – 1.90 pounds per ton;
Sulfur oxides – 6.52 pounds per ton; and
Particulate matter – 1.47 pounds per ton.
The study goes on to report the following sustainable
traits of WTE when used to process non-recycled
materials (as opposed to landfilling and the use of
fossil fuel based electricity generation):
Results in waste stabilization;
Avoids long-haul transport of waste for
disposal;
Provides long-term control over disposal
capacity and pricing;
Reduces reliance on fossil fuels;
Provides a community with a base load
renewable energy resource;
Complements source separation recycling
programs;
Provides an opportunity for cogeneration;
Is cleaner than coal or oil; and
Minimizes landfill disposal.
These findings help in elevating the common
understanding as to environmental benefits and
impacts associated with WTE technology. There are
additional benefits related to the social and economic
implications that require analysis going beyond LCA
to reveal the full value of the technology. The
Sustainable Return on Investment (SROI)
methodology, a framework for measuring the entire
Sustainability Triple Bottom Line including the
social, environmental, and economic costs and
benefits associated with WTE and translating them
into a common, monetary denominator is described
below.
Policy makers and decision makers have shown a
burgeoning interest in being able to make an
objective case for sustainability based upon
measurable economic, environmental and social
benefits. The purpose of this document is to discuss
HDR’s SROI process and explain how it can be used
to help promote sustainable investment strategies
from an objective and transparent perspective that is
linked to the triple bottom line of a project, both
today and into the future.
Comparison to Traditional Decision Tools
Traditional financial evaluation tools, such as
Business Case Analysis or Life-Cycle Cost Analysis
(LCCA), rely exclusively on financial impacts. In
contrast to the broad-based analysis allowed through
the SROI process, these traditional tools have two
primary drawbacks:
1. An inability to accurately quantify the
noncash benefits and costs accruing to both
the organization in question and to society
as a whole resulting from a specific
investment; and
2. A failure to adequately incorporate the
element of risk and uncertainty.
4 Copyright © 2010 by ASME

In contrast, the SROI process takes into account the
entire scope of potential costs and benefits related to
sustainability measures, while simultaneously
incorporating a risk analysis component over the
project’s life-cycle. The process includes traditional
input, such as savings on utility bills or reduced
O&M costs, but also input data such as quantified
environmental savings from reduced carbon
emissions or the value of enhanced productivity from
employees working in a green building (e.g., fewer
sick days or performing a task more efficiently).
A key feature of SROI is that it converts to dollar
terms (monetizes) the relevant social and
environmental impacts of a project, yet still provides
the equivalent of traditional financial metrics referred
to as ―Financial Return on Investment (FROI)‖.
FROI accounts for internal (i.e., accruing to the
organization) cash costs and benefits only, while
SROI accounts for all internal and external costs and
benefits. Figure 1 illustrates how traditional financial
models differ from SROI.
Figure 1: Comparison of SROI to Traditional Life-Cycle Costing
5 Copyright © 2010 by ASME

SROI Methodology
At the intersection of economics and sustainability
lies the SROI process. The SROI framework provides
comprehensive cost-benefit analysis, business-case
analysis, economic impact assessment, risk analysis,
consensus-based decision making for inputs, and a
transparent and inclusive definition of environmental
values. SROI incorporates economic treatment of
environmental and social metrics while building
consensus among stakeholders around measured
values.
Figure 2: SROI Flow Diagram
6 Copyright © 2010 by ASME

The SROI Flow Diagram contains an overview of a
wide variety of inputs that can be considered in the
SROI model. Note that monetizing the non-cash
inputs in the diagram below is what sets SROI apart
from other methods. While non-cash inputs like
improvement to community health, worker
productivity, gallons of water conserved lack
standard values, there is considerable peer reviewed
research in each of these areas (and many others) to
identify a range of potential values which can be
refined to reflect specific geographic and/or market
based factors. Prior to acceptance of any data input
value into the SROI analysis, consensus among
stakeholders and area experts as to the high, median
and low value ranges is required.
The SROI process promotes transparency and
accountability as entities seek to maximize the ―triple
bottom line‖ of economic, social and environmental
value created by their activities (see Figure 3). The
intent is to provide public agencies, NGOs and
private corporations with a widely recognized and
standardized process to model and prioritize projects
to demonstrate the maximum and long-term return on
their investment.
7 Copyright © 2010 by ASME

Figure 3: SROI Methodology Guides Your Decision Making Process
The SROI process involves four distinct steps:
1. Development of the structure and logic of
costs and benefits over the project life cycle.
This involves determining the costs and
benefits that result from the proposed
investment and a graphical depiction to
quantify these values.
2. Quantification of input assumptions and
assignment of risk/uncertainty. This step
involves building the preliminary outline of
the SROI model, populating the model with
initial data assumptions and performing
initial calculations for identified costs and
benefits (financial, social and
environmental).
3. Facilitation of a Risk Analysis Process
(RAP) session. This is a meeting, similar to
a one-day charrette, which brings together
key stakeholders to reach consensus on input
data values and calculations to be used in the
model.
4. Simulation of outcomes and probabilistic
analysis. The final step in the process is the
generation of SROI metrics, including Net
Present Value (NPV), Discounted Payback
Period, Benefit-Cost Ratio and the Internal
Rate of Re-turn, in addition to the traditional
financial metrics. Financial metrics are
included as a point of comparison and to
transparently and comprehensively illustrate
the relative merits of all potential
investments being analyzed.
8 Copyright © 2010 by ASME
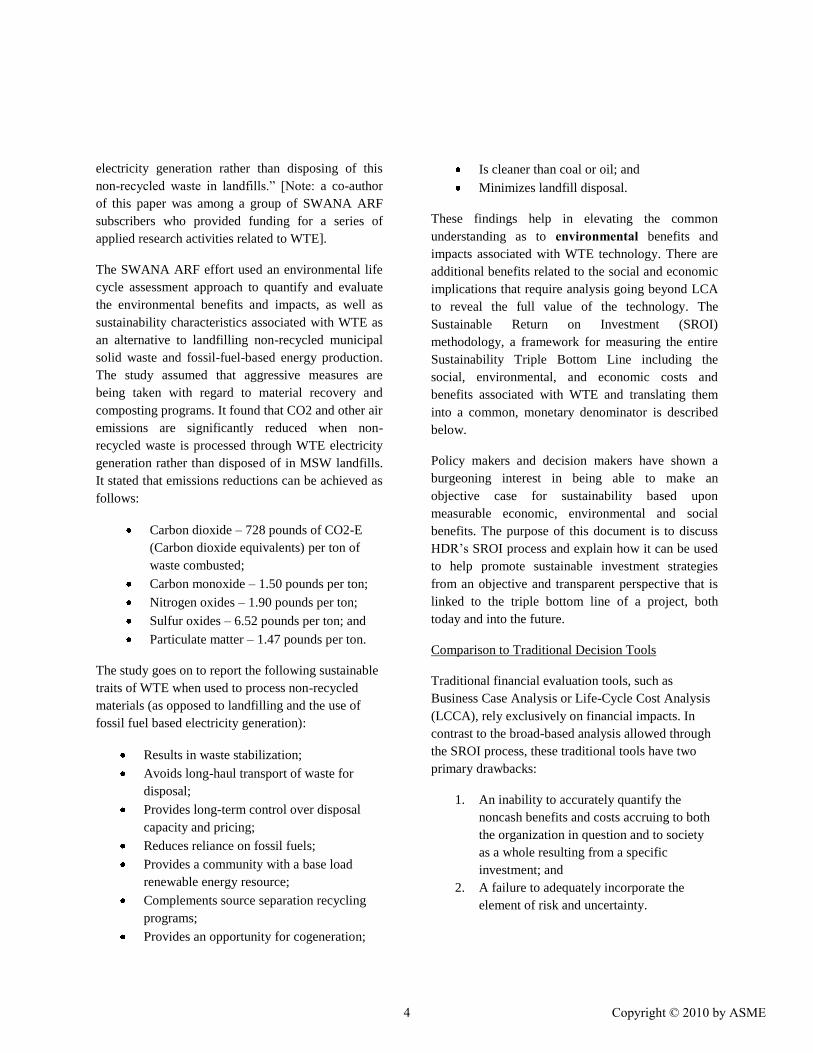
Step 1: Structure and Logic of the Cost and Benefits
A ―structure and logic model‖ depicts the variables and cause and effect relationships that underpin the forecasting
problem at-hand (see Figures 3 and 4). The structure and logic model is written mathematically to facilitate analysis
and also depicted diagrammatically to permit stakeholder scrutiny and modification during Step 3.
9 Copyright © 2010 by ASME

Figure 4: Example of a Structure and Logic Diagram (Illustrative Example)
GDP per capita
by year
MSW per capita
per $1 of GDP per capita
by waste stream
From regression
analysisExternal forecasts
Baseline MSW per capita
by year
by waste stream
Population
by year
Baseline total MSW
by year
by waste stream
Reduction in MSW due to
policy Scenario 1
by year
In %
by waste stream
From analysis of
implications of
Scenario 1 /
experience in other
jurisdictions
Scenario 1 total MSW
by year
by waste stream
Step 2: Central Estimates and Probability Analysis
Risk analysis and Monte Carlo simulation techniques
can be used to account for uncertainty in both the
input values and model parameters. All projections
and input values are expressed as probability
distributions (a range of possible outcomes and the
probability of each outcome), with a wider range of
values provided for inputs exhibiting a greater degree
of uncertainty. Of note, each element is converted
into monetary values to estimate overall impacts in
comparable financial terms and discounted to
translate all values into present-value terms1.
Specifying uncertainty ranges for key parameters
1 Discounting all future monetary values to their
present-day equivalents permits costs and benefits that arise over different periods to be compared on a common footing.
entering the decision calculus allows the SROI
framework to evaluate the full array of social costs
and benefits of a project while illustrating the range
of possible outcomes to fully inform decision-
makers.
10 Copyright © 2010 by ASME
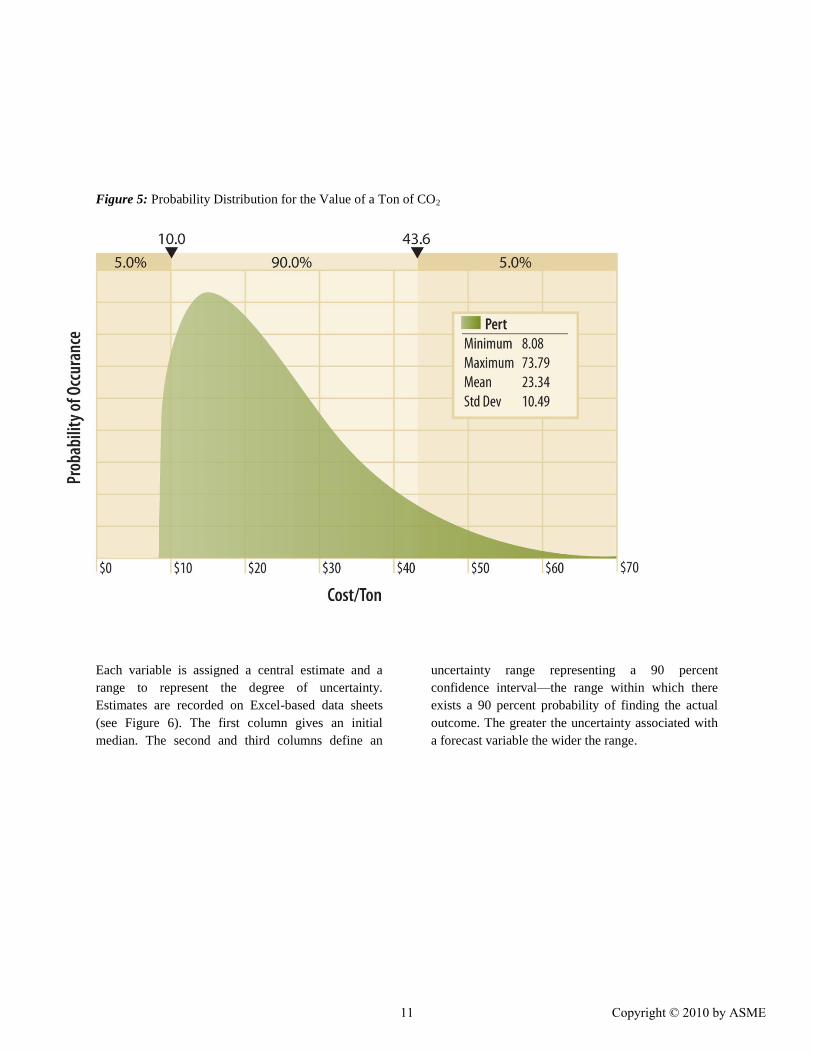
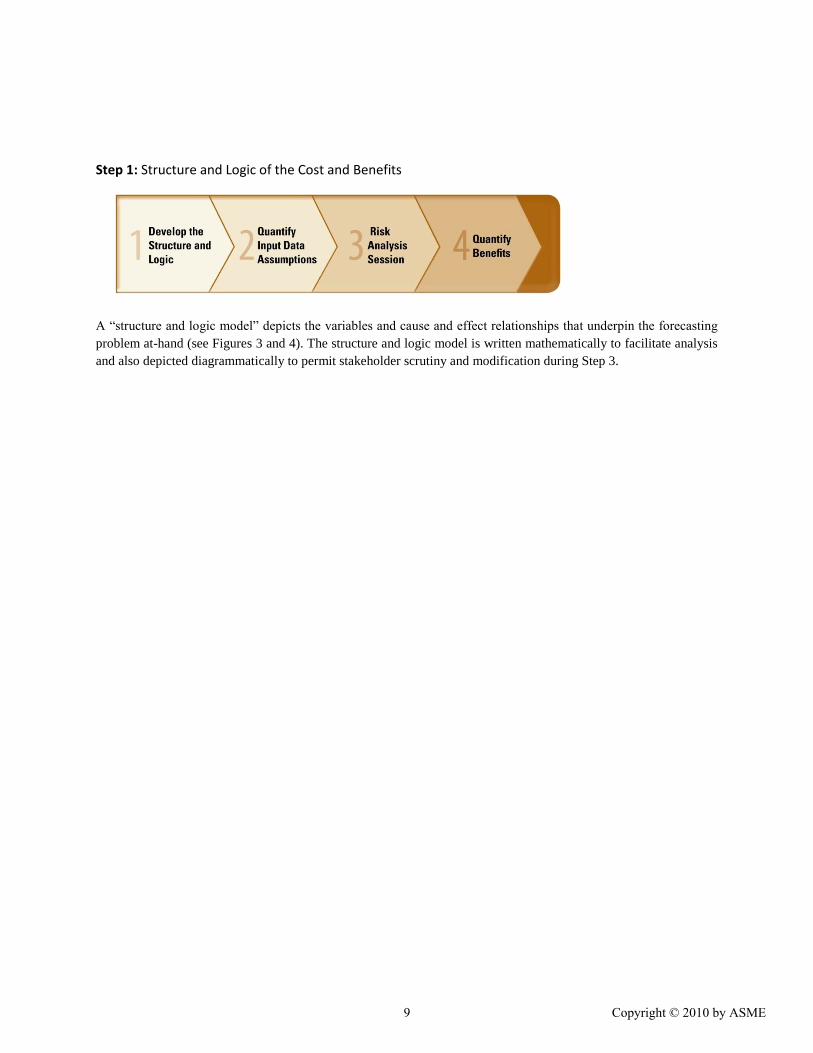
Figure 5: Probability Distribution for the Value of a Ton of CO2
Each variable is assigned a central estimate and a
range to represent the degree of uncertainty.
Estimates are recorded on Excel-based data sheets
(see Figure 6). The first column gives an initial
median. The second and third columns define an
uncertainty range representing a 90 percent
confidence interval—the range within which there
exists a 90 percent probability of finding the actual
outcome. The greater the uncertainty associated with
a forecast variable the wider the range.
11 Copyright © 2010 by ASME
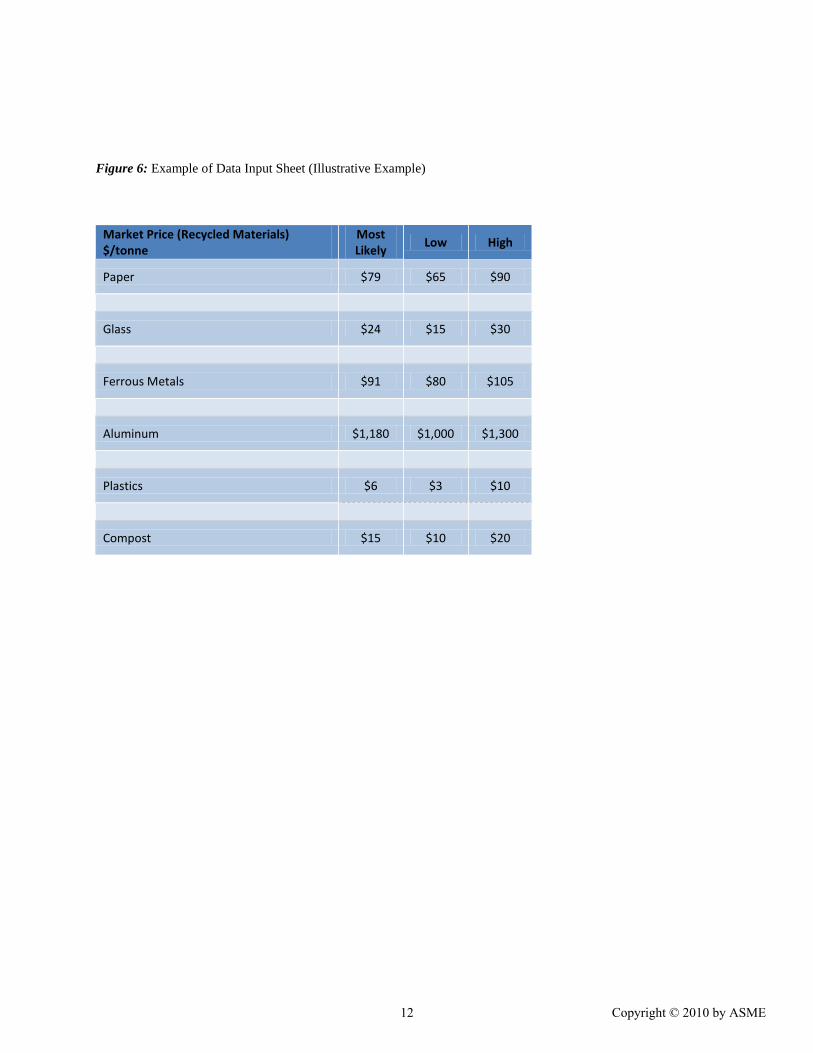
Figure 6: Example of Data Input Sheet (Illustrative Example)
Market Price (Recycled Materials) $/tonne
Most Likely
Low High
Paper $79 $65 $90
Glass $24 $15 $30
Ferrous Metals $91 $80 $105
Aluminum $1,180 $1,000 $1,300
Plastics $6 $3 $10
Compost $15 $10 $20
12 Copyright © 2010 by ASME
Probability ranges are established using both
statistical analysis and subjective probability.
Probability ranges do not have to be normal or
symmetrical. In other words, there is no need to
assume a bell-shaped normal probability curve. The
bell curve assumes an equal likelihood of being too
low and too high in forecasting a particular value. For
example, if projected unit construction costs deviate
from expectations, it is more likely that the costs will
be higher than the median expected outcome than
lower.
The risk analysis transforms the ranges depicted in
Figure 6 into formal probability distributions (or
―probability density functions‖), helping stakeholders
understand and participate in the process even
without formal training in statistical analysis.
The central estimates and probability ranges for each
assumption in the forecasting structure and logic
framework come from three sources, as described
below:
• The best available third party information from a variety of sources, including the
Environmental Protection Agency, the Department of Energy, the Bureau of Labor Statistics,
financial markets, universities, think tanks, etc.
• Historical analysis of statistical uncertainty in all variables and an error analysis of
forecasting coefficients, which are numbers that represent the measured impact of one
variable (say, the market price for recycled plastics) on another (such as the price of
electricity). While these coefficients can only be known with uncertainty, statistical methods
help uncover the level of uncertainty (using diagnostic statistics such as standard deviation,
confidence intervals, and so on).
• Subjective probability. Obtaining subjective probabilities is the subject of Step 3.
13 Copyright © 2010 by ASME

Step 3: Expert Evaluation: The RAP© Session
The third step in the SROI process involves
formation of an expert panel to hold a charette-like
one- or two-day meeting called the Risk Analysis
Process (RAP) session. It uses facilitation techniques
to elicit risk and probability beliefs from participants
about:
i. The structure of the forecasting
framework
ii. Uncertainty attached to each input
variable and forecasting coefficient in
the framework.
In (i), experts are invited to add variables and
hypothesized causal relationships that may be
material, yet missing from the model. In (ii), panelists
discuss a protocol where initial central estimates and
ranges that were provided to panelists prior to the
session are modified based on subjective expert
beliefs.
Examples of typical RAP session participants
include:
Client
- Project team
- Technical specialists
- Financial experts
HDR
- Facilitator
- Economists
- Technical
- Outside Experts - Public Agencies and Officials - Business Groups
Step 4: Simulation of Outcomes and Probabilistic
Analysis
Traditional financial analysis takes the form of a
single ―expected outcome‖ supplemented with
alternative scenarios. The limitation of a forecast
with a single expected outcome is clear – while it
may provide the single best statistical estimate, it
offers no information about the range of other
possible outcomes and their associated probabilities.
The problem becomes acute when uncertainty
surrounding the underlying assumptions of a forecast
is material.
Another common approach to provide added
perspective on reality is ―sensitivity analysis.‖ Key
forecast assumptions are varied one at a time, in
order, to assess their relative impact on the expected
outcome. A concern with this approach is that
assumptions are often varied by arbitrary amounts. A
more serious concern with this approach is that, in
the real world, assumptions do not veer from actual
outcomes one at a time. Rather, the impact of
simultaneous differences between assumptions and
actual outcomes is needed to provide a realistic
perspective on the riskiness of a forecast.
Risk analysis provides a way around the problems
outlined above. It helps avoid the lack of perspective
in ―high‖ and ―low‖ cases by measuring the
probability or ―odds‖ that an outcome will actually
materialize. A risk-based approach allows all inputs
to be varied simultaneously within their distributions,
avoiding the problems inherent in conventional
sensitivity analysis. Risk analysis also recognizes
interrelationships between variables and their
associated probability distributions.
In step four, final probability distributions are
formulated by the risk analyst (Economist) and
represent a combination of probability information
drawn from Steps 2 and 3. These are combined using
simulation techniques (called Monte Carlo analysis)
that allow each variable and forecasting coefficient to
vary simultaneously according to its associated
probability distribution (Figure 7). The result is a
forecast that includes estimates of the probability of
achieving alternative outcomes given the uncertainty
in underlying variables and coefficients.
14 Copyright © 2010 by ASME

Figure 7: Combining Probability Distributions (Illustrative Example)
15 Copyright © 2010 by ASME
SROI Outputs for Users
The SROI analysis produces results that address both financial and sustainable criteria using many popular
financial/economic metrics. For example:
• Net Present Value (NPV): The net value an investment or project adds to the value of the
firm, calculated as the sum of the present value of future cash flows less the present value of
the project’s costs.
• Return On Investment (ROI): The ratio of the net value of an investment relative to the
cost of the investment.
• Discounted Payback Period (DPP): The period of time required for the return on an
investment to recover the sum of the original investment on a discounted cash flow basis.
• Internal Rate of Return (IRR): The discount rate at which the net present value of a
project would be zero (represents the annualized effective compounded return rate which can
be earned on the invested capital and is compared relative to the cost of capital.)
• Benefit/Cost Ratio (B/C ratio): The overall “value for money” of a project,
expressed as the ratio of the benefits of a project relative to its costs, with both
expressed in present-value monetary terms.
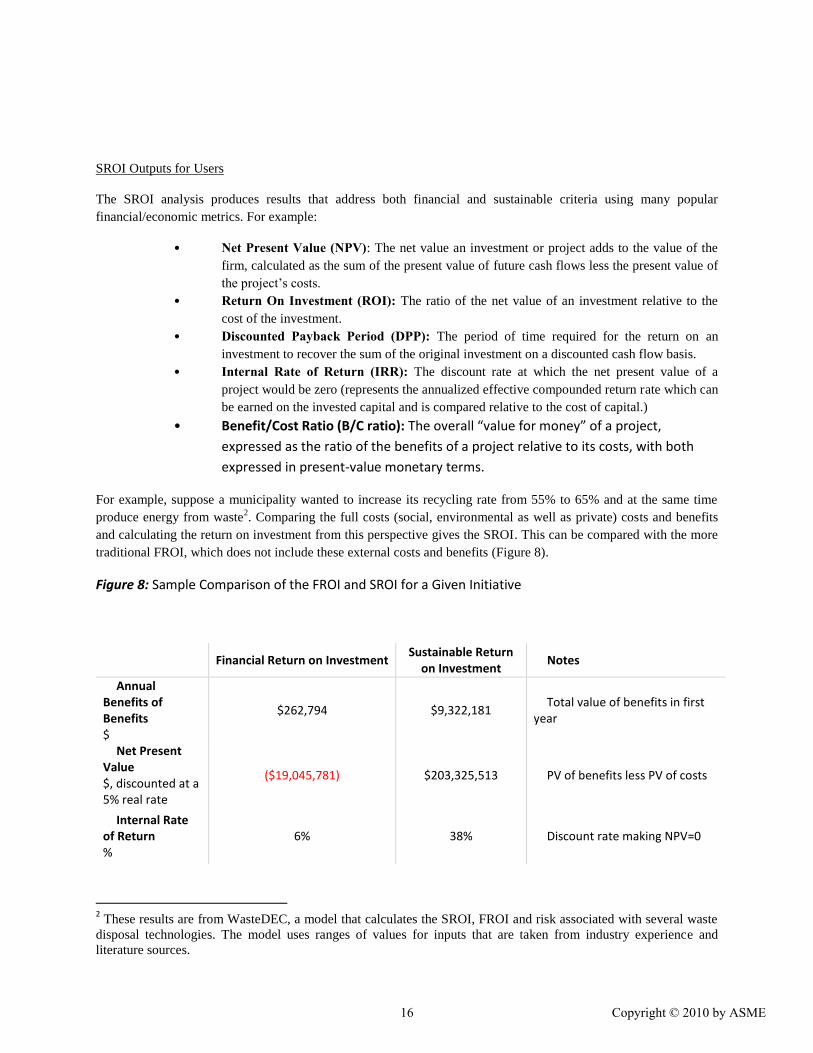
For example, suppose a municipality wanted to increase its recycling rate from 55% to 65% and at the same time
produce energy from waste2. Comparing the full costs (social, environmental as well as private) costs and benefits
and calculating the return on investment from this perspective gives the SROI. This can be compared with the more
traditional FROI, which does not include these external costs and benefits (Figure 8).
Figure 8: Sample Comparison of the FROI and SROI for a Given Initiative
Financial Return on Investment Sustainable Return
on Investment Notes
Annual Benefits of Benefits $
$262,794 $9,322,181 Total value of benefits in first
year
Net Present Value $, discounted at a 5% real rate
($19,045,781) $203,325,513 PV of benefits less PV of costs
Internal Rate of Return %
6% 38% Discount rate making NPV=0
2 These results are from WasteDEC, a model that calculates the SROI, FROI and risk associated with several waste
disposal technologies. The model uses ranges of values for inputs that are taken from industry experience and
literature sources.
16 Copyright © 2010 by ASME

Figure 9: Sustainability ―S‖ Curves Contrasting Rate of Return for a Waste to Energy Project
0.104 0.7815.0% 90.0% 5.0%
0
0.2
0.4
0.6
0.8
1
-0.2 0
0.2
0.4
0.6
0.8 1
1.2
1.4
Pro
bab
ility
of
No
t Ex
cee
din
g
Rate of Return
SROI and FROI
Internal Rate of Return / SROI
Internal Rate of Return / FROI
17 Copyright © 2010 by ASME

Using the SROI process allows decision-makers the
ability to prioritize worthy—but competing—projects
for funding based on the maximum financial and
societal returns. In the example, a project’s outcome
metrics are synthesized into an intuitive risk analysis
model based on return on investment.
A. Compare the financial return on investment
and sustainable return on investment. In this
example, the mean sustainable return on
investment is more than six times the
traditional return on investment.
B. Evaluate noncash benefits, such as
improvements in employee health and
productivity, and the benefits to larger
community.
C. Assess the statistical likelihood that return
will fall within an 80% confidence interval.
In this example, sustainable return on
investment ranges from 10% to 78%.
This recycling and Waste-to-Energy project (Figure
9) for the municipality might have been rejected on
traditional business case (FROI) criteria, a 6% rate of
return might not have been deemed acceptable.
Looking at external costs and benefits of the
alternatives such as the true, social, costs of
landfilling and benefits of Waste to Energy the SROI
suggests that this project is a winner with a mean
return (SROI) of 38%. Decision makers can also be
sure that the risk has been accounted for and
measured. If they are risk averse and want to be 90%
sure, then they can count on an SROI of at least 10%.
An additional benefit of SROI risk-adjusted results is
that risks are quantified and can be ranked so risk
mitigation plans can be formulated. A tornado
diagram (Figure 10) ranks the risk from biggest (at
the top) to smallest (at the bottom).
18 Copyright © 2010 by ASME

Figure 10: Tornado Diagram Illustration of Risk Ranking Tool
CONCLUSION
While there is general agreement about the
importance of social impacts, with the environment
front and center, there is less of a consensus
regarding how organizations can account for socially
responsible actions. As a result, Waste to Energy
proponents has many questions about how to
incorporate and achieve sustainability in projects and
programs: What external costs and benefits should be
considered? How should these costs and benefits be
measured? Which alternative provides the optimal
triple bottom line payoff? What’s the probability of
breaking even?
The SROI framework addresses these questions by
incorporating a transparent probabilistic methodology
that adheres to well-established economic concepts.
As such, the SROI framework can be used to
determine which projects should be undertaken –
from both a business case perspective and from a
social perspective.
0.0495
-0.0359
-0.0191
-0.0157
-0.0139
-0.0123
-0.00972
-0.00803
-0.00790
-0.00775
0.00550
-40
-30
-20
-10 0
10
20
30
40
50
Landfill Costs
Capital Cost Waste To Energy (WTE)
Recycling Cost
Composting Cost
Anaerobic Digestion Cost
Capital Cost Recycling Programs
Operating Costs Waste To Energy (WTE)
NOX Price
Land Application Costs
Cost of CO2
Waste To Energy (WTE) Electricity Price
Internal Rate of Return / SROIValues in Thousandths
Internal Rate of Return / SROI
19 Copyright © 2010 by ASME