measuring the morphology of suburban settlements: scale
TRANSCRIPT

2021, 29(1) MORAVIAN GEOGRAPHICAL REPORTS
27
2021, 29(1): 27–38 MORAVIAN GEOGRAPHICAL REPORTS
27
The Czech Academy of Sciences, Institute of Geonics
journal homepage: http://www.geonika.cz/mgr.html
doi: https://doi.org/10.2478/mgr-2021-0003
MORAVIAN GEOGRAPHICAL REPORTS
MORAVIANGEOGRAPHICAL REPORTS
Illustrations related to the paper by R. Blaheta et al. (photo: T. Krejčí, E. Nováková (2×), Z. Říha)
Fig. 5. Professor Eva Zažímalová, president of the Czech Academy of Sciences, presents Professor Bryn Greer-Wootten with the honorary medal
Fig. 6. Professor Bryn Greer-Wootten has his speech during the award ceremony
Fig. 4. The Löw-Beer Villa in Brno, a place of the award ceremony
Fig. 3. Members of the International Advisory Board of the MGR journal in front of the Institute of Geonics
1. IntroductionFrom its early phases during the late 1990s,
suburbanisation in Prague’s hinterland was described as a potential threat to the natural landscape and social cohesion, which were discussed several decades previously in the Anglo-American literature (e.g. Clawson, 1962; Harvey and Clark, 1965). For example, Sýkora (2002) wrote about the negative social, economic and ecological impacts of post-socialist suburbanisation during the 1990s. The term urban sprawl had been introduced in scientific and media discourse generally as a negative form of suburbanisation, especially with regard to the consumption of agricultural land. Further, the architect Milan Hnilička (2005) used the term Sídelní kaše (settlement mash), in a Czech morphological and aesthetic sense and criticised low-density development of new suburban residential and commercial areas in the sprawling post-socialist city.
On the other hand, Ouředníček (2007, 2016) has argued that past suburban development in Central and Eastern European (CEE) countries has specific forms and consequences in comparison to Western countries, and that the typical forms of new housing construction are in-fills and
a Urban and Regional Laboratory (URRlab), Department of Social Geography and Regional Development, Faculty of Science, Charles University, Prague, Czech Republic (* corresponding author: M. Ouředníček, e-mail: [email protected])
AbstractThe academic debate on methodological approaches to the measurement of urban sprawl, particularly its most cited dimension, the density of residential settlement, is discussed in this article. The methodology of point pattern analysis, and its benefits in comparison to land-use data analysis, especially for researching the morphology of residential development, is examined. This empirical study was conducted in the hinterland of Prague and is based on point data from 2007, 2010 and 2016. The paper contributes to the scholarly discussion of suburbanisation in Central and Eastern European countries, including the morphology of suburban development. The role of scale is also emphasised, given our observation of two ambiguous means of development, namely spatial dispersion at the regional scale and increasing density at the local scale. The findings support claims regarding the crucial role of micro-scale research in understanding suburban form. The largest Czech suburb of Jesenice serves as a case study, where the morphology of built-up areas is analysed in the local context.
Key words: urban sprawl, suburbanisation, point pattern analysis, morphology, Prague Urban Region, Czech Republic
Article history: Received 18 December 2019, Accepted 30 October 2020, Published 31 March 2021
Measuring the morphology of suburban settlements: Scale-dependent ambiguities of residential density
development in the Prague Urban Region
Jiří-Jakub ZÉVL a, Martin OUŘEDNÍČEK a *
small spatial extensions of existing settlements. Opinions on the morphology of suburban development differ considerably not only between Western and post-socialist discourses, but also within the literature describing new suburban development in CEE countries (Siedentop and Fina, 2010; Sýkora and Stanilov, 2014; Ewing and Hamidi, 2015; Dinić and Miković, 2016; Mantey and Sudra, 2019).
Many academic researchers have contributed to discussions about the morphological form of suburban development – either on the level of the whole metropolitan area or with respect to the spatial arrangement of individual settlements (municipalities). This paper deals primarily with the local context and morphology of individual suburban settlements. Morphology from our perspective indicates the spatial arrangement of new suburban developments within concrete municipalities. We investigate whether new residential areas are characterised by larger newly built areas, or rather a scattered new construction of several houses within the existing built-up area of a municipality.
The paper is based on an investigation of suburbanisation in Prague and focuses on the main attributes in the development of morphological form of suburban settlements

MORAVIAN GEOGRAPHICAL REPORTS 2021, 29(1)
28
MORAVIAN GEOGRAPHICAL REPORTS 2021, 29(1): 27–38
28
within the Prague Urban Region. Its location within the Czech Republic is demonstrated in Figure 1. For the purpose of this work, the suburban zone of Prague is composed of administrative districts: Prague-East and Prague-West. Together with the capital city of Prague, they create the Prague Urban Region, which can be perceived as an area with the most intensive daily contacts of the metropolitan population. The current discussion is mirrored in an extensive literature focused on Prague’s suburbanisation as a topical subject. It contains morphology-focused studies, but it is still missing thorough empirical evidence about the general trends in settlement morphology during the transformation era. Thus, the aim of this paper is to measure the most common dimension of urban sprawl, the density of settlement, and its development during approximately the last decade. The main research questions focused on the spatial form of new suburban development and methods for its investigation, and can be formulated as follows:
• What are the main contemporary trends in spatial morphology development on the regional (i.e. in the Prague Urban Region) and local (i.e. in the case study of the largest Czech suburb – Jesenice) spatial levels?; and
• How can we measure settlement density with respect to the specificities of Czech suburbanisation?
The paper incorporates the method of point pattern analysis as an important addition to the analysis of land-use data, which is now dominant in measuring urban sprawl (e.g. Galster, 2001; Song and Knaap, 2004; Siedentop and Fina, 2010; Yue, Liu and Fan, 2013; European Environment Agency, 2016). To demonstrate this methodological approach, the paper focuses on the density of built-up areas, which is the most important dimension of such a multi-dimensional phenomenon as urban sprawl (Torrens and Alberti, 2000; Galster et al., 2001; Reis, Silva and Pinho, 2016).
2. Measuring city expansionThe morphological manifestation of suburbanisation
is frequently analysed using the concept of urban sprawl (Cirtautas, 2015; Mantey and Sudra, 2019). It is perceived as the low-density physical pattern of suburban development (European Environmental Agency, 2016), and it is probably the worldwide dominant concept to evaluate the spatial form of urban landscapes, despite the heterogeneity of city models in various contexts. In accord with Galster et al. (2001), we regard urban sprawl as an extremely low-density and low-level product of suburbanisation. Nevertheless, precise definition varies by author and by scale, and the debate over urban sprawl has not resulted in one common sense of the term (Siedentop and Fina, 2010). Galster et al. (2001) define six groups of the meaning of urban sprawl: definition by example; aesthetic judgement; cause of an externality (such as high dependence on the automobile); consequence of an independent variable (e.g. poor planning); pattern of development; and process of city expansion. These various connotations make every empirical analysis more difficult and nearly incomparable with others, because the results are highly sensitive to the definition. Moreover, the same is also true for the definition of suburbs (Forsyth, 2019) or the suburbanisation process in general (Ouředníček, 2007)1.
On the other hand, it is true that at least some agreement does exist: among the common characteristics of urban sprawl one finds extensive urbanisation, low density, single use, fragmentation/scatter or a poor accessibility to selected functions (Reis, Silva and Pinho, 2016).
Empirical attempts of measuring urban sprawl can be found since one of the term’s operationalisations in 1997 (Ewing, 1997). Torrens and Alberti (2000) and Galster et al. (2001) were pioneers in this field, stressing the multi-dimensional character of urban sprawl. Nevertheless, there is a lack of consensus about the precise nature of these dimensions. The operationalisation of the urban sprawl theoretical concept has been discussed several times in the context of suburban morphology in CEE cities (Dinić and Mitković, 2016; Mantey and Sudra, 2019). Existing reviews of methods (e.g. Schwarz, 2010; Siedentop and Fina, 2010; Ewing and Hamidi, 2015; Reis, Silva and Pinho, 2016) confirm that the density of a built-up area is the most common measurement of urban sprawl.
This paper focuses upon density for at least two other reasons. Firstly, the low density of built-up areas stands as the primary characteristic of suburban form (Sýkora and Stanilov, 2014; Dinić and Miković, 2016), the most frequently used (Siedentop and Fina, 2010; Ewing and Hamidi, 2015), and probably the most noticeable manifestation of suburbanisation for the general public. Hnilička’s (2005) critique of urban design within suburbia emphasises such low density. In addition, the one-dimensional conception of urban sprawl, in an earlier stage, was focused on density (Ewing and Hamidi, 2015). This does not mean, however, that this paper attempts to deny more recent multi-dimensional conceptions. The second reason is a subjective preference to focus upon one dimension, as it allows a thorough investigation of that dimension. Finally, density is often discursively associated with quality of life (Eberle, 2005; Dinić and Miković, 2016), a not unimportant factor.
Regardless, in fact, the term density might connote multiple meanings. The literature conceptualises density in two main ways: as a concentration of population, or of buildings (Dinić and Miković, 2016; Mantey and Sudra, 2019). Even though these conceptions are related, they are not interchangeable.
Fig. 1: Location of the Prague Urban Region within the Czech Republic. Source: Arcdata Praha, CZSO (2016), composed by the authors
1 We define (residential) suburbanisation as the relocation of the population from the core city to new housing in the suburban zone (Ouředníček, 2007). Suburb is subsequently a municipality with new housing development and in-migration of new residents from the core city of metropolitan regions. The latest contribution to delimitation of suburban areas in the Czech Republic is available in the article by Ouředníček, Klsák and Špačková (2019).

2021, 29(1) MORAVIAN GEOGRAPHICAL REPORTS
29
2021, 29(1): 27–38 MORAVIAN GEOGRAPHICAL REPORTS
29
Hnilička’s (2005) review of the architectonic studies concerning population density demonstrates that public transport is too costly in low-density areas. The density, as population per area, however, can hardly be enough to analyse significant parts of the suburbanisation-related issues, such as the consumption of arable land or water retention (Chuman and Romportl, 2008). These issues depend rather upon spatial configuration: the number and the size of newly constructed buildings. There is an important difference between detached single-family houses and apartment houses (de Smet and Teller, 2016). Hence, the population density is not coincident with settlement density, which is the number of buildings per area (e.g. Galster et al., 2001; Song and Knaap, 2007). The choice of an appropriate method must also be made taking account the specific context of CEE cities in the post-socialist era.
The scale choice is not only essential for the spatial resolution of data but also for the loss of information in aggregate data (generalisation) and for spatial non-stationarity. The most common scale for measurement of urban sprawl is at the level of the urban region (e.g. Galster et al., 2001; Tsai, 2005; Yue, Liu and Fan, 2013; Hamidi and Ewing, 2014; Al Mashagbah, 2016; Reis, Silva and Pinho, 2016; Šveda, Madajová and Podolák, 2016). For the land-use data, the spatial resolution of one cell usually corresponds to a city-quarter or a village. For example, Galster et al. (2001) used cells of size 1 square mile (≈ 2.6 km2). Further, there are several studies that examine urban sprawl on the level of even states or regions (Sudhira, Ramachandra and Jagadish, 2004; Schwarz, 2010; Siedentop and Fina, 2010) or combine both scales (Hennig et al., 2015; European Environment Agency, 2016). These studies help us to understand better the general tendencies in the development of a settlement system and provide valuable information about the environmental impacts of suburbanisation. Finally, there are a small number of studies of suburban morphology on a local scale (Song and Knaap, 2004; Ouředníček, 2007; Frenkel and Ashkenazi, 2008; Kupková and Ouředníček, 2013; Šveda and Pazúr, 2018). Such investigations on a local scale enable a better distinction between different land-use functions (i.e. commercial and residential development) and offer information about the internal structure of urban areas, which can be quite heterogeneous.
Unfortunately, urban areas are seen sometimes as a kind of black box. Cities around the world hardly grow in the same way. Thus, use of such a black box can be risky because the understanding of the term ‘urban area’ varies considerably in diverse cultural contexts. Although the origin of ‘urban sprawl’ measures lies in North America, today the centre of discussion has shifted to Asia (e.g. Sudhira, Ramachandra and Jagadish, 2004; Jiang et al., 2007; Jat, Garg and Khare, 2008; Yue, Liu and Fan, 2013; Al Mashagbah, 2016), where it is extremely relevant for fast-growing cities. In Europe, we can mention the more current work of Hennig et al. (2015), Oueslati, Alvanides and Garrod (2015) or de Smet and Teller (2016). The relevance of the topic in the European context is underlined by the interest of the European Environment Agency (EEA) because urban sprawl is a “major threat to sustainable land use” (EEA, 2016, p. 16). Moreover, the relevance for CEE cities is even higher since suburbanisation is the main process reshaping post-socialist cities during the last decades (Ouředníček, 2007; Sýkora and Stanilov, 2014; Šveda, Madajová and Podolák, 2016).
3. Prague – the expanding post-socialist cityPrague can be seen as a laboratory for post-socialist
urban research, where suburbanisation is the key mode of urban growth (Sýkora and Stanilov, 2014). A long tradition of empirical research on urban topics exists in the Czech Republic, including research on suburban development. There are several individual works on this specific topic by geographers (Ouředníček, 2007; Sýkora and Ouředníček, 2007), by architects (Hnilička, 2005) or collective monographies (Sýkora, 2002; Ouředníček, Špačková and Novák, 2013). The early works, in the first two decades of the post-socialist transformation, were inspired by Western concepts. As Ouředníček (2016) states, however, the relevance of these concepts is limited in the Czech Republic (or more widely, post-socialist) settings, especially in the case of the outer zones of metropolitan regions.
Throughout the Czech Republic there is an old settlement system consisting of small villages, whose cores date to the medieval era. Some of the villages were incorporated into the growing industrial and socialist cities during the 20th century, while other more remote villages have become sites of new suburban housing construction. There is still a lack of empirical evidence about morphological characteristics, specifically comparisons between old and new suburban settlements. Nevertheless, the main difference in the morphological form of suburban development between the Czech Republic and North America is that residential greenfield development is very rare (Ouředníček, 2007), as individual projects can mostly be found within existing settlements. Additionally, there are larger housing projects on the edge of existing villages as well. Moreover, the phenomenon of transforming second homes (recreational cottages) into permanent residences is also observed (Vágner, Müller and Fialová, 2011). These houses differ from new construction by morphology on a micro-scale. According to the specificities described above in the Czech literature (e.g. Sýkora, 2002; Hnilička, 2005), urban sprawl is seen as an extreme morphological form of suburban development, which is characterised by a low density of settlement. This general tendency of morphological development in the Prague Urban Region, thus, needs to be discussed.
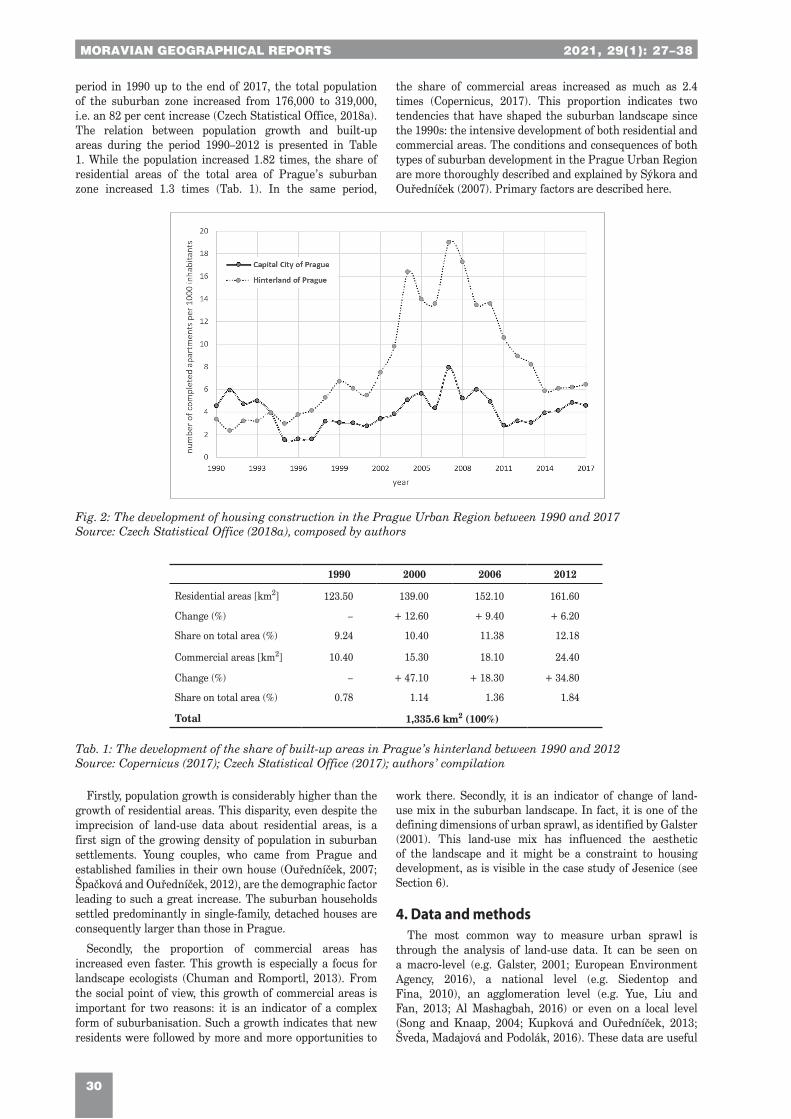
The phases of suburbanisation in the Prague Urban Region can be detected in Figure 2, which shows the relative number of completed apartments in Prague and its hinterland. As the chart indicates, the process began to intensify from the mid-1990s. The number of completed apartments started to increase at that time. Concerning this new phase, the introduction of mortgages played a key role, as they became available even for middle-income households. It was a period when the first larger commercial projects were finished around Prague. As Figure 2 demonstrates, the peaks in housing construction in the suburban zone were in 2004 and in 2007. Afterwards, the economic crisis slowed growth considerably in the hinterland. The relative number of completed apartments started to converge between Prague and the hinterland, as Prague’s housing market recovered sooner after 2010. Housing construction within the suburban zone resumed some growth only after 2014. In sum, the total number of completed apartments reached 51,510 in the hinterland and 137,891 in Prague during the period 1990–2017 (Czech Statistical Office, 2018a).
This increase of housing construction corresponds to the increase in the total number of the suburban zone’s population. Since the beginning of the transformation
MORAVIAN GEOGRAPHICAL REPORTS 2021, 29(1)
30
MORAVIAN GEOGRAPHICAL REPORTS 2021, 29(1): 27–38
30
period in 1990 up to the end of 2017, the total population of the suburban zone increased from 176,000 to 319,000, i.e. an 82 per cent increase (Czech Statistical Office, 2018a). The relation between population growth and built-up areas during the period 1990–2012 is presented in Table 1. While the population increased 1.82 times, the share of residential areas of the total area of Prague’s suburban zone increased 1.3 times (Tab. 1). In the same period,
the share of commercial areas increased as much as 2.4 times (Copernicus, 2017). This proportion indicates two tendencies that have shaped the suburban landscape since the 1990s: the intensive development of both residential and commercial areas. The conditions and consequences of both types of suburban development in the Prague Urban Region are more thoroughly described and explained by Sýkora and Ouředníček (2007). Primary factors are described here.
1990 2000 2006 2012
Residential areas [km2] 123.50 139.00 152.10 161.60
Change (%) – + 12.60 + 9.40 + 6.20
Share on total area (%) 9.24 10.40 11.38 12.18
Commercial areas [km2] 10.40 15.30 18.10 24.40
Change (%) – + 47.10 + 18.30 + 34.80
Share on total area (%) 0.78 1.14 1.36 1.84
Total 1,335.6 km2 (100%)
Fig. 2: The development of housing construction in the Prague Urban Region between 1990 and 2017Source: Czech Statistical Office (2018a), composed by authors
Tab. 1: The development of the share of built-up areas in Prague’s hinterland between 1990 and 2012Source: Copernicus (2017); Czech Statistical Office (2017); authors’ compilation
Firstly, population growth is considerably higher than the growth of residential areas. This disparity, even despite the imprecision of land-use data about residential areas, is a first sign of the growing density of population in suburban settlements. Young couples, who came from Prague and established families in their own house (Ouředníček, 2007; Špačková and Ouředníček, 2012), are the demographic factor leading to such a great increase. The suburban households settled predominantly in single-family, detached houses are consequently larger than those in Prague.
Secondly, the proportion of commercial areas has increased even faster. This growth is especially a focus for landscape ecologists (Chuman and Romportl, 2013). From the social point of view, this growth of commercial areas is important for two reasons: it is an indicator of a complex form of suburbanisation. Such a growth indicates that new residents were followed by more and more opportunities to
work there. Secondly, it is an indicator of change of land-use mix in the suburban landscape. In fact, it is one of the defining dimensions of urban sprawl, as identified by Galster (2001). This land-use mix has influenced the aesthetic of the landscape and it might be a constraint to housing development, as is visible in the case study of Jesenice (see Section 6).
4. Data and methodsThe most common way to measure urban sprawl is
through the analysis of land-use data. It can be seen on a macro-level (e.g. Galster, 2001; European Environment Agency, 2016), a national level (e.g. Siedentop and Fina, 2010), an agglomeration level (e.g. Yue, Liu and Fan, 2013; Al Mashagbah, 2016) or even on a local level (Song and Knaap, 2004; Kupková and Ouředníček, 2013; Šveda, Madajová and Podolák, 2016). These data are useful

2021, 29(1) MORAVIAN GEOGRAPHICAL REPORTS
31
2021, 29(1): 27–38 MORAVIAN GEOGRAPHICAL REPORTS
31
due to their accessibility, but such accessibility is propitious only within a limited spatial resolution. On the contrary, it is very difficult and costly to get processed land-use data at high resolution for individual localities. There are only rare examples of sufficient resolution (e.g. Kupková and Ouředníček, 2013; Šveda, Madajová and Podolák, 2016), but these usually concern a few localities and thus generalisation for the wider settlement system is limited. Therefore, land-use data are practical for describing general tendencies on macro-levels, for exploration of features such as commercial suburbanisation or for landscape ecology evaluations (e.g. Chuman and Romportl, 2013).
In the case of Corine Land Cover (Copernicus, 2017), the built-up area is incorporated into the database only if it exceeds 25 hectares. Hence, this method is obviously not precise enough to evaluate changes that characterise dynamic suburban developments around Prague, for which in-fills within the former built-up areas and small-scale construction sites are typical (Ouředníček, 2007; in Bratislava, see Šveda and Pazúr, 2018). Therefore, this paper uses the method of the Average Nearest Neighbour to measure settlement density and is prepared to demonstrate the potential of point pattern analysis in measuring urban sprawl. The point data originate from the Register of Census Tracts and Buildings (RCTB) provided by the Czech Statistical Office. It is a public database of all residential and commercial buildings, specifically a set of data points in coordinate system S-JTSK. It consists of 129,933 objects in 2016 (compared to 118,724 in 2010 and 102,278 in 2007). Coordinates of every point correspond to the location of one building in the suburban zone of Prague (i.e. the administrative districts of Prague-East and Prague-West). These data have been accessed for years 2007, 2010 and 2016.
To analyse point data, the method of Nearest Neighbour Analysis was applied. It is a transparently interpretable method to investigate the spatial structure of data. This method can be used to investigate data independently of scales (from one settlement up to the city region, or possibly even larger areas). The method assumes a mathematical plane. For each point (or for selected points) of the plane (noted i), the nearest distinct point (noted j) is identified. Thereafter, the Euclidian distance between i and j is
calculated. The numeric value of the resulting coefficient (noted ANN, in metres) is a distance dij. In fact, this paper uses the method in two versions.
The first method operates with spatial data. The value of each point represents the distance to the nearest point (building) itself and it is used in a map. In order to construct the distribution function (Fig. 3), which is the main analytical figure of this paper, the spatial data were transformed into an aggregate file. The distribution function was chosen to visualise data and their structure. The aggregate of all buildings in Prague’s suburban zone was divided into equal intervals according to the numeric value of the Nearest Neighbour statistic and the frequency of occurrence was calculated. Since the discrete data cannot be visualised by a curve, the frequencies were transformed into probabilities. This transformation allows visualisation of data as continuous curves, which are considerably more practical to compare data structures in distinct time periods. Deviations between curves (see Fig. 3) indicate anomalies in morphology at the scale of individual houses, which is the crucial scale in the CEE context.
Secondly, to express the aggregate characteristics of the data set, the arithmetic average is derived. Hence, the mathematical expression of Average Nearest Neighbour, where n is the total number of points in an observed area, is as follows (ArcGIS Pro, 2018):
Fig. 3: Probability of distance to the nearest building in the suburban zone of Prague in 2007, 2010 and 2016 (Note: The probabilities of distances greater than 40 metres have not been recorded)Source: Czech Statistical Office (2007; 2010; 2016)
6
j) is identified. Thereafter, the Euclidian distance between i and j is calculated. The numeric value of the resulting coefficient (noted ANN, in metres) is a distance dij. In fact, this paper uses the method in two versions. The first method operates with spatial data. The value of each point represents the distance to the nearest point (building) itself and it is used in a map. In order to construct the distribution function (Fig. 3), which is the main analytical figure of this paper, the spatial data were transformed into an aggregate file. The distribution function was chosen to visualise data and their structure. The aggregate of all buildings in Prague’s suburban zone was divided into equal intervals according to the numeric value of the Nearest Neighbour statistic and the frequency of occurrence was calculated. Since the discrete data cannot be visualised by a curve, the frequencies were transformed into probabilities. This transformation allows visualisation of data as continuous curves, which are considerably more practical to compare data structures in distinct time periods. Deviations between curves (see Fig. 3) indicate anomalies in morphology at the scale of individual houses, which is the crucial scale in the CEE context. Secondly, to express the aggregate characteristics of the data set, the arithmetic average is derived. Hence, the mathematical expression of Average Nearest Neighbour, where n is the total number of points in an observed area, is as follows (ArcGIS Pro, 2018):
��� � ∑ 𝑑𝑑������𝑛𝑛
The use of this method helps to solve two methodological problems. Firstly, there are several ways to observe settlement density. For example, Galster et al. (2001) or Song and Knaap (2007) see density as the ratio of residential buildings to the built-up area. This way is logical, yet the built-up area can signify many things. The meanings differ considerably with regard to specific methods of delimitation. For example, Czech master plans delimitate the built-up area in a different way than the CORINE database. Hence, the comparison of built-up areas’ sizes may be confusing, especially with foreign cities. By contrast, the land-use methods are conducive to international comparison, but they are imprecise because of limited spatial resolution. Point data analysis is, thus, practical because it is independent of the precise delimitation of ‘the built-up area’. As the density grows, buildings are closer and the average distance to the nearest neighbour decreases. Secondly, it helps us to focus better on the micro-scale, which is crucial for urban sprawl in post-socialist Prague (Ouředníček, 2007). Using the distribution function for the distance to the nearest neighbour, it is possible to identify anomalies in the morphology of settlement and analyse them in context, because of cartographic visualisation. 5. Development of settlement morphology within the suburban zone of Prague As it was suggested above, in Figure 2, the population was growing faster than the residential areas until 2012. In fact, this finding was based on land-use data, which gives us a general idea rather than rigorous evidence. Therefore, the point data (from RCTB) are used for more detailed insight, which can demonstrate two periods of suburban housing construction (see Tab. 2). During the first observed period, the population and total number of buildings were growing with approximately the same intensity. Afterwards, between 2010 and 2016, the intensity of population growth was nearly double the intensity of housing construction. This disparity signifies the change in the building occupancy rate from 2.17 to 2.35 persons per building. The real numbers are even higher because, as it was mentioned above, the variable ‘number of buildings’ also includes the non-residential buildings, such as those designated as commercial or public. In sum, the observed tendency is evidence of a successively growing density of settlement, in terms of demographic indicators. As Špačková and Ouředníček (2012) explained, young families in particular move to suburban zones. This explanation does not seem to be enough, however, to explain the dissonance in intensities of population and housing construction growth between the periods 2007–2010 and 2010–2016. We argue that the reason might lie in the considerably changing urbanism of suburban settlements. As the case study of Jesenice municipality will demonstrate, recently there are more constructions of apartment houses than before in suburban municipalities. Further, Table 2 shows the development of the Average Nearest Neighbour distance. As the population and total number of buildings increase, the average distance to the nearest building decreases. This is partly caused by the construction of larger residential projects with a higher number of apartment houses, which are always close each to other. Secondly, as Ouředníček (2007) states, housing construction in Prague’s hinterland is often characterised by the development on vacant plots inside the built-up area. There is still a large supply of these plots from the
The use of this method helps to solve two methodological problems. Firstly, there are several ways to observe settlement density. For example, Galster et al. (2001) or Song and Knaap (2007) see density as the ratio of residential buildings to the built-up area. This way is logical, yet the built-up area can signify many things. The meanings differ considerably with regard to specific methods of delimitation. For example, Czech master plans delimitate the built-up area in a different way than the CORINE database. Hence, the comparison of built-up areas’ sizes may be confusing, especially with foreign cities. By contrast, the land-use methods are conducive to international comparison, but they are imprecise because of limited spatial resolution. Point

MORAVIAN GEOGRAPHICAL REPORTS 2021, 29(1)
32
MORAVIAN GEOGRAPHICAL REPORTS 2021, 29(1): 27–38
32
data analysis is, thus, practical because it is independent of the precise delimitation of ‘the built-up area’. As the density grows, buildings are closer and the average distance to the nearest neighbour decreases.
Secondly, it helps us to focus better on the micro-scale, which is crucial for urban sprawl in post-socialist Prague (Ouředníček, 2007). Using the distribution function for the distance to the nearest neighbour, it is possible to identify anomalies in the morphology of settlement and analyse them in context, because of cartographic visualisation.
5. Development of settlement morphology within the suburban zone of Prague
As it was suggested above, in Figure 2, the population was growing faster than the residential areas until 2012. In fact, this finding was based on land-use data, which gives us a general idea rather than rigorous evidence. Therefore, the point data (from RCTB) are used for more detailed insight, which can demonstrate two periods of suburban housing construction (see Tab. 2). During the first observed period, the population and total number of buildings were growing with approximately the same intensity. Afterwards, between 2010 and 2016, the intensity of population growth was nearly double the intensity of housing construction. This disparity signifies the change in the building occupancy rate from 2.17 to 2.35 persons per building. The real numbers are even higher because, as it was mentioned above, the variable ‘number of buildings’ also includes the non-residential buildings, such as those designated as commercial or public. In sum, the observed tendency is evidence of a successively growing density of settlement, in terms of demographic indicators. As Špačková and Ouředníček (2012) explained, young families in particular move to suburban zones. This explanation does not seem to be enough, however, to explain the dissonance in intensities of population and housing construction growth between the periods 2007–2010 and 2010–2016. We argue that the reason might lie in the considerably changing urbanism of suburban settlements. As the case study of Jesenice municipality will demonstrate, recently there are more constructions of apartment houses than before in suburban municipalities.
Further, Table 2 shows the development of the Average Nearest Neighbour distance. As the population and total number of buildings increase, the average distance to the nearest building decreases. This is partly caused by the construction of larger residential projects with a higher number of apartment houses, which are always close each to other. Secondly, as Ouředníček (2007) states, housing construction in Prague’s hinterland is often characterised
by the development on vacant plots inside the built-up area. There is still a large supply of these plots from the times of fragmented construction (in the early phases of Prague’s suburbanisation during 1990s). From an institutional point of view, the municipalities have already learned how to better regulate housing construction. Then, the increase of the plot prices after 2010 and the general economic crisis forced people to purchase smaller plots for individual construction, or only flats in apartment houses and terraced houses in larger residential projects.
In fact, the general tendencies described above are derived from aggregate data on the scale of the entire suburban zone. Looking closer into the data structure, the observed trend is rather ambiguous. As we see in Figure 3, there are two partial tendencies. Firstly, we can see the increasing share of high-density built-up areas, notably a distance of around seven metres between buildings. This high-density is typical for newly built terraced houses and reconstructions of former recreational cottages, which are gradually transformed into permanent residences (Vágner, Müller and Fialová, 2011). Secondly, there is an opposite phenomenon of increasing lower-density construction. The absolute extreme of distribution function in Figure 3 shifts to higher values – namely from 18 metres in 2007 to 19 metres in 2010 and 20 metres in 2016 (in round numbers). Nevertheless, the share of lower-density built-up areas does not change much. Surprisingly, it generally signifies the enlargement of higher-density areas in the suburban zone of Prague during the last decade.
In sum, the focus on morphological aspects of development in the Prague Urban Region brought new knowledge about contemporary trends of morphological patterns of suburban development. The settlement’s density is growing, the average number of people per building is increasing, and consequently the value of Average Nearest Neighbour distance is successively decreasing. Generally, these three significant findings contradict the idea of a successively sprawling city and the development on a regional scale indicated a clear tendency of growing density. The visualisation of the data’s internal structure, however, revealed ambiguous tendencies. While the mean (Average Nearest Neighbour) is decreasing, the most probable value of Nearest Neighbour (analogy of mode for discrete data) evinces the opposite tendency: a shift to higher values. At the same time, the probability of one specific section grows too. This methodological opportunity helps to avoid false interpretations, which would have been the case if not having these data. The situation on the local level is described in the next section.
6. Suburban morphology in the local context: Jesenice case study
The aim of the case study is to illustrate the previous discussion in practice, rather than serve as an analytical tool. Various meanings and examples of densities were discussed above, and the case study discusses them in the local context. The photographical portfolio (Figs. 6–11 in Appendix) documents several housing types within the municipality of Jesenice. The locations of documented places are indicated in Figures 4 and 5a–d. In addition, the case study attempts to demonstrate the impacts on local milieu and the processes mentioned in the arguments above.
The municipality of Jesenice has been chosen as a case study area. It is a dynamically growing municipality just a few kilometres beyond Prague’s administrative boundaries
2007 2010 2016
Population 221,407 257,946 305,374
Change 14.20% 15.50%
Number of buildings 102,728 118,729 129,933
Change 13.50% 8.60%
Average Nearest Neighbour 25.01m 24.28m 23.84m
Change − 2.90% − 1.80%
Tab. 2: The development of settlement characteristics in the suburban zone of Prague in 2007, 2010 and 2016Source: Czech Statistical Office (2007; 2010; 2016), Czech Statistical Office (2017); authors’ calculations
2021, 29(1) MORAVIAN GEOGRAPHICAL REPORTS
33
2021, 29(1): 27–38 MORAVIAN GEOGRAPHICAL REPORTS
33
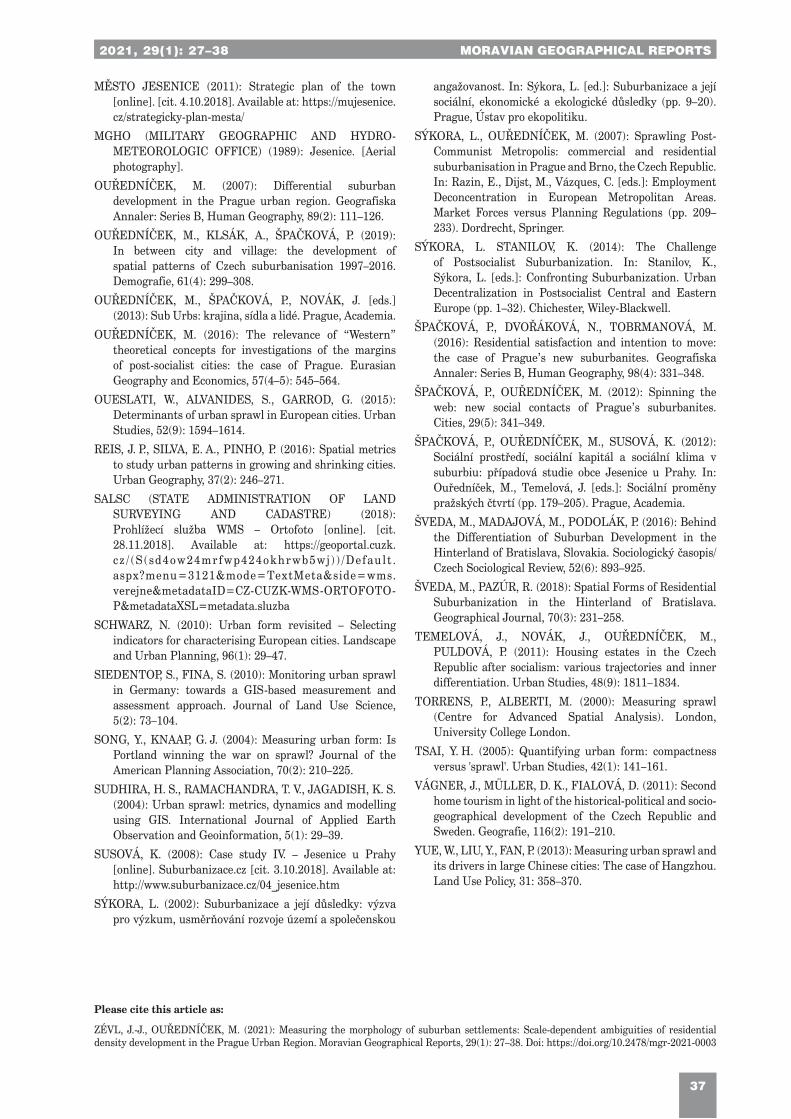
(see Fig. 1). It can be considered the largest suburb in the Czech Republic and a frequent representative of suburban development in various case studies (e.g. Hnilička, 2005; Susová, 2008; Špačková, Ouředníček and Susová, 2012). Therefore, we can exploit the cumulative knowledge from previous investigations. It must be mentioned that Jesenice is an extreme example of suburbanisation within the whole country, rather than a typical case. The various types of new suburban development coexist together within the municipality. It concerns residential development (detached houses, terraced houses and apartment houses) and new commercial development (industry, retail, logistical areas), which were developed from the mid-1990s around an older residential core of the town (see Figs. 5a–d).
The physical and social environment of Jesenice was marked by modern suburbanisation from its early phase. Initial suburban development started during the early 1990s at the north-eastern and northern edge of the original settlement. As Susová (2008) points out, the houses of the first suburbanites are classic examples of what can be called (derisively) “entrepreneur’s baroque” (see Appendix – Fig. 9; A in Figs. 4 and 5a). Susová (2008, p. 1) notes that the “(first incomers) have been building their houses on large and isolated plots behind high walls.” This form of development is probably the most striking example of low-density housing construction in the Czech Republic. It is a very rare example of Czech urban sprawl, as the process is known in North America. The size of area affected by this manner of construction, however, is only a few hectares large.
Massive suburbanisation began after 2002, linked to several commercial projects by developer companies. The average tempo of residential growth reached 250 completed apartments per year. Apart from the massive development of single-family detached houses on former agricultural land, new apartments and terraced houses were also built (Susová, 2008). The rapid residential development brought some negative effects to the area, especially the growing demand for social and technical infrastructure, and a huge
increase of transportation and commuting to Prague. The 2011 Strategic Plan of the municipality identified, for example, a deficiency in public facilities and location of these facilities on the edge of the settlement, a lack of public greenery, and a need for additional infrastructure (Město Jesenice, 2011). In addition, the document identifies other impacts that have been described in the literature, such as the poor quality of public spaces or environmental degradation (Hnilička, 2005). It follows from the document that the consequences of the fast growth in the last two decades are problematic, rather than the low-density construction itself. The municipality did not handle the disparity between the number of incomers and their actual needs. After some time, there were not enough free plots inside the settlement for new infrastructure (Město Jesenice, 2011). One exception was the construction of a new elementary school in 2003.
The built-up area and its development are represented in Figure 4. The original village core from 1989 is the old parcellation pattern, situated on the main road to Prague’s south-eastern hinterland, which used to be an imperial road to Vienna (Fig. 4 – marked by the yellow line). This remaining structure is lined by dark points in Figure 5a, which represents the high-density built-up area.
In the town core, there is a mixture of building designs and uses. The ground level of buildings is frequently used for commercial purposes (restaurant, post-office, pharmacy, etc.). The poly-functionality of place makes it the centre of Jesenice (B in Figs. 4 and 5a; Figure 10). The Strategic plan of the town, however, states that residents miss a clear central public space (Město Jesenice, 2011). Furthermore, there are three main areas of new development. First is the cluster of new residential development on the north (C in Figs. 4 and 5c; Fig. 8), where we can find some of the iconic constructions, which were used as an example of urban sprawl by Hnilička (2005) or Ouředníček (2007). Second is the area of rectangular shape with new apartment houses in the west (D in Figs. 4 and 5b; Fig. 7). Finally, the largest area of housing development lies in the east. It consists predominantly of
Fig. 4: The extent of the compact built-up area in Jesenice in 1989 and 2018 (Notes: The approximate built-up area from 1989 is marked by a red line, and the former imperial road by the yellow line. The letters A–F refer to the examples of housing patterns in the text and photographic portfolio.)Sources: Google Earth, MGHO (1989)

MORAVIAN GEOGRAPHICAL REPORTS 2021, 29(1)
34
MORAVIAN GEOGRAPHICAL REPORTS 2021, 29(1): 27–38
34
detached houses. The south of this area, however, is bordered by strictly commercial constructions (e.g. a retail centre with supermarkets and a small industrial area near the highway – noted as E in Figs. 4 and 5d; Fig. 11).
Similar to the scale of the agglomeration, the quantitative characteristics were measured for Jesenice as well (Figs. 5a–d and Tab. 3). The maps represent settlement density throughout the municipality and indicates where terraced houses and apartment houses are located. Both types are always outside the original core of the town. In that sense, the new constructions are more heterogenous, but neither terraced houses nor apartment houses are homogenous categories of constructions. Terraced houses (e.g. C, see 5c) cover both very dense areas and lower-density constructions. The same is true for apartment houses (e.g. D and F, see 5b). Thus, more than the urbanistic pattern itself, the character of each building is important.
For example, the houses labelled C (Fig. 8) look more like archetypical single-family detached houses, except the houses are interconnected into a line. Only the apartment houses within the old village achieve the category of the highest density.
Despite the presence of terraced houses, apartment houses and the multifunctional houses along the main road, the dominant type of residential development in Jesenice is the single-family detached house. Paradoxically, the newly built areas are more heterogenous in terms of construction types. This mixture of construction types is in opposition to the common representation of urban sprawl as a large uniform field of detached houses.
Looking further at Figures 5a–d, significant differences between densities are not clearly visible, but Table 3 provides more specific information about the densities within different parts of Jesenice. The density of the built-up area is higher in Jesenice’s core than in outer areas during all periods of measurement (2007, 2010 and 2016). As the number of buildings was increasing, the densities of built-up areas were increasing too, but the density increase is not the same over all localities of construction, as can be seen more precisely in Table 3. Between 2007 and 2016, a convergence of the values of densities was observed. The Average Nearest Neighbour value in outer areas decreased by 2.81 metres. By contrast, Average Nearest Neighbour in the core area decreased by only 0.44 metres in the same period. This convergence is caused by filling in the free plots within the existing settlement. In other words, there is a noticeable difference in the number of free plots between the old compact core (which was built before the 1990s) and the newly built areas, which have not yet been fully filled.
Fig. 5: a) Morphology of settlement in Jesenice by 2016 – single-family detached houses; b): Morphology of settlement in Jesenice by 2016 – apartment houses; c): Morphology of settlement in Jesenice by 2016 – terraced houses; d): Morphology of settlement in Jesenice by 2016 – commercial constructionsSource: Czech Statistical Office (2016). Note: Choice of the divisions in the legend is based on the distribution curve from Figure 3
Tab. 3: Morphological characteristics of built-up areas in Jesenice in comparison to the whole suburban zone of Prague (Note: ANN = Average Nearest Neighbour)Data source: Czech Statistical Office (2007; 2010; 2016); authors’ calculations
2007 2010 2016
Number of buildings 672 846 1 005
ANN – core area [m] 24.55 24.17 24.11
ANN – outer areas [m] 28.33 26.10 25.52
ANN – total [m] 26.39 25.28 25.00
ANN – suburban zone of Prague [m] 25.00 24.28 23.84

2021, 29(1) MORAVIAN GEOGRAPHICAL REPORTS
35
2021, 29(1): 27–38 MORAVIAN GEOGRAPHICAL REPORTS
35
The step-by-step in-filling of free plots inside the former built-up areas of the former village corresponds to Ouředníček’s (2007) observation about Czech suburbanisation, which is that it is characterised by very frequent housing construction on free plots within compact settlements. During the first two post-socialist decades, the high demand for suburban housing forced the local councils to delineate new areas for further construction. The new development in suburban municipalities has become, thus, a very serious problem for local politics. The lack of experience with regulations and a non-transparent milieu resulted in the delimitation of large areas for new construction. In the Jesenice case, this oversight in urban planning resulted in the above-mentioned lack of public greenery and public facilities, and a deficiency in social and technical infrastructure. All of this is identified as a weakness in the Strategic plan of the town (Město Jesenice, 2011).
Generally, Jesenice’s present is burdened by its past. The development of the municipality is limited by the heritage of the rapid urban sprawl leap-frog development during the first two decades of post-socialist transformation. Ongoing development is realised on both the free plots within the built-up area and on the settlement’s outskirts. This course of development rectifies the scattered structure of the built-up area. Furthermore, the appearance of the physical environment is influenced by the development of apartment and terraced houses or by commercial constructions. The preferred form of further development is an ongoing issue in local politics, and the physical environment is highly influential for the local social environment. Jesenice is, thus, an important and frequently analysed lesson about rapid growth and about the heterogenous impacts of such growth.
7. Discussion and conclusionsThis paper has discussed the question of measuring
urban sprawl in the suburban zone of Prague. At the outset, the concept of urban sprawl was introduced as highly inconsistent. There are several meanings that influenced the subsequent use of methods. The paper has conceptualised Prague as a city with a specific morphology, particularly on a micro-scale. With respect to previous academic literature, the paper has focused on measuring the most common dimension of urban sprawl, density of settlement, and proposed the use of the method of point pattern analysis (Average Nearest Neighbour). By transforming spatial data into an aggregate, the method is able to discern an internal data structure and its change over time. There is further potential in terms of exploring this phenomenon, however, especially in the combination of land-use data and point data. Further, the strength of point data in measuring density was observed. This methodological procedure can be potentially applied and developed in diverse cultural milieus. The combination of land-use data and point data in research suggests a challenge for the revision of past empirical findings. It can contribute to the creation of a basis for the systematic monitoring of urban sprawl generally. As the global discussion over measuring urban sprawl works predominantly on land-use data, a revision of results might enlighten unexpected findings. In the case of the Prague Urban Region, such unexpected ambiguity in development tendencies has been identified.
In the empirical analysis, there were several unanticipated findings about the morphology of Prague’s suburbanisation. Firstly, the intensity of housing construction is smaller
than expected in comparison with population growth rates. This means that, with the exception of new residential development, a substantial part of Prague’s migration into the hinterland is to existing housing stock, transformed recreational cottages and older houses built during the socialist period or before (see Ouředníček, 2007). Secondly, an increase of residential density is the main tendency in Prague’s hinterland. Between 2007, 2010 and 2016 density gradually increased, but this general tendency incorporates two contradictory processes. Extremely dense settlements, such as terraced and apartment houses, are more and more frequent types of housing construction over the past few years. At the same time, the average distance between buildings is, step by step, increasing. In other words, the spatial pattern of housing construction is more polarised. From a methodological perspective, it demonstrates the crucial importance of micro-scale research of suburban settlements.
The case study focused on micro-level morphological patterns in Jesenice. Despite this suburb being an extreme example of suburbanisation in the Czech Republic, the negative impacts of suburbanisation are still far from the alarming experiences found in North American cities. Beside the common negative impacts of low-density construction, the extremely rapid development of the last two decades was identified as a serious problem. Furthermore, the case study sketched how the development in Jesenice follows the Czech forms of construction within or on the edge of existing built-up areas (Ouředníček, 2007). It also showed the variability of new suburban residential construction. Localities with detached houses, terraced houses and apartment houses create differences in residential densities. Only terraced houses and the old core of the former village, however, achieve the highest level of density, while detached houses on the outskirts of the settlement tend toward urban sprawl leap-frog development, with a lot of vacant plots and uncoordinated housing construction. The consumption of agricultural land and fragmentation of the rural landscape are the most problematic consequences of such developments.
To sum up, the density of houses in Jesenice has been increasing over time (Tab. 3) and the value of Average Nearest Neighbour in Jesenice is always considerably higher than the Average Nearest Neighbour measure for the whole suburban zone of Prague. Comparing this value to more conventional methods, the outcomes are similar. Architect Pavel Hnilička (2005) used the method of plane population density on built-up area in his critical book on the form of suburban development in Prague’s hinterland. From this point of view, the current extent of built-up area in the whole cadastre of Jesenice u Prahy is 1.91 km2 based on data from the masterplan (Město Jesenice, 2006) and orthophotography (SALSC, 2018). In this area, there are 3,970 people registered (Czech Statistical Office, 2018b), representing a population density of about 21 inhabitants per hectare. This roughly corresponds to densities that Hnilička (2005) ascribed to low-density suburban settlements in the Czech Republic but it is still slightly higher than typical suburbs in the USA (Hnilička, 2005).
As was noted at the outset, density is only one of many dimensions of urban sprawl. The example of Jesenice’s morphology, however, is in opposition to Eberle’s (2005) statement that density is the determinative quantity for quality of living. The qualitative characteristics of buildings, public spaces and the environment as a whole are more

MORAVIAN GEOGRAPHICAL REPORTS 2021, 29(1)
36
MORAVIAN GEOGRAPHICAL REPORTS 2021, 29(1): 27–38
36
important than density itself. More widely, Kopečná and Špačková (2012) and Špačková, Dvořáková and Tobrmanová (2016) showed that residential stability is an important quality of single-family households, while apartment houses suffer from considerable residential fluctuation and instability. Therefore, physical and morphological aspects should be investigated together with demographic characteristics, social composition and mobility, all of which are crucial factors for understanding new residential suburbanisation (Špačková and Ouředníček, 2012).
AcknowledgementThe paper was supported by the Czech Science Foundation,
project “Contemporary changes of the social environment within Czech suburbs” (GA18-14510S).
References:AL MASHAGBAH, A. F. (2016): The Use of GIS, Remote
Sensing and Shannon’s Entropy Statistical Techniques to Analyze and Monitor the Spatial and Temporal Patterns of Urbanization and Sprawl in Zarqa City, Jordan. Journal of Geographic Information Systems, 8(2): 293–300.
ARCGIS PRO (2016): How Average Nearest Neighbor works [online]. [cit. 20.11.2018]. Available at: http://pro.arcgis.com/en/pro-app/tool-reference/spatial-statistics/h-how-average-nearest-neighbor-distance-spatial-st.htm
ARCDATA PRAHA, ZÚ, ČSÚ (2016): ArcČR 500 – version 3.3 [data set].
CHUMAN, T., ROMPORTL, D. (2013): Změny krajinného pokryvu a struktury krajiny v České republice vlivem suburbanizace. In: Ouředníček, M., Špačková, P., Novák, J. [eds.]: Sub Urbs: krajina, sídla a lidé (pp. 102– 118). Prague, Academia.
CLAWSON, M. (1962): Urban sprawl and Speculation in Suburban Land. Land Economics, 38(2): 99–111.
COPERNICUS (2017): CORINE Land Cover [data set]. Available at: http://land.copernicus.eu/pan-european/corine-land-cover/view
CZECH STATISTICAL OFFICE (2007, 2010, 2016): Registr sčítacích obvodů a budov [data set].
CZECH STATISTICAL OFFICE (2017): Databáze demografických údajů za obce ČR [data set]. Available at: https://www.czso.cz/csu/czso/databaze-demografickych-udaju-za-obce-cr
CZECH STATISTICAL OFFICE (2018): Dokončené byty v obcích [data set]. Available at: https://www.czso.cz/csu/czso/dokoncene-byty-v-obcich%20
CZECH STATISTICAL OFFICE (2018): Registr sčítacích obvodů a budov – Katastrální území [data set]. Available at: https://apl.czso.cz/irso4/cisdet. j s p ? b = 2 2 & h k o d c i s = 6 3 & t e x t p o l = j e s e n i c e & kodcis=63&kod=658618&ciselid=407293
DE SMET, F., TELLER, J. (2016): Characterising the Morphology of Suburban Settlements: A Method Based on a Semi-automatic Classification of Building Clusters. Landscape Research, 41(1): 113–130.
DINIĆ, M, MIKOVIĆ, P. (2016): Suburban design: from “bedroom communities” to sustainable neighborhoods. Geodetski vestnik, 60(1): 98–113.
EBERLE, D. (2005): Předmluva. In: Hnilička, M. [ed.]: Sídelní kaše. otázky k suburbánní výstavbě kolonií rodinných domů (pp. 7–8). Brno, Era.
EEA (2016): Urban sprawl in Europe [online]. Report of European Environment Agency [cit. 26.03.2018]. Available at: https://www.eea.europa.eu/publications/urban-sprawl-in-europe
EWING, R. (1997): Is Los Angeles-Style Sprawl Desirable? Journal of the American Planning Association, 63(1): 107–126.
EWING, R., HAMIDI, S. (2015): Compactness versus sprawl: A review of recent evidence from the United States. Journal of Planning Literature, 30(4): 413–432.
FORSYTH, A. (2018): Defining suburbs. In: Hanlon, B., Vicino, T. J. [eds.]: The Routledge companion to the suburbs (pp. 13–28). London and New York, Routledge.
FRENKEL, A., ASHKENAZI, M. (2008): Measuring urban sprawl: how can we deal with it? Environment and Planning B: Planning and Design, 35(1): 56–79.
GALSTER, G., HANSON, R., RATCLIFFE, M. R., WOLMAN, H., COLEMAN, S., FREIHAGE, J. (2001): Wrestling sprawl to the ground: defining and measuring an elusive concept. Housing Policy Debate, 12(4): 681–717.
HAMIDI, S., EWING, R. (2014): A longitudinal study of changes in urban sprawl between 2000 and 2010 in the United States. Landscape and Urban Planning, 128: 72–82.
HARVEY, R. O., CLARK, W. A. (1965): The nature and economics of urban sprawl. Land Economics, 41(1): 1–9.
HENNIG, E. I., SCHWICK, C., SOUKUP, T., ORTILOVÁ, E., KIENAST, F., JAEGER, J. A. (2015): Multi-scale analysis of urban sprawl in Europe: Towards a European de-sprawling strategy. Land Use Policy, 49: 483–498.
HNILIČKA, P. (2005): Sídelní kaše: otázky k suburbánní výstavbě kolonií rodinných domů. Brno, Era.
JAT, M. K., GARG, P. K., KHARE, D. (2008): Monitoring and modelling of urban sprawl using remote sensing and GIS techniques. International journal of Applied Earth Observation and Geoinformation, 10(1): 26–43.
JIANG, F., LIU, S., YUAN, H., ZHANG, Q. (2007): Measuring urban sprawl in Beijing with geo-spatial indices. Journal of Geographical Sciences, 17(4): 469–478.
KOPEČNÁ, M., ŠPAČKOVÁ, P. (2012): Rezidenční stabilita obyvatelpražskéhozázemí:případovástudieobceŘíčany.In: Ouředníček, M., Temelová, J. [eds.]: Sociální proměny pražskýchčtvrtí(pp.206–228).Prague,Academia.
KUPKOVÁ, L., OUŘEDNÍČEK, M. (2013): Hodnocení intenzity,prostorovéhorozloženíadopadůsuburbanizacev zázemí Prahy s využitím dat dálkového průzkumuzemě. In: Ouředníček, M., Špačková, P., Novák, J. [eds.]: Sub Urbs: krajina, sídla a lidé (pp. 119–149). Prague, Academia.
MANTEY, D., SUDRA, P. (2019): Types of suburbs in post-socialist Poland and their potential for creating public spaces. Cities, 88: 209–221.
MĚSTO JESENICE (2006): Master plan of Jesenice municipality [online]. [cit. 28.11.2018]. Available at: https://mujesenice.cz/formular/1-vyuziti-uzemi.pdf
2021, 29(1) MORAVIAN GEOGRAPHICAL REPORTS
37
2021, 29(1): 27–38 MORAVIAN GEOGRAPHICAL REPORTS
37
MĚSTO JESENICE (2011): Strategic plan of the town [online]. [cit. 4.10.2018]. Available at: https://mujesenice.cz/strategicky-plan-mesta/
MGHO (MILITARY GEOGRAPHIC AND HYDRO-METEOROLOGIC OFFICE) (1989): Jesenice. [Aerial photography].
OUŘEDNÍČEK, M. (2007): Differential suburban development in the Prague urban region. Geografiska Annaler: Series B, Human Geography, 89(2): 111–126.
OUŘEDNÍČEK, M., KLSÁK, A., ŠPAČKOVÁ, P. (2019): In between city and village: the development of spatial patterns of Czech suburbanisation 1997–2016. Demografie, 61(4): 299–308.
OUŘEDNÍČEK, M., ŠPAČKOVÁ, P., NOVÁK, J. [eds.] (2013): Sub Urbs: krajina, sídla a lidé. Prague, Academia.
OUŘEDNÍČEK, M. (2016): The relevance of “Western” theoretical concepts for investigations of the margins of post-socialist cities: the case of Prague. Eurasian Geography and Economics, 57(4–5): 545–564.
OUESLATI, W., ALVANIDES, S., GARROD, G. (2015): Determinants of urban sprawl in European cities. Urban Studies, 52(9): 1594–1614.
REIS, J. P., SILVA, E. A., PINHO, P. (2016): Spatial metrics to study urban patterns in growing and shrinking cities. Urban Geography, 37(2): 246–271.
SALSC (STATE ADMINISTRATION OF LAND SURVEYING AND CADASTRE) (2018): Prohlížecí služba WMS – Ortofoto [online]. [cit.28.11.2018]. Available at: https://geoportal.cuzk.cz / (S(sd4ow24mrfwp424okhrwb5wj) ) /Defaul t .aspx?menu=3121&mode=TextMeta&side=wms.verejne&metadataID=CZ-CUZK-WMS-ORTOFOTO-P&metadataXSL=metadata.sluzba
SCHWARZ, N. (2010): Urban form revisited – Selecting indicators for characterising European cities. Landscape and Urban Planning, 96(1): 29–47.
SIEDENTOP, S., FINA, S. (2010): Monitoring urban sprawl in Germany: towards a GIS-based measurement and assessment approach. Journal of Land Use Science, 5(2): 73–104.
SONG, Y., KNAAP, G. J. (2004): Measuring urban form: Is Portland winning the war on sprawl? Journal of the American Planning Association, 70(2): 210–225.
SUDHIRA, H. S., RAMACHANDRA, T. V., JAGADISH, K. S. (2004): Urban sprawl: metrics, dynamics and modelling using GIS. International Journal of Applied Earth Observation and Geoinformation, 5(1): 29–39.
SUSOVÁ, K. (2008): Case study IV. – Jesenice u Prahy [online]. Suburbanizace.cz [cit. 3.10.2018]. Available at: http://www.suburbanizace.cz/04_jesenice.htm
SÝKORA, L. (2002): Suburbanizace a její důsledky: výzva pro výzkum, usměrňování rozvoje území a společenskou
angažovanost.In:Sýkora,L.[ed.]:Suburbanizacea jejísociální, ekonomické a ekologické důsledky (pp. 9–20). Prague, Ústav pro ekopolitiku.
SÝKORA, L., OUŘEDNÍČEK, M. (2007): Sprawling Post-Communist Metropolis: commercial and residential suburbanisation in Prague and Brno, the Czech Republic. In: Razin, E., Dijst, M., Vázques, C. [eds.]: Employment Deconcentration in European Metropolitan Areas. Market Forces versus Planning Regulations (pp. 209–233). Dordrecht, Springer.
SÝKORA, L. STANILOV, K. (2014): The Challenge of Postsocialist Suburbanization. In: Stanilov, K., Sýkora, L. [eds.]: Confronting Suburbanization. Urban Decentralization in Postsocialist Central and Eastern Europe (pp. 1–32). Chichester, Wiley-Blackwell.
ŠPAČKOVÁ, P., DVOŘÁKOVÁ, N., TOBRMANOVÁ, M. (2016): Residential satisfaction and intention to move: the case of Prague’s new suburbanites. Geografiska Annaler: Series B, Human Geography, 98(4): 331–348.
ŠPAČKOVÁ, P., OUŘEDNÍČEK, M. (2012): Spinning the web: new social contacts of Prague’s suburbanites. Cities, 29(5): 341–349.
ŠPAČKOVÁ, P., OUŘEDNÍČEK, M., SUSOVÁ, K. (2012): Sociální prostředí, sociální kapitál a sociální klima v suburbiu: případová studie obce Jesenice u Prahy. In: Ouředníček, M., Temelová, J. [eds.]: Sociální proměny pražskýchčtvrtí(pp.179–205).Prague,Academia.
ŠVEDA, M., MADAJOVÁ, M., PODOLÁK, P. (2016): Behind the Differentiation of Suburban Development in the Hinterland of Bratislava, Slovakia. Sociologický časopis/Czech Sociological Review, 52(6): 893–925.
ŠVEDA, M., PAZÚR, R. (2018): Spatial Forms of Residential Suburbanization in the Hinterland of Bratislava. Geographical Journal, 70(3): 231–258.
TEMELOVÁ, J., NOVÁK, J., OUŘEDNÍČEK, M., PULDOVÁ, P. (2011): Housing estates in the Czech Republic after socialism: various trajectories and inner differentiation. Urban Studies, 48(9): 1811–1834.
TORRENS, P., ALBERTI, M. (2000): Measuring sprawl (Centre for Advanced Spatial Analysis). London, University College London.
TSAI, Y. H. (2005): Quantifying urban form: compactness versus 'sprawl'. Urban Studies, 42(1): 141–161.
VÁGNER, J., MÜLLER, D. K., FIALOVÁ, D. (2011): Second home tourism in light of the historical-political and socio-geographical development of the Czech Republic and Sweden. Geografie, 116(2): 191–210.
YUE, W., LIU, Y., FAN, P. (2013): Measuring urban sprawl and its drivers in large Chinese cities: The case of Hangzhou. Land Use Policy, 31: 358–370.
Please cite this article as:
ZÉVL, J.-J., OUŘEDNÍČEK, M. (2021): Measuring the morphology of suburban settlements: Scale-dependent ambiguities of residential density development in the Prague Urban Region. Moravian Geographical Reports, 29(1): 27–38. Doi: https://doi.org/10.2478/mgr-2021-0003

MORAVIAN GEOGRAPHICAL REPORTS 2021, 29(1)
38
MORAVIAN GEOGRAPHICAL REPORTS 2021, 29(1): 27–38
38
Appendix 1: Housing types within the municipality of Jesenice
Fig. 6: Apartment house from the epoque of socialism (F), core area. The construction belongs to the average category of density (17.1 – 22.0m)Photo: Jiří-Jakub Zévl, 2019
Fig. 7: Apartment houses from 2000s (D), outer area. The lowest density, ANN above 30mPhoto: Jiří-Jakub Zévl, 2019
Fig. 8: Back-side of terraced houses from the early 2000s (C). They lie in the outer area, just next to the edge of the core area and next to a free plot. This is an extremely dense settlement, ANN below 11mPhoto: Jiří-Jakub Zévl, 2019
Fig. 9: An example of so-called entrepreneur’s baroque in Jesenice municipality (A)Photo: Martin Ouředníček, 2009
Fig. 10: Central public space of Jesenice municipality (B), core area. The above-average density, ANN 11.1-17.0mPhoto: Jiří-Jakub Zévl, 2019
Fig. 11: Commercial constructions from the 90s in the south of the town (E). The lowest category of density, ANN above 30mPhoto: Jiří-Jakub Zévl, 2019