measuring the impact of the pet trade on indonesian birds · measuring the impact of the pet trade...
TRANSCRIPT

Contributed Paper
Measuring the impact of the pet trade on Indonesianbirds
J. Berton C. Harris,1,2 ∗ Morgan W. Tingley,3 Fangyuan Hua,1 Ding Li Yong,4,5 J. Marion Adeney,6
Tien Ming Lee,1 William Marthy,7 Dewi M. Prawiradilaga,8 Cagan H. Sekercioglu,9,10 Suyadi,11
Nurul Winarni,12 and David S. Wilcove1,13
1Woodrow Wilson School of Public and International Affairs, Princeton University, Princeton, NJ 08544, U.S.A.2Rainforest Trust, 7078 Airlie Road, Warrenton, VA 20187, U.S.A.3Department of Ecology and Evolutionary Biology, University of Connecticut, Storrs, CT 06269, U.S.A.4Fenner School of Environment and Society, The Australian National University, Barry Drive, Acton, ACT 0200, Australia5South-east Asian Biodiversity Society, 504 Choa Chu Kang Street 51, 680504, Singapore6Nicholas School of the Environment, Duke University, Durham, NC 27708, U.S.A.7Wildlife Conservation Society-Indonesia Programme, Jl. Atletik No. 8, Tanah Sareal, Bogor 16161, Indonesia8Division of Zoology, Research Centre for Biology-LIPI, Jl. Raya Bogor Km 46, Cibinong Science Centre, Bogor 16911, Indonesia9Department of Biology, University of Utah, Salt Lake City, UT 84112, U.S.A.10KuzeyDoga Dernegi, Ortakapı Mah, Șehit Yusuf Cad., No 93/1, 36100 Kars, Turkey11School of Environment, University of Auckland, Aukland 1010, New Zealand12Research Center for Climate Change, Universitas Indonesia, Gd. PAU lt. 8,5. Kampus UI Depok, Depok 16422, Indonesia13Department of Ecology and Evolutionary Biology, Princeton University, Princeton, NJ 08544, U.S.A.
Abstract: The trade in wild animals involves one-third of the world’s bird species and thousands of othervertebrate species. Although a few species are imperiled as a result of the wildlife trade, the lack of fieldstudies makes it difficult to gauge how serious a threat it is to biodiversity. We used data on changes in birdabundances across space and time and information from trapper interviews to evaluate the effects of trappingwild birds for the pet trade in Sumatra, Indonesia. To analyze changes in bird abundance over time, we useddata gathered over 14 years of repeated bird surveys in a 900-ha forest in southern Sumatra. In northernSumatra, we surveyed birds along a gradient of trapping accessibility, from the edge of roads to 5 km into theforest interior. We interviewed 49 bird trappers in northern Sumatra to learn which species they targeted andhow far they went into the forest to trap. We used prices from Sumatran bird markets as a proxy for demandand, therefore, trapping pressure. Market price was a significant predictor of species declines over time insouthern Sumatra (e.g., given a market price increase of approximately $50, the log change in abundanceper year decreased by 0.06 on average). This result indicates a link between the market-based pet trade andcommunity-wide species declines. In northern Sumatra, price and change in abundance were not related toremoteness (distance from the nearest road). However, based on our field surveys, high-value species wererare or absent across this region. The median maximum distance trappers went into the forest each day was5.0 km. This suggests that trapping has depleted bird populations across our remoteness gradient. We foundthat less than half of Sumatra’s remaining forests are >5 km from a major road. Our results suggest thattrapping for the pet trade threatens birds in Sumatra. Given the popularity of pet birds across Southeast Asia,additional studies are urgently needed to determine the extent and magnitude of the threat posed by the pettrade.
Keywords: decline, overexploitation, Sumatra, trapping, wild population, wildlife trade
Medicion del Impacto del Mercado de Mascotas sobre las Aves de Indonesia
Resumen: El mercado de animales silvestres involucra a un tercio de las especies de aves del mundo y amiles de otras especies de vertebrados. Aunque algunas especies se encuentran en peligro como resultado del
∗email [email protected] submitted August 23, 2015; revised manuscript accepted March 25, 2016.
394Conservation Biology, Volume 31, No. 2, 394–405C© 2016 Society for Conservation BiologyDOI: 10.1111/cobi.12729
Harris et al. 395
mercado de vida silvestre, la falta de estudios de campo complica la estimacion de cuan seria es esta amenazapara la biodiversidad. Utilizamos datos sobre los cambios en la abundancia de aves a traves del espacio y eltiempo y la informacion de entrevistas de trampeadores para evaluar los efectos del trampeo de aves silvestrespara el mercado de mascotas en Sumatra, Indonesia. Para analizar los cambios en la abundancia de avesa lo largo del tiempo utilizamos los datos recolectados durante 14 anos de censos repetidos de aves en unbosque de 900-ha en el sur de Sumatra. En el norte de Sumatra, censamos aves a lo largo de un gradiente deaccesibilidad para el trampeo, desde las orillas de las carreteras hasta 5 km dentro del interior del bosque.Entrevistamos a 49 trampeadores de aves en el norte de Sumatra para aprender cuales especies son susobjetivos y cuan lejos se adentraron en el bosque para atraparlas. Utilizamos los precios de los mercados deaves de Sumatra como sustitutos para la demanda y, por lo tanto, de la presion de trampeo. El precio delmercado fue un pronosticador significativo de la declinacion de las especies a lo largo del tiempo en el surde Sumatra (p. ej.: dado un incremento en el precio del mercado de aproximadamente $50, el cambio en elregistro de abundancia por ano disminuyo en un promedio de 0.06). Este resultado indica una conexionentre el mercado de mascotas basado en la venta y las declinaciones de especies a nivel de la comunidad.En el norte de Sumatra, el precio y el cambio en la abundancia no estuvieron relacionados con la distanciadesde la carretera mas cercana. Sin embargo, con base en nuestros censos en el campo, las especies de altovalor fueron raras o estuvieron ausentes en esta region. La distancia maxima media que los trampeadores seadentraron en el bosque cada dıa fue de 0.5 km. Esto sugiere que el trampeo ha mermado a las poblacionesde aves a traves de nuestro gradiente de la distancia a la carretera mas cercana. Encontramos que menosde la mitad de los bosques que permanecen en Sumatra estan a >5 km de una carretera principal. Nuestrosresultados sugieren que el trampeo para el mercado de mascotas amenaza a las aves en Sumatra. Dada lapopularidad de las aves mascotas en el sureste asiatico, se necesitan urgentemente estudios adicionales paradeterminar la extension y la magnitud de la amenaza generada por el mercado de mascotas.
Palabras Clave: declinacion, mercado de vida silvestre, poblacion silvestre, sobre-explotacion, Sumatra, trampeo
Introduction
The trade in wild animals is worth billions of dollars an-nually (Wilson-Wilde 2010) and encompasses one-thirdof the world’s bird species and thousands of reptile,amphibian, mammal, and fish species (e.g., Schlaepferet al. 2005; Butchart 2008; Nijman 2010; Raghavan et al.2013). A small number of species have been added to theInternational Union for Conservation of Nature Red List ofimperiled species due to trapping for the pet trade (e.g.,Spix’s Macaw [Cyanopsitta spixii] in South America; BaliMyna [Lecopsar rothschildi], greater slow loris [Nyctice-bus coucang], and red line torpedo barb [Sahyadriadenisonii] in Asia; and radiated tortoise [Astrochelys ra-diata] in Madagascar) (Collar et al. 1992; IUCN 2015),but they constitute severe cases involving well-studiedspecies. Scientists have not assessed the impact of thepet trade on wild populations for the vast majority ofvertebrates sold in markets.
Southeast Asia is a global hotspot for the wild birdtrade; >1000 species are sold (J. B. C. H., personal ob-servation) for pets, song competitions, religious animalrelease, traditional medicine, and food (e.g., McClure &Chaiyaphun 1971; Jepson 2008; Chng et al. 2015; Su et al.2015). Indonesia is the largest importer and exporter ofwild birds in Asia (Nash 1993). Indonesian bird trappersuse mist nets, bird lime (an adhesive made from tree sap),snares, and traps baited with decoy birds to catch targetspecies (Shepherd et al. 2004), and mist nets appear tobe increasingly popular (J. B. C. H., et al., personal ob-
servation). The deep cultural roots of bird keeping inIndonesia have contributed to the country’s active birdtrade, whereas human population growth and the rise ofbird-song competitions have intensified the pressure onIndonesia’s wild birds (Jepson 2010). For example, thehighly prized Straw-headed Bulbul (Pycnonotus zeylani-cus) has been extirpated from Java, has not been seen inSumatra since 2009, and is in steep decline in IndonesianBorneo (Shepherd et al. 2013; BirdLife International 2015;Eaton et al. 2015). Many wild birds of multiple speciessold in Javan markets are now sourced from Sumatra be-cause trapping has depleted Javanese bird populations(Jepson & Ladle 2009; Shepherd 2012).
In Sumatra and Java, the ubiquity of trapping, includinginside national parks, complicates efforts to assess the im-pact of the bird trade on wild populations. Possible waysforward are to analyze time series of systematic surveydata, which are very scarce in Indonesia; study how birdabundance changes across remoteness gradients, whichcan serve as proxies for trapping intensity; and use pop-ulation models to estimate extinction risk based on anestimate of the number of birds caught and the species’life-history traits. Given the lack of high-quality demo-graphic information for virtually all Indonesia’s birds, wefocused on the first 2, field-based methods to examinethe effects of trapping on bird communities in lowlandand highland forests. We then related changes in birdabundance to species trait predictor variables to weighthe evidence for the relative effects of trapping, hunt-ing, and habitat change. We also interviewed trappers to
Conservation BiologyVolume 31, No. 2, 2017

396 Bird Declines from Pet Trade
determine how far they typically travel in searchof valuable birds and their impressions of long-termchanges in the catch rates of sought-after species. Fi-nally, we estimated how much of Sumatra’s forestsmay be safe from intensive trapping pressure. Giventhe high levels of trapping in Sumatra, we hypoth-esized that commercially valuable species would de-cline over time and as their proximity to roadsincreased.
Methods
Study Areas and Field Sampling
We studied changes in bird abundance from 1998 to2011 at the Way Canguk Research and Training Area,Bukit Barisan Selatan National Park, Lampung province,southern Sumatra (Figs. 1 & 2). The Way Canguk area isone of the few remnants of lowland forest on level terrainin Sumatra (Whitten 2000; Miettinen et al. 2011). WayCanguk consists of 900 ha of lowland forest (50-m eleva-tion and 4000-mm annual rainfall) that includes primaryforest (currently 50% of the area) and forest disturbed byfire, drought, and logging (Kinnaird & O’Brien 1998). ElNino-related drought and fires damaged approximately165 ha of forest in 1997 and 1998 (Kinnaird & O’Brien1998; Adeney et al. 2006). Understory avian insectivoreabundance is significantly lower in burned forest than inunburned forest, and open-field species have colonizedburned areas in Way Canguk (Adeney et al. 2006). WayCanguk remained fire-free until 2015, and the forest hasrecovered, although some exotic plants have invaded(Kinnaird & O’Brien 1998). The site has been subjectto trapping for the bird trade since at least the late 1990s(O’Brien & Kinnaird 1996), and trapping has continuedup to the present time despite the presence of a researchstation and national park staff. The most commonly usedtrapping methods we observed in Way Canguk were at-tracting birds to branches covered in bird lime with asong recording or a decoy bird in a cage, mist nets com-bined with decoys or recordings, and snares for catchingpheasants.
We quantified bird abundance at Way Canguk with10-min, unlimited-radius, visual, and aural point countsin 1998−2002, 2007, and 2011 (Supporting Information).Sampling for this study was restricted to unburned forestand forest that was subject to only light ground fires in1997−1998. Light fires burned dead leaf litter and dam-aged saplings slightly (leaving most with green leaves);large trees were unaffected (Adeney et al. 2006). Weincluded the lightly burned areas in our survey so that wecould increase our statistical power to detect changes inthe avifauna over time.
We sampled bird communities along remoteness gradi-ents in the Tanah Karo region of North Sumatra province(Karo, Deli Serdang, Langkat, and Dairi regencies) from
March to November 2013 (Fig. 1). We sampled 2 areas ofhumid montane forest, one near Mt. Sinabung in the northand another near Lake Toba in the south (Supporting In-formation). These montane forests are important sourcesof wild birds for the Medan markets (Shepherd et al.2004) and are therefore under heavy trapping pressure,but there are also remote forests far from roads that mayhave less trapping. In North Sumatra, we encounteredtrappers using bamboo traps with live decoys, bird limeplaced on perches near live decoys and in fruiting trees,and pheasant snares. Sampling at the northern sites wasdone before the 2014 eruption of Mt. Sinabung.
We sampled birds aurally by walking transects from0600 to 1030 in sunny or cloudy weather without wind orrain. Our transects were sections of forest trails approx-imately 400-m long separated by points spaced 300-mapart (straight line distance) (Fig. 2). Transects were sur-veyed in March and April (n = 74), June (n = 28), andNovember and December (n = 54) of 2013. We usedthe number of minutes spent walking each transect asa measure of survey effort. Transect elevation was ap-proximated by averaging the elevation of the points ateach end of each transect. Elevations sampled rangedfrom 1018 to 1875 m (average 1550 m) (SupportingInformation). Approximately 92% of transects were inold-growth forests; the remaining transects were in sec-ondary forests with large remnant trees. Open fieldswere not sampled. Remoteness was estimated by tak-ing the straight-line distance from the center of thetransect to the nearest major road (see Supporting In-formation for details). Transects ranged in remotenessfrom 0.1 to 4.9 km from the nearest road (average1.8 km). Our field sampling was done under RISTEKpermit 75/SIP/FRP/SM/III/2013. All data are archived atwww.datadryad.org (doi:10.5061/dryad.jm607).
Species Trait Data
We related changes in abundance to species traits asso-ciated with 3 potential drivers of population change: thepet trade, subsistence hunting, and habitat change. Weused market price as a proxy for demand for pets and,therefore, trapping pressure on a species (e.g., Crookeset al. 2005). Data on sale prices came from surveys in the 4markets of Medan, North Sumatra, from July to September2012 (Harris et al. 2015). Medan has the largest and mostdiverse wildlife markets in Sumatra; species are sold thatcome from across the island and the rest of Indonesia(Shepherd et al. 2004; Shepherd 2006). A group of In-donesian researchers asked sellers for bird prices duringthe market surveys (initial asking price, not negotiated)(Harris et al. 2015). When there were multiple prices fora species, we used the average price. We used body sizeas a proxy for hunting pressure, assuming that hunterswould be more likely to target large-bodied species (e.g.,Cardillo et al. 2005). Body sizes were the average body
Conservation BiologyVolume 31, No. 2, 2017
Harris et al. 397
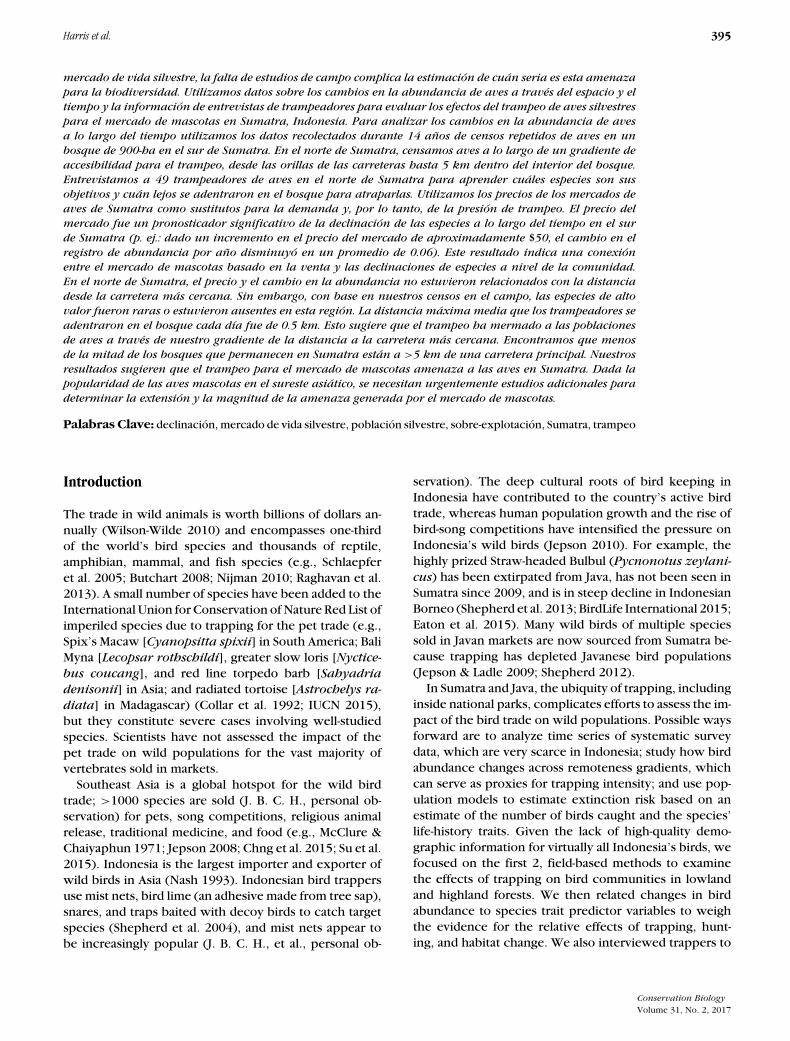
Figure 1. Locations of bird sampling sites within Sumatra (bottom left), locations of sampling sites and land cover(Miettinen et al. 2011) in northern Sumatra (main panel), and an example of a sampling transect in NorthSumatra (bottom right) (black triangle, Mt. Sinabung).
Conservation BiologyVolume 31, No. 2, 2017

398 Bird Declines from Pet Trade
Figure 2. Location of bird sampling sites and land cover (Miettinen et al. 2011) in Way Canguk, Bukit BarisanSelatan National Park, Sumatra.
Conservation BiologyVolume 31, No. 2, 2017

Harris et al. 399
mass from a global database of avian ecological traitsbased on the ornithological literature (Sekercioglu et al.2004; Sekercioglu 2012) updated with data from recentpublications (del Hoyo et al. 1992–2009). We rankedspecies tolerance of anthropogenic disturbance on a scalefrom 1 to 6. For example, species with a disturbance toler-ance of 1 were found only in the interior of primary forest,species with a score of 3 were found in both primary anddisturbed secondary forests, and species with a score of6 were nonforest species. We calculated these scores bycombining habitat characterizations from Wells (1999,2007) with the expert opinion of D.L.Y. (see SupportingInformation for details).
In North Sumatra, drongos (Dicrurus spp.) and white-eyes (Zosterops spp.) were heard commonly, but wecould not assign their calls to species. Because SumatranDrongo (D. sumatranus) and Black-capped White-eye (Z.atricapilla) were the most commonly seen members oftheir respective genera in this area, we assigned the traitvariables of those 2 species to the genus-level records.
Statistical Analyses
We used hierarchical Bayesian models to simultaneouslymodel changes in abundance over time (Way Canguk)and space (North Sumatra) for each species and to relatethese parameters to species traits to weigh the evidencefor drivers of change in abundance (Gelman et al. 2013).We limited analyses to the set of species for which we hadcomplete data on these traits and excluded species with-out price data (i.e., species which we did not find for salein the Medan markets). We did not assume that specieswithout price data had zero value because prices werederived from current markets, and there are many reasonswhy species with no price data may not be present incurrent markets (e.g., supply or demand).
For both Way Canguk and North Sumatra, we modeledthe expected change, μ, in log-abundance over time (orchange in abundance with distance from road; parame-ter β1) for species i as a linear function of 3 variablesrepresenting distinct hypotheses:
μβ1,i = α0 + α1pricei + α2disturbance tolerancei
+α3body sizei , (1)
where α is a slope parameter. For both sites, we in-ferred the strength of each hypothesized driver of changeby evaluating the sign, effect size, and 95th percentileBayesian credible interval (BCI) of each of the slope pa-rameters ((1)–3). All 3 variables were standardized to anSD 1 prior to modeling so that effect sizes would bedirectly comparable.
Although the general model structure and basis of infer-ence is the same across the 2 locations, due to differencesin data collection and other study-specific factors, the2 models were parameterized slightly differently. For
example, we controlled for transect elevation in NorthSumatra in our estimates of μβ1,i because sites therespanned a montane gradient and bird abundance in In-donesia is related to elevation (e.g., Harris et al. 2014).The overall Bayesian model structure and the differ-ences between the 2 models are described in SupportingInformation.
To evaluate our statistical power to detect a trappingeffect, we did 2 retrospective (a posteriori) power analy-ses. These analyses explored the probability of rejectingthe null hypothesis that there is no relationship betweenmarket price and either temporal or spatial trends in birdabundance (H0: α1 = 0) for Way Canguk and North Suma-tra, respectively. In both cases, we used the posteriormeans for all other hyperparameters (α0, α2, α3, and σα)and a range of values for α1 in order to probabilisticallysimulate trends, μβ1,i, for each of the species in both datasets. In both cases, we simulated 5000 sets of μβ1,i foreach of 25 potential values of α1, ranging from –0.01 to–0.25. We then ran a linear model (identical in parame-terization to the formal analysis) on each simulated set ofμβ1,i to determine the proportion of simulations whereH0 would be rejected by finding a 95% credible interval(CI) of α1 that did not include 0.
Trapper Interviews
Between March and July 2013, we interviewed 49 birdtrappers in 21 villages in the Karo, Deli Serdang, andLangkat regencies of North Sumatra province. Trappersranged in age from 24 to 61 years (average 39 years;see Supporting Information for details, including theinterview questions). Interview methods were approvedby the Princeton University Institutional Review Board forHuman Subjects research, protocol #6161 (https://www.princeton.edu/ria/human-research-protection/commit-tee-information/). We asked trappers which speciesthey seek, how much time they spend trapping them,and how much area they cover when looking for birdseach day. We used this information to approximate theproportion of Sumatra’s forests that is out of reach of theaverage bird trapper and to examine changes in catch ofsought-after species over time.
We asked each trapper to specify how many kilome-ters they covered each day in search of birds to approxi-mate how far from villages or roads trappers go to catchbirds. Based on their reported distances and our ownobservations of trapping in the field (e.g., bird snaresand perches with bird lime remnants), we estimated thepercentage of Sumatra’s forests that was out of reach ofan average trapper. We did this by comparing the areaof mature forest (lowland, montane, peat swamp, andmangroves) (Miettinen et al. 2011) near primary roads(Peta Dasar Indonesia road layers [Supporting Informa-tion]) and away from roads in ArcGIS version 10 (ESRI,Redlands, California). Given that our database included
Conservation BiologyVolume 31, No. 2, 2017

400 Bird Declines from Pet Trade
only relatively major roads, our estimate of untrappedhabitat is conservative.
We asked all 49 trappers to rank bird species based ontheir perceptions of the birds’ sensitivity to trapping (i.e.,vulnerability to population decline from trapping). Weasked trappers to consider whether a particular speciesis easy to deplete based on how easy a species is to catchand the ability of the species’ population to recover fromexploitation. We then analyzed the cases of the 4 mostvulnerable species that occur (or once occurred) in themontane forests we sampled in North Sumatra to see ifthe time spent searching for and catching these specieshad changed over time. To gather data on these tem-poral trends, we conducted in-depth interviews with 7experienced trappers (all men with a mean of 15 yearstrapping experience). We began this section of the ques-tionnaire by showing the trappers’ photographs of 54regularly traded species (selected by reviewing the nativebirds that are most commonly traded in Medan [Shepherdet al. 2004; Harris et al. 2015; Supporting Information]).If a trapper acknowledged catching the species in thephotograph, then we asked him how long he spendssearching for each species, how many he catches perday, and how these variables have changed over time.We used Gaussian mixed-effect models to test for sta-tistical relationships between year and amount of timespent trapping and year and number of birds caught inthe lme4 package in R (Bates et al. 2014; R DevelopmentCore Team 2015). We coded each trapper as a random in-tercept because trappers differed in their habits and theirresponses cannot be considered independent. We usedNakagawa and Schielzeth’s (2013) method of calculatingmarginal and conditional R2 of the mixed models.
Results
Bird Abundance
We recorded 154 species in Way Canguk, 78 of which hadprice data and were included in the analysis (hereaftertraded birds). Based on posterior means of annual trendsin abundance, 33 species of traded birds showed tempo-ral trends in abundance (95% BCI for trends that did notinclude 0). Of these species, 23 species increased in abun-dance over time and 10 decreased in abundance (Sup-porting Information). Current market price and trendsof species over time were significantly related; specieswith higher prices were more likely to decline over time(95% BCI on α1 –0.10 to –0.03). This effect size indicatedthat given a market price increase of approximately $50(527,706 Indonesian Rupiah), the log-change in abun-dance per year decreased by 0.03–0.10. Thus, above amarket price of 500,000 Indonesian Rupiah (approxi-mately $50 US), species were more likely to have declinedfrom 1998 to 2011 than to have increased (Fig. 3). Abun-
dance trends of trapped birds at Way Canguk also showedthe effects of forest succession; forest-dwelling speciesintolerant of disturbance increased over time (95% BCIon α2 –0.10 to –0.03) (Table 1 & Fig. 3). The standardizedeffect size of price and habitat preference was approxi-mately equal. There was no consistent evidence for a rela-tionship between body size and population trend (weaknegative relationship, 95% BCI on α3 –0.05 to 0.02).
In North Sumatra, we recorded 70 bird species, ofwhich 27 were traded and thus used in the analysis.Relationships between price, disturbance tolerance, orbody size and bird abundance along the remoteness gra-dients were not significant (all 95% BCI overlapped 0)(Table 1 & Fig. 4). There was a nonsignificant trendof larger bodied species being commoner away fromroads than near roads (95% BCI –0.07 to 0.23). Onespecies was clearly more common away from roads:the Bronze-tailed Peacock-pheasant (Polyplectron chal-curum), which is hunted regularly (Supporting Informa-tion). Although true relationships between abundanceand remoteness were uncertain in nearly all cases, pa-rameter means indicated that most traded species (21 of27 species or 78%) (Supporting Information) were morecommon at greater distances from roads.
Both abundance models showed strong posterior pre-dictive abilities, indicating good model fit (SupportingInformation), but the data provided relatively low powerto reject the null hypothesis that there is no relation-ship between market price and either spatial or temporaltrends in bird abundance. For Way Canguk, where ourempirical findings rejected the null hypothesis, a stan-dardized effect size for α1 would have needed to be atleast –0.13 to reject the null hypothesis 80% of the time.Our empirical finding for Way Canguk was an effect sizeof –0.064, at which point simulations rejected the nullhypothesis only 31.8% of the time (Supporting Informa-tion). In North Sumatra, where our empirical findings didnot reject the null hypothesis, a standardized effect sizefor α1 would have needed to be –0.20 or more extreme toreject the null hypothesis 80% of the time. Our empiricalfinding for North Sumatra had an effect size of –0.090, atwhich point the null hypothesis was rejected 24% of thetime in simulations (Supporting Information). The lowerpower for North Sumatra can be attributed to the lowernumber of traded species providing inference on trends.
Trapper Interviews and Spatial Analysis
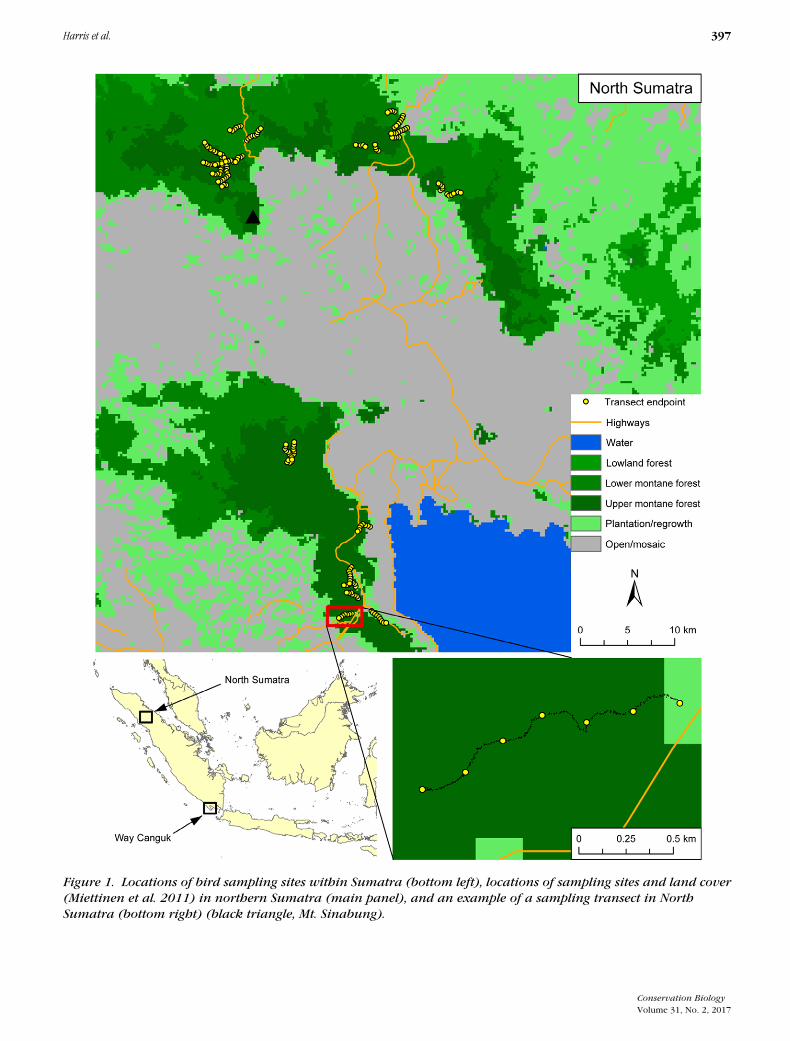
The median maximum distance covered by trappers insearch of birds was 5 km (mean 7.7 km; 25 trappers pro-vided distance estimates). We also observed evidence oftrapping (human-made perches with bird lime remnants)up to 4.9 km from the nearest road. Our spatial analysisshowed that 47.6% of Sumatra’s remaining mature forestsare within 5 km of a major road (Fig. 5).
Conservation BiologyVolume 31, No. 2, 2017

Harris et al. 401
2,500,0001,500,000500,0000
−0.6
−0.4
−0.2
0.0
0.2
0.4
0.6
Current market price (IDR)
Year
ly tr
end
( β1 i
)
1 2 3 4 5 6
−0.6
−0.4
−0.2
0.0
0.2
0.4
0.6
Disturbance tolerance
Year
ly tr
end
()
20 40 60 80 100 120
−0.6
−0.4
−0.2
0.0
0.2
0.4
0.6
Body size (cm)
Year
ly tr
end
()
* *
β1 i
β1 i
Figure 3. Relationships between bird price, disturbance tolerance, and body size and changes in abundance overtime in Way Canguk, Sumatra (∗, significant slopes as evidenced by 95% BCI that do not overlap 0; dashed lines,95% credible intervals for the linear trend).
Table 1. Estimates of relative effects of price, disturbance tolerance, and body size (α parameters) on changes in bird communities over time inWay Canguk, Sumatra, and along remoteness gradients in northern Sumatra.
Parameter Mean (95% credible interval) SD
Way Canguka
intercept 0.256 (0.149–0.367) 0.056priceb –0.064 (–0.103 to –0.026) 0.02disturbanceb –0.063 (–0.101 to –0.028) 0.019body size –0.013 (–0.048 to 0.021) 0.017Northern Sumatrac
intercept 0.052 (–0.071 to 0.168) 0.06price –0.090 (–0.288 to 0.084) 0.092disturbance –0.070 (–0.244 to 0.103) 0.088body size 0.083 (–0.066 to 0.231) 0.076
aLowland forest, southern Sumatra.bParameters with credible intervals around the coefficient estimates that do not cross 0.cMontane forest.
●
●
●
●●
●
●
●
●●
●
●●
●●●
●
●●
●
●
●
●
●● ●●
−1.0
−0.5
0.0
0.5
1.0
Current market price (IDR)
Spa
tial t
rend
100000 300000 500000
●●
●
●
●
●
●●
●
●
●
●●●
●●●●
●●●●●
●●●●●
● ●
●●
●
●●●
●●●
●●●●●
●
●●●●●●
●
●●●
●●●
●●●●●
● ●
●
●●
●●●●
●
●●●●
●
●●●
●
●●●
●●●
●●●●●●●
●
●●●
●●●
●●●●●
●●
●
●
●
●●
●
●
●
● ●
●
●●
●●●
●
●●
●
●
●
●
●●● ●
1 2 3 4 5 6
−1.0
−0.5
0.0
0.5
1.0
Disturbance tolerance
Spa
tial t
rend
●●●●
●●●●
●
●●
●●
●●
●
●
●●
●●●●●●●●●●●●●●●●●●●●●●●●●
●●●●●●●●●●●
●
●●●●●●●●●●●●●●●●●●●●●●●●●●●●●●●●●●●●●●●●●●●●●●●●●●●●●●●●●●●●●●●●●●●●●●●●●●●●●●●●●●●●●●●●●●●●●●●●●●●●●●●●●●●●●●●●●●●●●●●●●●●●●●●●●●●●●●●●●●●●●●●●●●●●●●●●●●●●●●●●●●●●●●●●●●●●●●●●●●●●●●●●●●●●●●●●●●●●●●●●●●●●●●●●●●●●●●●●●●●●●●●●●●●●●●●●●●●●●●●●●●●●●●●●●●●●●●●●●●●●●●●●●●●●●●●●●●●●●●●●●●●●●●●●●●●●●●●●●●
●
●
●
● ●
●
●
●
●●
●
●●
●●●
●
●●
●
●
●
●
●●●●
10 20 30 40
−1.0
−0.5
0.0
0.5
1.0
Body size (cm)
Spa
tial t
rend
●
●●●●●
●●
●
● ●
●
●●●
●
●
●●
●●
● ●●
●
●
●●
●●
●
●●
●
●
●
●●●●
●
●●●●●●
( β1 i
)
( β1 i
)
( β1 i
)
Figure 4. Relationships between bird price, disturbance tolerance, and body size and changes in bird abundancealong remoteness gradients (distance from the nearest road) in northern Sumatra (dashed lines, 95% credibleintervals for the linear trend). The y-axis shows the coefficient of the abundance to remoteness relationship. Therewere no significant relationships.
Conservation BiologyVolume 31, No. 2, 2017
402 Bird Declines from Pet Trade
Forest within 5 km of a road
Forest greater than 5 km from a road
0 200 400100 km
Figure 5. Sumatran forest cover in 2010 (darkest shade, forests >5 km from a road, 110,647 km2 in area; lightestshade, forests within 5 km of a road, 52,622 km2 in area).
Trappers caught 51 bird species and ranked, indescending order from extremely sensitive to highlysensitive, the following species as especially sensi-tive to trapping (i.e., vulnerable to population de-cline): White-rumped Shama (Copsychus malabaricus),Oriental Magpie Robin (C. saularis), Common GreenMagpie (Cissa chinensis), Silver-eared Mesia (Leiothrixargentauris), Sumatran Laughingthrush (Garrulax bi-color), and Chestnut-capped Laughingthrush (G. mi-tratus). Based on our field work and the trapper in-terviews, 4 of these species occur or once occurred(before heavy trapping) in the montane forests wesampled in North Sumatra: Silver-eared Mesia, Com-
mon Green Magpie, and Sumatran and Chestnut-cappedLaughingthrushes.
In-depth interviews revealed that experienced trappersare now spending more time searching for all 4 sensitivespecies than they did in the 1970s and 1980s (SupportingInformation). Furthermore, daily catches of Silver-earedMesia (which was once caught in large numbers accord-ing to trappers) have fallen to nearly 0 birds taken per day(only one trapper reported catching this species in 2013),and catches of the other 3 species showed nonsignificantnegative trends (Supporting Information). We did not ob-serve Silver-eared Mesias or Sumatran Laughingthrushesin any of our surveys.
Conservation BiologyVolume 31, No. 2, 2017

Harris et al. 403
Discussion
The most frequently cited threats to Southeast Asian birdsare habitat loss and hunting for food (BirdLife Interna-tional 2008; Wilcove et al. 2013). Here, we present mul-tiple lines of evidence that indicate trapping for the pettrade is causing declines in populations of multiple Suma-tran birds. In Way Canguk (southern Sumatra), we founda strong negative relationship between market price andpopulation trend, which suggests that trapping is con-tributing to the decadal-scale declines of multiple species.
Tolerance to anthropogenic habitat disturbance wasalso a significant predictor of change in bird abundance inWay Canguk, where forest-dependent species tended toincrease over time and open-field species decreased. Weattribute these changes to recovery of the forest after the1997 and 1998 fires. It is also possible that trapping con-tributed to declines in sought-after open-country species(e.g., Bar-winged Prinia [Prinia familiaris]); the relativeimportance of trapping and habitat change was probablyrelated to the species’ market value and life history. Fur-thermore, some forest-dwelling species that are heavilytrapped declined significantly (e.g., White-rumped Shamaand Blue-crowned Hanging-parrot [Loriculus galgulus]),which implicates trapping. The declines of sought-afterspecies, regardless of habitat, indicated that changes inthe avifauna at Way Canguk did not result only fromforest regeneration. And, the lack of a relationship be-tween body size and change in abundance suggests thathunting for food is not likely driving bird declines inthe area. Population models could be used to delve intothe life-history drivers underlying the population trendswe observed, perhaps with the use of demographic datafrom related, well-known species as a proxy for Suma-tra’s poorly known species (e.g., Brook et al. 2002). Ademographic modeling framework could then be usedto test future conservation scenarios (e.g., increased en-forcement or increased demand for certain species).
In North Sumatra, there were no clear relationshipsbetween any of our predictor variables and changes inabundance along the remoteness gradient. The lack of aprice relationship may indicate that trapping is not affect-ing bird populations in the area. However, we posit thattrapping has already depleted the bird community withinall the forests we surveyed and we were thus unableto detect a price effect. Our reasons for this conclusionare 4-fold. First, trapping occurs regularly out to 5 kmin our study area (based on trapper interviews and di-rect observations during our surveys). Second, 21 of our27 study species, all of which are traded, had positive(albeit weak) relationships between distance from roadand abundance. Third, 2 of the most coveted species—Silver-eared Mesia and Sumatran Laughingthrush—wereonce caught in large numbers in our study area (up to30 birds/day), according to trapper interviews, but are
now caught rarely. Finally, we did not encounter eitherof these species in our field surveys.
Our interview results indicated that trappers are spend-ing more time searching for prized species in NorthSumatra than they used to. Despite this increase in ef-fort, the current catch of Silver-eared Mesia is near 0,and catches of the other 3 sensitive species are eitherstable or decreasing over time. This apparent decreasein catch per unit effort (for some species at least) is in-dicative of overharvesting (Baum et al. 2003; McNamaraet al. 2015), which further supports the argument thatbird populations have been affected by trapping in allof our field sites in North Sumatra. Indeed, our resultsindicate that the bird trade may be so pervasive in partsof Indonesia that ecologists and managers need to bealert to shifting-baseline syndrome caused by trapping(Papworth et al. 2009). If we had not found that trap-pers seek birds at least 5 km inside the forest and thatthe catch of sensitive species had decreased over time,we might have concluded that bird populations wereunaffected by trapping in North Sumatra. Our trapperinterview data could be subject to the shifting-baselinesyndrome because trapping has gone on for so long inSumatra. For example, van Marle and Voous noted thatthe Common Hill Myna Gracula religiosa was already indecline from trapping by 1988 (van Marle & Voous 1988).
By 2010, 30% of Sumatra’s original forest cover re-mained (Margono et al. 2012). This alone constitutes athreat to many birds. However, our finding that 47.5%of the remaining forests are within 5 km of a majorroad, combined with the trapping impacts we detected,suggests that some of Sumatra’s birds are in far greaterdanger than habitat-loss statistics alone would suggest.The actual extent of trapping in Sumatra’s forests is likelyhigher than we found because our road data sets ex-cluded most small roads, which provide trappers withaccess to forest birds. In addition, tropical forest firesare much more likely to occur near roads (Adeney et al.2009), and Indonesian fires threaten biodiversity and con-tribute to climate change (Adeney et al. 2006; Lohmanet al. 2007). Predicted increases in road development intropical countries (Laurance et al. 2014) raise the alarm-ing prospect that both trappers’ access to forests and firerisk will continue to increase in the future.
Our results must be interpreted cautiously. It is pos-sible that birds are declining for reasons unrelated totrapping (or hunting or habitat loss) and that their grow-ing scarcity is driving up their prices in the markets. Weassumed that price was an adequate proxy of demand forthe various uses of wild birds in Indonesia and, therefore,of trapping pressure and that bird-trapper behavior inNorth Sumatra is reflective of trappers across Sumatra.Our historical trapper-interview data may be subject toa retrospective bias that could have led to overestimatesof bird declines (e.g., O’Donnell et al. 2010). Finally, our
Conservation BiologyVolume 31, No. 2, 2017
404 Bird Declines from Pet Trade
data provided relatively low power to detect a trappingeffect in either data set.
Despite these caveats, our results highlight the urgentneed for increased enforcement of trapping regulations inIndonesian protected areas. The trappers we interviewedreadily stated that they often caught birds in nationalparks and that they rarely or never encountered parkrangers.
Trapping for the pet trade occurs around the globe andinvolves many taxonomic groups (e.g., BirdLife Interna-tional 2008; Rhyne et al. 2012; Bush et al. 2014). Ourresults suggest that, in Sumatra at least, trapping can havesubstantial effects on wild bird populations beyond thehandful of species already recognized as imperiled by it.Unlike habitat loss, the impact of the pet trade cannot beseen via remote sensing and it is not visible through casualfieldwork. But, a growing body of evidence suggests thepet trade now poses a major, quiet threat to biodiversityin Indonesia and perhaps across Southeast Asia. We fer-vently hope that more conservation scientists will turntheir attention to the pet trade to increase understandingof how widespread and serious a threat it is.
Acknowledgments
We are grateful to M. Iqbal, M. Nusalawo, D. D. Putra,and E. Yustikasari for collecting bird abundance data. D.Arfianto, D. Hikmatullah, C. A. Putra, and R. Sembiringassisted with trapper interviews. We thank Giyanto andD. Hikmatullah for assistance with price data. We thank E.Brush and T. Shawa for technical advice. We are gratefulto S. Delean and M. Hooten for statistical advice, andstatistical training was obtained under NSF award DEB1145200. We thank T. Busina, C. Chang, K. Darras, T.O’Brien, T. Ouhel, and the Wilcove lab group for use-ful discussions. Three anonymous reviewers gave helpfulcomments on the manuscript. RISTEK issued a permit forthis research (075/SIP/FRP/SM/III/2013). Lembaga IlmuPengetahuan Indonesia provided access to the Badan In-formasi Geospatial road layer and was the official researchsponsor. Funding was provided by the High MeadowsFoundation.
Supporting Information
Methodological details on bird sampling, remoteness es-timation, trapper interviews, and statistical analysis (Ap-pendix S1); sampling localities in Way Canguk (AppendixS2); sampling localities in North Sumatra (Appendix S3);trapper interview questions (Appendix S4); bird speciesshown to trappers (Appendix S5); JAGS Bayesian model-ing code for Way Canguk and North Sumatra (AppendixS6); species-specific parameter estimates for Way Can-guk (Appendix S7); species-specific parameter estimates
for North Sumatra (Appendix S8); variance parametersfrom Bayesian models (Appendix S9); statistical tests ofthe changes in hours walked by trappers in search ofsensitive species and numbers of birds trapped per day(Appendix S10); goodness-of-fit plots for Bayesian modelsfor Way Canguk (Appendix S11) and North Sumatra (Ap-pendix S12); number of birds caught per day by trapperswhen searching for sensitive species (Appendix S13);time spent by trappers searching for sensitive species(Appendix S14); and power analyses for Way Canguk(Appendix S15) and North Sumatra (Appendix S16) areavailable online. The authors are solely responsible forthe content and functionality of these materials. Queries(other than absence of the material) should be directedto the corresponding author.
Literature Cited
Adeney JM, Christensen NL, Pimm SL. 2009. Reserves protect againstdeforestation fires in the Amazon. PLOS ONE 4 (e5014) DOI:10.1371/journal.pone.0005014.
Adeney JM, Ginsberg JR, Russell GJ, Kinnaird MF. 2006. Effects of anENSO-related fire on birds of a lowland tropical forest in Sumatra.Animal Conservation 9:292–301.
Bates D, Maechler M, Bolker B, Walker S. 2014. lme4: linear mixed-effects models using Eigen and S4. R package. Version1.1-7. R Foun-dation for Statistical Computing, Vienna.
Baum JK, Myers RA, Kehler DG, Worm B, Harley SJ, Doherty PA. 2003.Collapse and conservation of shark populations in the NorthwestAtlantic. Science 299:389–392.
BirdLife International. 2008. State of the world’s birds: indicators forour changing world. BirdLife International, Cambridge, United King-dom.
BirdLife International. 2015. BirdLife International data zone.Birdlife International, Cambridge, United Kingdom. Available fromhttp://www.birdlife.org/datazone.html (accessed February 2015).
Brook BW, Burgman MA, Akcakaya HR, O’Grady JJ, Frankham R. 2002.Critiques of PVA ask the wrong questions: throwing the heuris-tic baby out with the numerical bath water. Conservation Biology16:262–263.
Bush ER, Baker SE, Macdonald DW. 2014. Global trade in exotic pets2006–2012. Conservation Biology 28:663–676.
Butchart SHM. 2008. Red List Indices to measure the sustainability ofspecies use and impacts of invasive alien species. Bird ConservationInternational 18:S245–S262.
Cardillo M, Mace GM, Jones KE, Bielby J, Bininda-Emonds ORP, SechrestW, Orme CDL, Purvis A. 2005. Multiple causes of high extinctionrisk in large mammal species. Science 309:1239–1241.
Chng SCL, Eaton JA, Krishnasamy K, Shepherd CR, Nijman V. 2015. Inthe market for extinction: an inventory of Jakarta’s bird markets.TRAFFIC, Petaling Jaya, Selangor, Malaysia.
Collar N, Gonzaga L, Krabbe N, Madrono Nieto A, Naranjo L, Parker IIIT, Wege D. 1992. Threatened birds of the Americas: the ICBP/IUCNRed Data book. International Council for Bird Preservation, Cam-bridge, United Kingdom.
Crookes D, Ankudey N, Milner-Gulland EJ. 2005. The value of a long-term bushmeat market dataset as an indicator of system dynamics.Environmental Conservation 32:333–339.
del Hoyo J, Elliot A, Sargatal J, Christie DA. 1992–2009. Hand-book of the birds of the world. Vols. 1–14. Lynx Edicions,Barcelona.
Eaton JA, Shepherd CR, Rheindt FE, Harris JBC, van Balen SB, WilcoveDS, Collar NJ. 2015. Trade-driven extinctions and near-extinctionsof avian taxa in Sundaic Indonesia. Forktail 31:1–12.
Conservation BiologyVolume 31, No. 2, 2017

Harris et al. 405
Gelman A, Carlin JB, Stern HS, Dunson DB, Vehtari A, Rubin DB. 2013.Bayesian data analysis. CRC Press, Boca Raton, Florida.
Harris JBC, Green JMH, Prawiradilaga DM, Giam X, Giyanto, Hikmatul-lah D, Putra CA, Wilcove DS. 2015. Using market data and expertopinion to identify overexploited species in the wild bird trade.Biological Conservation 187:51–60.
Harris JBC, Putra DD, Gregory SD, Brook BW, Prawiradilaga DM,Sodhi NS, Wei D, Fordham DA. 2014. Rapid deforestation threat-ens mid-elevational endemic birds but climate change is most im-portant at higher elevations. Diversity and Distributions 20:773–785.
IUCN (International Union for Conservation of Nature). 2015. IUCN RedList of threatened species. Version 2015.1. IUCN, Gland, Switzer-land.
Jepson P. 2008. Orange-headed Thrush Zoothera citrina and the avianX-factor. Birding Asia 9:58–60.
Jepson P. 2010. Towards an Indonesian bird conservation ethos: re-flections from a study of bird-keeping in the cites of Java and Bali.Ethno-ornithology: birds, indigenous peoples, culture and society.Earthscan, London.
Jepson P, Ladle RJ. 2009. Governing bird-keeping in Java and Bali: evi-dence from a household survey. Oryx 43:364–374.
Kinnaird MF, O’Brien TG. 1998. Ecological effects of wildfire on lowlandrainforest in Sumatra. Conservation Biology 12:954–956.
Laurance WF, Clements GR, Sloan S, O’Connell CS, Mueller ND, GoosemM, Venter O, Edwards DP, Phalan B, Balmford A. 2014. A globalstrategy for road building. Nature 513:229–232.
Lohman DJ, Bickford D, Sodhi NS. 2007. The burning issue. Science316:376.
Margono BA, Turubanova S, Zhuravleva I, Potapov P, Tyukavina A,Baccini A, Goetz S, Hansen MC. 2012. Mapping and monitoringdeforestation and forest degradation in Sumatra (Indonesia) usingLandsat time series data sets from 1990 to 2010. EnvironmentalResearch Letters 7:034010.
McClure HE, Chaiyaphun S. 1971. The sale of birds at the Bangkok "Sun-day market" Thailand. Natural History Bulletin of the Siam Society24:41–78.
McNamara J, Kusimi JM, Rowcliffe JM, Cowlishaw G, Brenyah A, Milner-Gulland EJ. 2015. Long-term spatio-temporal changes in a WestAfrican bushmeat trade system. Conservation Biology 29:1446–1457.
Miettinen J, Shi C, Liew SC. 2011. Deforestation rates in insular South-east Asia between 2000 and 2010. Global Change Biology 17:2261–2270.
Nakagawa S, Schielzeth H. 2013. A general and simple method forobtaining R2 from generalized linear mixed-effects models. Methodsin Ecology and Evolution 4:133–142.
Nash SV. 1993. The trade in Southeast Asian non-CITES birds. TRAFFICSoutheast Asia, Cambridge, United Kingdom.
Nijman V. 2010. An overview of international wildlife trade from South-east Asia. Biodiversity and Conservation 19:1101–1114.
O’Brien TG, Kinnaird MF. 1996. Birds and mammals of the Bukit BarisanSelatan National Park, Sumatra, Indonesia. Oryx 30:207–217.
O’Donnell KP, Pajaro MG, Vincent ACJ. 2010. How does the accuracyof fisher knowledge affect seahorse conservation status? AnimalConservation 13:526–533.
Papworth S, Rist J, Coad L, Milner-Gulland EJ. 2009. Evidence for shiftingbaseline syndrome in conservation. Conservation Letters 2:93–100.
R Development Core Team. 2015. R: a language and environment forstatistical computing. R Foundation for Statistical Computing, Vi-enna.
Raghavan R, Dahanukar N, Tlusty MF, Rhyne AL, Kumar KK, Molur S,Rosser A. 2013. Uncovering an obscure trade: threatened freshwa-ter fishes and the aquarium pet markets. Biological Conservation164:158–169.
Rhyne AL, Tlusty MF, Schofield PJ, Kaufman L, Morris JA, Jr., BrucknerAW. 2012. Revealing the appetite of the marine aquarium fish trade:the volume and biodiversity of fish imported into the United States.PLOS ONE 7 (e35808) DOI: 10.1371/journal.pone.0035808.
Schlaepfer MA, Hoover C, Dodd CK. 2005. Challenges in evaluating theimpact of the trade in amphibians and reptiles on wild populations.BioScience 55:256–264.
Sekercioglu CH. 2012. Bird functional diversity and ecosystem servicesin tropical forests, agroforests and agricultural areas. Journal of Or-nithology 153:153–161.
Sekercioglu CH, Daily GC, Ehrlich PR. 2004. Ecosystem consequencesof bird declines. Proceedings of the National Academy of Sciencesof the United States of America 101:18042–18047.
Shepherd CR. 2006. The bird trade in Medan, north Sumatra: anoverview. Birding Asia 5:16–24.
Shepherd CR. 2012. The owl trade in Jakarta, Indonesia: a spot checkon the largest bird markets. Birding Asia 18:58–59.
Shepherd CR, Shepherd LA, Foley K-E. 2013. Straw-headed bulbul Py-cnonotus zeylanicus: legal protection and enforcement action inMalaysia. Birding Asia 19:92–94.
Shepherd CR, Sukumaran J, Wich SA. 2004. Open season: an analysisof the pet trade in Medan, Sumatra 1997–2001. TRAFFIC SoutheastAsia, Petaling Jaya, Selangor, Malaysia.
Su S, Cassey P, Vall-llosera M, Blackburn TM. 2015. Going cheap: deter-minants of bird price in the Taiwanese pet market. PLOS ONE 10(e0127482) DOI: 10.1371/journal.pone.0127482.
van Marle JG, Voous KH. 1988. The birds of Sumatra: an annotatedcheck-list. British Ornithologists’ Union, Tring.
Wells DR. 1999, 2007. The birds of the Thai-Malay peninsula. Volumes1, 2. Academic Press, San Diego, California, and Christopher Helm,London.
Whitten T. 2000. The ecology of Sumatra. Tuttle Publishing, Singapore.Wilcove DS, Giam X, Edwards DP, Fisher B, Koh LP. 2013. Navjot’s
nightmare revisited: logging, agriculture, and biodiversity in South-east Asia. Trends in Ecology & Evolution 28:531–540.
Wilson-Wilde L. 2010. Wildlife crime: a global problem. Forensic Sci-ence, Medicine, and Pathology 6:221–222.
Conservation BiologyVolume 31, No. 2, 2017

Supporting Information
Appendix S1--Detailed Methods
Way Canguk bird sampling schedule
At Way Canguk each point sampled in a year was at least 200 m from the closest adjacent point.
From 1998-2002 17 unburned and lightly burned points were visited 20-23 times each. All
months were sampled and repeat counts were done at least one month after the previous count. In
2007 the same 17 points were visited at monthly intervals from January until June (Yustikasari
2008). In 2011 nearby points were sampled with the same methods in March and July (85 points
total; Fig. 2; Table S1). We provide locations of sampling sites in Tables S1-2 to promote re-
sampling. The full dataset will be archived at www.datadryad.org.
Estimating remoteness of North Sumatra transects
Remoteness was estimated by taking the straight line distance from the center of the transect to
the nearest road in Google Earth Pro. Google Earth Pro enabled us to combine several road
layers with recent satellite images. The combined road layers lined up with roads that were
visible in satellite images, but the layers did not provide complete coverage of all roads in the
satellite images. The road layers included three datasets of primary roads (major paved roads)
from the Indonesian base map (Peta Dasar Indonesia; produced by the World Resources Institute
and the Indonesian Ministry of Forestry; www.arcgis.com) and smaller regional roads in North
Sumatra from Badan Informasi Geospatial (www.bakosurtanal.go.id). It was impossible to
measure the exact remoteness (walking distance from the transect to the nearest road) because
multiple small (and unmapped) trails were present at each sampling site.
Initiation of trapper interviews
Interviews were led by Indonesian research assistants. Trappers were selected opportunistically
via introductions from acquaintances of the interviewers or by starting conversations with
villagers and asking to talk to bird trappers. Given domestic trapping quotas, transport permit
requirements, and regular trade of protected species, most bird trapping in Sumatra is illegal
under Indonesian law (Shepherd 2006). Nonetheless, trapping laws are rarely enforced, and the

vast majority of trappers were happy to be interviewed as long as their identity was not made
public.
Disturbance tolerance categories
We used six categories to describe species’ tolerance to anthropogenic disturbance. Category 1
species are mostly sedentary species that inhabit the interior of undisturbed forests (rarely at
edges) (e.g. Bronze-tailed Peacock-pheasant Polyplectron chalcurum). Category 2 species are
sedentary and flocking species that mostly inhabit the interior of undisturbed forests, but they are
regular near edges (e.g. Black-and-crimson Oriole Oriolus cruentus). Category 3 species include
many flocking species that inhabit the interior and edge of undisturbed and disturbed (and
secondary) forests (e.g. Black-capped White-eye Zosterops atricapilla). Category 4 species are
mostly flocking species that occasionally inhabit the forest interior, but are more frequent in
forest edges (e.g. Little Pied Flycatcher Ficedula westermanni). Category 5 species are found
primarily in forest edges and in adjacent scrub as well as in tree plantations and even in gardens
and parks (e.g. Rufous Woodpecker Micropternus brachyurus). Category 6 species are non-
forest birds (e.g. Bar-winged Prinia Prinia familiaris).
Statistical analysis details
We modeled abundances of birds at Way Canguk over time as deriving from a negative binomial
distribution, with random year-dependent dispersion parameter, Kj. We chose a year-dependent
value for K to capture the differences in observers over the years which could result in different
levels of over-dispersion. We assumed that the overall surveyed region of Way Canguk
contained an unknown, true average abundance of individuals of each species in a given year,
which we denote as lambda, and that all surveys in a year represented random samples of
lambda. Thus, species i in year j at point k has an abundance, yijk, defined as:
yijk ~ NegBin(ij, Kj)
where ij represents the average abundance at Way Canguk for species i in year j. We modeled
abundance as a log-linear function of year, such that:
log(ij) = 0,i + 1,i yearj

where the intercept was a hierarchical random variable derived from hyper-parameters for all
species, 0,i ~ Normal(0, 20), and the slope is hierarchically derived from a normal
distribution with a single hyper-parameter for variance and a species-specific mean, 1,i ~
Normal(1,i, 21).
We used a zero-inflated Poisson mixture for the North Sumatra data because of the large
quantities of zero abundances from the transect surveys. Thus, for species i on transect k:
yik ~ Poisson(ik × zik)
where lambda is the average abundance of species ion transect k, and zik is a binary indicator
variable representing the presence (zik = 1) or absence (zik = 0) of species i on transect k. We
simply modeled this zero-inflation as the function of a constant species-specific probability such
that:
zik ~ Bernoulli(pi)
where pi is drawn from a hierarchical normal distribution with mean, p,and variance, 2
p. We
modeled the mean abundance of each species in North Sumatra as a function of the distance to
the nearest road and elevation:
log(ik) = 0,i + 1,i distancek + 2,i elevationk
Both the intercept, 0,i, and slope for elevation, 2,i, for each species were drawn from
hierarchical normal distributions, while the slope for distance was hierarchically derived from a
normal distribution with a single hyper-parameter for variance and a species-specific mean, 1,i ~
Normal(1,i, 21).
As noted in the Methods, we modeled the expected change in abundance over time (or
distance from road) for species i, 1,i, as a linear function of three variables representing distinct
hypotheses:
b1,i = 0 + 1pricei + 2disturbance tolerancei + 3body sizei
Both the Way Canguk and the North Sumatra models were run individually with JAGS
(Plummer 2003) inside R version 3.2.0 (R Core Team 2015) using the package ‘rjags’ (Plummer

2015). We used vague priors in all cases due to the generally unknown nature of abundance
relationships of Sumatran avifauna. JAGS code for both models is provided in the supporting
code files. Models were run with three independent chains for 75,000 MCMC iterations. A
posterior sample was drawn from the final 20,000 iterations and thinned by 20. Convergence was
evaluated using the Gelman-Rubin diagnostic (Gelman et al. 2013), with all parameters showing
convergence with values less than 1.1 and approaching or equal to 1.0.
We independently evaluated fit of both models using posterior predictive checks on
species-specific indices. Specifically, we derived predicted data values (yijk or yik for Way
Canguk and North Sumatra) using modeled parameters for each posterior draw, and used these to
calculate the overall mean abundance (𝜆��) and standard deviation of abundance (i) for each
species. Modeled means and standard deviations of abundances were compared via 95% BCI to
observed means and standard deviations of abundance.
For Way Canguk, 95% BCI posterior predictions of mean abundance for each species
across all years overlapped with observed means for 99% of species, and posterior standard
deviations of abundance overlapped with observed for 85% of species (Fig. S1). For North
Sumatra, 95% BCI posterior predictions of mean abundance overlapped with observed means for
100% of species, and posterior standard deviations of abundance overlapped with observed for
96% of species (Fig. S2).

Appendix S2. Way Canguk sampling localities (note that most, but not all, points are
shown in Figure 1 for clarity).
Point ID Coordinates
2A_N_1 5.66082° S, 104.40218° E
2A_N_2 5.65921° S, 104.40047° E
2A_N_3 5.65729° S, 104.39913° E
2A_N_4 5.65534° S, 104.39786° E
2A_N_5 5.65357° S, 104.39649° E
2A_N_6 5.65168° S, 104.3952° E
2C_N_1 5.65993° S, 104.40347° E
2C_N_1_2 5.65983° S, 104.40346° E
2C_N_10 5.64523° S, 104.39276° E
2C_N_2 5.65833° S, 104.40244° E
2C_N_2_2 5.6578° S, 104.40223° E
2C_N_3 5.65693° S, 104.4012° E
2C_N_3_2 5.65579° S, 104.40074° E
2C_N_4 5.6553° S, 104.4001° E
2C_N_4_2 5.65378° S, 104.3996° E
2C_N_5 5.65378° S, 104.39898° E
2C_N_5_2 5.65211° S, 104.39817° E
2C_N_6 5.65224° S, 104.39783° E
2C_N_6_2 5.65017° S, 104.39691° E
2C_N_7 5.65047° S, 104.39659° E
2C_N_8 5.6489° S, 104.39538° E
2C_N_9 5.64688° S, 104.39392° E
2E_N_1 5.65889° S, 104.4048° E
2E_N_10 5.64448° S, 104.3943° E
2E_N_2 5.65723° S, 104.40374° E
2E_N_3 5.6557° S, 104.40256° E
2E_N_4 5.65412° S, 104.4014° E

2E_N_5 5.65246° S, 104.40034° E
2E_N_6 5.6509° S, 104.39896° E
2E_N_7 5.6493° S, 104.39782° E
2E_N_8 5.64764° S, 104.3966° E
2E_N_9 5.64605° S, 104.39537° E
2G_N_1 5.65757° S, 104.40618° E
2G_N_10 5.64355° S, 104.39597° E
2G_N_2 5.65603° S, 104.40484° E
2G_N_3 5.65437° S, 104.40376° E
2G_N_4 5.65284° S, 104.40271° E
2G_N_5 5.65128° S, 104.40155° E
2G_N_6 5.64974° S, 104.40038° E
2G_N_7 5.64813° S, 104.39936° E
2G_N_8 5.64667° S, 104.39831° E
2G_N_9 5.64513° S, 104.39704° E
2I_N_1 5.65716° S, 104.40718° E
2I_N_2 5.65541° S, 104.40571° E
2I_N_3 5.65328° S, 104.40484° E
2I_N_4 5.65146° S, 104.40336° E
2I_N_5 5.64978° S, 104.40201° E
2I_N_6 5.64801° S, 104.40064° E
2K_N_1 5.6551° S, 104.40907° E
2K_N_2 5.65347° S, 104.40754° E
2K_N_3 5.65173° S, 104.4062° E
2K_N_4 5.64991° S, 104.40486° E
2K_N_5 5.64801° S, 104.40365° E
2K_N_6 5.64628° S, 104.40216° E
2Z_1 5.65841° S, 104.40565° E
2Z_2 5.65698° S, 104.40413° E
2Z_3 5.65507° S, 104.40309° E
2Z_4 5.65323° S, 104.40179° E
2Z_5 5.65143° S, 104.40034° E
2Z_6 5.64961° S, 104.39912° E
E_S_1 5.65766° S, 104.41244° E
E_S_1000 5.665° S, 104.418° E
E_S_1200 5.666° S, 104.419° E
E_S_2 5.65924° S, 104.41374° E
E_S_3 5.66082° S, 104.4149° E
E_S_4 5.66261° S, 104.4161° E
E_S_5 5.66405° S, 104.41719° E
G_S_1 5.65851° S, 104.41085° E
G_S_2 5.66011° S, 104.41204° E
G_S_3 5.66169° S, 104.41327° E
G_S_4 5.66329° S, 104.4144° E
G_S_5 5.66496° S, 104.41556° E
I_S_1 5.65962° S, 104.40933° E
I_S_1000 5.673° S, 104.408° E
I_S_2 5.6611° S, 104.41053° E
I_S_3 5.66266° S, 104.4116° E
I_S_4 5.66411° S, 104.41285° E
I_S_5 5.66576° S, 104.41392° E
K_S_1 5.66071° S, 104.40796° E
K_S_1000 5.668° S, 104.413° E
K_S_1200 5.669° S, 104.414° E
K_S_2 5.66214° S, 104.4092° E
K_S_200 5.662° S, 104.409° E
K_S_3 5.6638° S, 104.41026° E
K_S_4 5.66535° S, 104.41139° E
K_S_5 5.66701° S, 104.41261° E
K_S_600 5.665° S, 104.411° E
M_S_1 5.6617° S, 104.40648° E
M_S_1000 5.669° S, 104.412° E
M_S_2 5.66323° S, 104.40763° E
M_S_3 5.66488° S, 104.4088° E
M_S_4 5.6665° S, 104.41008° E
M_S_400 5.66458924° S, 104.4087156° E
M_S_5 5.66803° S, 104.41108° E
O_S_1000 5.67002499° S, 104.41019149° E
O_S_1400 5.67297215° S, 104.41242459° E
O_S_200 5.66419839° S, 104.40618997° E
O_S_600 5.66714413° S, 104.4083193° E
Q_S_1200 5.66662252° S, 104.39897566° E
Q_S_400 5.66662252° S, 104.39897566° E
S_S_1200 5.673° S, 104.408° E
W_S_200 5.66662252° S, 104.39897566° E

Appendix S3. North Sumatra sampling localities.
transect ID starting point
coordinates
ending point
coordinates
elevation (m
above sea
level)
2.AT.4to5 3.26972° N,
98.52809° E
3.26819° N,
98.52627° E 1018
2.AT.5to6 3.26819° N,
98.52627° E
3.26876° N,
98.52403° E 1044
3.AT.6to7 3.26876° N,
98.52403° E
3.26858° N,
98.52176° E 1069
3.AT.7to8 3.26858° N,
98.52176° E
3.26742° N,
98.51961° E 1088
1.KR.1to2 3.2258° N,
98.38131° E
3.2246° N,
98.37925° E 1484
1.KR.2to3 3.2246° N,
98.37925° E
3.2243° N,
98.37695° E 1495
2.KR.3to4 3.2243° N,
98.37695° E
3.22209° N,
98.37601° E 1518
2.KR.4to5 3.22209° N,
98.37601° E
3.22033° N,
98.37444° E 1571
3.KR.5to6 3.22033° N,
98.37444° E
3.22054° N,
98.37208° E 1595
4.KR.6to7 3.22054° N,
98.37208° E
3.22155° N,
98.36994° E 1606
5.KR.9to10 3.22074° N,
98.36536° E
3.22066° N,
98.36305° E 1619
4.KR.7to8 3.22155° N,
98.36994° E
3.22098° N,
98.36768° E 1624
5.KR.8to9 3.22098° N,
98.36768° E
3.22074° N,
98.36536° E 1626
9.KR.20to21 3.23674° N,
98.34646° E
3.23865° N,
98.34521° E 1482
9.KR.19to20 3.23491° N, 3.23674° N, 1522
98.34783° E 98.34646° E
6.KR.campto14 3.22854° N,
98.3583° E
3.2291° N,
98.35733° E 1550
8.KR.18to19 3.2341° N,
98.34988° E
3.23491° N,
98.34783° E 1554
6.KR.14to15 3.2291° N,
98.35733° E
3.2299° N,
98.35521° E 1568
8.KR.17to18 3.23208° N,
98.35101° E
3.2341° N,
98.34988° E 1583
7.KR.15to16 3.2299° N,
98.35521° E
3.23127° N,
98.3532° E 1587
7.KR.16to17 3.23127° N,
98.3532° E
3.23208° N,
98.35101° E 1594
10.KR.campto22 3.22854° N,
98.3583° E
3.22791° N,
98.35972° E 1530
10.KR.22to13 3.22791° N,
98.35972° E
3.22716° N,
98.36193° E 1568
11.KR.13to12 3.22716° N,
98.36193° E
3.22489° N,
98.36171° E 1596
11.KR.12to11 3.22489° N,
98.36171° E
3.22253° N,
98.36181° E 1603
12.KR.11to23 3.22253° N,
98.36181° E
3.21895° N,
98.36142° E 1619
12.KR.10to24 3.22066° N,
98.36305° E
3.21807° N,
98.35935° E 1627
13.KR.24to25 3.21807° N,
98.35935° E
3.21853° N,
98.35714° E 1630
13.KR.25to26 3.21853° N,
98.35714° E
3.21741° N,
98.35512° E 1644
14.KR.28to29 3.24048° N,
98.38534° E
3.24254° N,
98.38669° E 1373
14.KR.29to30 3.24254° N,
98.38669° E
3.2439° N,
98.38864° E 1379
15.KR.30to31 3.2439° N,
98.38864° E
3.24515° N,
98.39068° E 1384
15.KR.31to32 3.24515° N,
98.39068° E
3.24529° N,
98.39298° E 1401
16.KR.32to33 3.24529° N,
98.39298° E
3.24649° N,
98.39495° E 1433
16.KR.33to34 3.24649° N,
98.39495° E
3.24871° N,
98.39554° E 1475
17.KR.34to35 3.24871° N,
98.39554° E
3.25065° N,
98.39693° E 1511
17.KR.35to36 3.25065° N,
98.39693° E
3.25226° N,
98.39866° E 1559
21.KR.41to42 3.24997° N,
98.37147° E
3.25067° N,
98.36927° E 1362
20.KR.40to41 3.25129° N,
98.37354° E
3.24997° N,
98.37147° E 1379
19.KR.39to40 3.2529° N,
98.37515° E
3.25129° N,
98.37354° E 1395
18.KR.37to38 3.2545° N,
98.37955° E
3.25392° N,
98.37719° E 1400
18.KR.38to39 3.25392° N,
98.37719° E
3.2529° N,
98.37515° E 1401
1.S.1tosettlement 3.23645° N,
98.48923° E
3.23773° N,
98.48933° E 1575
2.S.2to3 3.23601° N,
98.49393° E
3.23619° N,
98.49625° E 1729
2.S.3to4 3.23619° N,
98.49625° E
3.23485° N,
98.49827° E 1777
1.B.1to2 3.19313° N,
98.57009° E
3.19477° N,
98.57182° E 1358
1.B.2to3 3.19477° N,
98.57182° E
3.19703° N,
98.57168° E 1373
2.B.3to4 3.19703° N,
98.57168° E
3.19848° N,
98.56989° E 1471

2.B.4to5 3.19848° N,
98.56989° E
3.2° N,
98.56817° E 1644
5.B.11to12 3.25265° N,
98.5381° E
3.25162° N,
98.53602° E 1144
5.B.10to11 3.25329° N,
98.52614° E
3.25265° N,
98.5381° E 1235
3.B.7to8 3.18809° N,
98.57826° E
3.1888° N,
98.58044° E 1364
4.B.8to9 3.1888° N,
98.58044° E
3.19003° N,
98.58253° E 1371
4.B.9to10 3.19003° N,
98.58253° E
3.25329° N,
98.52614° E 1374
3.B.6to7 3.18931° N,
98.57629° E
3.18809° N,
98.57826° E 1388
3.S.5to6 3.23072° N,
98.51073° E
3.23207° N,
98.50875° E 1541
4.S.6to7 3.23207° N,
98.50875° E
3.2344° N,
98.50818° E 1667
5.S.7to8 3.2344° N,
98.50818° E
3.23658° N,
98.50758° E 1803
2.BB.4to5 3.26439° N,
98.53416° E
3.26216° N,
98.5336° E 1032
2.BB.5to6 3.26216° N,
98.5336° E
3.26013° N,
98.53236° E 1075
3.BB.6to7 3.26013° N,
98.53236° E
3.25806° N,
98.5312° E 1131
3.BB.7to8 3.25806° N,
98.5312° E
3.25645° N,
98.52956° E 1197
4.BB.8to9 3.25645° N,
98.52956° E
3.25473° N,
98.52794° E 1262
4.BB.9to10 3.25473° N,
98.52794° E
3.25329° N,
98.52614° E 1326
5.BB.11to12 3.25265° N,
98.5381° E
3.25162° N,
98.53602° E 1144

5.BB.12to13 3.25162° N,
98.53602° E
3.25067° N,
98.53388° E 1208
6.BB.13to14 3.25067° N,
98.53388° E
3.2498° N,
98.53173° E 1269
7.BB.14to15 3.2498° N,
98.53173° E
3.24879° N,
98.52957° E 1336
7.BB.15to16 3.24879° N,
98.52957° E
3.24774° N,
98.52748° E 1411
8.BB.16to17 3.24774° N,
98.52748° E
3.24761° N,
98.52516° E 1490
8.BB.17to18 3.24761° N,
98.52516° E
3.24735° N,
98.52286° E 1623
1.SI.14to15 2.87314° N,
98.49424° E
2.87123° N,
98.49285° E 1673
2.SI.16to17 2.86898° N,
98.49266° E
2.86754° N,
98.49088° E 1691
1.SI.15to16 2.87123° N,
98.49285° E
2.86898° N,
98.49266° E 1693
21.KR.211to212 3.21692° N,
98.36205° E
3.21746° N,
98.35985° E 1626
22.KR.213to214 3.21691° N,
98.35767° E
3.21728° N,
98.35546° E 1626
21.KR.212to213 3.21746° N,
98.35985° E
3.21691° N,
98.35767° E 1632
22.KR.214to215 3.21728° N,
98.35546° E
3.21825° N,
98.35343° E 1646
23.KR.215to216 3.21825° N,
98.35343° E
3.21776° N,
98.35034° E 1666
23.KR.216to217 3.21776° N,
98.35034° E
3.21815° N,
98.34808° E 1690
24.KR.217to218 3.21815° N,
98.34808° E
3.21929° N,
98.34614° E 1707
24.KR.218to219 3.21929° N,
98.34614° E
3.21974° N,
98.34394° E 1715

25.KR.225to226 3.19803° N,
98.36567° E
3.19832° N,
98.36343° E 1502
25.KR.226to227 3.19832° N,
98.36343° E
3.19691° N,
98.36165° E 1540
26.KR.229to230 3.213° N,
98.36038° E
3.21072° N,
98.36001° E 1552
27.KR.230to231 3.21072° N,
98.36001° E
3.20858° N,
98.35911° E 1552
27.KR.231to232 3.20858° N,
98.35911° E
3.20896° N,
98.3569° E 1563
26.KR.228to229 3.21526° N,
98.36048° E
3.213° N,
98.36038° E 1583
28.KR.232to233 3.20896° N,
98.3569° E
3.20845° N,
98.35462° E 1586
29.KR.233to234 3.20845° N,
98.35462° E
3.20914° N,
98.35243° E 1612
34.KR.2.8to2.9 3.20434° N,
98.36424° E
3.20299° N,
98.36232° E 1487
33.KR.2.7to2.8 3.20568° N,
98.36608° E
3.20434° N,
98.36424° E 1488
34.KR.2.9to2.10 3.20299° N,
98.36232° E
3.20179° N,
98.36015° E 1525
33.KR.2.6to2.7 3.20728° N,
98.36779° E
3.20568° N,
98.36608° E 1526
32.KR.2.5to2.6 3.20945° N,
98.36687° E
3.20728° N,
98.36779° E 1550
31.KR.2.4to2.5 3.21155° N,
98.36596° E
3.20945° N,
98.36687° E 1557
31.KR.2.3to2.4 3.21378° N,
98.36635° E
3.21155° N,
98.36596° E 1569
30.KR.2.2to2.3 3.21607° N,
98.36629° E
3.21378° N,
98.36635° E 1586
30.KR.2.1to2.2 3.21793° N,
98.36486° E
3.21607° N,
98.36629° E 1593

1.SB.1to2 3.24374° N,
98.53056° E
3.24373° N,
98.52829° E 1411
1.SB.2to3 3.24373° N,
98.52829° E
3.24351° N,
98.52608° E 1488
2.SB.3to4 3.24351° N,
98.52608° E
3.24356° N,
98.52384° E 1597
7.SI.37to38 2.78735° N,
98.47681° E
2.78586° N,
98.47514° E 1564
6.SI.36to37 2.78857° N,
98.47875° E
2.78735° N,
98.47681° E 1572
6.SI.35to36 2.78815° N,
98.48097° E
2.78857° N,
98.47875° E 1578
5.SI.34to35 2.78876° N,
98.48312° E
2.78815° N,
98.48097° E 1583
5.SI.33to34 2.78915° N,
98.48531° E
2.78876° N,
98.48312° E 1585
7.SI.38to39 2.78586° N,
98.47514° E
2.78494° N,
98.47307° E 1556
11.SI.8to9 2.78052° N,
98.51589° E
2.78034° N,
98.51815° E 1651
11.SI.7to8 2.7819° N,
98.51396° E
2.78052° N,
98.51589° E 1655
8.SI.1to2 2.79165° N,
98.50409° E
2.78998° N,
98.50568° E 1658
8.SI.2to3 2.78998° N,
98.50568° E
2.78869° N,
98.5077° E 1660
10.SI.6to7 2.78389° N,
98.51265° E
2.7819° N,
98.51396° E 1661
9.SI.3to4 2.78869° N,
98.5077° E
2.78741° N,
98.50969° E 1663
10.SI.5to6 2.78598° N,
98.51146° E
2.78389° N,
98.51265° E 1663
9.SI.4to5 2.78741° N,
98.50969° E
2.78598° N,
98.51146° E 1664

12.SI.26to27 2.80362° N,
98.49134° E
2.80561° N,
98.4902° E 1662
13.SI.28to29 2.80642° N,
98.48806° E
2.80716° N,
98.48593° E 1662
13.SI.29to30 2.80716° N,
98.48593° E
2.8092° N,
98.48487° E 1663
14.SI.30to31 2.8092° N,
98.48487° E
2.80887° N,
98.48255° E 1665
12.SI.27to28 2.80561° N,
98.4902° E
2.80642° N,
98.48806° E 1667
14.SI.31to32 2.80887° N,
98.48255° E
2.80917° N,
98.48039° E 1667
17.SI.47to48 2.81606° N,
98.48025° E
2.81606° N,
98.47785° E 1696
17.SI.46to47 2.81686° N,
98.48233° E
2.81606° N,
98.48025° E 1702
16.SI.45to46 2.81841° N,
98.48406° E
2.81686° N,
98.48233° E 1705
15.SI.42to43 2.81502° N,
98.48902° E
2.81721° N,
98.4882° E 1708
15.SI.43to44 2.81721° N,
98.4882° E
2.81832° N,
98.48626° E 1708
16.SI.44to45 2.81832° N,
98.48626° E
2.81841° N,
98.48406° E 1709
3.SI.11to12 2.87311° N,
98.50046° E
2.87351° N,
98.49814° E 1647
3.SI.10to11 2.87203° N,
98.50253° E
2.87311° N,
98.50046° E 1649
4.SI.12to13 2.87351° N,
98.49814° E
2.87454° N,
98.49606° E 1655
4.SI.13to14 2.87454° N,
98.49606° E
2.87314° N,
98.49424° E 1663
18.SI.18to19 2.8334° N,
98.4849° E
2.83152° N,
98.48359° E 1651

18.SI.19to20 2.83152° N,
98.48359° E
2.82932° N,
98.48275° E 1693
21.SI.past25 2.81799° N,
98.48326° E
2.81733° N,
98.48309° E 1695
21.SI.24to25 2.8202° N,
98.48365° E
2.81799° N,
98.48326° E 1700
20.SI.23to24 2.82248° N,
98.48393° E
2.8202° N,
98.48365° E 1711
19.SI.21to22 2.82699° N,
98.48333° E
2.8248° N,
98.48389° E 1720
20.SI.22to23 2.8248° N,
98.48389° E
2.82248° N,
98.48393° E 1722
19.SI.20to21 2.82932° N,
98.48275° E
2.82699° N,
98.48333° E 1723
3.SBU.6to7 2.94866° N,
98.42241° E
2.95058° N,
98.42274° E 1567
3.SBU.5to6 2.94647° N,
98.42181° E
2.94866° N,
98.42241° E 1583
2.SBU.4to5 2.94453° N,
98.42277° E
2.94647° N,
98.42181° E 1594
2.SBU.3to4 2.94346° N,
98.42483° E
2.94453° N,
98.42277° E 1607
1.SBU.2to3 2.94162° N,
98.42596° E
2.94346° N,
98.42483° E 1640
1.SBU.1to2 2.94063° N,
98.42796° E
2.94162° N,
98.42596° E 1654
4.SBU.8to9 2.9384° N,
98.42781° E
2.93625° N,
98.42825° E 1699
4.SBU.9to10 2.93625° N,
98.42825° E
2.93402° N,
98.42798° E 1766
5.SBU.10to11 2.93402° N,
98.42798° E
2.93322° N,
98.426° E 1844
6.SBU.12to13 2.93355° N,
98.42371° E
2.93553° N,
98.42487° E 1872
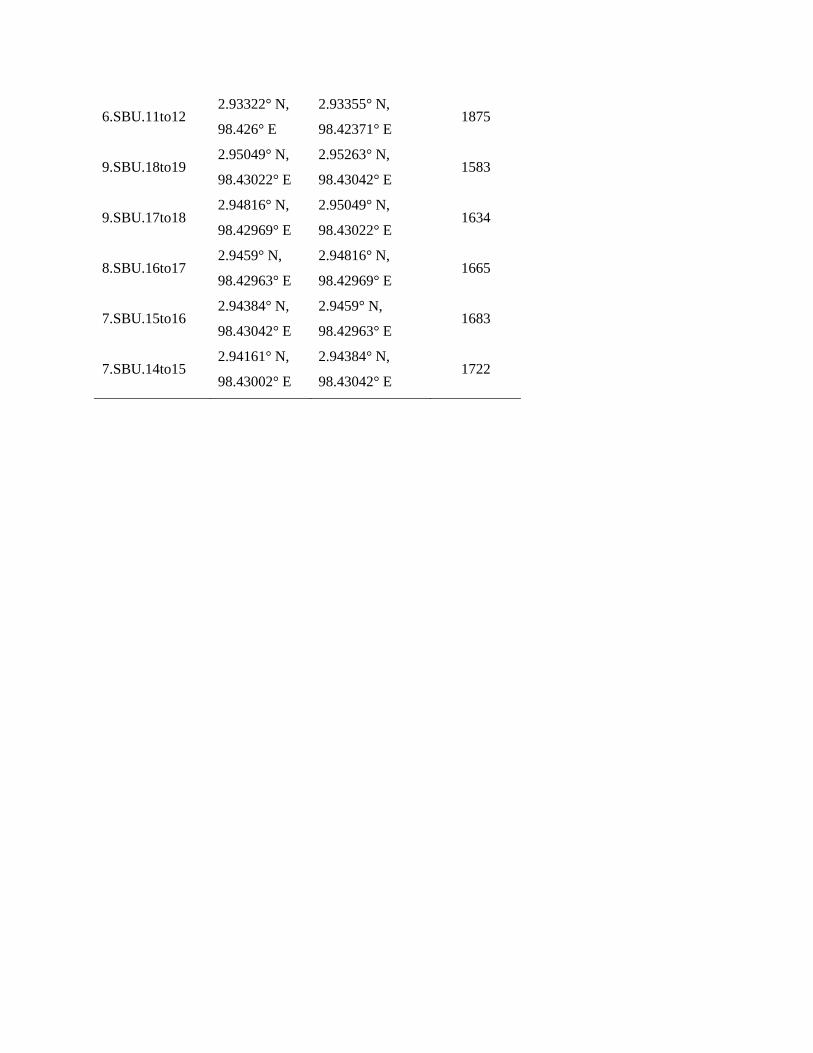
6.SBU.11to12 2.93322° N,
98.426° E
2.93355° N,
98.42371° E 1875
9.SBU.18to19 2.95049° N,
98.43022° E
2.95263° N,
98.43042° E 1583
9.SBU.17to18 2.94816° N,
98.42969° E
2.95049° N,
98.43022° E 1634
8.SBU.16to17 2.9459° N,
98.42963° E
2.94816° N,
98.42969° E 1665
7.SBU.15to16 2.94384° N,
98.43042° E
2.9459° N,
98.42963° E 1683
7.SBU.14to15 2.94161° N,
98.43002° E
2.94384° N,
98.43042° E 1722

Appendix S4. Research questions for semi-structured interviews with bird trappers in
Sumatra.
Alias penangkap________________________
Tanggal________________________________
Lokasi_________________________________
Nama interviewer________________________
Nomor penangkap interviewed sama sama (kalau tidak sendiri)_____
BEING A TRAPPER MENJADI PENANGKAP BURUNG
How long have you been a trapper? Sudah berapa lama Anda menjadi penangkap/ pemikat burung?
How/Why did you become a trapper? Please rank all applicable reasons from most important to least important.
Mengapa Anda menjadi perangkap/ pemikat burung? Silahkan urutkan alasan dari yang paling penting .
A. Sudah menjadi Tradisi bisnis keluarga (Orang-tua dan Kakek/Nenek adalah pedagang juga) (traditional
family business) B. Untuk memperoleh Pendapatan/ Uang(to make money) C. Keamanan pekerjaan(job security)
D. Tidak ada pilihan lain (no other options) E. Kesenangan pribadi padaburung Personal interest in birds and
wildlife F. Yang lain (Silahkandijelaskan) Other, please specify
What do you like about working as a trapper? Apakah yang Anda sukai dari pekerjaan ini? Mengapa?
And what do you not like about it? Dan apa yang tidak anda sukai dari pekerjaan menangkap/ memikat burung?
TRAPPINGPENANGKAPAN
How often do you search for birds? Please give the minimum and maximum number of days you may go trapping in
one week. Seberapa sering pergi cari/ memikat burung?Berapa kali? Mohon informasi berapa kali anda pergi
memikat burung dalam seminggu, paling banyak dan paling sedikit?
Where do you trap birds (habitat type)? Dimana Anda menangkap burung? Apakah di hutan, kebun atau sawah?
On which trails to you usually search for birds? Can you please describe the location of these trails? Pada Jalur
yang mana Anda biasa mencari burung? Dapatkah Anda menjelaskan lokasi jalur tersebut?
Can you please estimate the number of trappers that use those trails per week? Dapatkah Anda memperkirakan
jumlah pemikat burung yang masuk di jalur tersebut dalam seminggu?

How much area do you cover each day? How many km? Berapa luas kawasan yang Anda jelajahi untuk mencari
burung setiap hari? Berapa kilometer jelajahi setiap hari, paling banyak dan paling sedikit?
Do you stay in the forest overnight? If so how often? Bila Anda mencari burung, apakah menginap di hutan?
Kalau ya, berapa sering?
Who owns the land where you trap? Do you ever have to ask for permission from the land owner to trap? Siapa
pemilik kawasan di mana Anda mencari burung? apakah Anda pernah meminta izin kepada pemilik kawasan
tersebut?
Do you know of any species that are used for traditional medicine, religious release, or song competitions? Apakah
Anda tahu jenis burung yang digunakan untuk obat tradisional, upacara keagamaan atau kontes kicau?
TRENDS OF TARGET SPECIES
Generally, do you think that the bird trade in Sumatra has increased or decreased and why? Menurut Anda, apakah
Umumnya, perdagangan burungmeningkat atau menurun? Dan mengapa
In general, is it getting harder to find birds? Secara Umum, apakah semakin lebih sulit untuk menemukan burung
tersebut? Kalau Ya, mengapa?(If yes, why?)
Approximately how many birds do you catch per week? Kira-kira berapa banyak burung yang tertangkap
dalam seminggu, paling banyak dan paling sedikit?
So you can catch X birds per month (multiplied by 4)? Jadi, Anda dapat mengangkap sekitar …. Burung dalam
sebulan? (Dikalikan 4 minggu)
So that is Y birds per year (multiplied by 12)? Jadi, Anda dapat menangkap sekitar….burung dalam setahun?
(Dikalikan 12 bulan)
SELLING PENJUALAN
What do you do with your birds? Apa yang Anda lakukan dengan burung-burung milikAnda?
Please choose all that apply and/or rank the choices. (Silahkan pilih jika semua benar dan urutkan pilihan
Anda)
A. Sell to middle men (Di Jual ke pengumpul burung.) B. Sell directly to markets. if so , please specify which
market. (Di Jual langsung ke pasar, jika ya, pasar yang mana? C. Sell to directly to customer (Langsung dijual
kepada konsumen) D. Give to friends (Diberikan kepada teman) E. Keep for personal use (Dipelihara sendiri)

Approximately how many birds do you sell per week? Kira-kira berapa banyak burung yang Anda jual dalam
seminggu?
So you can sell X birds per month (multiplied by 4)? Jadi, Anda dapat menjual sekitar…. Burung dalam
sebulan? (Dikalikan 4 minggu)
So that is Y birds per year (multiplied by 12)? Jadi, Anda dapat menjual sekitar….burung dalam setahun?
(Dikalikan 12 bulan)
Which markets do the birds go to? Ke pasar mana burung-burung Anda dijual?
Generally, what are the price trends for the bird trade within the last 5-10 years? Umumnya, bagaimanakah
kecenderungan harga perdagangan burung dalam kurun waktu 5-10 tahun terakhir?
Mengapa?
What trapping methods do you use for the following species [ show photos] ? Do you particularly target this species
or do you opportunistically catch it? Do you target another species after the population of this one decreases? How
many do you catch per month (over time)? How far do you have to go to catch the species? Does the pair or whole
family group enter the cage/get stuck in the lime, or is only one individual bird usually fooled? What are the price
trends of this species over time? Percent mortality? Use?
Teknik penangkapan seperti apa yang Anda gunakan? Apakah Anda hanya membuat perangkap untuk satu
jenis burung target, ataukah tidak ada target? Apakah anda mencari jenis pengganti jika burung yang
ditargetkan berkurang? Berapa banyak yang dapat kamu tangkap per-bulan(dalam rentang waktu;
misalnya 5 tahun)? Seberapa Jauh Anda berusaha mendapatkan suatu jenis? Apakah satu atau semuanya
dari kelompok burung yang datang tersebut terperangkap/ terjerat? Bagaimana tren harga jenis burung ini
(dalam rentang waktu; misalnya 5 tahun)? bagaimana persentase kematian burung? Untuk apa alasan
pembeli burung tersebut?

teknik penangkapan
khusus atau tidak
jenis pengganti
jumlah / bulan
berapa jauh berusaha (km atau jam)
ekor / kelompok
harga (Rp)
persent yang mati (tulis perangkap, jl.,
atau rumah)
untuk apa (pelihara, obat, makan,
kontes, lepas agama)
OTHER ISSUES HAL LAIN
Do you also hunt animals in the forest? Apakah anda juga menjerat/ menangkap hewan lain di hutan?
If so what kind? Mammals, birds, frogs, snakes, etc. Jenis apa? Mamalia, burung (ayam hutan, merpati, burung
hantu, lain), katak, ular, dsb
Why do you hunt them? For food, medicine, to sell? Untuk apa menangkap hewan tersebut? Untuk dimakan,
atau obat, atau dijual? Kalau dijual, unutk apa?
Do you collect any other forest products from the area (timber, plants, mushrooms, honey, etc.)? If so what are they
used for? Apakah Anda mengumpulkan hasil hutan yang lain seperti tanaman, jamur, madu, getah dsb? Jika
ya, untuk diapakan?
How often to people from outside the village come to catch birds? Seberapa sering orang luar kampung(bukan
penduduk sekitar) datang memikat/ menangkap burung disana?
What species do they target? Jenis apa yang dicari mereka (beda dari yang Anda dicari)?
How long do they spend in the forest? Berapa lama mereka di hutan untuk itu?
Do you think trapping has any effect on the number of birds in the forest? Apakah menurut Anda penangkapan
burung berdampak pada jumlah burung yang ada di hutan?

If so, which species seem most resilient? Kalau ya, jenis apa yang Nampak bertahan (masih banyak sesudah
penangkapan)?
Which species seem most sensitive? Jenis apa yang terlihat sensitive? Terpengaruh keberadaannya karena
adanya penangkapan?
Are any other factors (for example, deforestation, pesticides) affecting bird populations in your area? Apakah ada
faktor lain atau permasalahan (contohnya penebangan hutan, pestisida) yang berdampak pada burung di
kawasan Anda?
How do the effects of trapping on bird populations compare to other factors? Bagaimana dampak penangkapan
burung bila dibandingkan dengan faktor lain (tersebut di atas) apakah lebih kuat?
Has the number of bird trappers in your area increased, decreased, or stayed the same over the last five years?
Apakah jumlah penangkap burung ditempat anda meningkat, berkurang, atau masih sama seperti 5-10
tahun terakhir?
Where do new trappers come from? Darimana para pemikat/penangkap bahru datang? Mereka orang tua atau
anak mudah? Lokal atau dari luar?
Are your children interested in being trappers/traders? Apakah Anak-anak Anda tertarik untuk menjadi
penangkap atau pedagang burung?
Would you like your children to continue trapping and why? Apakah Anda mengharapkan anak-anak dan cucu-
cucu melanjutkan pekerjaan sebagai penangkap burung?
If there was an alternative source of income, I would prefer: Kalau ada sumber pendapatan atau penghasilan
yang lain, Saya lebih suka:
Farmer (Petani) Forestry (petugas Kehutanan) Mining (pegawai Pertambangan) Restaurant/ Hotels (pekerja
Rumah Makan / hotel) Factory (buruh Pabrik) Cleaner (petugas Kebersihan) Study at University (Belajar (di
Universitas) Other (Lainnya.....) _____________________
Do you know of any efforts by the government to restrict trade? Apakah anda tahu upaya Pemerintah Indonesia
untuk mengurangi perdagangan?
Would you need a permit to trap birds? Apakah Anda perlu izin untuk menangkap burung?

Did the outbreak of Avian Flu in 2003 have an impact on the demand for the number (and species) of birds you
trap? Apakah kejadian wabah flu- burung pada tahun 2003, berdampak pada permintaan baik pada jumlah
(dan jenis) yang anda tangkap?
Have you ever been ill or injured from working in the trade? Apakah anda pernah sakit atau terluka dari
bekerja dalam penangkapan dan perdagangan burung?
And if YES, what caused it? (eg, injury in the forest, bird flu, bites, scratches) Kalau YA, karena apa? (eg, sakit di
hutan, terserang flu- burung, dipatuk, digaruk) dan bagaiman sering?
RESPONDENT INFORMATION INFORMASI RESPONDEN
Dapatkah saya menanyakan umur dan asal anda? (Could I please ask your age and ethnic origin?)
Jeniskelamin: Umur:_________________________tahun______
Male (Laki-Laki) Female (Perempuan)
Suku: Anda berasaldarimana?
1. Java 2. Sumatra
Aceh
Sumatra Utara
Sumatra Barat
Sumatra Selatan
3. Indo-Cina 4. Kalimantan 5. NusaTengara 7. Yang lain
Education Level (Tingkat Pendidikan) OPTIONAL:
1. SD 2. SMP 3. SMA 4. Universitas
What proportion of the household income comes from trapping? Seberapa besar (persentase) pendapatan
rumahtangga dari memikat/ menangkap burung?
Please give your approximate monthly income (OPTIONAL). Bagaimana perkiraan jumlah pendapatan
rumahtangga selain dari memikat?
Terima Kasih untuk waktu dan bantuannya

Appendix S5. Species of which photographs were shown to trappers during interviews.
English name Scientific name
Hoogerwerf's Pheasant Lophura hoogerwerfi
Bronze-tailed Peacock-Pheasant Polyplectron chalcurum
Spotted Dove Spilopelia chinensis
Zebra Dove Geopelia striata
Scops Owl sp. Otus sp.
Wreathed Hornbill Rhyticeros undulatus
Fire-tufted Barbet Psilopogon pyrolophus
Black-browed Barbet Psilopogon oorti
wood pecker sp. Dinopium sp.
Blue-crowned Hanging Parrot Loriculus galgulus
Red-breasted Parakeet Psittacula alexandri
Long-tailed Parakeet Psittacula longicauda
Long-tailed Shrike Lanius schach
Blyth's Shrike-babbler Pteruthius aeralatus
Black-naped Oriole Oriolus chinensis
Common Green Magpie Cissa chinensis
Sumatran Treepie Dendrocitta occipitalis
Slender-billed Crow Corvus enca
Cinereous Tit Parus cinereus
Straw-headed Bulbul Pycnonotus zeylanicus
Black-headed Bulbul Pycnonotus atriceps
Ruby-throated Bulbul Pycnonotus dispar
Scaly-breasted Bulbul Pycnonotus squamatus
Sooty-headed Bulbul Pycnonotus aurigaster
Orange-spotted Bulbul Pycnonotus bimaculatus
Yellow-vented Bulbul Pycnonotus goiavier
Ochraceous Bulbul Alophoixus ochraceus
Sunda Bulbul Ixos virescens
Bar-winged Prinia Prinia familiaris
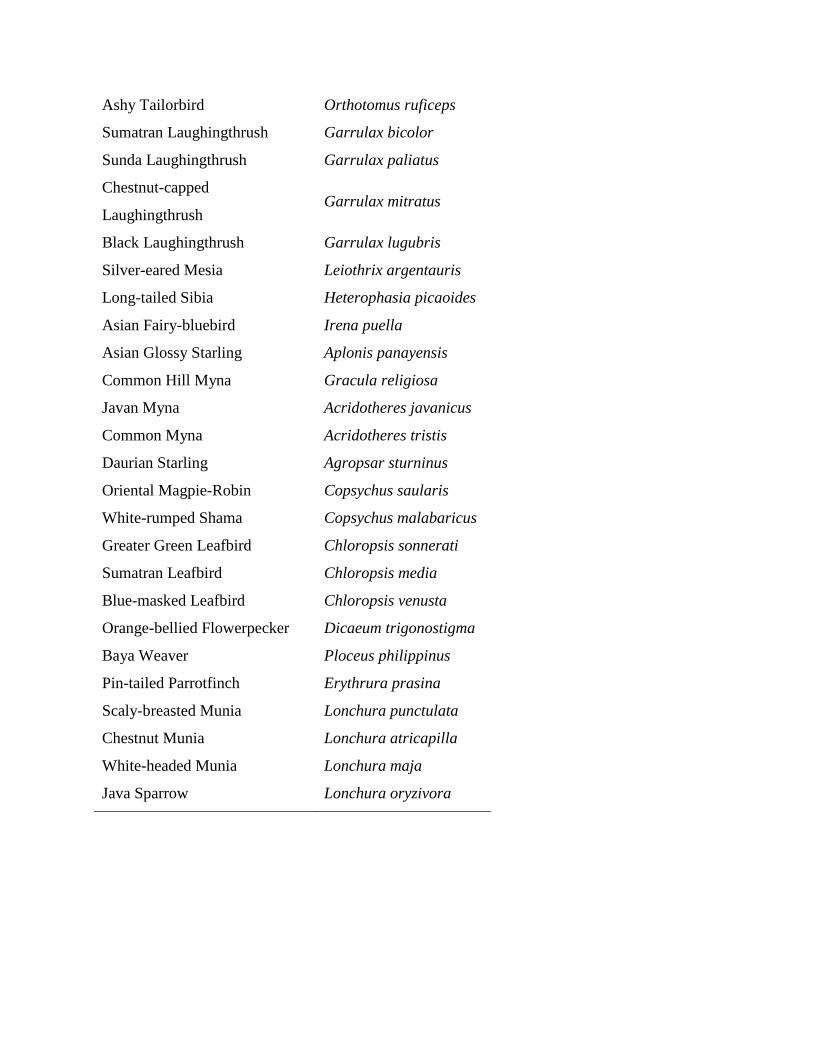
Ashy Tailorbird Orthotomus ruficeps
Sumatran Laughingthrush Garrulax bicolor
Sunda Laughingthrush Garrulax paliatus
Chestnut-capped
Laughingthrush Garrulax mitratus
Black Laughingthrush Garrulax lugubris
Silver-eared Mesia Leiothrix argentauris
Long-tailed Sibia Heterophasia picaoides
Asian Fairy-bluebird Irena puella
Asian Glossy Starling Aplonis panayensis
Common Hill Myna Gracula religiosa
Javan Myna Acridotheres javanicus
Common Myna Acridotheres tristis
Daurian Starling Agropsar sturninus
Oriental Magpie-Robin Copsychus saularis
White-rumped Shama Copsychus malabaricus
Greater Green Leafbird Chloropsis sonnerati
Sumatran Leafbird Chloropsis media
Blue-masked Leafbird Chloropsis venusta
Orange-bellied Flowerpecker Dicaeum trigonostigma
Baya Weaver Ploceus philippinus
Pin-tailed Parrotfinch Erythrura prasina
Scaly-breasted Munia Lonchura punctulata
Chestnut Munia Lonchura atricapilla
White-headed Munia Lonchura maja
Java Sparrow Lonchura oryzivora

Appendix S6. JAGS Bayesian modeling code for Way Canguk and North Sumatra
1. Model code in the BUGS language for Way Canguk analysis of change in abundance over
time
# Negative Binomial Model
model {
# Priors
for(j in 1:n.year) {
K[j] ~ dunif(0,100)
}
alpha0 ~ dnorm(0, 0.001)
alpha1 ~ dnorm(0, 0.001)
alpha2 ~ dnorm(0, 0.001)
alpha3 ~ dnorm(0, 0.001)
sigma.alpha ~ dgamma(0.001, 0.001)
tau.alpha <- pow(sigma.alpha, -2)
mu.beta0 ~ dnorm(0, 0.001)
sigma.beta0 ~ dgamma(0.001, 0.001)
tau.beta0 <- pow(sigma.beta0, -2)
# species-level trend
for(k in 1:n.species) {
beta0[k] ~ dnorm(mu.beta0, tau.beta0)
beta1[k] ~ dnorm(mu.beta1[k], tau.alpha)
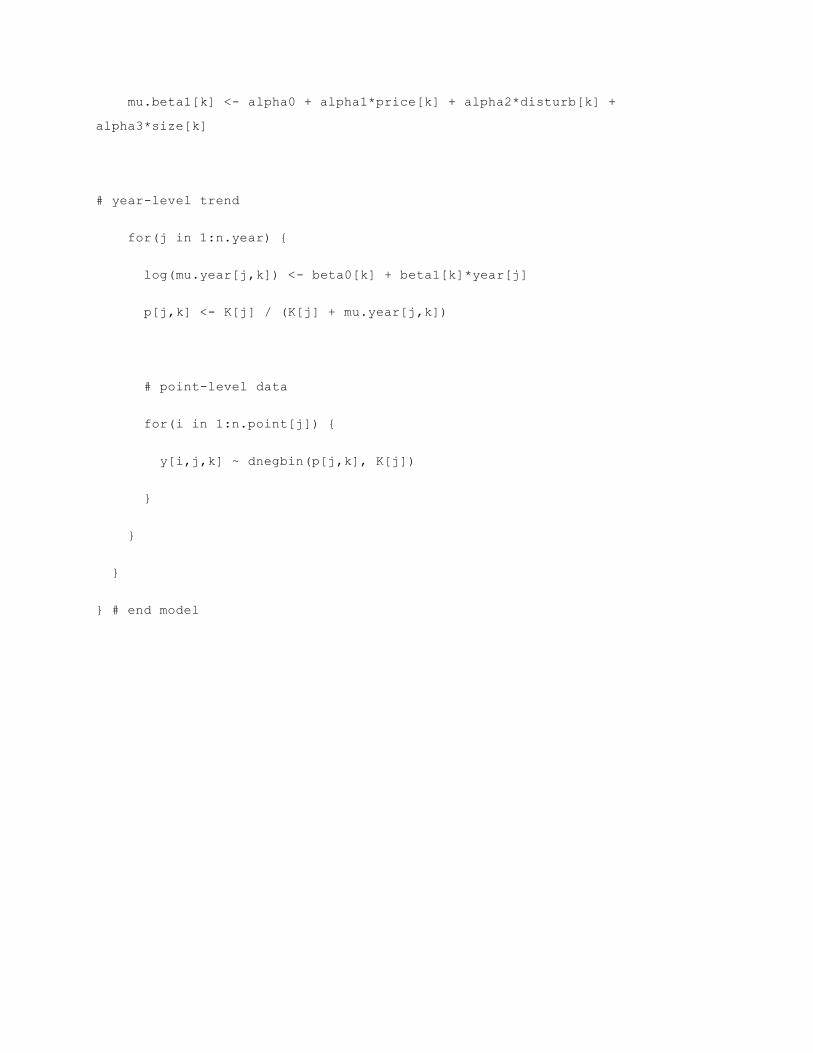
mu.beta1[k] <- alpha0 + alpha1*price[k] + alpha2*disturb[k] +
alpha3*size[k]
# year-level trend
for(j in 1:n.year) {
log(mu.year[j,k]) <- beta0[k] + beta1[k]*year[j]
p[j,k] <- K[j] / (K[j] + mu.year[j,k])
# point-level data
for(i in 1:n.point[j]) {
y[i,j,k] ~ dnegbin(p[j,k], K[j])
}
}
}
} # end model

2. Model code in the BUGS language for North Sumatra analysis of change in abundance with
distance
# Zero-inflated Poisson
model {
# Priors
alpha0 ~ dnorm(0, 0.01)
alpha1 ~ dnorm(0, 0.01)
alpha2 ~ dnorm(0, 0.01)
alpha3 ~ dnorm(0, 0.01)
sigma.alpha ~ dunif(0.001, 1000)
tau.alpha <- pow(sigma.alpha, -2)
mu.beta0 ~ dunif(-10, 10)
sigma.beta0 ~ dunif(0.001, 100)
tau.beta0 <- pow(sigma.beta0, -2)
mu.beta2 ~ dunif(-10, 10)
sigma.beta2 ~ dunif(0.001, 100)
tau.beta2 <- pow(sigma.beta2, -2)
mu.p ~ dunif(-10, 10)
sigma.p ~ dunif(0.001, 100)
tau.p <- pow(sigma.p, -2)
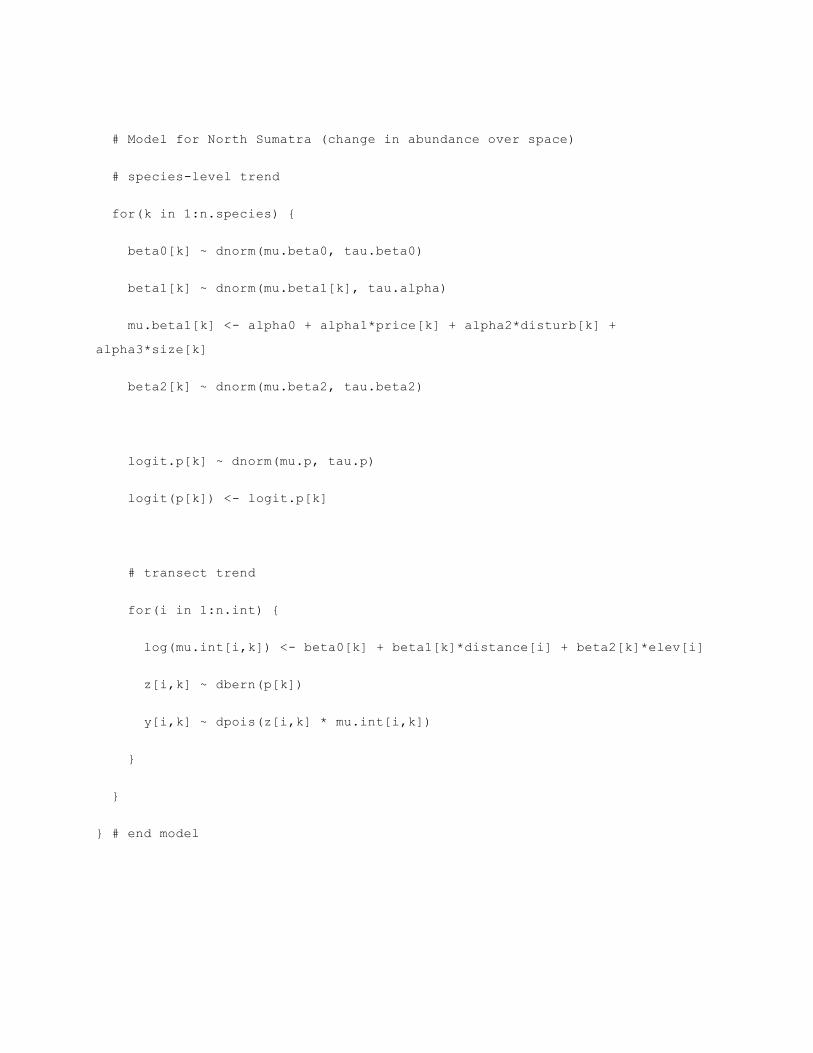
# Model for North Sumatra (change in abundance over space)
# species-level trend
for(k in 1:n.species) {
beta0[k] ~ dnorm(mu.beta0, tau.beta0)
beta1[k] ~ dnorm(mu.beta1[k], tau.alpha)
mu.beta1[k] <- alpha0 + alpha1*price[k] + alpha2*disturb[k] +
alpha3*size[k]
beta2[k] ~ dnorm(mu.beta2, tau.beta2)
logit.p[k] ~ dnorm(mu.p, tau.p)
logit(p[k]) <- logit.p[k]
# transect trend
for(i in 1:n.int) {
log(mu.int[i,k]) <- beta0[k] + beta1[k]*distance[i] + beta2[k]*elev[i]
z[i,k] ~ dbern(p[k])
y[i,k] ~ dpois(z[i,k] * mu.int[i,k])
}
}
} # end model
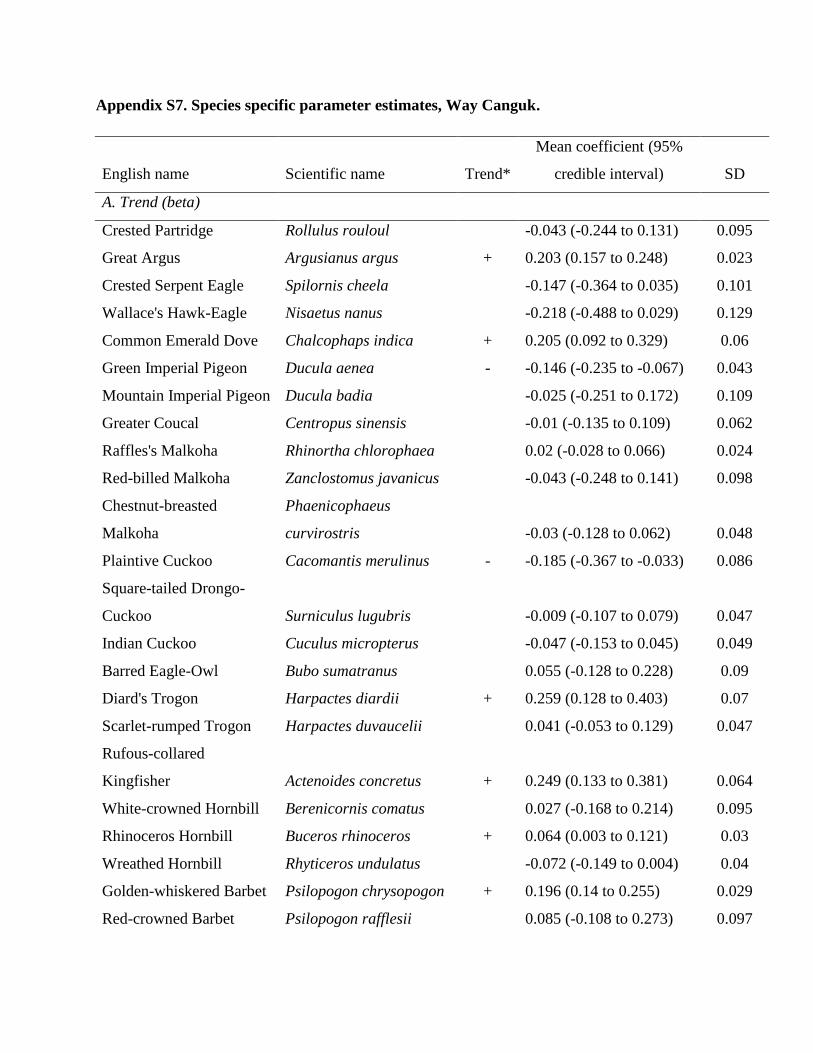
Appendix S7. Species specific parameter estimates, Way Canguk.
English name Scientific name Trend*
Mean coefficient (95%
credible interval) SD
A. Trend (beta)
Crested Partridge Rollulus rouloul
-0.043 (-0.244 to 0.131) 0.095
Great Argus Argusianus argus + 0.203 (0.157 to 0.248) 0.023
Crested Serpent Eagle Spilornis cheela
-0.147 (-0.364 to 0.035) 0.101
Wallace's Hawk-Eagle Nisaetus nanus
-0.218 (-0.488 to 0.029) 0.129
Common Emerald Dove Chalcophaps indica + 0.205 (0.092 to 0.329) 0.06
Green Imperial Pigeon Ducula aenea - -0.146 (-0.235 to -0.067) 0.043
Mountain Imperial Pigeon Ducula badia
-0.025 (-0.251 to 0.172) 0.109
Greater Coucal Centropus sinensis
-0.01 (-0.135 to 0.109) 0.062
Raffles's Malkoha Rhinortha chlorophaea
0.02 (-0.028 to 0.066) 0.024
Red-billed Malkoha Zanclostomus javanicus
-0.043 (-0.248 to 0.141) 0.098
Chestnut-breasted
Malkoha
Phaenicophaeus
curvirostris
-0.03 (-0.128 to 0.062) 0.048
Plaintive Cuckoo Cacomantis merulinus - -0.185 (-0.367 to -0.033) 0.086
Square-tailed Drongo-
Cuckoo Surniculus lugubris
-0.009 (-0.107 to 0.079) 0.047
Indian Cuckoo Cuculus micropterus
-0.047 (-0.153 to 0.045) 0.049
Barred Eagle-Owl Bubo sumatranus
0.055 (-0.128 to 0.228) 0.09
Diard's Trogon Harpactes diardii + 0.259 (0.128 to 0.403) 0.07
Scarlet-rumped Trogon Harpactes duvaucelii
0.041 (-0.053 to 0.129) 0.047
Rufous-collared
Kingfisher Actenoides concretus + 0.249 (0.133 to 0.381) 0.064
White-crowned Hornbill Berenicornis comatus
0.027 (-0.168 to 0.214) 0.095
Rhinoceros Hornbill Buceros rhinoceros + 0.064 (0.003 to 0.121) 0.03
Wreathed Hornbill Rhyticeros undulatus
-0.072 (-0.149 to 0.004) 0.04
Golden-whiskered Barbet Psilopogon chrysopogon + 0.196 (0.14 to 0.255) 0.029
Red-crowned Barbet Psilopogon rafflesii
0.085 (-0.108 to 0.273) 0.097

Red-throated Barbet
Psilopogon
mystacophanos + 0.247 (0.186 to 0.312) 0.032
Blue-eared Barbet Psilopogon duvaucelii + 0.245 (0.104 to 0.396) 0.074
Brown Barbet Caloramphus fuliginosus
0.06 (-0.026 to 0.142) 0.043
White-bellied
Woodpecker Dryocopus javensis
-0.066 (-0.305 to 0.143) 0.112
Rufous Woodpecker Micropternus brachyurus
0.007 (-0.189 to 0.188) 0.095
Buff-necked Woodpecker Meiglyptes tukki
0.004 (-0.108 to 0.113) 0.056
Blue-crowned Hanging
Parrot Loriculus galgulus - -0.185 (-0.39 to -0.019) 0.095
Blue-rumped Parrot Psittinus cyanurus - -0.169 (-0.289 to -0.067) 0.056
Long-tailed Parakeet Psittacula longicauda - -0.347 (-0.525 to -0.199) 0.083
Black-and-red Broadbill
Cymbirhynchus
macrorhynchos
0.043 (-0.127 to 0.207) 0.084
Black-and-yellow
Broadbill Eurylaimus ochromalus
-0.007 (-0.056 to 0.039) 0.024
Malayan Banded Pitta Hydrornis irena
0.023 (-0.024 to 0.067) 0.023
Hooded Pitta Pitta sordida
0.09 (-0.101 to 0.278) 0.095
Green Iora Aegithina viridissima + 0.231 (0.147 to 0.323) 0.044
Scarlet Minivet Pericrocotus speciosus
-0.042 (-0.202 to 0.103) 0.078
Dark-throated Oriole Oriolus xanthonotus + 0.055 (0.007 to 0.102) 0.025
Sumatran Drongo Dicrurus sumatranus
-0.15 (-0.336 to 0.005) 0.088
Greater Racket-tailed
Drongo Dicrurus paradiseus + 0.097 (0.061 to 0.132) 0.018
Black-naped Monarch Hypothymis azurea
0.069 (-0.025 to 0.158) 0.047
Asian Paradise Flycatcher Terpsiphone paradisi + 0.14 (0.029 to 0.252) 0.057
Crested Jay Platylophus galericulatus
-0.048 (-0.222 to 0.106) 0.083
Black Magpie Platysmurus leucopterus + 0.087 (0.043 to 0.129) 0.021
Slender-billed Crow Corvus enca - -0.145 (-0.278 to -0.03) 0.064
Black-headed Bulbul Pycnonotus atriceps - -0.146 (-0.316 to -0.004) 0.081
Ruby-throated Bulbul Pycnonotus dispar
-0.005 (-0.06 to 0.049) 0.027

Olive-winged Bulbul Pycnonotus plumosus
0.009 (-0.188 to 0.2) 0.101
Cream-vented Bulbul Pycnonotus simplex + 0.12 (0.071 to 0.167) 0.025
Asian Red-eyed Bulbul Pycnonotus brunneus - -0.106 (-0.174 to -0.042) 0.033
Grey-cheeked Bulbul Alophoixus bres + 0.148 (0.048 to 0.247) 0.051
Yellow-bellied Bulbul
Alophoixus
phaeocephalus + 0.293 (0.199 to 0.4) 0.05
Buff-vented Bulbul Iole olivacea
0.15 (-0.006 to 0.303) 0.08
Streaked Bulbul Ixos malaccensis
0.138 (-0.029 to 0.31) 0.086
Bar-winged Prinia Prinia familiaris - -0.229 (-0.363 to -0.112) 0.065
Rufous-tailed Tailorbird Orthotomus sericeus + 0.184 (0.104 to 0.271) 0.043
Ashy Tailorbird Orthotomus ruficeps
0.101 (-0.041 to 0.246) 0.071
Chestnut-backed Scimitar
Babbler Pomatorhinus montanus + 0.324 (0.198 to 0.473) 0.07
Pin-striped Tit-Babbler Macronus gularis + 0.237 (0.18 to 0.294) 0.029
Rufous-crowned Babbler Malacopteron magnum + 0.194 (0.109 to 0.283) 0.044
Black-capped Babbler Pellorneum capistratum + 0.109 (0.04 to 0.175) 0.035
Black Laughingthrush** Garrulax lugubris
0.107 (-0.092 to 0.288) 0.095
Asian Fairy-bluebird Irena puella
-0.016 (-0.095 to 0.057) 0.039
Velvet-fronted Nuthatch Sitta frontalis
0.101 (-0.09 to 0.287) 0.097
Common Hill Myna Gracula religiosa
-0.022 (-0.077 to 0.03) 0.027
Oriental Magpie-Robin Copsychus saularis
-0.073 (-0.223 to 0.067) 0.075
White-rumped Shama Copsychus malabaricus - -0.324 (-0.519 to -0.169) 0.09
Verditer Flycatcher Eumyias thalassinus
0.094 (-0.063 to 0.243) 0.079
White-crowned Forktail Enicurus leschenaulti
0.077 (-0.033 to 0.182) 0.055
Yellow-rumped
Flycatcher Ficedula zanthopygia
0.032 (-0.152 to 0.204) 0.091
Greater Green Leafbird Chloropsis sonnerati
-0.04 (-0.193 to 0.095) 0.073
Lesser Green Leafbird Chloropsis cyanopogon + 0.162 (0.052 to 0.281) 0.057
Blue-winged Leafbird
Chloropsis
cochinchinensis
-0.033 (-0.112 to 0.039) 0.038

Crimson-breasted
Flowerpecker Prionochilus percussus
0.071 (-0.128 to 0.27) 0.099
Orange-bellied
Flowerpecker Dicaeum trigonostigma
0.093 (-0.069 to 0.249) 0.081
Ruby-cheeked Sunbird Chalcoparia singalensis + 0.174 (0.046 to 0.307) 0.066
Brown-throated Sunbird Anthreptes malacensis
0.058 (-0.096 to 0.206) 0.079
B. Intercept (beta)
Crested Partridge Rollulus rouloul
-5.138 (-6.655 to -3.855) 0.725
Great Argus Argusianus argus
-3.052 (-3.607 to -2.516) 0.284
Crested Serpent Eagle Spilornis cheela
-4.443 (-5.719 to -3.306) 0.617
Wallace's Hawk-Eagle Nisaetus nanus
-5.517 (-7.506 to -3.947) 0.918
Common Emerald Dove Chalcophaps indica
-5.591 (-7.068 to -4.376) 0.688
Green Imperial Pigeon Ducula aenea
-1.386 (-1.841 to -0.898) 0.238
Mountain Imperial Pigeon Ducula badia
-6.128 (-8.193 to -4.462) 0.945
Greater Coucal Centropus sinensis
-4.081 (-5.14 to -3.164) 0.508
Raffles's Malkoha Rhinortha chlorophaea
-1.656 (-2.116 to -1.196) 0.235
Red-billed Malkoha Zanclostomus javanicus
-5.498 (-7.196 to -4.067) 0.807
Chestnut-breasted
Malkoha
Phaenicophaeus
curvirostris
-3.092 (-3.816 to -2.385) 0.362
Plaintive Cuckoo Cacomantis merulinus
-3.177 (-4.013 to -2.373) 0.414
Square-tailed Drongo-
Cuckoo Surniculus lugubris
-3.261 (-3.997 to -2.575) 0.368
Indian Cuckoo Cuculus micropterus
-3.026 (-3.731 to -2.345) 0.35
Barred Eagle-Owl Bubo sumatranus
-6.041 (-7.959 to -4.439) 0.886
Diard's Trogon Harpactes diardii
-6.488 (-8.355 to -4.97) 0.867
Scarlet-rumped Trogon Harpactes duvaucelii
-3.624 (-4.477 to -2.865) 0.405
Rufous-collared
Kingfisher Actenoides concretus
-6.006 (-7.693 to -4.663) 0.771
White-crowned Hornbill Berenicornis comatus
-5.894 (-7.711 to -4.356) 0.861
Rhinoceros Hornbill Buceros rhinoceros
-2.769 (-3.327 to -2.193) 0.294
Wreathed Hornbill Rhyticeros undulatus
-2.209 (-2.776 to -1.662) 0.285
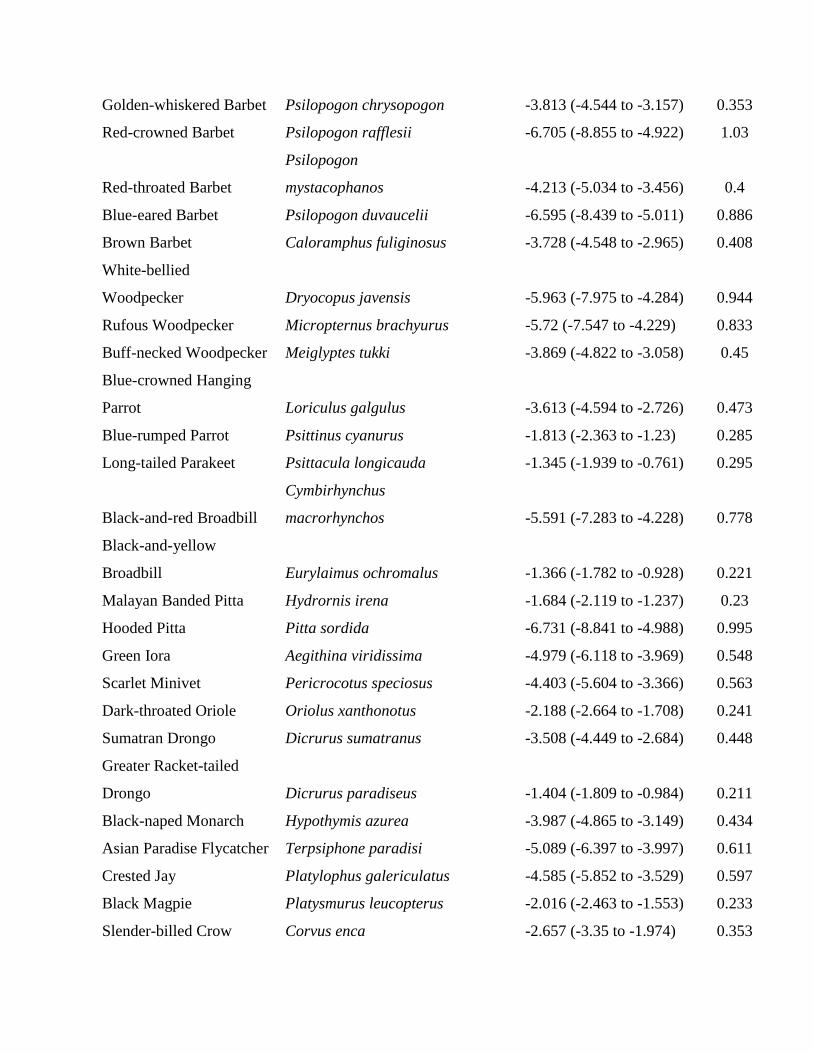
Golden-whiskered Barbet Psilopogon chrysopogon
-3.813 (-4.544 to -3.157) 0.353
Red-crowned Barbet Psilopogon rafflesii
-6.705 (-8.855 to -4.922) 1.03
Red-throated Barbet
Psilopogon
mystacophanos
-4.213 (-5.034 to -3.456) 0.4
Blue-eared Barbet Psilopogon duvaucelii
-6.595 (-8.439 to -5.011) 0.886
Brown Barbet Caloramphus fuliginosus
-3.728 (-4.548 to -2.965) 0.408
White-bellied
Woodpecker Dryocopus javensis
-5.963 (-7.975 to -4.284) 0.944
Rufous Woodpecker Micropternus brachyurus
-5.72 (-7.547 to -4.229) 0.833
Buff-necked Woodpecker Meiglyptes tukki
-3.869 (-4.822 to -3.058) 0.45
Blue-crowned Hanging
Parrot Loriculus galgulus
-3.613 (-4.594 to -2.726) 0.473
Blue-rumped Parrot Psittinus cyanurus
-1.813 (-2.363 to -1.23) 0.285
Long-tailed Parakeet Psittacula longicauda
-1.345 (-1.939 to -0.761) 0.295
Black-and-red Broadbill
Cymbirhynchus
macrorhynchos
-5.591 (-7.283 to -4.228) 0.778
Black-and-yellow
Broadbill Eurylaimus ochromalus
-1.366 (-1.782 to -0.928) 0.221
Malayan Banded Pitta Hydrornis irena
-1.684 (-2.119 to -1.237) 0.23
Hooded Pitta Pitta sordida
-6.731 (-8.841 to -4.988) 0.995
Green Iora Aegithina viridissima
-4.979 (-6.118 to -3.969) 0.548
Scarlet Minivet Pericrocotus speciosus
-4.403 (-5.604 to -3.366) 0.563
Dark-throated Oriole Oriolus xanthonotus
-2.188 (-2.664 to -1.708) 0.241
Sumatran Drongo Dicrurus sumatranus
-3.508 (-4.449 to -2.684) 0.448
Greater Racket-tailed
Drongo Dicrurus paradiseus
-1.404 (-1.809 to -0.984) 0.211
Black-naped Monarch Hypothymis azurea
-3.987 (-4.865 to -3.149) 0.434
Asian Paradise Flycatcher Terpsiphone paradisi
-5.089 (-6.397 to -3.997) 0.611
Crested Jay Platylophus galericulatus
-4.585 (-5.852 to -3.529) 0.597
Black Magpie Platysmurus leucopterus
-2.016 (-2.463 to -1.553) 0.233
Slender-billed Crow Corvus enca
-2.657 (-3.35 to -1.974) 0.353

Black-headed Bulbul Pycnonotus atriceps
-3.293 (-4.134 to -2.468) 0.429
Ruby-throated Bulbul Pycnonotus dispar
-1.655 (-2.136 to -1.155) 0.254
Olive-winged Bulbul Pycnonotus plumosus
-6.251 (-8.282 to -4.579) 0.965
Cream-vented Bulbul Pycnonotus simplex
-2.707 (-3.241 to -2.193) 0.267
Asian Red-eyed Bulbul Pycnonotus brunneus
-1.255 (-1.688 to -0.797) 0.228
Grey-cheeked Bulbul Alophoixus bres
-4.837 (-5.954 to -3.811) 0.552
Yellow-bellied Bulbul
Alophoixus
phaeocephalus
-5.546 (-6.892 to -4.402) 0.634
Buff-vented Bulbul Iole olivacea
-6.316 (-8.135 to -4.767) 0.875
Streaked Bulbul Ixos malaccensis
-6.576 (-8.581 to -4.927) 0.936
Bar-winged Prinia Prinia familiaris
-1.593 (-2.157 to -1.013) 0.292
Rufous-tailed Tailorbird Orthotomus sericeus
-4.56 (-5.57 to -3.656) 0.488
Ashy Tailorbird Orthotomus ruficeps
-5.404 (-7.001 to -4.102) 0.727
Chestnut-backed Scimitar
Babbler Pomatorhinus montanus
-6.814 (-8.797 to -5.253) 0.912
Pin-striped Tit-Babbler Macronus gularis
-3.832 (-4.53 to -3.165) 0.351
Rufous-crowned Babbler Malacopteron magnum
-4.775 (-5.874 to -3.8) 0.517
Black-capped Babbler Pellorneum capistratum
-3.489 (-4.204 to -2.796) 0.36
Black Laughingthrush Garrulax lugubris
-6.855 (-8.932 to -5.033) 0.992
Asian Fairy-bluebird Irena puella
-2.611 (-3.207 to -2.025) 0.304
Velvet-fronted Nuthatch Sitta frontalis
-6.798 (-9.069 to -4.991) 1.046
Common Hill Myna Gracula religiosa
-1.587 (-2.038 to -1.131) 0.231
Oriental Magpie-Robin Copsychus saularis
-3.986 (-5.071 to -3.069) 0.504
White-rumped Shama Copsychus malabaricus
-1.744 (-2.343 to -1.1) 0.32
Verditer Flycatcher Eumyias thalassinus
-5.713 (-7.365 to -4.297) 0.793
White-crowned Forktail Enicurus leschenaulti
-4.479 (-5.574 to -3.513) 0.523
Yellow-rumped
Flycatcher Ficedula zanthopygia
-5.895 (-7.729 to -4.375) 0.861
Greater Green Leafbird Chloropsis sonnerati
-4.158 (-5.26 to -3.178) 0.531
Lesser Green Leafbird Chloropsis cyanopogon
-5.178 (-6.498 to -4.033) 0.626

Blue-winged Leafbird
Chloropsis
cochinchinensis
-2.451 (-3 to -1.893) 0.283
Crimson-breasted
Flowerpecker Prionochilus percussus
-6.609 (-8.881 to -4.873) 1.019
Orange-bellied
Flowerpecker Dicaeum trigonostigma
-5.907 (-7.609 to -4.478) 0.815
Ruby-cheeked Sunbird Chalcoparia singalensis
-5.761 (-7.307 to -4.415) 0.728
Brown-throated Sunbird Anthreptes malacensis -5.446 (-6.987 to -4.108) 0.737
*In section A, + and – signs in the trend column show species that increased or decreased significantly over time, respectively; the other
species showed no significant changes.
**Black Laughingthrush is normally a montane species. We heard the species at Way Canguk and made a recording of its song.

Appendix S8. Species specific parameter estimates, North Sumatra. Bronze-tailed Peacock-
Pheasant was significantly more common away from roads; the other species showed no
significant changes.
English name Scientific name
Mean coefficient (95%
credible interval) SD
A. Trend (beta)
Bronze-tailed Peacock-
Pheasant
Polyplectron
chalcurum 0.31 (0.026 to 0.6) 0.144
Mountain Imperial Pigeon Ducula badia 0.362 (-0.146 to 0.874) 0.26
Fire-tufted Barbet
Psilopogon
pyrolophus 0.124 (-0.048 to 0.284) 0.083
Black-browed Barbet Psilopogon oorti -0.044 (-0.324 to 0.189) 0.13
Greater Yellownape
Chrysophlegma
flavinucha -0.023 (-0.473 to 0.384) 0.219
Black-and-crimson Oriole Oriolus cruentus 0.086 (-0.112 to 0.288) 0.103
Sumatran Drongo Dicrurus sumatranus 0.157 (-0.005 to 0.312) 0.078
Common Green Magpie Cissa chinensis 0.08 (-0.208 to 0.349) 0.141
Sumatran Treepie Dendrocitta occipitalis 0.109 (-0.136 to 0.364) 0.126
Cinereous Tit Parus cinereus -0.033 (-0.352 to 0.312) 0.167
Orange-spotted Bulbul
Pycnonotus
bimaculatus 0.086 (-0.169 to 0.362) 0.132
Ochraceous Bulbul Alophoixus ochraceus 0.014 (-0.237 to 0.24) 0.119
Sunda Bulbul Ixos virescens 0.115 (-0.076 to 0.335) 0.101
Mountain Leaf Warbler
Phylloscopus
trivirgatus 0.09 (-0.031 to 0.214) 0.062
Hill Prinia Prinia superciliaris -0.072 (-0.542 to 0.405) 0.243
Spot-necked Babbler Stachyris striolata 0.082 (-0.167 to 0.311) 0.117
Sunda Laughingthrush Garrulax paliatus 0.09 (-0.057 to 0.245) 0.075
Chestnut-capped
Laughingthrush Garrulax mitratus 0.167 (-0.04 to 0.348) 0.097
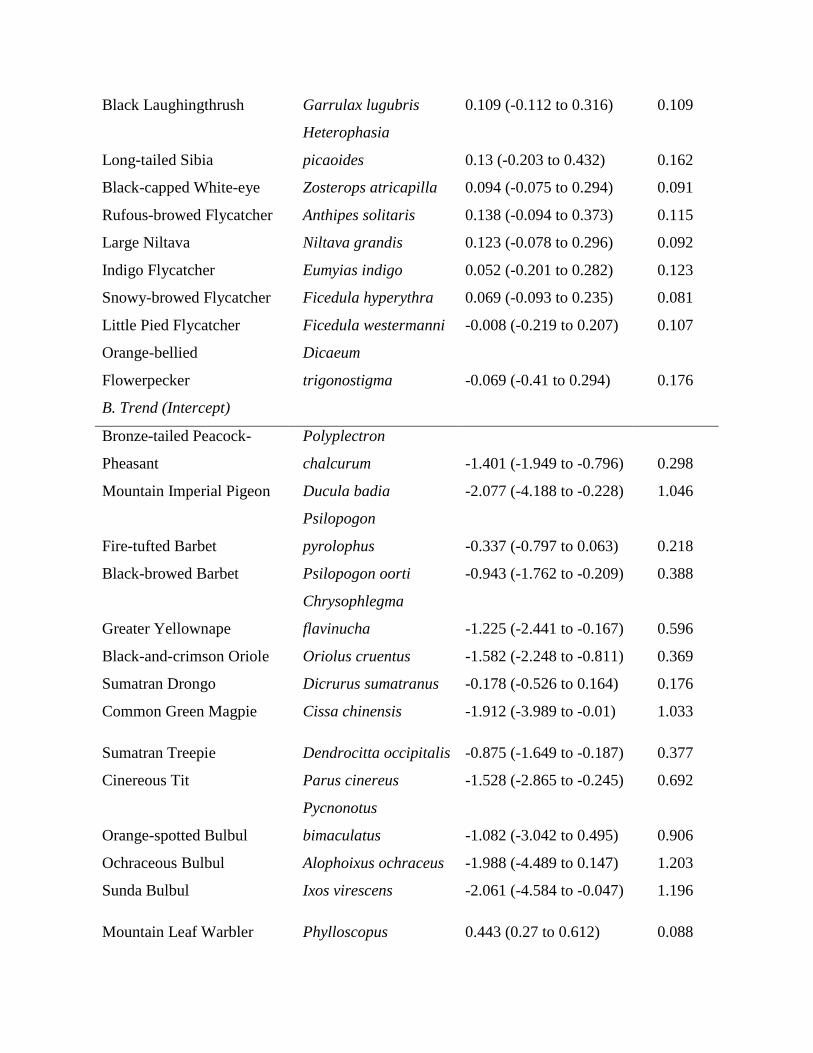
Black Laughingthrush Garrulax lugubris 0.109 (-0.112 to 0.316) 0.109
Long-tailed Sibia
Heterophasia
picaoides 0.13 (-0.203 to 0.432) 0.162
Black-capped White-eye Zosterops atricapilla 0.094 (-0.075 to 0.294) 0.091
Rufous-browed Flycatcher Anthipes solitaris 0.138 (-0.094 to 0.373) 0.115
Large Niltava Niltava grandis 0.123 (-0.078 to 0.296) 0.092
Indigo Flycatcher Eumyias indigo 0.052 (-0.201 to 0.282) 0.123
Snowy-browed Flycatcher Ficedula hyperythra 0.069 (-0.093 to 0.235) 0.081
Little Pied Flycatcher Ficedula westermanni -0.008 (-0.219 to 0.207) 0.107
Orange-bellied
Flowerpecker
Dicaeum
trigonostigma -0.069 (-0.41 to 0.294) 0.176
B. Trend (Intercept)
Bronze-tailed Peacock-
Pheasant
Polyplectron
chalcurum -1.401 (-1.949 to -0.796) 0.298
Mountain Imperial Pigeon Ducula badia -2.077 (-4.188 to -0.228) 1.046
Fire-tufted Barbet
Psilopogon
pyrolophus -0.337 (-0.797 to 0.063) 0.218
Black-browed Barbet Psilopogon oorti -0.943 (-1.762 to -0.209) 0.388
Greater Yellownape
Chrysophlegma
flavinucha -1.225 (-2.441 to -0.167) 0.596
Black-and-crimson Oriole Oriolus cruentus -1.582 (-2.248 to -0.811) 0.369
Sumatran Drongo Dicrurus sumatranus -0.178 (-0.526 to 0.164) 0.176
Common Green Magpie Cissa chinensis -1.912 (-3.989 to -0.01) 1.033
Sumatran Treepie Dendrocitta occipitalis -0.875 (-1.649 to -0.187) 0.377
Cinereous Tit Parus cinereus -1.528 (-2.865 to -0.245) 0.692
Orange-spotted Bulbul
Pycnonotus
bimaculatus -1.082 (-3.042 to 0.495) 0.906
Ochraceous Bulbul Alophoixus ochraceus -1.988 (-4.489 to 0.147) 1.203
Sunda Bulbul Ixos virescens -2.061 (-4.584 to -0.047) 1.196
Mountain Leaf Warbler Phylloscopus 0.443 (0.27 to 0.612) 0.088
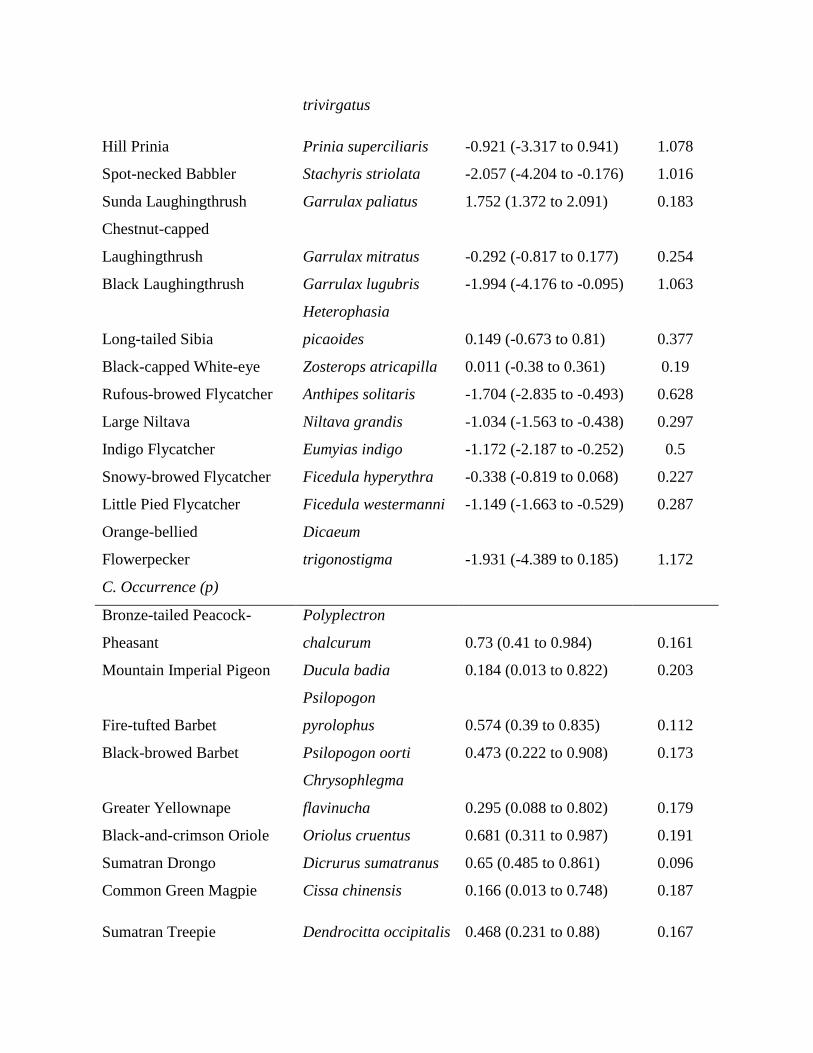
trivirgatus
Hill Prinia Prinia superciliaris -0.921 (-3.317 to 0.941) 1.078
Spot-necked Babbler Stachyris striolata -2.057 (-4.204 to -0.176) 1.016
Sunda Laughingthrush Garrulax paliatus 1.752 (1.372 to 2.091) 0.183
Chestnut-capped
Laughingthrush Garrulax mitratus -0.292 (-0.817 to 0.177) 0.254
Black Laughingthrush Garrulax lugubris -1.994 (-4.176 to -0.095) 1.063
Long-tailed Sibia
Heterophasia
picaoides 0.149 (-0.673 to 0.81) 0.377
Black-capped White-eye Zosterops atricapilla 0.011 (-0.38 to 0.361) 0.19
Rufous-browed Flycatcher Anthipes solitaris -1.704 (-2.835 to -0.493) 0.628
Large Niltava Niltava grandis -1.034 (-1.563 to -0.438) 0.297
Indigo Flycatcher Eumyias indigo -1.172 (-2.187 to -0.252) 0.5
Snowy-browed Flycatcher Ficedula hyperythra -0.338 (-0.819 to 0.068) 0.227
Little Pied Flycatcher Ficedula westermanni -1.149 (-1.663 to -0.529) 0.287
Orange-bellied
Flowerpecker
Dicaeum
trigonostigma -1.931 (-4.389 to 0.185) 1.172
C. Occurrence (p)
Bronze-tailed Peacock-
Pheasant
Polyplectron
chalcurum 0.73 (0.41 to 0.984) 0.161
Mountain Imperial Pigeon Ducula badia 0.184 (0.013 to 0.822) 0.203
Fire-tufted Barbet
Psilopogon
pyrolophus 0.574 (0.39 to 0.835) 0.112
Black-browed Barbet Psilopogon oorti 0.473 (0.222 to 0.908) 0.173
Greater Yellownape
Chrysophlegma
flavinucha 0.295 (0.088 to 0.802) 0.179
Black-and-crimson Oriole Oriolus cruentus 0.681 (0.311 to 0.987) 0.191
Sumatran Drongo Dicrurus sumatranus 0.65 (0.485 to 0.861) 0.096
Common Green Magpie Cissa chinensis 0.166 (0.013 to 0.748) 0.187
Sumatran Treepie Dendrocitta occipitalis 0.468 (0.231 to 0.88) 0.167

Cinereous Tit Parus cinereus 0.326 (0.078 to 0.883) 0.216
Orange-spotted Bulbul
Pycnonotus
bimaculatus 0.08 (0.009 to 0.349) 0.091
Ochraceous Bulbul Alophoixus ochraceus 0.128 (0.006 to 0.718) 0.176
Sunda Bulbul Ixos virescens 0.14 (0.005 to 0.74) 0.187
Mountain Leaf Warbler
Phylloscopus
trivirgatus 0.87 (0.764 to 0.973) 0.054
Hill Prinia Prinia superciliaris 0.058 (0.003 to 0.345) 0.097
Spot-necked Babbler Stachyris striolata 0.179 (0.014 to 0.742) 0.186
Sunda Laughingthrush Garrulax paliatus 0.045 (0.018 to 0.083) 0.017
Chestnut-capped
Laughingthrush Garrulax mitratus 0.356 (0.218 to 0.563) 0.087
Black Laughingthrush Garrulax lugubris 0.182 (0.015 to 0.798) 0.2
Long-tailed Sibia
Heterophasia
picaoides 0.075 (0.031 to 0.149) 0.031
Black-capped White-eye Zosterops atricapilla 0.41 (0.287 to 0.565) 0.071
Rufous-browed Flycatcher Anthipes solitaris 0.441 (0.11 to 0.962) 0.244
Large Niltava Niltava grandis 0.677 (0.384 to 0.976) 0.165
Indigo Flycatcher Eumyias indigo 0.374 (0.135 to 0.858) 0.186
Snowy-browed Flycatcher Ficedula hyperythra 0.55 (0.37 to 0.808) 0.112
Little Pied Flycatcher Ficedula westermanni 0.708 (0.405 to 0.978) 0.159
Orange-bellied
Flowerpecker
Dicaeum
trigonostigma 0.123 (0.005 to 0.694) 0.169

Appendix S9. Variance parameters from hierarchical Bayesian models of changes in bird
abundance.
Parameter Mean (95% credible
interval) SD
A. Way Canguk
hyper-parameter sigma.alpha, variance 0.132 (0.105 to 0.166) 0.016
hyper-parameter sigma.beta0, variance 1.84 (1.52 to 2.23) 0.183
over-dispersion parameter K[1], variance - year1 0.117 (0.089 to 0.152) 0.016
over-dispersion parameter K[2], variance - year2 0.142 (0.106 to 0.19) 0.021
over-dispersion parameter K[3], variance - year3 0.097 (0.077 to 0.121) 0.011
over-dispersion parameter K[4], variance - year4 0.169 (0.107 to 0.262) 0.041
over-dispersion parameter K[5], variance - year5 0.221 (0.105 to 0.449) 0.089
over-dispersion parameter K[6], variance - year6 0.06 (0.05 to 0.072) 0.006
over-dispersion parameter K[7], variance - year7 12.4 (2.13 to 79.3) 18.2
B. North Sumatra
hyper-parameter mu.beta0, mean (intercept)
0.322 (-1.704 to -
0.437) 0.322
hyper-parameter mu.beta2, mean (elevation) 0.084 (-0.191 to
0.133) 0.084
hyper-parameter mu.p, mean (zero-inflation) 0.518 (-1.886 to 0.17) 0.518
hyper-parameter sigma.alpha, variance 0.051 (0.004 to 0.193) 0.051
hyper-parameter sigma.beta0, variance 0.289 (0.729 to 1.874) 0.289
hyper-parameter sigma.beta2, variance 0.085 (0.146 to 0.486) 0.085
hyper-parameter sigma.p, variance 0.429 (1.257 to 2.957) 0.429

Appendix S10. Statistical tests of the changes in (A) hours walked by trappers in search of
the four most sensitive species in our study area in North Sumatra and (B) numbers of
birds trapped per day.
model AICc weight ΔAICc marginal R2 conditional R
2 df
A. Hours walked by trappers over time
Silver-eared mesia Leiothrix argentauris
year 0.645 0 0.87 0.87 4
null 0.355 1.2 0 0 3
Common green magpie Cissa chinensis
year 0.836 0 0.36 0.9 4
null 0.164 3.3 0 0 3
Sumatran laughingthrush Garrulax bicolor
year 0.985 0 0.8 0.8 4
null 0.015 8.3 0 0 3
Chestnut-capped laughingthrush Garrulax mitratus
year 0.85 0 0.46 0.64 4
null 0.15 3.5 0 0 3
B. Birds caught by trappers over time
Silver-eared mesia Leiothrix argentauris
year 0.956 0 0.55 0.73 4
null 0.044 6.1 0 0 3
Common green magpie Cissa chinensis
null 0.806 0 0 0 3
year 0.194 2.8 0.21 0.77 4
Sumatran laughingthrush Garrulax bicolor
null 0.7 0 0 0 3
year 0.3 1.7 0.18 0.7 4
Chestnut-capped laughingthrush Garrulaxmitratus
null 0.557 0 0 0 3

year 0.443 0.5 0.13 0.7 4
Supporting References
Gelman, A., J. B. Carlin, H. S. Stern, D. B. Dunson, A. Vehtari, and D. B. Rubin 2013. Bayesian
data analysis. CRC Press, Boca Raton, FL, USA.
Plummer, M. 2003. JAGS: A Program for Analysis of Bayesian Graphical Models Using Gibbs
Sampling in F. L. K Hornik, A Zeileis, editor. Proceedings of the 3rd International
Workshop on Distributed Statistical Computing ISSN 1609-395X, URL
http://www.ci.tuwien.ac.at/Conferences/DSC-2003/Proceedings/. Vienna.
Plummer, M. 2015. rjags: Bayesian Graphical Models using MCMC. R package version 3-15.
http://CRAN.R-project.org/package=rjags.
Shepherd, C. R. 2006. The bird trade in Medan, north Sumatra: an overview. Birding Asia 5:16-
24.
Yustikasari, E. 2008. Study on community structure, conservation status, and forest strata
utilization of commercial bird species in Way Canguk, Bukit Barisan Selatan. Universitas
Padjajaran, Jatinangor, Java Barat, Indonesia.

●
●
●
●
●
●●
●
●
●
●
●●●●
●●●●●●●
●
●●
●●●●
●
●
●
●
●●
●
●
●●
●●
●
●
●
●●●●
●
●●
●
●●
●●
●
●
●●●●
●●●●
●●●●●●●●
●●
●
●
0.0 0.2 0.4 0.6
0.0
0.1
0.2
0.3
0.4
0.5
0.6
Observed λi
Pre
dict
ed λ
i
A
●
●
●
●
●
●●
●
●
●
●
●●●●
●●●
●●
● ●●
●
●
●●●●
●
●
●
●
●●
●
●●
●
●
●●
●
●
●●●●
●
●●
●
●●
●
●
●
●
●
●●●
●● ●●
●●
●●●●●
●
● ●●
●
0.0 0.5 1.0 1.5
0.0
0.5
1.0
1.5
Observed σλiP
redi
cted
σλ i
B
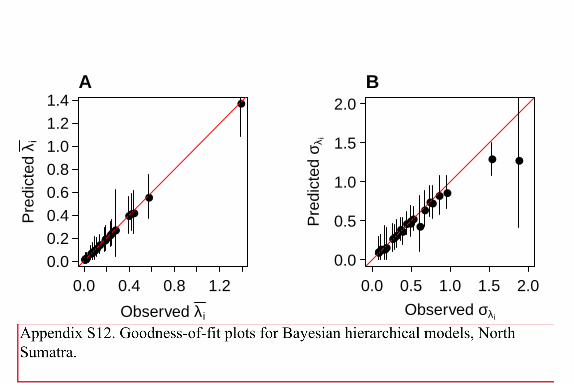
●●●
●
●
●
●
●●
●
●
●
●●
●●
●●
●●
●
●
●
●
●●
●
0.0 0.4 0.8 1.2
0.00.20.40.60.81.01.21.4
Observed λi
Pre
dict
ed λ
i
A
●
●●
●
●
●
●
●
●
●
●
●
●
●
●
●
●●●
●
●
●
●
●
●●
●
0.0 0.5 1.0 1.5 2.0
0.0
0.5
1.0
1.5
2.0
Observed σλiP
redi
cted
σλ i
B

1970 1980 1990 2000 2010
0.5
1.0
1.5
2.0
●●
●
●●
●
●
●
●
Leiothrix argentauris
1970 1980 1990 2000 2010
12
34
●●
●●
●
●
●
●
●●
●●●
Cissa chinensis
1970 1980 1990 2000 2010
12
34
●
●●●
●
●
●
●
●
●●
●
●
Garrulax bicolor
1970 1980 1990 2000 2010
0.5
1.0
1.5
2.0
2.5
3.0
3.5
●●
●●
●
●
●
●●
●
●
●●●●
●
●
●● ●
Garrulax mitratus
Year
Num
ber o
f hou
rs s
pent
sea
rchi
ng
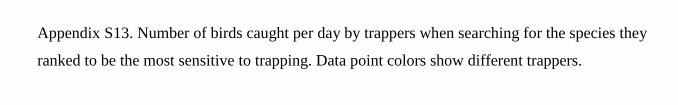
Appendix S13. Number of birds caught per day by trappers when searching for the species they
ranked to be the most sensitive to trapping. Data point colors show different trappers.

1970 1980 1990 2000 2010
02
46
810
●●●
●
●
●
●
●
●
●●
●● ●● ●
Leiothrix argentauris
1970 1980 1990 2000 2010
02
46
810
●●
●
●
●
●●
●
●
●●●
Cissa chinensis
1970 1980 1990 2000 2010
05
1015
2025
30
●●
●
●
●
●
●
●
●
●●
●●●
Garrulax bicolor
1970 1980 1990 2000 2010
05
1015
2025
30
●●
●
●
●
●●
●
●
●
●
●
●
●
●●●●
●●●● ● ●
Garrulax mitratus
Year
Num
ber o
f bird
s ca
ught
per
day

Appendix S14. Time spent by trappers searching for the species they ranked to be the most
sensitive to trapping. Data point colors show different trappers.

●●●●
●●
●
●●
●
●●
●●●
●●●●●●●●●●
−0.25 −0.15 −0.05
0
20
40
60
80
100
Effect of price on temporal trend (α1)
% s
imul
atio
ns r
ejec
ting
H0

●●●●●●●
●●●
●●
●●
●●
●●
●●
●●●●●
−0.25 −0.15 −0.05
0
20
40
60
80
100
Effect of price on spatial trend (α1)
% s
imul
atio
ns r
ejec
ting
H0