measuring the economic effect of global warming on … the economic effect of global warming on...
TRANSCRIPT

NBER WORKING PAPER SERIES
MEASURING THE ECONOMIC EFFECT OF GLOBAL WARMING ON VITICULTUREUSING AUCTION, RETAIL, AND WHOLESALE PRICES
Orley C. AshenfelterKarl Storchmann
Working Paper 16037http://www.nber.org/papers/w16037
NATIONAL BUREAU OF ECONOMIC RESEARCH1050 Massachusetts Avenue
Cambridge, MA 02138May 2010
We are indebted to many people in the Mosel Valley for assistance with our research, but particularlyto Rita and Clemens Busch of Pünderich. We are indebted to Kym Anderson, Victor Ginsburgh, RobertStavins and especially Michael Greenstone and Victor Tremblay for helpful comments on an earlierdraft of this paper. We thank Hubert Schnabel of Vereinigte Hospitien Trier for providing the wholesaleprice data. The views expressed herein are those of the authors and do not necessarily reflect the viewsof the National Bureau of Economic Research.
NBER working papers are circulated for discussion and comment purposes. They have not been peer-reviewed or been subject to the review by the NBER Board of Directors that accompanies officialNBER publications.
© 2010 by Orley C. Ashenfelter and Karl Storchmann. All rights reserved. Short sections of text, notto exceed two paragraphs, may be quoted without explicit permission provided that full credit, including© notice, is given to the source.
Measuring the Economic Effect of Global Warming on Viticulture Using Auction, Retail,and Wholesale PricesOrley C. Ashenfelter and Karl StorchmannNBER Working Paper No. 16037May 2010JEL No. D44,L66,Q1,Q5,Q51
ABSTRACT
In this paper we measure the effect of year to year changes in the weather on wine prices and wineryrevenue in the Mosel Valley in Germany in order to determine the effect that climate change is likelyto have on the income of wine growers. A novel aspect of our analysis is that we compare the estimatesbased on auction, retail, and wholesale prices.
Although auction prices are based on actual transactions, they provide a thick market only for highquality, expensive wines and may overestimate climate’s effect on farmer revenues. Wholesale prices,on the other hand, do provide broad coverage of all wines sold and probably come closest to representingthe revenues of farmers. Overall, we estimate a 1°C increase in temperature would yield an increasein farmer revenue of about 30 percent.
Orley C. AshenfelterCenter for Labor EconomicsUniversity of California631B Evans HallBerkeley, CA 94720-3880and [email protected]
Karl StorchmannDepartment of EconomicsNew York UniversityNew York, NY [email protected]
3
1. Introduction
In this paper we assess the economic impact of global warming on viticulture in
the Mosel Valley of Germany. There are two features that are unique to the Mosel region.
First, located between 49.610 and 50.340 latitude, all Mosel vineyards are situated near
the far northern boundary for commercial grape growing. As a result, quality wine
production in the Mosel Valley depends on special site characteristics and favorable
weather conditions to ensure winter survival and ripening (Ashenfelter and Storchmann,
2010). Thus wine prices, crop yields, and wine quality are crucially dependent on weather
and vary widely from year to year. Second, within the comparatively narrow Mosel
Valley, most vineyards are planted on steep slopes of rocky, relatively unfertile soil
(mostly slate) that is inappropriate for crops other than vines. Therefore, given the limited
possibilities of crop substitution or alternative land usages, temperature-induced changes
in viticulture directly reflect the economic impact of global warming in this part of
Germany.
We use the so-called “Ricardian” approach applied by Mendelsohn, Nordhaus,
and Shaw (1994) to the study of the effects of climate change on agriculture. Their
empirical research, based as it is on hedonic models from highly aggregated data, has
been critiqued and extended to consider difficult issues of functional form and
specification by Schlenker, Hanemann, and Fisher (2005 and 2006), and Deschênes and
Greenstone (2007). These more recent studies generally find considerable heterogeneity
in the expected effects of climate change. Depending on the region considered, climate
change may lead to either positive or negative effects on land values, with considerable
uncertainty about the aggregate effect. Our approach follows this more recent work by
studying a very specific area and type of crop and by establishing the economic relation
using time-series variation in the weather.
Particularly, we provide and compare the results of three models based on
different price data: retail, wholesale, and auction prices. The empirical results of our
models are broadly similar and indicate that the vineyards of the Mosel Valley will
increase in value under a scenario of global warming, and perhaps by a considerable
4
amount. Vineyard and grape prices increase more than proportionally with greater
ripeness; we estimate that a 3°C increase in temperature would more than double the
value of this vineyard area, while a 1°C increase would increase vinyard prices by more
than 25 percent.
II. Data and Model
This analysis is aimed at analyzing the effect of year to year fluctuations in the
weather on prices and profits of viticulture in the Mosel Valley of Germany. Since
overall per hectare cost is independent of changes in temperature and precipitation
(Ashenfelter and Storchmann, 2010), our study focuses on revenue and its components.
In general, we examine per hectare revenue from 1997 to 2008 in each of the five
viticultural districts (called Bereich) of the Mosel valley, the Upper Mosel (from
Luxemburg to the City of Trier), the Middle Mosel (from Trier to the village of
Pünderich), the Lower Mosel (from Zell to the Rhine River), and the two Mosel
tributaries: the Saar and the Ruwer Valley.
Although revenue is the simple product of price and crop yield, there is an added
complexity in the study of the prices of German wines that results from the way that the
wines are labeled and marketed. German wines are classified (and labeled) according to
the natural sugar content of the unfermented grape must (freshly pressed grape juice), as
measured on the Oechsle scale.1 In general, sweeter unfermented musts lead to higher
alcohol volumes (and not necessarily sweeter wines), more aroma, and thus higher
quality. In ascending order, the quality levels and Oechsle thresholds for Mosel wines are
Quality Wine (lowest quality category, no oOe requirement), Kabinett (70oOe), Spätlese
(76oOe), Auslese (83 oOe), Beerenauslese (BA) (110oOe ), Eiswein2 (110oOe ), and
Trockenbeerenauslese (TBA) (150 oOe). A primary quality distinction is that, with the 1 Degrees Oechsle (°Oe ) is used in Germany and Switzerland and denotes the specific weight of the must compared to the weight of water at a temperature of 20oC, while much of the English-speaking world uses a measure called brix. One liter of water weighs 1000g, which equals zero degrees Oechsle. Accordingly, grape must with a mass of 1084 grams per liter has 84 °Oe. Since the mass difference between equivalent volumes of must and water is almost entirely due to the dissolved sugar in the must, degrees Oechsle measures the relative sweetness of the grape juice. Approximately, one brix is equal to one degree Oechsle divided by 4.35 (Peynaud, 1984). 2 The quality category Eiswein has the same Oechsle requirement as Beerenauslese (i.e., 110oOe). However, Eiswein grapes need to be harvested while frozen.

5
exception of Quality Wine, it is illegal to add sugar to the must. As a result, wine prices
are distinguished by the vineyard where the grapes are grown and by the quality level.
Although revenue per hectare data are not readily available, they can be computed
by multiplying crop yield data by the average prices for each district and each wine
quality level. Let Ridt, Pidt, and Qidt denote per hectare revenue, price, and quantity
produced of wine quality level i in district d and at time t; then
(1)
7
1
5
1
)(i d
idtidtidt QPR .
Total revenue in wine district d will be determined by prices and quantities produced in
each quality category.
Wine production data by district and quality category for the years 1997 to 2008
were prepared and provided by the Statistical Office of the State of Rheinland-Pfalz and
its agricultural commission (Landwirtschaftskammer).3 Detailed production data for the
time period before 1997 are not available.
Wine prices by quality category and viticultural district are not readily available
but can be computed by drawing on various wine price data. We use three different
sources -- retail, wholesale, and auction data -- and generate quality- and district-specific
wine prices and revenue data.
Each data set has advantages and disadvantages. A disadvantage of the retail and
wholesale price data is that they refer to posted prices, which may not be transaction
prices. An advantage of these data is that they cover a wide range of Mosel wine
producers. The auction prices refer to actual transaction prices, but only a tiny fraction of
the very finest Mosel wines are sold at auction. As a result, the auction prices may not be
representative of the region more generally.
Our retail price data come from the 1994-2008 issues of the Gault Millau Wine
Guide for Germany (Diel and Payne, 1994-2008). The wine guide provides detailed
information about the wines’ characteristics such as age, geographical origin (vineyard
and wine district), and quality classification, and the data permit us to calculate wine
prices for each wine district and quality level accounting for other characteristics.
3 These data are available, by request, from the authors.
6
The wholesale price data come from the Mainz Wine Trade Fair (Mainzer
Weinbörse). Once a year for two days, the fair showcases the wines of about 100 VDP
estates.4 The fair is open to the wine trade only. Our dataset covers the fair years 1993 to
2001 and contains a total of 1063 wines from the Mosel wine region (Mainzer
Weinbörse, 1993-2001).
Our auction price data come from the period 1981-2008 from the wine
associations VDP Grosser Ring5 and Bernkasteler Ring (VDP Grosser Ring, 1992-2008;
Bernkasteler Ring, 1981-2008). These groups of wineries have existed for more than 100
years and annually present and sell the latest vintage of their wines at the retail level.
However, over the last 40 years, the character and role of their annual wine auctions has
fundamentally changed. During the first decades after their establishment the two
associations marketed the majority of their wines through auctions. Auctions were held
twice a year; most wines were sold in 1000 liter barrels; and the wines that are offered
comprised all categories of the quality spectrum with an emphasis on lower qualities.
Now, each association holds only one auction per year; all offered wines are
bottled; and bulk wine (lower qualities sold in barrels) has not been put to auction since
1974. For instance, in 1954, the then 24 member wineries of the Bernkasteler Ring
auctioned a total of 447,700 bottle-equivalents of wine. The majority of these wines were
below the Spätlese quality level, and almost all were sold in bulk. In contrast, in 2008, the
now 34 member wineries auctioned off a total of just 3,150 bottles, only 480 of which
were below the Spätlese quality level. That is, while wine auctions in the Mosel Valley
may have been representative of the regional wine production at large for most of the past
century, they now instead serve as a vehicle for showcasing a few high-quality wines.
Our auction sample focuses almost exclusively on the upper end of the quality scale; only
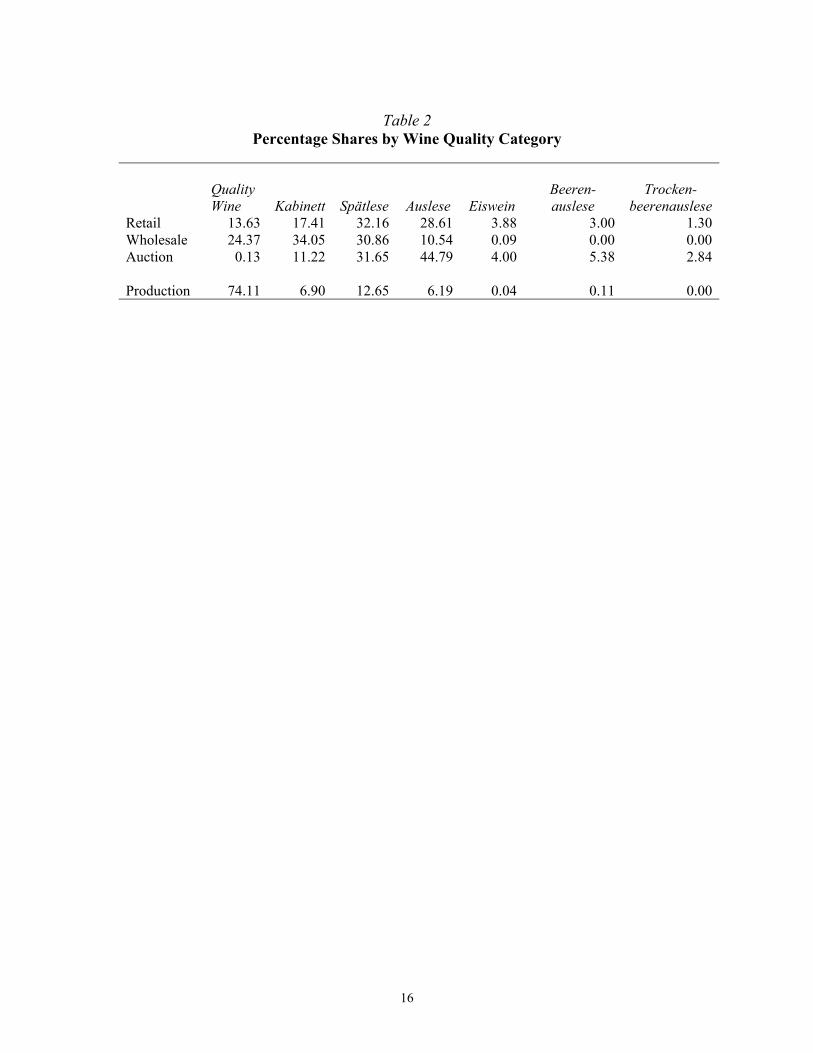
0.13% of all wines auctioned are Quality Wines (lowest quality category). In comparison,
74.1% of all wines produced are Quality Wines (see also Table 2).
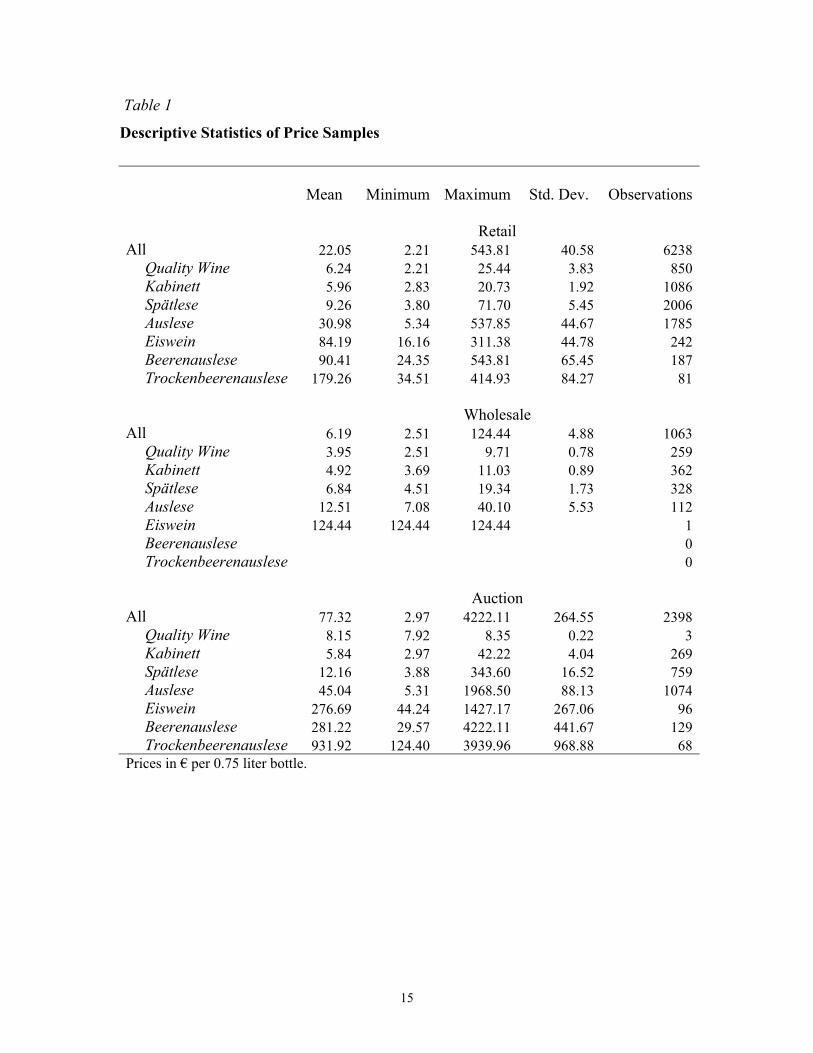
Table 1 provides the descriptive statistics of the three price samples. It is apparent
that the sample characteristics are largely different. While the average real wholesale
4 In Germany, most high-quality wine producers are organized in the Association of German Quality Wine Estates (Verband Deutscher Prädikatsweingüter VDP). See also Schnabel and Storchmann (2010). 5 Data for VDP Grosser Ring were available only from 1992 onward.

7
price per 0.75 liter bottle equals €6.19 ($8.04),6 this is €22.05 ($28.67) and €77.32
($100.52) for the retail and auction samples, respectively. These differences are even
larger for the maximum prices. While the maximum wholesale price equals €124.44
($161.77), the most expensive wine at auction costs €4211.11 ($5474.44). It is evident
that the price differences are due to differences within each quality category as well as to
the divergent structure of wines sold. Within each quality category, auction prices rank
the highest, while wholesale prices are the lowest. In addition, while the wholesale
sample does not comprise any Beerenauslese and Trockenbeerenauslese wines, these
quality categories constitute a substantial part of all wine sold at auctions.
[Table 1 and Table 2 about here]
Table 2 reports the quality category shares of each price sample in comparison to
the actual wine production from 1997 to 2008. It is apparent that the auction price sample
is not likely to represent the Mosel wine production as a whole. While more than 12% of
all wines sold at auction are of Eiswein, Beerenauslese, or Trockenbeerenauslese quality,
this segment represents less than 0.2% of the overall production in the Mosel valley.
As we shall see, the response of prices to the average temperature during the
growing season is very sensitive to the particular type of wine quality that is being
studied, making it likely that these data may suffer from selection bias. In particular,
since the prices of the higher quality wine types are much more responsive to temperature
increases, the auction price data are likely to overstate dramatically the average effect of
a temperature change on prices. Although we report the results using these data for
completeness, we do not rely on them for our primary analysis.
Table 3 provides the descriptive statistics of the exogenous variables used for the
three price models. For each sample, the difference between minimum and maximum
growing season temperatures is well above 2 degree Celsius, a magnitude that equals the
average expected warming for Europe for the next 90 years (Intergovernmental Panel on
Climate Change, 2007).
6 Assuming an exchange rate of $1.30/€.
8
Wine production data by district and quality category for the years 1997 to 2008
were prepared and provided by the Statistical Office of the State of Rheinland-Pfalz and
its agricultural commission (Landwirtschaftskammer). Table 3 reports the respective
descriptive statistics. Since the production of high-quality wines stipulates a cap on yields
per hectare the data already reflect farmers’ adjustments to weather changes. Thus, in
years with beneficial weather grape growers regularly remove some part of the crop in
order to obtain higher quality fruit. "Yield reduction," as it is known, is common practice
in the Saar, the Ruwer, the Middle Mosel and the Lower Mosel regions. Only in the
Upper Mosel, where most wines are of lower quality and yield reduction is less common,
do crop yields fully reflect weather variation.
[Table 3 about here]
III. Results
As originally shown by Ashenfelter and collaborators for the Bordeaux wine
region, wine quality and price are highly depended on weather (Ashenfelter et al., 1995).
In northern latitudes warmer and drier growing seasons are expected to lead to higher
fruit quality. The precise relation varies with the grape type, but this relation has been
quantified in many viticultural areas.7 Winter rainfall has also been shown to have a
positive effect on fruit and wine quality, although this result has not been found for all of
the viticultural areas where it has been studied. Our primary interest is in the effect of
temperature on vineyard profits, but to the extent that rainfall and temperatures are
correlated it is essential to control for these other aspects of the weather in the
regressions. Therefore, the weather variables that we include in the regressions are (a) the
average temperature over the growing season (Temp Growing Season), (b) the total
rainfall in the growing season (Rain Growing Season), and (c) the total rainfall in the
winter preceding the growing season (Rain Winter).
[Table 4 about here]
7 See, for example, Ashenfelter and Storchmann (2010), Ashenfelter (2008), Haeger and Storchmann (2006), Jones and Storchmann (2001), Ashenfelter et al. (1995), and Ashenfelter and Byron (1995).
9
Columns (1) and (2) of Table 4 contain the results of the price equation drawing
on retail and wholesale prices, respectively.8 Since wines are labeled by their (1) quality
level (in descending order of quality Trockenbeerenauslese (TBA), Beerenauslese (BA),
Eiswein, Auslese, Spätlese, Kabinett, Quality Wine), and (2) their regions, we have
interacted the temperature variable with each of these categories in order to produce
quality- and region-specific temperature coefficient estimates. Quality Wine from the
Upper Mosel serves as reference. It is apparent that warmer weather has a significantly
positive effect on prices. Higher wine qualities, such as Trockenbeerenauslese,
Beerenauslese and Eiswein benefit from a warmer growing season more than do lower
qualities. In addition, the marginal effect of temperature increases is the highest in the
districts of the Mosel tributaries Saar and Ruwer. The rainfall variables are either
insignificant or have unexpected signs. The rainfall variables are either insignificant or
have unexpected signs. This may reflect the fact that rainfall, in contrast to temperature,
exhibits large local variations. While temperature changes at different locations in the
Mosel Valley (and, in fact, in most of Europe; see Storchmann, 2005) are closely
correlated, the precipitation data measured at a weather station some 50 miles away may
be unrelated to the actual rainfall in the vineyard.
Aside from weather, a wine’s quality is determined by its age. We included a
variable age which denotes a wine’s age when it was offered. Most age-worthy wines
increase in value as they grow older, but most lower quality table wines do not. The
overall effect, therefore, is unclear.
The results in column (3) indicate that auction prices are considerably more
responsive to temperature changes than are retail and wholesale prices, as we expected.
Interestingly, the age effect for the wholesale sample is negative, which may reflect the
focus on lower quality wines that do not benefit from greater maturity.
[Table 5 about here]
8 Note that the wholesale price sample does not contain prices for wines from the Lower Mosel district nor prices for Beerenauslese and Trockenbeerenauslese qualities.

10
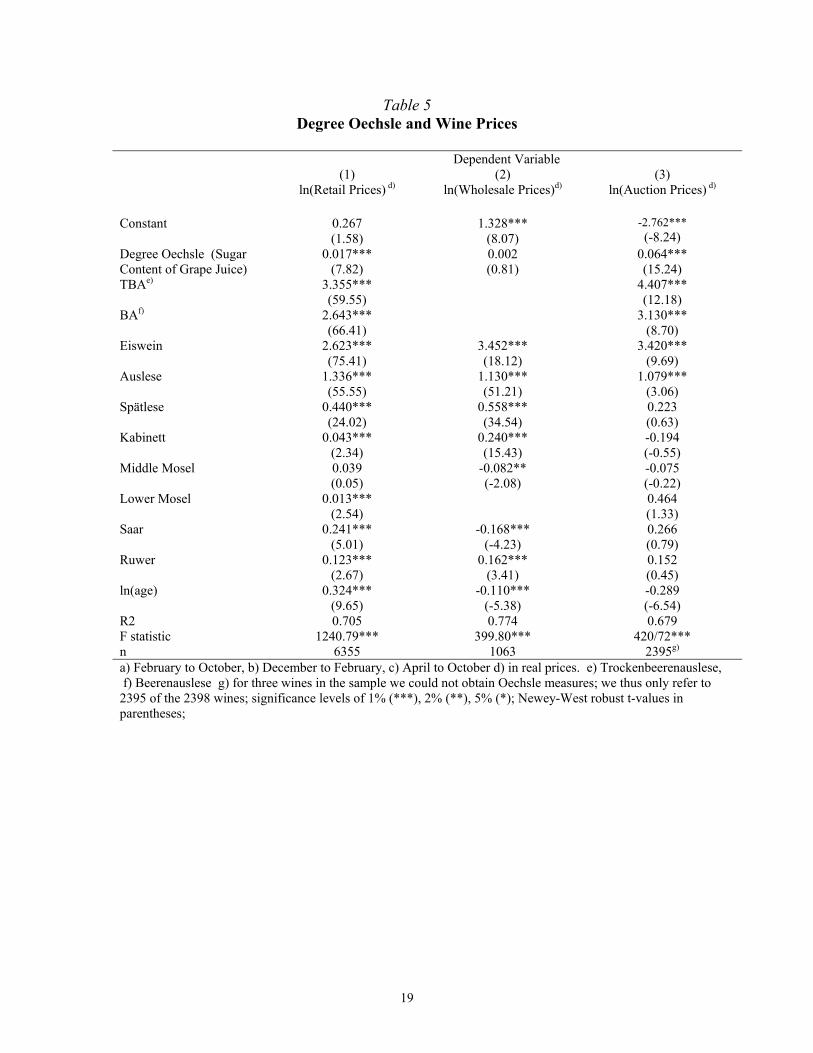
However, the use of these generated price data to compute revenue data, which
will then again be regressed on weather data (see Table 6), might predetermine the
weather-sensitivity of wine revenues. We thus generate district and quality-level specific
price data by referring to the sugar content of the grape must (degree Oechsle) instead of
weather. The results of these models are similar to the weather-related regressions and are
reported in Table 5.
To obtain an overall estimate of temperatures on gross revenue per hectare we
must combine information on crop yields by region and quality level with the average
prices by region and quality level.
Figure 1 shows the fraction of wines of Auslese and higher qualities as a part of
the entire production in selected districts and the Mosel region as a whole over the period
1997-2008. The Ruwer region exhibits the highest variance with a range from 1% in
1998 to 52% in 2003. Figure 1 also shows the average growing season temperature over
the same period, and it is apparent that there is greater production of high quality wines in
warmer years. The result is that (1) increases in temperatures result in increases in wine
prices within each quality segment and (2) increases in temperatures also shift the quality
structure of wines produced upward.
Another interesting feature of Figure 1 is the apparent upward trend in
temperatures.9 At the same time there is also an apparent upward trend in the amount of
higher quality wine being produced. This has led many observers to remark on the
increased prosperity of the Mosel wine region in recent years. Figure 2 shows the annual
growing season temperatures in the Mosel valley from 1960 to 2009. It is evident that the
increase in average growing season temperatures began in the mid 1980s, well before our
sample period.10 It is unclear, of course, whether this is a result of permanent climate
change or something more transitory.
[Figure 1, Figure 2]
9 Using data over the longer period from 1960 to 2006, a regression of average temperature on a trend variable (and a constant term) yields a coefficient of 0.034 at the 0.01% significance level. Thus, since 1960 average growing season temperatures in the Mosel valley have increased by 1.6 Centigrade. 10 For longer time series data on weather and wine quality from the year 1700 onward see Storchmann (2005).

11
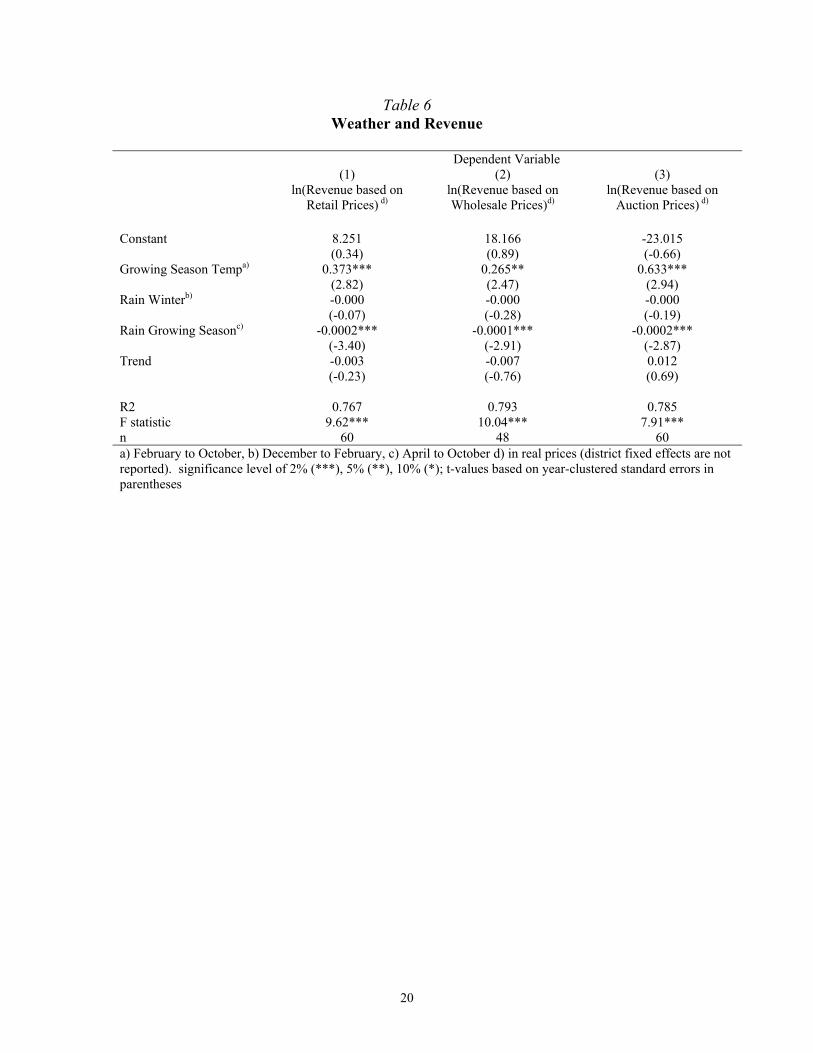
Table 6 reports the relation between per hectare revenue and weather. In addition
to weather variables we also included a trend variable to control for possible time-
dependent effects such as technological progress or changing marketability of Mosel
wines as a whole. It is apparent that revenue per hectare significantly increases with
warmer weather. However, the extent of this effect is dependent on the underlying price
sample of the revenue data.
[Table 6 about here]
While the auction price-based sample suggests revenue increases of more than
63% per centigrade, the wholesale and retail price-based revenue date suggest revenue
increases between 27% and 37% per centigrade. It is apparent that the auction price-
based sample measures the impact of temperature changes for high-end wine producers
only. The focus of auctions on high-end wines suggests that the auction price-based
sample is likely to overestimate the overall impact of temperature on revenue. In contrast,
the other two samples, although based on very different price data, lead to similar results
that are in a plausible range for the overall wine production in the Mosel valley. In
addition, an entirely different model by Ashenfelter and Storchmann (2010), employing a
model of solar radiation, also suggests revenue increases of about 30% per temperature
increase by one centigrade. The rainfall variables are either insignificant or have
unexpected signs. On the assumption that cost and temperature changes are not
correlated (as shown by Ashenfelter and Storchmann, 2010), these revenue changes will
translate directly into changes in profits and land values. Figure 3 displays the model
results in graphical form.
[Figure 3 about here]
IV. Conclusion
In this paper we have computed estimates of the effect of annual time-series
weather changes on vineyard profitability and revenue. We provide and compare the
results of three models that are based on different price data: retail, wholesale, and
auction prices. All models suggest that the vineyards of the Mosel Valley will increase in
value under a scenario of global warming, and perhaps by a considerable amount. We
found that auction prices are likely to misrepresent the actual structure of Mosel wines

12
produced, since auctions focus on the high end of the quality scale. They thus may
overestimate the impact of temperature increases. In comparison, retail and wholesale
prices lead to almost identical results that also are consistent with the results of
Ashenfelter and Storchmann (2010), who use a hedonic model of solar radiation.
As is well known, there are likely to be winners and losers from any potential
climate change. Wine revenue increases more than proportionally with greater ripeness,
so that we estimate a 3°C increase in temperature would more than double the value of
this vineyard area, while a moderate 1°C increase would raise revenue by about 30
percent.
There are several limitations of these results: First, our empirical analysis does
not take account of general equilibrium effects that might result in a restructuring of land
prices. The Mosel Valley is suited primarily for grape growing only, so a change in the
relative price of vineyards of different quality that would be induced by climate change
could have a dramatic effect on our calculations. Second, our results provide only a
small part of an overall appraisal of the role of climate change on agricultural values.
There are no doubt places where increased temperatures will decrease the quality of wine
grapes because of excessive heat. Only additional research will provide the evidence to
evaluate these issues more completely.
Acknowledgements
We are indebted to many people in the Mosel Valley for assistance with our research, but
particularly to Rita and Clemens Busch of Pünderich. We are indebted to Kym Anderson,
Victor Ginsburgh, Robert Stavins, and especially Michael Greenstone for helpful
comments on an earlier draft of this paper. We thank Hubert Schnabel of Vereinigte
Hospitien Trier for providing the wholesale price data. We also thank the editor of this
series, Victor Tremblay, and two anonymous referees whose comments helped to
improve this paper substantially.
References

13
Ashenfelter, O. (2008). Predicting the Prices and Quality of Bordeaux Wines. The
Economic Journal 118 (June), F174-F184.
Ashenfelter, O., Ashmore, D. & Lalonde, R. (1995). Bordeaux Wine Vintage
Quality and the Weather. Chance 8(4), 7-14.
Ashenfelter, O. & Byron, R.P. (1995). Predicting the quality of an unborn grange. The
Economic Record 71, No. 212, 40-53.
Ashenfelter, O. & Storchmann, K. (2010). Using Hedonic Models of Solar Radiation and
Weather to Assess the Economic Effect of Climate Change: The Case of Mosel Valley
Vineyards. The Review of Economics and Statistics, 92(2), 333-349.
Bernkasteler Ring (1981-2008). Auktionsergebnisse. Annual Reports. Bernkasteler Ring,
Bernkastel-Kues.
Deschênes, O. & Greenstone, M. (2007). The Economic Impacts of Climate Change:
Evidence from Agricultural Output and Random Fluctuations in Weather." American
Economic Review, 97(1), 354–385.
Diel, A. & Payne, J. (1994-2008). Weine Guide Deutschland. (Munich: Wilhelm Heyne.)
Haeger, J.W. & Storchmann, K. (2006). Prices of American Pinot Noir Wines: Climate,
Craftsmanship, Critics. Agricultural Economics, 35, 67-78.
Intergovernmental Panel on Climate Change (2007). Climate Change 2007: Synthesis
Report. (Geneva, Switzerland: IPCC.)
14
Jones, G. & Storchmann, K. (2001). Wine Market Prices and Investment under
Uncertainty: An Econometric Model for Bordeaux Crus Classés. Agricultural Economics
26, 115-133.
Mainzer Weinbörse (1993-2001). Mainzer Weinbörse: Die Fachmesse für Gastronomie
und Fachhandel. (Mainz: Mainzer Weinbörse.)
Mendelsohn, R., Nordhaus, W.D. & Shaw, D. (1994). The Impact of Global Warming on
Agriculture: A Ricardian Analysis. American Economic Review, 84, 753-771.
Peynaud, E. (1984), Knowing and Making Wine. (New York: Wiley.)
Schlenker, W., Hanemann, W.M. & Fisher, A. (2005). Will U.S. Agriculture Really
Benefit from Global Warming? Accounting for Irrigation in the Hedonic Approach,
American Economic Review, 95, 395-406.
Schlenker, W., Hanemann, W.M. & Fisher, A. (2006). The Impact of Global Warming on
U.S. Agriculture: An Econometric Analysis of Optimal Growing Conditions, Review of
Economics and Statistics, 88, 113-125.
Schnabel, H. & Storchmann, K. (2010). Prices as Quality Signals: Evidence from the
Wine Market. Journal of Agricultural & Food Industrial Organization, 8, Article 2.
Storchmann, K. (2005). English Weather and Rhine Wine Quality: An Ordered Probit
Model. Journal of Wine Research, 16(2), 102-119.
VDP Grosser Ring (1992-2008). Auktionsergebnisse. Annual Reports. (Trier: VDP
Grosser Ring.)
15
Table 1
Descriptive Statistics of Price Samples
Mean Minimum
Maximum Std. Dev.
Observations
Retail All 22.05 2.21 543.81 40.58 6238
Quality Wine 6.24 2.21 25.44 3.83 850Kabinett 5.96 2.83 20.73 1.92 1086Spätlese 9.26 3.80 71.70 5.45 2006Auslese 30.98 5.34 537.85 44.67 1785Eiswein 84.19 16.16 311.38 44.78 242Beerenauslese 90.41 24.35 543.81 65.45 187Trockenbeerenauslese 179.26 34.51 414.93 84.27 81
Wholesale All 6.19 2.51 124.44 4.88 1063
Quality Wine 3.95 2.51 9.71 0.78 259Kabinett 4.92 3.69 11.03 0.89 362Spätlese 6.84 4.51 19.34 1.73 328Auslese 12.51 7.08 40.10 5.53 112Eiswein 124.44 124.44 124.44 1Beerenauslese 0Trockenbeerenauslese 0
Auction All 77.32 2.97 4222.11 264.55 2398
Quality Wine 8.15 7.92 8.35 0.22 3Kabinett 5.84 2.97 42.22 4.04 269Spätlese 12.16 3.88 343.60 16.52 759Auslese 45.04 5.31 1968.50 88.13 1074Eiswein 276.69 44.24 1427.17 267.06 96Beerenauslese 281.22 29.57 4222.11 441.67 129Trockenbeerenauslese 931.92 124.40 3939.96 968.88 68
Prices in € per 0.75 liter bottle.
16
Table 2
Percentage Shares by Wine Quality Category
Quality Wine Kabinett Spätlese Auslese Eiswein
Beeren-auslese
Trocken-beerenauslese
Retail 13.63 17.41 32.16 28.61 3.88 3.00 1.30Wholesale 24.37 34.05 30.86 10.54 0.09 0.00 0.00Auction 0.13 11.22 31.65 44.79 4.00 5.38 2.84 Production 74.11 6.90 12.65 6.19 0.04 0.11 0.00

17
Table 3 Descriptive Statistics of Exogenous Variables
Mean Maximum Minimum Std. Dev Retail Temperature Growing Season (degree Co) 12.27 13.02 10.89 0.59Rain Growing Season (mm) 4735.92 6988 2777 1222.05Rain Winter (mm) 2000.17 3463 1198 682.85Age (years) 1.12 3 1 0.33 Wholesale Temperature Growing Season (degree Co) 12.18 12.79 10.89 0.57Rain Growing Season (mm) 4703.03 6988 2777 1108.96Rain Winter (mm) 2036.08 3463 1198 807Age (years) 1.17 8 1 0.58 Auction Temperature Growing Season (degree Co) 12.09 13.02 10.50 0.68Rain Growing Season (mm) 4530.09 6988 2353 948.98Rain Winter (mm) 1944.37 3463 616 591.76Age (years) 2.08 80 1 3.99 Crop Yields 1997-2008 (hl/ha) Mosel total 101.4 122.2 80.8 11.89
Saar 80.4 107.8 61.1 14.35Ruwer 67.6 90.7 50.6 11.88Upper Mosel 188.9 309.6 60.1 76.02Middle Mosel 107.9 130.8 83.6 12.84Lower Mosel 96.6 116.2 81.8 11.15

18
Table 4 Weather and Wine Prices
Dependent Variable (1) (2) (3) ln(Retail Prices) d) ln(Wholesale Prices)d) ln(Auction Prices) d) Constant 1.102***
(7.29) 1.347*** (10.09)
-1.926(-46.71)
Growing Season Tempa) 0.042*** (2.86)
0.014 (1.15)
0.324*** (2.95)
TBAe)* Growing Season Temp a)
0.275** (59.14)
0.327*** (10.95)
BAf)* Growing Season Temp a)
0.217*** (68.76)
0.238*** (8.10)
Eiswein* Growing Season Temp a)
0.215*** (73.14)
0.284*** (18.14)
0.253*** (8.76)
Auslese* Growing Season Temp a)
0.110*** (55.28)
0.092*** (51.67)
0.075*** (2.59)
Spätlese* Growing Season Temp a)
0.037*** (24.35)
0.046*** (34.93)
0.002 (0.03)
Kabinett* Growing Season Temp a)
0.004*** (2.59)
0.020*** (15.59)
-0.041 (-1.44)
Middle Mosel* Growing Season Temp a)
0.003 (0.68)
-0.006* (-1.97)
0.010 (0.41)
Lower Mosel* Growing Season Temp a)
0.009** (2.21)
0.048 (1.85)
Saar* Growing Season Temp a)
0.019*** (4.81)
-0.013*** (-4.09)
0.036 (1.41)
Ruwer* Growing Season Temp a)
0.010*** (2.69)
0.004* (0.14)
0.029 (1.13)
Rain Winterb) -0.001*** (-4.95)
0.014*** (3.59)
-0.002*** (-4.45)
Rain Growing Seasonc) 0.0002*** (2.57)
-0.0002 (-0.45)
0.001*** (5.26)
ln(age) 0.341*** (9.83)
-0.0002*** (-3.50)
-0.094 (-1.87)
R2 0.705 0.776 0.673 F statistic 1060.92*** 331.80*** 350.80*** n 6355 1063 2398 a) February to October, b) December to February, c) April to October d) in real prices., e) Trockenbeerenauslese, f) Beerenauslese; significance levels of 1% (***), 2% (**), 5% (*); Newey-West robust t-values in parentheses;
19
Table 5 Degree Oechsle and Wine Prices
Dependent Variable (1) (2) (3) ln(Retail Prices) d) ln(Wholesale Prices)d) ln(Auction Prices) d) Constant 0.267
(1.58) 1.328***
(8.07) -2.762***(-8.24)
Degree Oechsle (Sugar Content of Grape Juice)
0.017*** (7.82)
0.002 (0.81)
0.064*** (15.24)
TBAe) 3.355*** (59.55)
4.407*** (12.18)
BAf) 2.643*** (66.41)
3.130*** (8.70)
Eiswein 2.623*** (75.41)
3.452*** (18.12)
3.420*** (9.69)
Auslese 1.336*** (55.55)
1.130*** (51.21)
1.079*** (3.06)
Spätlese 0.440*** (24.02)
0.558*** (34.54)
0.223 (0.63)
Kabinett 0.043*** (2.34)
0.240*** (15.43)
-0.194 (-0.55)
Middle Mosel 0.039 (0.05)
-0.082** (-2.08)
-0.075 (-0.22)
Lower Mosel 0.013*** (2.54)
0.464 (1.33)
Saar 0.241*** (5.01)
-0.168*** (-4.23)
0.266 (0.79)
Ruwer 0.123*** (2.67)
0.162*** (3.41)
0.152 (0.45)
ln(age) 0.324*** (9.65)
-0.110*** (-5.38)
-0.289 (-6.54)
R2 0.705 0.774 0.679 F statistic 1240.79*** 399.80*** 420/72*** n 6355 1063 2395g) a) February to October, b) December to February, c) April to October d) in real prices. e) Trockenbeerenauslese, f) Beerenauslese g) for three wines in the sample we could not obtain Oechsle measures; we thus only refer to 2395 of the 2398 wines; significance levels of 1% (***), 2% (**), 5% (*); Newey-West robust t-values in parentheses;
20
Table 6 Weather and Revenue
Dependent Variable (1) (2) (3) ln(Revenue based on
Retail Prices) d) ln(Revenue based on Wholesale Prices)d)
ln(Revenue based on Auction Prices) d)
Constant 8.251
(0.34) 18.166 (0.89)
-23.015 (-0.66)
Growing Season Tempa) 0.373*** (2.82)
0.265** (2.47)
0.633*** (2.94)
Rain Winterb) -0.000 (-0.07)
-0.000 (-0.28)
-0.000 (-0.19)
Rain Growing Seasonc) -0.0002*** (-3.40)
-0.0001*** (-2.91)
-0.0002*** (-2.87)
Trend -0.003 (-0.23)
-0.007 (-0.76)
0.012 (0.69)
R2 0.767 0.793 0.785 F statistic 9.62*** 10.04*** 7.91*** n 60 48 60 a) February to October, b) December to February, c) April to October d) in real prices (district fixed effects are not reported). significance level of 2% (***), 5% (**), 10% (*); t-values based on year-clustered standard errors in parentheses

21
Figure 1 Growing Season Temperatures and High End Wine Production
Percentage production of Auslese+ Wines in Selected Mosel Districts
0.00%
10.00%
20.00%
30.00%
40.00%
50.00%
60.00%
1996 1997 1998 1999 2000 2001 2002 2003 2004 2005 2006 2007 2008 2009
10.5
11
11.5
12
12.5
13
Ruwer
Mosel Total
Middle Mosel
Avg. Growing Season Temperature
Pro
duct
ion
of A
usle
se+
Win
es
Tem
poer
atur
e in
Deg
ree
Cel
sius

22
Figure 2
Average Growing Season Temperatures in the Mosel Valley 1960 – 2009 in degree centigrade
Note: solid line is a five-year moving average
10
10.5
11
11.5
12
12.5
13
13.5
1960 1970 1980 1990 2000 2010

23
Figure 3 Temperature Changes and Percentage Changes in Revenue
0
100
200
300
400
500
600
0 1 2 3
Rev
enue
Cha
nge
in %
Temperature Increase in Centigrades
Revenue based on Auction Prices
Revenue based on Retail Prices
Revenue based on Wholesale Prices