measuring the angular dependence of betatron x-ray spectra ... · pdf filethis paper presents...
TRANSCRIPT

This content has been downloaded from IOPscience. Please scroll down to see the full text.
Download details:
IP Address: 128.97.89.229
This content was downloaded on 29/07/2014 at 19:40
Please note that terms and conditions apply.
Measuring the angular dependence of betatron x-ray spectra in a laser-wakefield accelerator
View the table of contents for this issue, or go to the journal homepage for more
2014 Plasma Phys. Control. Fusion 56 084016
(http://iopscience.iop.org/0741-3335/56/8/084016)
Home Search Collections Journals About Contact us My IOPscience
Plasma Physics and Controlled Fusion
Plasma Phys. Control. Fusion 56 (2014) 084016 (10pp) doi:10.1088/0741-3335/56/8/084016
Measuring the angular dependence ofbetatron x-ray spectra in a laser-wakefieldacceleratorF Albert1, B B Pollock1, J L Shaw2, K A Marsh2, J E Ralph1, Y-H Chen1,D Alessi1, A Pak1, C E Clayton2, S H Glenzer3 and C Joshi2
1 Lawrence Livermore National Laboratory, NIF and Photon Sciences, 7000 East Avenue, Livermore,CA 94550, USA2 Department of Electrical Engineering, University of California, Los Angeles, CA 90095, USA3 SLAC National Accelerator Laboratory, Stanford, CA 94309, USA
E-mail: [email protected]
Received 2 December 2013, revised 18 March 2014Accepted for publication 31 March 2014Published 22 July 2014
AbstractThis paper presents a new technique to measure the angular dependence of betatron x-rayspectra in a laser-wakefield accelerator. Measurements are performed with a stacked imageplates spectrometer, capable of detecting broadband x-ray radiation up to 1 MeV. It canprovide measurements of the betatron x-ray spectrum at any angle of observation (within a40 mrad cone) and of the beam profile. A detailed description of our data analysis is given,along with comparison for several shots. These measurements provide useful information onthe dynamics of the electrons are they are accelerated and wiggled by the wakefield.
Keywords: betatron x-rays, laser-wakefield accelerator, plasma
(Some figures may appear in colour only in the online journal)
1. Introduction
One of the most notable applications of laser-wakefieldaccelerators (LWFAs) [1–4] is the production of light sourceswith novel properties. For example, betatron x-ray radiationis produced when electrons are accelerated at an ultrahighgradient in a LWFA. In the three-dimensional (3D), highlynonlinear LWFA regime, when a short laser pulse with anintensity I > 1018 W cm−2 is focused inside a plasma, the laserponderomotive force completely expels the plasma electronsaway from the strong intensity regions to form an ion bubblein the wake of the pulse. Electrons trapped at the back of thisstructure are accelerated and wiggled by the focusing force ofthe more massive and immobile ions to produce broadband,synchrotron-like radiation in the keV energy range.
The theoretical properties of betatron x-ray radiation arewell known [5]; it was first observed in a beam-driven plasmachannel [6] and later in a laser-driven one [7–9]. Since thesefirst observations were made, betatron x-ray generation hasbeen an extremely prolific field of research within the LWFAcommunity. High-quality studies have been carried out at a
number of high-intensity laser facilities worldwide and haveimplied that betatron x-rays have a source size of a fewmicrometers [9, 10], a divergence of less than 100 mrad [11],a pulse duration of less than 100 fs [12], and a broadbandspectrum in the keV energy range [13, 14]. Betatron x-raysare also directly related to the electrons emitting them, andthus the radiative properties of the source can be an excellentdiagnostic of the LWFA acceleration process. The electronbeam emittance and size have been inferred in experimentsfrom the x-ray beam profile [11, 15], spectrum [16, 17], orsource size [18]. However, the imaging or spectroscopytechniques traditionally used to characterize betatron x-rayradiation do not provide detailed simultaneous information onthe x-ray source spectrum and beam profile.
In this paper, we present a new diagnostic, and subsequentdata analysis, to measure the angular dependence of betatronx-ray spectra in a LWFA. This diagnostic consists of a stackedimage plates spectrometer with differential filtering, and ithas enabled us to observe betatron x-rays with energiesextending up to 80 keV during experiments performed atthe Lawrence Livermore National Laboratory’s Jupiter Laser
0741-3335/14/084016+10$33.00 1 © 2014 IOP Publishing Ltd Printed in the UK
Plasma Phys. Control. Fusion 56 (2014) 084016 F Albert et al
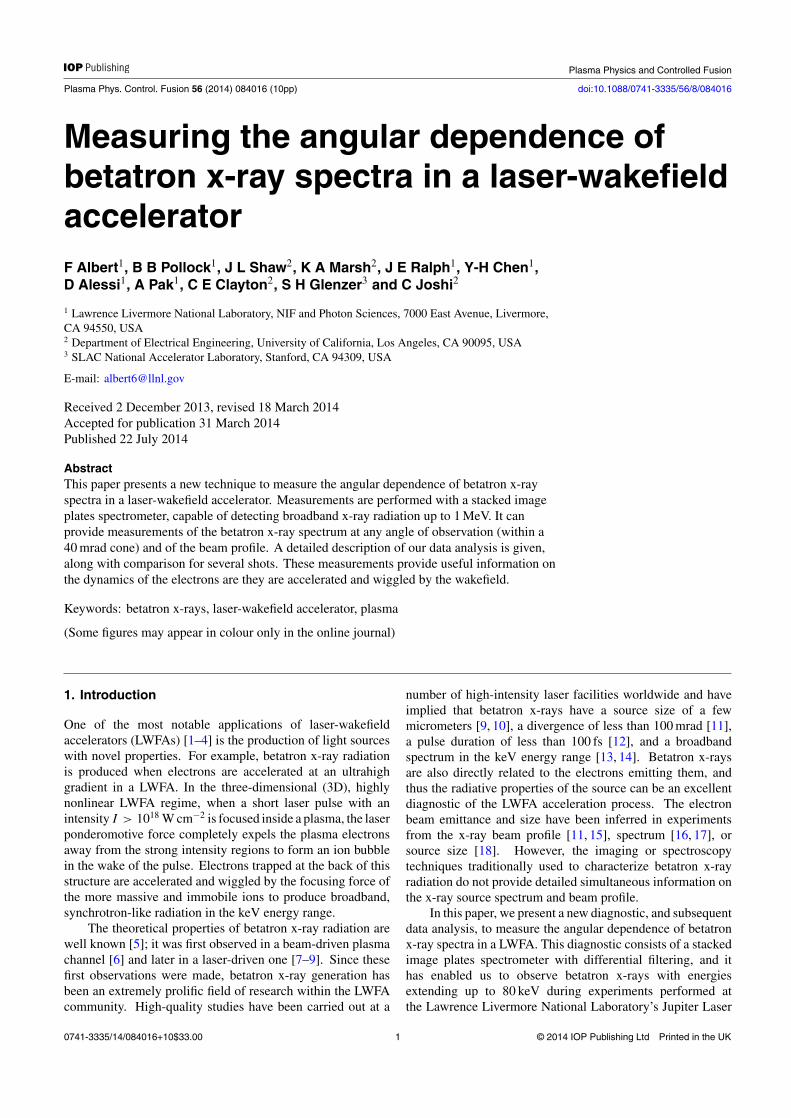
Figure 1. Example of an electron trajectory in the plasma (a), with the corresponding betatron x-ray beam profile (b) and spectrum observedon axis (c), calculated using equation (2) and containing the harmonic structure of the radiation. For this example, the parameters arene = 1019 cm−3, γ = 200, x0 = 1 µm, y0 = 0, and α = 0. Here the critical frequency h̄ωc = 4.2 keV and K � 6. The beam has adivergence of 1/γ and K/γ along the direction parallel and perpendicular to the plane of the oscillations.
Facility. The paper is organized as follows: section 2 presentsthe radiation models used for our data analysis, section 3 gives adescription of the experimental setup, section 4 gives a detaileddescription, along with calibration data, of our stacked imageplates spectrometer, section 5 shows the details of our analysisfor a single shot and a comparison between several shots, andfinally section 6 discusses possible hypotheses to explain theobserved spectral and spatial properties of the source in ourexperiments.
2. Betatron radiation modeling tools
There are several methods to model betatron x-ray radiationin a LWFA. Electron trajectories obtained from particle-in-cell (PIC) codes, such as OSIRIS, can be post-processedto calculate the radiation beam profile and spectrum withexcellent accuracy [19]. This is, however, computationallyintensive, and betatron radiation can also be easily modeledwith single electron trajectories.
In our model, the motion of an electron accelerated along�uz with momentum �p and position �r in the wake of a laserpulse is described by the Lorentz equation of motion:
d �pdt
= −mω2p�r2
+ αmcωp
e�uz, (1)
where m is the electron rest mass, e the elementary charge,and ωp =
√nee2/mε0 is the plasma frequency. Here, ne is
the electron density, and ε0 the vacuum permittivity. In theblowout 3D nonlinear regime of laser wakefield acceleration[20], α = 1
2
√a0 is the normalized accelerating field, where a0
is the laser normalized vector potential. Equation 1 is solved byusing a fourth order Runge–Kutta algorithm to obtain the singleelectron trajectories for given initial conditions and fields. Theelectron position and momentum are used to calculate the
intensity radiated by the particle per unit frequency ω and solidangle � [21]:
d2I
d�dω= e2ω2
4πc
∣∣∣∣∫ ∞
−∞�n × (�n × β) eiω(t− �n.�r
c) dt
∣∣∣∣2
, (2)
where �n is the vector corresponding to the direction ofobservation, and β = v/c is the normalized electron velocity.In the case where the wiggler parameter K = 1.33 ×10⁻¹⁰√γ ner0 is larger than unity, the spectrum, observed atan angle θ from the plane in which the particle oscillates, canbe approximated by the asymptotic limit [5, 21]:
d2I
d�dω= e2
3π2c
(ωρ
c
)2(
1
γ 2+ θ2
)
×[K2
2/3(ξ) +θ2
(1/γ 2) + θ2K2
1/3(ξ)
], (3)
where K2/3 and K1/3 are modified Bessel functions. Here,ρ is the radius of curvature of the electron trajectory andξ = ωρ
3c( 1
γ 2 + θ2)3/2.The betatron x-ray beam profile is calculated by
integrating equation (2) over frequencies, and the betatron x-ray spectrum integrated over angles is:
dI
dω=
√3
e2
cγ
ω
ωc
∫ ∞
ωωc
K5/3(x) dx, (4)
where K5/3 is also a modified Bessel function and ωc =3γ 3c/ρ is the critical frequency. For θ = 0, equation (3)is maximum for a peak energy of ω ∼ 0.45ωc. For larger θ ,the peak frequency is lower.
Figure 1 shows an example of a calculated electrontrajectory, with its corresponding betatron x-ray spectrum andbeam profile. For this particular case, the parameters arene = 1019 cm−3, γ = 200, x0=1 µm, y0 = 0, and α = 0
2

Plasma Phys. Control. Fusion 56 (2014) 084016 F Albert et al
Figure 2. Schematic of the experimental setup at JLF, showing the 800 nm, 60 fs laser focused onto the gas cell with the f/8 off-axisparabola. The electrons (dashed line) are deflected by the 21 cm long, 0.42 T magnet centered on the laser axis and located 3.5 cm from thesource, inside the target chamber. The particles successively hit the first and second image plate (IPa and IPb, located 37.2 cm and 111.1 cmaway from the magnet exit, respectively). The laser is blocked by a 50 µm Al foil (combined with a 65 µm mylar window at the vacuum/airinterface of the target chamber) to block residual laser light. The x-rays (solid line) propagate through 7.3 cm of air and through IPa onto the15 channel x-ray spectrometer.
(constant energy). The trajectory is calculated using 3000 timesteps (with each unit step dt = 0.2/ωp). At each point ofcalculation of the trajectory, the spectrum and beam profile arecalculated using frequency steps of 100 eV. For the chosenparameters, ωc = 4.2 keV and K � 6. The beam has adivergence of 1/γ and K/γ along the direction parallel andperpendicular to the plane of the electron oscillations, and theon-axis spectrum peaks at ∼2 keV.
3. Experiment
We performed experiments at the Jupiter Laser Facility (JLF),Lawrence Livermore National Laboratory, using the Callistolaser system. Callisto is a 200 TW laser and delivers pulsesof 60 fs (full width at half maximum, fwhm) duration withenergies up to 12 J at a repetition rate of 1 shot/30 min. Theexperimental setup is shown in figure 2. Using an f/8 off-axisparabola, we focus the laser onto the edge of a 6 mm or 10 mmgas cell, with respectively 500 µm and 1 mm entrance and exitpinholes. The focal spot, measured at low laser power, is12 µm (fwhm), and a0 ∼ 2. The background electron densityof the plasma is measured with interferometry by using a 100 fsprobe pulse synchronized with the main laser pulse. Thedensity is deduced from the fringe shift on the raw data by usingan Abel inversion code. As shown in figure 2, the electronsare vertically deflected by a 0.42 T, 21.5 cm-long permanentdipole magnet onto two image plates (model FUJI-MS-2040),IPa and IPb (a two-screen electron spectrometer [22–24]). Twoimage plates are needed to calculate both the electron energyand deflection from the laser propagation axis when they exitthe plasma [25]. The betatron x-rays propagate outside of thevacuum target chamber through a 65 µm mylar window and a50 µm Al filter to block any residual laser light. The betatron
beam profile is measured on IPa , and after transmission throughIPa , the stacked image plates spectrometer measures the beamprofile and spectrum.
4. Stacked image plates spectrometer for betatronradiation
4.1. Design
A schematic of the stacked image plates spectrometer is shownin figure 2. It consists of 15 1 inch × 1 inch image plates(model FUJI-MS) stacked in a light-tight lexan cartridge witha square aperture in front. Filters, arranged by increasing Z
number (and thickness for channels 10–15), are placed in frontof each image plate. For our experiments, the aluminum filteris placed against the aperture, followed by the first image plate.The design of this diagnostic has been adapted from Chen et al[26], where it was originally used to measure bremsstrahlungradiation from hot electrons in fast ignition experiments. Sincethe betatron spectrum is not isotropic, we are not using acollimator and the front aperture is larger to be able to detectthe beam. This diagnostic can in principle detect and spectrallyresolve broadband x-ray radiation up to 1 MeV through the 15successive channels, with an acceptance angle of 40 mrad inour experimental configuration. However, x-ray spectra frombetatron radiation produced in our experiments only extend upto ∼80 keV. As a result, we are only seeing signal up to the 5thchannel of the spectrometer. This diagnostic works well fordetecting betatron radiation above 5 keV, but is not suited forlower energy x-rays, due to the reduced sensitivity of imageplates below this energy and to the fact that the MS imageplates have a ferromagnetic layer stacked behind the sensitivelayer [27].
3

Plasma Phys. Control. Fusion 56 (2014) 084016 F Albert et al
10 20 50 100 200 500 100010 8
10 6
10 4
0.01
x ray energy keV
En
erg
yD
epo
site
din
Lay
erM
eVp
ho
ton
Ch1 Al 100 µm
Ch2 Ti 100 µm
Ch3 Fe 100 µm
Ch4 Cu 100 µmCh5 Mo 100 µm
Ch6 Ag 150 µm
Ch7 Sn 500 µm
Ch8 Ta 500 µm
Ch9 Au 1.6 mm
Ch10 Pb 1mm
Ch11 Pb 2mm
Ch12 Pb 3mm
Ch13 Pb 4mm
Ch14 Pb 5mm
Ch15 Pb 5mm
Figure 3. Calculated response of the 15 spectrometer channels, behind their corresponding filter. It represents the energy deposited in eachchannel by the x-ray photon spectrum.
1 2 3 4 5 6 7 810 9
10 7
10 5
0.001
0.1
10
Channel number
Do
sen
orm
aliz
ed
0 20 40 60 800.0
0.2
0.4
0.6
0.8
1.0
X ray energy keV
Inte
nsi
ty
0 20 40 60 80 1000.0
0.2
0.4
0.6
0.8
1.0
x ray energy keV
Tra
nsm
issi
on
Air AlMylar Image Plate
All
(a) (b)
Figure 4. (a) Betatron x-ray spectra with critical energies of 5, 10, 15, 20 and 30 keV (solid, dotted, dashed, dot–dashed and gray lines,respectively). The inset shows the transmission curves for all the elements on the x-ray beam path before the spectrometer. (b) Calculatedintegrated dose, for channel 1–8, for each spectrum shown in (a).
4.2. Spectrometer response to a betatron x-ray spectrum
The response of each of the 15 channels of the spectrometer(behind the corresponding filter) is shown in figure 3,up to photon energies of 1 MeV. It was obtained witha one dimensional model, calculated with the MonteCarlo simulation package Integrated Tiger Series 3.0. Ittracks electron and x-ray/gamma-ray photons through thespectrometer, taking into account effects such as scattering,pair production, and x-ray fluorescence. This model hasbeen calibrated up to 662 keV, and comparison with otherinstruments, such as transmission crystal spectrometers, haveshown reasonable agreement. The calibration was made with109Cd (22 keV) and 137Cs (662 keV) radioactive sources. Whenimage plates are exposed to x-ray radiation, electrons in thephosphor (sensitive) laser are excited and kept in a metastablestate. These are liberated when they are scanned with redlaser light, resulting in the emission of blue photons detected
by a photomultiplier tube. After each shot, the image plateswere kept in the lexan cartridge and light-tight box, andscanned 10 min after x-ray exposure with a FLA-7000 scanner,which reads photostimulated luminescence (PSL) values.Figure 4 shows the expected dose produced on the spectrometerchannels for betatron spectra with critical energies h̄ωc = 5,10, 15, 20 and 30 keV. The spectra are calculated by using thefunction (ω/ωc)
2K22/3(ω/ωc) (equation (3) for θ = 0 and fixed
arbitrary γ ), where h̄ωc is varied accordingly. Each intensityspectrum is then converted into units of photon/eV andpropagated through the different elements of the experiment(Al, mylar window, air and IPa), where transmission curvesare shown in the inset of figure 4(a) for our experimentalconfiguration. The expected integrated dose produced on eachspectrometer channel is finally calculated by convoluting eachspectrum with the response functions shown in figure 3. Thespectrometer can thus detect betatron radiation with a widerange of critical energies.
4

Plasma Phys. Control. Fusion 56 (2014) 084016 F Albert et al
Figure 5. (Left) Electron spectra recorded on the two-screen image plate spectrometer (IPa and IPb), and (right) corresponding calculatedenergy spectrum.
1 2 3 4 5 6
0.01
0.02
0.05
0.10
0.20
0.50
Channel number
PS
Lp
ixel
0 20 40 60 80 1000.0
0.2
0.4
0.6
0.8
1.0
X ray energy keV
d2 I
dωd
no
rmal
ized
Figure 6. (Top) X-ray data, recorded on the stacked image plates spectrometer for channel 1–6. (Left) X-ray spectrometer dose (dots witherror bars), in PSL, per pixel. Calculated dose (normalized to the first data point), for betatron spectra with critical energies of 15 keV and20 keV (dotted and dashed lines, respectively) and radiation produced by an electron injected 5 µm off-axis and accelerated up to 268 MeV(red solid line). (Right) Inferred normalized energy distribution spectrum for each case.
5. Results and analysis
A detailed analysis of betatron x-ray data on the stackedimage plates spectrometer has recently shown that, in ourexperimental conditions, the angular dependence of betatronx-ray spectra suggests an anisotropic distribution of theelectron energy spectrum [28]. In this section, we showadditional data, a detailed description of the analysis procedureand subsequent interpretation of the results. We first describethe analysis for a given shot, and provide some comparisonswith shots done under similar experimental conditions.
5.1. Single-shot analysis
5.1.1. Electron spectrum. Figure 5 shows, for a givenshot, the electron data recorded on IPa and IPb and the
corresponding electron beam spectrum. It has a maximumelectron energy of 268 ± 25 MeV. The error bar representsthe uncertainty on the maximum measured energy, due tothe limited resolution of our magnetic spectrometer. For thisparticular shot, the experimental parameters are laser energyE = 5.3 J, a0 = 2.33, and a gas cell filled with 100% He atne = 6 × 1018 cm−3. Due to the highly nonlinear nature ofthe blowout regime and its sensitivity to nonideal laser beamand plasma density profiles, the electron beam spectrum is notmonoenergetic as expected from the theory [20].
5.1.2. On-axis x-ray spectral analysis. The first step in ouranalysis is to retrieve the electron oscillation amplitude in theplasma. This is done using the x-ray spectral data. Figure 6shows the average on-axis x-ray dose, deposited in each x-ray spectrometer channel, within a spot centered on the beam
5

Plasma Phys. Control. Fusion 56 (2014) 084016 F Albert et al
0.0 0.5 1.0 1.5 2.0 2.5 3.01
510
50100
5001000
rad
(a)
(b)
Experiment Simulation
# E
lect
ron
s
LP
z (laser propagation)
x
y (polarization)
(c)
Figure 7. (a) Measured and simulated betatron x-ray beam profiles, recorded on IPa , scanned with a 200 µm pixel size. LP indicates thelaser polarization direction. The number of electrons around the propagation axis (positive z direction) is shown in (b) for four distinctgroups of electrons accelerated up to γ = 100, 200, 440 and 520 (dashed, dotted, solid, and dot–dashed lines, respectively). θ = 0 is alongthe x (vertical) axis and the laser is polarized along θ = π/2 rad (y horizontal axis). (c) Geometry for the electron trajectories.
profile and subtending a solid angle of ∼1.1 × 10⁻⁶ sr fromthe source. We have fitted the data (dots) with three differenttheoretical spectra, shown in the inset of figure 6. Thiscalculated signal takes into account the filters of our setup (Al,mylar, air, first image plate) and the response function of eachdetector channel. In the plasma, the electron oscillation radiusdamps as it is accelerated up to its final energy, and the spectrumcritical energy is not constant throughout the trajectory. Adetailed analysis (red solid curve) takes this into account andthe spectrum (inset) is calculated numerically as follows.
First, the trajectory is calculated by solving equation (1)with a fourth order Runge–Kutta algorithm. All parametersand initial conditions needed to solve equation (1), exceptfor the initial oscillation radius r0, are determined by theexperimental conditions. The electron density is ne = 6 ×1018 cm−3, α = 0.763, the electron final energy is 268 MeV(γ � 520), and the electron initial energy is γ� = ω0/
√3ωp =
9.85 [20], which is the Lorentz factor corresponding to thephase velocity of the plasma wave. In our simulation, weuse 1500 time steps (with each step dt = 0.4/ωp) for thewhole trajectory. At each time step, the corresponding onaxis (θ = 0) spectrum is calculated with equation (2) andaccumulated over the whole trajectory. We adjust the initialradius to r0 = 5 µm so that it fits the upper part of the errorbars in our data. An upper bound r0 = 5 µm is consistent withprevious measurements [10, 11, 18].
The other spectra shown in the inset are calculated usingthe function (ω/ωc)
2K22/3(ω/ωc) (equation (3) for θ = 0
and fixed arbitrary γ ) with parameters h̄ωc = 15 keV andh̄ωc = 20 keV. This is equivalent to a spectrum produced by asingle electron oscillating with a constant amplitude and energy(no acceleration). This simple model estimates the on-axisspectrum critical energy h̄ωc ∼ 15–20 keV (peak energy of7.5–10 keV).
6

Plasma Phys. Control. Fusion 56 (2014) 084016 F Albert et al
0 5 10 15 20 250
2
4
6
8
10
Observation angle-mrad
Pea
kx-
ray
ener
gy-
keV
- 0.4
- 0.05
- 0.2
PSL/Pixel
1
4
3
2
28
0
-12Ob
serv
atio
n a
ng
le (
mra
d)
14
Figure 8. (Left) Peak experimental betatron x-ray energy as a function of the angle of observation (dots with error bars). The spectrum wasmeasured on axis and at 7 mrad, 14 mrad and 28 mrad corresponding to respective vertical positions 1, 2, 3, 4 indicated on right side of thefigure, which shows the beam profile on the first spectrometer channel. The two curves show the theoretical peak energy for equation (3)(dashed line) and the full set of electron trajectories (dotted line).
5.1.3. Beam profile analysis and orientation of electrontrajectories. The second step is to retrieve the spatialorientation of the electron trajectories. For this, equation (2) isused to self-consistently match the observed and calculatedbeam profiles. The experimental (recorded on IPa) andsimulated beam profiles are shown in figure 7(a). Their shapeis not completely elliptical as one would expect from a singleelectron oscillating about the axis [11]. To reproduce theexperimental profile using a single particle trajectory trackingmethod, we use equation (2) to map the full spatial and spectraldistribution of the betatron radiation. Using a least-squaresfitting method, the orientation of electron trajectories for fourgroups of electrons is adjusted until the simulated beam profilematches the experiment. For the simulation, the particles aredistributed on a circle of radius r0 = 5 µm in the transverse(x, y) plane with angular steps of π/30, as shown in figure 7(c).Here θ = 0 is along the x axis, the laser is polarized along y
(θ = π/2). In figure 7(b), we show this number of electronsas a function of θ , and for four groups of electrons withdifferent final energies representative of the overall measuredspectrum displayed in figure 5 (with extrapolation for thelower electron energies). This range of energies is due to thefact that the electron spectrum is not monoenergetic and thatelectrons were injected into the wake at different times. Foreach trajectory, the dephasing length is Ldp = 0.29 cm, andelectrons injected later into the wake end with a lower finalenergy. This reconstruction is specific to our model, in whichwe assume (i) complete blowout, (ii) electrons trapped in onlythe first bucket of the wake, and (iii) cylindrical symmetry inthe radial focusing forces.
5.1.4. Angular dependence of the betatron x-ray spectrum.The third step is to compare the experimental angulardependence of the betatron x-ray spectrum with the angulardependence of the spectrum calculated from the trajectories offigure 7. Figure 8 shows the variation of the peak x-ray energywith the observation angle, the latter is defined in the inset. Foreach observation angle, we measure the dose in channels 1–6of the detector and fit with the function (ω/ωc)
2K22/3(ω/ωc)
following the same method and peak energy definition as infigure 6. The error bars reflect the range of peak energies
that fit the measured spectrum. The experimental data offigure 8 are then fitted with two different theoretical spectraobtained from: (i) the synchrotron radiation asymptotic limit(equation (3)) where h̄ωc = 20 keV is fixed and θ is theobservation angle, and (ii) the spectrum emitted by the multipletrajectories of figure 7, calculated from equation (2) where thevector �n is adjusted with the observation angle. As seen infigure 8, the simple model does not reproduce the experimentalangular dependence of the x-ray spectrum because it assumesthat electrons oscillate along only one direction. Althoughthe most energetic particles primarily oscillate along the laserpolarization axis, a larger number of lower-energy electronsoscillate with a wider range of angles in the transverse plane.This results in a softer decrease of the peak x-ray energy withincreasing observation angles.
5.2. Comparison of several shots
We now compare the spectral and spatial properties of betatronx-ray beams obtained under different conditions, starting withthe on-axis betatron x-ray spectrum. During this experimentalcampaign, we did several shots where it is also possible todo a similar analysis as the one presented above. However,shots need to be treated on a case-by-case basis and analyzedmanually, because each was done under different experimentalconditions (laser energy, electron density, gas composition).The following section reiterates the steps of our analysisby comparing the detailed characteristics (on-axis spectrum,electron oscillation amplitude, orientation of the trajectories,spectrum angular dependence) of two shots.
By using the image plate sensitivity numbers from [27]and the spectral distribution inferred from our measurements,we estimate the x-ray yield to be on the order of 108–109 photons/pulse. This uncertainty due to the combinationof several factors: uncertainty on the calibration itself, onthe image plate thickness, and large shot-to-shot fluctuationsduring our experiment.
5.2.1. On axis spectral data and critical energy. Figure 9shows the data obtained for three different shots, with fitscorresponding to different critical energies for the spectrum
7

Plasma Phys. Control. Fusion 56 (2014) 084016 F Albert et al
1 2 3 4 5 6
0.01
0.02
0.05
0.10
0.20
0.50
Channel number
PS
Lp
ixel
1 2 3 4 5 6
0.01
0.02
0.05
0.10
0.20
0.50
1.00
Channel number
PS
Lp
ixel
1 2 3 4 5 6
0.01
0.02
0.05
0.10
0.20
0.50
Channel number
PS
Lp
ixel
Shot 1
Shot 2
Shot 3
Figure 9. X-ray images, recorded on the stacked image platesspectrometer for channel 1–6, for three different shots (see text forparameters). The corresponding graphs are the x-ray spectrometerdose (dots with error bars), in PSL, per pixel. For each case, weshow the calculated dose (normalized to the first data point), forbetatron spectra with critical energies of 10 keV, 15 keV, 20 keV and30 keV (solid, dotted, dashed and dot–dashed lines, respectively).
observed on axis. Each shot was done with a 10 mm longgas cell, with the following parameters. Shot 1: laser energyE = 5.3 J, a0 = 2.33, 100% He at ne = 6 × 1018 cm−3.Shot 2: E = 8.5 J, a0 = 2.95, 99% He and 1% N2 atne = 7 × 1018 cm−3. Shot 3: E = 6.1 J, a0 = 2.5,100% He at ne = 5 × 1018 cm−3. The calculated a0 valuesinclude a ∼50% coupling of laser energy into the wake, typical
1 2 3 4 5 6
0.01
0.02
0.05
0.10
0.20
0.50
1.00
Channel number
PS
Lp
ixel
150 200 250 3000
500
1000
1500
2000
Electron energy MeV
Ele
ctro
nM
eVar
b.u
nit
Figure 10. X-ray spectrometer dose (dots with error bars) for shot 2,in PSL, per pixel. Calculated dose (normalized to the first datapoint), for the radiation produced by an electron injected 5 µm and4 µm off-axis, and accelerated up to 223 MeV (solid and dotted line,respectively). The corresponding measured electron energyspectrum is shown in the inset.
for our experiments. For each shot, we measure the dosein channels 1–6 of the detector and fit with the function(ω/ωc)
2K22/3(ω/ωc) following the method defined for the
analysis of the figure 6 data (shot 1). In figure 9 we showthe results of fits calculated for critical energies h̄ωc of 10, 15,20 and 30 keV. For shot 3, which corresponds to a betatronspectrum with a ∼10 keV critical energy, the data recorded onthe spectrometer is below the detection threshold for channel3 and above.
5.2.2. Electron oscillation amplitude. We now determine theelectron oscillation amplitude for shot 2, by using the on-axisbetatron x-ray spectral data, and by calculating the electrontrajectory with the Runge–Kutta algorithm and subsequentbetatron radiation from equation (2), accumulated over thewhole electron trajectory. A detailed analysis, similar to thatshown in figure 6 (shot 1), shows that we can fit the spectral dataof shot 2 with the spectrum produced by an electron where theinitial injection radius is adjusted to r0 = 5 µm to fit the upperpart of the error bars in our data. The results of this analysisare shown in figure 10, with the corresponding measuredelectron energy spectrum. The simulation parameters (timeand frequency steps) are identical for shot 1 and for shot 2.For shot 2, the initial conditions are also determined by theexperimental measurements. In this case, the electron densityis ne = 7 × 1018 cm−3, α = 0.86, the electron final energyis 223 MeV (γ � 436), and the electron initial energy isdetermined by γ� = ω0/
√3ωp = 9.1.
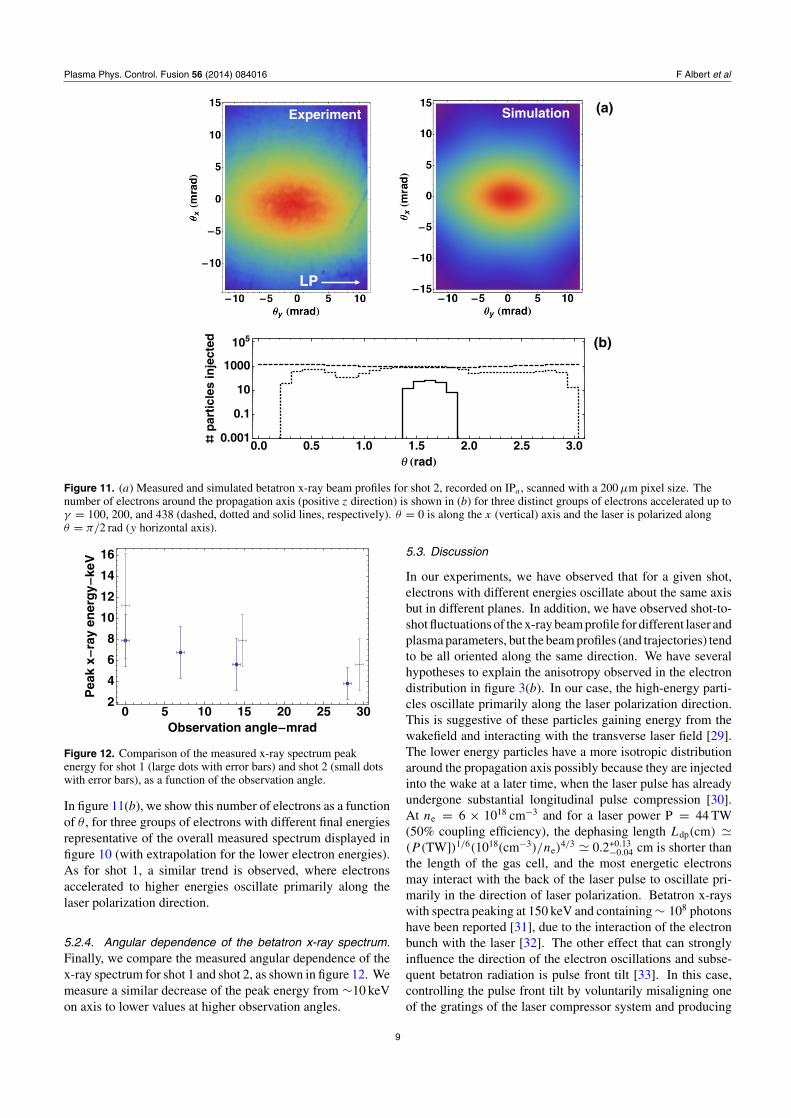
5.2.3. Beam profile and orientation of trajectories. Theexperimental and simulated beam profiles for shot 2 are shownin figure 11. The principle is similar to the calculationpresented in figure 7: using a least-squares fitting method,the orientation of the electron trajectories for three groups ofelectrons is adjusted until the simulated beam profile matchesthe experimental one. For the simulation, the particles are alsodistributed on a circle of radius r0 = 5 µm in the transverse(x, y) plane with angular steps of π/30. As for shot 1, θ = 0is along the x axis and the laser is polarized along y (θ = π/2).
8
Plasma Phys. Control. Fusion 56 (2014) 084016 F Albert et al
0.0 0.5 1.0 1.5 2.0 2.5 3.00.001
0.1
10
1000
105
θ rad
par
ticl
esin
ject
ed
(a)
(b)
Experiment Simulation
LP
Figure 11. (a) Measured and simulated betatron x-ray beam profiles for shot 2, recorded on IPa , scanned with a 200 µm pixel size. Thenumber of electrons around the propagation axis (positive z direction) is shown in (b) for three distinct groups of electrons accelerated up toγ = 100, 200, and 438 (dashed, dotted and solid lines, respectively). θ = 0 is along the x (vertical) axis and the laser is polarized alongθ = π/2 rad (y horizontal axis).
0 5 10 15 20 25 302
4
6
8
10
12
14
16
Observation angle mrad
Pea
kx
ray
ener
gy
keV
Figure 12. Comparison of the measured x-ray spectrum peakenergy for shot 1 (large dots with error bars) and shot 2 (small dotswith error bars), as a function of the observation angle.
In figure 11(b), we show this number of electrons as a functionof θ , for three groups of electrons with different final energiesrepresentative of the overall measured spectrum displayed infigure 10 (with extrapolation for the lower electron energies).As for shot 1, a similar trend is observed, where electronsaccelerated to higher energies oscillate primarily along thelaser polarization direction.
5.2.4. Angular dependence of the betatron x-ray spectrum.Finally, we compare the measured angular dependence of thex-ray spectrum for shot 1 and shot 2, as shown in figure 12. Wemeasure a similar decrease of the peak energy from ∼10 keVon axis to lower values at higher observation angles.
5.3. Discussion
In our experiments, we have observed that for a given shot,electrons with different energies oscillate about the same axisbut in different planes. In addition, we have observed shot-to-shot fluctuations of the x-ray beam profile for different laser andplasma parameters, but the beam profiles (and trajectories) tendto be all oriented along the same direction. We have severalhypotheses to explain the anisotropy observed in the electrondistribution in figure 3(b). In our case, the high-energy parti-cles oscillate primarily along the laser polarization direction.This is suggestive of these particles gaining energy from thewakefield and interacting with the transverse laser field [29].The lower energy particles have a more isotropic distributionaround the propagation axis possibly because they are injectedinto the wake at a later time, when the laser pulse has alreadyundergone substantial longitudinal pulse compression [30].At ne = 6 × 1018 cm−3 and for a laser power P = 44 TW(50% coupling efficiency), the dephasing length Ldp(cm) �(P (TW])1/6(1018(cm−3)/ne)
4/3 � 0.2+0.13−0.04 cm is shorter than
the length of the gas cell, and the most energetic electronsmay interact with the back of the laser pulse to oscillate pri-marily in the direction of laser polarization. Betatron x-rayswith spectra peaking at 150 keV and containing ∼ 108 photonshave been reported [31], due to the interaction of the electronbunch with the laser [32]. The other effect that can stronglyinfluence the direction of the electron oscillations and subse-quent betatron radiation is pulse front tilt [33]. In this case,controlling the pulse front tilt by voluntarily misaligning oneof the gratings of the laser compressor system and producing
9

Plasma Phys. Control. Fusion 56 (2014) 084016 F Albert et al
an asymmetric laser intensity profile can lead to an asymmetricwake. Experiments and simulations have shown that by doingthis, the direction of the oscillations and the x-ray polarizationare anisotropic [34]. Detailed measurements and simulations,where the betatron beam profile can be monitored while chang-ing the laser polarization or pulse front tilt, should better ex-plain the origin of the observed anisotropy in our experiments.
6. Conclusion
In conclusion, we have implemented a new betatron x-raysource diagnostic capability in laser-wakefield accelerationexperiments. It can measure both the single-shot beamprofile and x-ray spectrum at different angles of observation.This enables a three dimensional reconstruction (as opposedto electron beam size only) of the electron trajectoriesto understand the detailed physics of the injection andacceleration mechanisms without the need of extensiveparticle-in-cell simulations. We also have observed that thebetatron x-ray energy decreases as the observer looks furtheraway from the axis of propagation, and that these observationscan be explained by assuming an anisotropic distribution ofthe electron energy spectrum. Obtaining the full spectral andspatial properties of the betatron radiation in a singe shot tounderstand the physics of the electron dynamics in the plasmais essential for future implementation of the betatron x-raysource on large-scale, low repetition rate laser systems. Weexpect that betatron radiation will become a powerful x-rayprobe for x-ray imaging [35] and absorption spectroscopy [36]techniques in high energy density science experiments.
Acknowledgments
This work was performed under the auspices of the USDepartment of Energy under contract DE-AC52-07NA27344at LLNL, DE-FG02-92-ER40727 at UCLA, and supported bythe Laboratory Directed Research and Development (LDRD)Program under tracking code 13-LW-076. This work waspartially supported by the DOE Office of Science, FusionEnergy Sciences under FWP 100182. The authors thankR C Cauble, J Bonlie and S Maricle for their support ofthe Callisto laser system at the Jupiter Laser Facility, andC Haefner for advice on lasers. FA acknowledges discussionswith F V Hartemann on theory and modeling and thanksC D Chen for discussions on the spectrometer layout.
References
[1] Tajima T and Dawson J M 1979 Phys. Rev. Lett. 43 267–70[2] Mangles S P D et al 2004 Nature 431 535–8
[3] Faure J, Glinec Y, Pukhov A, Kiselev S, Gordienko S,Lefebvre E, Rousseau J P, Burgy F and Malka V 2004Nature 431 541–4
[4] Geddes C G R, Toth C, Tilborg J V, Esarey E, Schroeder C B,Bruhwiler D, Nieter C, Cary J and Leemans W P 2004Nature 431 538–41
[5] Esarey E, Shadwick B A, Catravas P and Leemans W P 2002Phys. Rev. E 65 056505
[6] Wang S et al 2002 Phys. Rev. Lett. 88 135004[7] Rousse A et al 2004 Phys. Rev. Lett. 93 135005[8] Corde S, Phuoc K T, Lambert G, Fitour R, Malka V and
Rousse A 2013 Rev. Mod. Phys. 85 1–47[9] Kneip S et al 2010 Nature Phys. 6 980–3
[10] Shah R C, Albert F, Phuoc K T, Shevchenko O, Boschetto D,Pukhov A, Kiselev S, Burgy F, Rousseau J P and Rousse A2006 Phys. Rev. E 74 045401(R)
[11] Phuoc K T, Corde S, Shah R, Albert F, Fitour R, Rousseau J P,Burgy F, Mercier B and Rousse A 2006 Phys. Rev. Lett.97 225002
[12] Phuoc K T et al 2007 Phys. Plasmas 14 080701[13] Albert F, Shah R, Phuoc K T, Fitour R, Burgy F, Rousseau J P,
Tafzi A, Douillet D, Lefrou T and Rousse A 2008 Phys.Rev. E 77 056402
[14] Fourmaux S et al 2011 New J. Phys. 13 033017[15] Corde S, Thaury C, Lifschitz A, Lambert G, Phuoc K T,
Davoine X, Lehe R, Douillet D, Rousse A and Malka V2013 Nature Commun. 4 1501
[16] Plateau G R et al 2012 Phys. Rev. Lett. 109 064802[17] Schnell M et al 2012 Phys. Rev. Lett. 108 075001[18] Kneip S et al 2012 Phys. Rev. ST Accel. Beams
15 021302[19] Martins J, Martins S, Fonseca R and Silva L 2009 Proc. SPIE
7359 73590V[20] Lu W, Tzoufras M, Joshi C, Tsung F S, Mori W B, Vieira J,
Fonseca R A and Silva L O 2007 Phys. Rev. ST Acc. Beams10 061301
[21] Jackson J 1998 Classical Electrodynamics (New York: Wiley )[22] Blumenfeld I et al 2006 Nature 445 741–4[23] Clayton C E et al 2010 Phys. Rev. Lett. 105 105003[24] Pollock B B et al 2011 Phys. Rev. Lett. 107 045001[25] Pollock B B et al 2009 Proc. PAC09 (Vancouver, BC, Canada)
pp 3035–7[26] Chen C D et al 2008 Rev. Sci. Instrum. 79 10E305[27] Maddox B R, Park H S, Remington B A, Izumi N, Chen S,
Chen C, Kimminau G, Ali Z, Haugh M J and Ma Q 2011Rev. Sci. Instrum. 82 023111
[28] Albert F et al 2013 Phys. Rev. Lett. 111 235004[29] Mangles S P D et al 2006 Phys. Rev. Lett. 96 215001[30] Faure J, Glinec Y, Santos J J, Ewald F, Rousseau J P,
Kiselev S, Pukhov A, Hosokai T and Malka V 2005 Phys.Rev. Lett. 95 205003
[31] Cipiccia S et al 2011 Nature Phys. 7 867[32] Thomas A G R and Krushelnick K 2009 Phys. Plasmas
16 103103[33] Popp A et al 2010 Phys. Rev. Lett. 105 215001[34] Schnell M et al 2013 Nature Commun. 4 2421[35] Hicks D et al 2012 Phys. Plasmas 19 122702[36] Benuzzi-Mounaix A et al 2011 Phys. Rev. Lett.
107 165006
10