measuring supply chain performance in the agri-food sector
TRANSCRIPT
Measuring Supply Chain Performancein the Agri-Food Sector
Lusine H. Aramyan
Measuring Supply Chain Performancein the Agri-Food Sector
Lusine H. Aramyan

MEASURING SUPPLY CHAIN PERFORMANCE IN THE AGRI-FOOD SECTOR

PROMOTOREN Prof.dr.ir. A.G.J.M. Oude Lansink Hoogleraar Bedrijfseconomie Wageningen Universiteit Prof.dr.ir. J.G.A.J. van der Vorst Hoogleraar Logistiek en Operations Research Wageningen Universiteit Prof.dr.ir. O. van Kooten Hoogleraar Tuinbouwproductieketens Wageningen Universiteit
SAMENSTELLING PROMOTIECOMMISSIE
Prof.dr.ir. M.A.J.S. van Boekel Wageningen Universiteit Dr.ir. A. van der Wiele Erasmus Universiteit Rotterdam Prof.dr.lic. X. Gellynck Ghent University, Belgium Prof.dr.ir. B.C.J.M. Vos Universiteit van Tilburg
Dit onderzoek is uitgevoerd binnen de Mansholt Graduate School

LUSINE H. ARAMYAN
MEASURING SUPPLY CHAIN PERFORMANCE IN THE AGRI-FOOD SECTOR
Proefschrift
ter verkrijging van de graad van doctor
op gezag van de rector magnificus
van Wageningen Universiteit,
Prof.dr. M.J. Kropff,
in het openbaar te verdedigen
op maandag 25 juni 2007
des namiddags te half twee in de Aula

Measuring supply chain performance in the agri-food sector
PhD thesis Wageningen University � with references - with summaries in English and Dutch
Aramyan, L.H., 2007
ISBN: 978-90-8504-667-7

ABSTRACT
The main objective of this research is to contribute to the development of a Performance Measurement System (PMS) for agri-food supply chains that involves the entire chain (i.e. all stages starting from raw materials to retailers) and includes a comprehensive set of performance indicators. For this purpose, Dutch vegetable supply chains have been chosen as case study. The research started by looking at the factors influencing the performance of Dutch vegetables growers. The results show that the choice of marketing channel has an impact on the performance of growers (i.e. growers who used mixed marketing channels, on average, were relatively more efficient than those who sold their total produce through auctions).
The next step of the research was a literature review on existing performance indicators and models in the supply chain literature. Based on this literature review a conceptual framework for measuring performance of agri-food supply chains is developed which includes financial, as well as non-financial indicators combined with specific characteristics of agri-food supply chains. The conceptual framework is evaluated in a Dutch-German tomato supply chain and further developed into a condensed model with only the key performance indicators. The results show that efficiency, flexibility, responsiveness and food quality are four key performance components and form the basis for a PMS for agri-food supply chains.
The application of the conceptual framework is carried out by looking at the perceived impact of different requirements of Quality Assurance Systems (QAS) on the performance of a Dutch tomato supply chain. Results indicate that some QAS requirements are perceived to have a positive impact on some supply chain members� performance, while they are perceived to have a negative impact on other chain members� performance. Overall, results revealed that all selected QAS requirements are perceived to have a positive impact on the performance of the supply chain, although the total impact is relatively small. The PMS framework applied in this study provides an insight in the impact of QAS requirements on performance. In addition, the PMS framework allows to make tradeoffs between different performance dimensions within the own firm, as well as throughout the chain.
Key words: PMS, agri-food, supply chain, efficiency, flexibility, responsiveness, food quality
i

ii

PREFACE
Four years of working on PhD research seemed to be a rather long period, but when I look back, the years have gone by quickly. It seems like only yesterday that I was finalizing my MSc thesis at Wageningen University under the supervision of Prof.dr. Alfons Oude Lansink. During the same time I had the chance to meet dr. Christien Ondersteijn, who had an idea to do research on performance measurement in supply chains. I found the topic very interesting and challenging and that is how my PhD research started on April 1, 2003.
I would like to express my gratitude to my supervisors Prof.dr. Alfons Oude Lansink, Prof.dr. Jack van der Vorst, Prof.dr. Olaf van Kooten and Dr. Christien Ondersteijn. Alfons, I have learned from you how to become a scientific researcher. Already from the time when I was writing my MSc thesis, you have taught me how to conduct scientific research, how to think in a structured way and how to argument my statements. Thank you for all your support and encouragement during all these years. Jack, working with you the last two years of my PhD was a pleasure. You always offered me valuable comments and taught me to think about the research question first and only thereafter about the method to be used. Olaf, without you it would not have been possible to gather data for my research within such a short time period. Thank you very much for all your support and for cheering me up when I needed it. Christien, during the first two years of my PhD I have learned a lot from you. Your door was always open for me and you would find solutions to all my problems in just a matter of seconds. Thanks for believing in me and for all you have done for me. A special thanks goes to Miranda Meuwissen and Ivo van der Lans for their help with writing my last article. Miranda, thank you for always being so open and supportive. Your encouraging words, like �you are doing great�, made me feel so much better when my research was not going the way I wanted it to go. Ivo, thank you that I could just run into your room to ask a methodological question, and that you were always able and willing to immediately give an answer.
I would like to thank Ruud Huirne, Marian Jonker and Ger Trip who made it possible for me to join the Master Program in Agricultural Economics at Wageningen University as part of the Tempus project. Without you, the chance to start a PhD project at Wageningen University would have been equal to zero. Thanks for all your support and attention during my MSc studies, as well as for
iii

being wonderful colleagues during my PhD.
I would like to express my gratitude to all my former colleagues at Business Economics Group. I enjoyed not only working with you, but also joining in various activities and events such as excursions, BBQs, we-days, Christmas dinners and parties, and simply our daily coffee-breaks and lunches. I would like to thank Martin, Anne and Karin for technical and secretarial assistance. Martin, thanks for having been such a gezellige collega, who was always looking for an opportunity to tease me with lots of Dutch jokes and tricks. Jo, I appreciate very much that you agreed to be an interpreter during my case study research in Germany, and that you were willing to travel with me such a distance. Ilya, Bouda, Victor, Natasha, Tanya, Irina, Lan, Paul and all other BEG colleagues, I had great time with all of you. A special thanks goes to my friend Natalia who was always ready to help me with whatever problem I had and who was always there to share happy and sad moments of my life with me.
A great word of thanks goes to my paranymphs Argyris and Sander. Argyris, I had a great time sharing a room with you and discussing all Armenian-Greek cultural similarities, which made us to burst out loud in laughter, and common food dishes that made us always so hungry in the long evening hours working together. Sander, I will never forget our great salsa dance during the Christmas dinner, where you were so patient with me while my timing was wrong every time.
Finally, I would like to express an gratitude to my family, especially my parents Henrik and Varduhi Aramyan and my sister Armine. Mam ]an5 bab ]an5 kov3rig ]an an[a' ,norhagal ym 2yr a]agxov;3an hamar5 2yr wsdahov;3an ov hawadi hamar1 A-anx 2yr a]agxov;3an ov ka]alyrov;3an im Holantia calu ov a3sdy. a3s amynin hasnylu anhnarin glinyr1 I would also like to thank my Dutch family in-law for all their support over the years.
But most of all, I would like to thank my husband Jos for everything he has done for me, for his continuous encouragement and enduring support, for personal sacrificing, for driving with me to the interviews for my research and helping me out with Dutch language, and simply for his endless love and fun that he brought to my life. Jos, with you life is so much better and so much more colorful!
Lusine
iv

CONTENTS
CHAPTER 1: General Introduction 1
CHAPTER 2: Analyzing Greenhouse Firm Performance Across Different Marketing Channels
17
CHAPTER 3: Performance Indicators in Agri-Food Production Chains 39
CHAPTER 4: Performance Measurement in Agri-food Supply Chains: A Case Study
65
CHAPTER 5: The Perceived Impact of Quality Assurance Systems on Tomato Supply Chain Performance
93
CHAPTER 6: General Discussion 127
SUMMARY 151
SAMENVATTING 155
LIST OF PUBLICATIONS 159
CURRICULUM VITAE 161
TRAINING AND SUPERVISION PLAN 163
v

vi

1
CHAPTER 1 General Introduction..
1

1.1 Introduction
The agribusiness and food chains are transforming from a commodity system organized via spot markets towards a vertically coordinated food system. This leads to competition between supply chains and networks rather than competition between individual firms (Christopher, 1998; Cox, 1999; Lambert and Cooper, 2000). This trend demands research to adapt old or develop new views on the functioning of the agribusiness and food markets. In recent years researchers have recognized the relevance of supply chain management for the agri-food sector (Fearne, 1998; Hobs and Yong 2000; Van der Vorst, 2000) due to perishability of products and the need for quality controlled flows of the products. This means that original good quality products can easily deteriorate because of a careless action of one of the actors in the chain. Supply chain management is defined as a network of connected and independent organizations mutually and cooperatively working together to control, manage, and improve the flow of materials and information from supplier to end user (Christopher, 1998). Recently considerable changes have taken place in agri-food supply chains. Nowadays consumers put more demands on issues such as product quality, food safety, product diversity and service (Van der Vorst, 2005). These demands have been raised due to several crises in agri-food sectors such as Bovine Spongiform Encephalopathy (BSE) and classical swine fever (CSF) in 1997, the dioxin affair in 1999, foot and mouth disease (FMD) in 2001, the nitrophen and medroxyprogestron acetate (MPA) incidents in 2002, and the dioxin affair and Avian Influenza in 2003. Besides, governmental regulations concerning environmental issues and food safety issues in the last decades have become stricter. For example the European Union introduced the General Food Law (in 2002 and in January, 2005 article 18 became effective) which obliged companies to be able to trace back and forward their products. Due to globalization, there is an enormous increase in cross-border flows of food products, which means that agri-food supply chains are gaining more complex relationships. Therefore, agri-food supply chains are becoming an interconnected system with a large variety of complex relationships. These relationships are reflected in the formation of food supply chain networks (via alliances, horizontal and vertical cooperation, forward and backward integration in the supply chain and continuous innovation). This implies the development and implementation of enhanced quality, logistics and information systems that enables more efficient realization of processes and more frequent exchange of massive information for coordination
2

purposes (Van der Vorst et al., 2005). In this era of globalization of markets many companies realized that, in order to evolve an efficient and effective supply chain, supply chain management needs to be assessed for its performance (Gunasekaran et al., 2001).
1.2 Background and Problem Definition
This section gives an overview of performance measurement in supply chains and problems therein (Subsection 1.2.1). Besides, it discusses the specificity of agri-food supply chains and existing problems with measuring performance in these types of chains. Furthermore, the motivation of choosing Dutch vegetable chains as case for agri-food supply chains is justified in Subsection 1.2.2
1.2.1 Performance Measurement
Supply chain performance is an overall performance measure that depends on the performance of the supply chain stages. The performance of a supply chain can be defined by supply chain profitability, which has only one source of revenue: the customer (Chopra and Meindl, 2001). According to Van der Vorst (2000) supply chain performance is the degree to which a supply chain fulfils end user requirements concerning the relevant performance indicators at any point in time and at what total supply chain cost.
According to Neely et al. (2005) performance measurement is the process of quantifying the efficiency and effectiveness of an action, a performance indicator is a measure used to quantify the efficiency and effectiveness of an action. According to Van der Vorst (2000) performance indicators are the criteria with which the performance of products, services and production processes can be evaluated. Besides, performance indicators are operationalized process characteristics, which compare the efficiency and/or effectiveness of a system with a norm or target value (Van der Vorst, 2000). According to Coelli et al. (2005) a natural measure of performance is a productivity ratio: the ratio of outputs to inputs, where larger values of this ratio are associated with better performance. Whilst there are many indicators of performance that can be deployed in an organization, there is a relative small number of critical dimensions which contribute more than proportionally to success or failure in the market, which are
3
key performance indicators (KPIs) (Christopher, 1998).
According to Neely (1998) a Performance Measurement System (PMS) is defined as a system that enables informed decisions to be made and actions to be taken because it quantifies the efficiency and effectiveness of past actions through acquisitions, collation, sorting, analysis, interpretation and dissemination of appropriate data. This definition indicates that a PMS constitutes of:
1. Individual measures that quantify the efficiency and effectiveness of an action
2. A set of measures that combine to assess the performance of an organization as a whole
3. A supporting infrastructure that enables data to be acquired, collated, sorted, analyzed, interpreted and disseminated
A PMS is also defined as a system that enables a firm to monitor the relevant performance indicators of products, services and production processes in the appropriate time frame (Rosenau et al., 1996).
Measurement of the entire supply chain performance is important because measurement affects decision making through the evaluation of past behavior and through the opportunity of benchmarking. Insufficient scores on performance measures might lead to continuity problems in the short or long term, because decision makers need information on the operations to guide their decision. To ensure continuity it is essential to work efficiently and minimize cost chain-wide. Besides, organizations in a supply chain depend on each other. Therefore, next to the individual organizational performance indicators, it is imperative to have a set of performance indicators at the supply chain level (Ploos van Amstel and D�hert, 1996; Van der Vorst 2000). Performance measurement is used to help direct the allocation of resources, assess and communicate progress towards strategic objectives and evaluate managerial performance (Ittner and Larcker, 2003). Besides, performance measurement helps managers to identify good performance, helps to make the tradeoffs between profit and investment, provides means to set strategic targets and ensures that managers are aware when to get involved if business performance is distracting (Neely et al., 1994). In the broadest sense the measurement and performance data are intended to secure the control of the
4
organization (Thanassoulis, 2001). According to Lambert and Pohlen (2001) a well-defined supply chain measurement system increases the chance for success by aligning processes across multiple firms, targeting the most profitable markets, and obtaining a competitive advantage through differentiated services and lower costs. Likewise a lack of the proper measurement system in the supply chain results in failure to meet consumer expectations, suboptimization of company performance, missed opportunities and conflict in the supply chain. According to van Hoek (1998) the PMS must be developed in such a way that it enables managers to see areas where supply chain performance can be improved, so they can focus their attention, and obtain higher levels of performance. Despite its necessity, there are still major issues with developing and implementing supply chain performance measurement systems (Neely, 1994, 2005; Beamon, 1998, 1999; Christopher, 1998; Li and O�Brien, 1999; Gunasekaran et al., 2001, 2004; Lambert and Pohlen, 2001; Lohman et al., 2004; Van der Vorst, 2000, 2005)(for detailed discussions on these issues see Chapter 3).
Lambert and Pohlen (2001) summarized the major issues in measuring the performance of supply chains as follows:
1. The lack of measures that capture performance across the entire supply chain
2. The requirement to go beyond internal firm measures and to go to supply chain perspective
3. The requirement to align activities and share joint performance measurement information to implement strategy that achieves supply chain objectives
4. The need to differentiate the supply chain to obtain a competitive advantage
Whereas research on performance measurement systems in supply chain has received much attention with contradictory findings (for a discussion on this issue, see Chapter 3), research on measuring performance in the entire agri-food supply chain has received little attention in the literature. Agri-food supply chain is defined as a supply chain where an agricultural product goes through different stages of production and distribution before reaching the final consumer (Bijman,
5

2002).
Literature on measuring performance in agri-food supply chains revealed several additional problems over the already above-mentioned problems, which are:
1. According to Theodoras et al. (2005), despite the importance of measuring performance in obtaining competitive advantage in the supply chain, relatively little research has been undertaken to provide a thorough understanding of measuring and improving performance in the food industry.
2. Many food firms do not monitor performance indicators in a systematic way and there is a mismatch what manufacturers measure and what their customers view as important (Collins et al., 2001).
3. A knowledge gap between farmers and processors about e.g. business practices, product supply, quality expectations. Therefore, farmers and processors pose different questions to improve supply chain performance, which leads them to run the risk of mis-specifying each others decision process (Le Heron, 2001).
4. In food supply chains currently financial-results oriented performance measures dominate over other performance measures, while introduction of non-financial-results oriented performance measures (e.g. customer complaints, product waste, shelf availability) into whole supply chain will facilitate on time correction of value chain inefficiencies, which will in its turn enable more proactive management and control of these chains, with consequent reductions in the levels of waste and cost incurred by each partner (Simmons et al., 2003).
Given these multitudes of problems in measuring performance of agri-food supply chains, and the many profound changes that have taken place in agri-food chains over recent years (e.g. food safety issues, environmental regulations, globalization of markets), it is clear that there is a need for more research in this area.
Evaluation of supply chain performance is complicated in the presence of multiple inputs and multiple outputs in the system. This implies that performance is multi-dimensional. The multi-dimensionality involves numerous interdependencies and
6

conflicts between the goals. These difficulties require a shift in the focus of performance evaluation and benchmarking from characterizing performance in terms of single measures to evaluating performance in a multidimensional systems perspective (Zhu, 2003). The complexity of most supply chains makes it difficult to understand how activities at multiple tiers are related and impact each other. Another complexity that supply chains are facing is the conflicting goals of individual actors in the chain. Each individual actor has its own goals and optimization criteria. These do not necessarily positively contribute to the performance of the chain as a whole because they can be counterproductive. Conflicting interests of different actors in the chain complicates the availability of information. The relevance of information differs in each stage of the chain, even if information is of high importance for the overall supply chain performance. Moreover, the strategic value of some of information inhibits a free exchange between chain partners (Wijnands and Ondersteijn, 2006). However co-operation generally leads to a win-win situation. Alignment of the goals and optimization procedures of individual actors in the chain may be enhanced by providing insight into the effect of opposing goals on performance. Therefore, a well defined performance measurement system should give insight into the contribution of individual chain actors to the added value of the entire chain.
1.2.2 Agri-food Supply Chains
When measuring the performance of supply chains, there is a need for financial as well as non-financial (technical, logistic, environmental, social) performance indicators. Beside a general overview of financial and non-financial measures, it is important to note the subject of the study is an agri-food supply chain which means that, especially in the case of non-financial measures specific product and production characteristics might be of importance (freshness, food safety etc.). Measuring the performance of agri-food supply chains is even more difficult, because agri-food supply chains are different from other supply chains in some aspects (e.g. perishability, long production throughput time, seasonality). Important distinctions are made between daily fresh products (vegetables and fruits), chilled products (salads, dairy products, etc.), frozen products (fish, ice, etc.) and non-perishables as sugar and coffee (Van der Vorst, 2000). Qualitative performance indicators such as consumer acceptance of the product (qualitative aspects such as taste, texture) need to be taken into account along with other non-qualitative performance indicators (Apaiah, 2006).
7

The fresh produce is characterized by a direct relation between the internal attributes of the final product and those of the primary product. These developments emphasize the degree of interdependence among different levels of the supply chain (Ziggers and Trienekens, 1999).
More specific market and production characteristics of agri-food supply chains are e.g. perishability of products and restricted shelf life, degradation of intrinsic quality or increase of quality due to ripening, differences in lead time between successive stages and long production throughput time (more information about specific characteristics of agri-food supply chains can be found in Chapter 3).
This thesis focuses on Dutch vegetable supply chains. The choice of Dutch vegetable supply chains as a case of agri-food supply chain is motivated by the fact that there have been a lot of changes in these chains over the last 25 years. These changes have especially taken place in Dutch greenhouse tomato supply chains. Besides, the Netherlands is one of the largest producers and exporters of the vegetables in the world.
The turnover of vegetables constitutes about 30% of entire horticulture turnover in the Netherlands. On the other hand horticulture (turnover is � 7.1 billion) is the highest value sector in Dutch agriculture. While only 8% of agricultural acreage is devoted to the production of fruit, vegetables, flowers and plants, this sector contributes 41% to the value of Dutch agriculture (Pinckaers, 2005). The total area of vegetables under the glass is about 3802 ha (in 2003), which is about 35% of the total area of the land under the glass. From these 3802 ha 33% consists of tomatoes, 31.9 % pepper, 17% cucumber and the rest consist of other vegetables (e.g. eggplant, reddish) (Land-en tuinbouwcijfer, 2004).
According to statistical data from 2003, world exports in vegetables totals � 23.5 billion, from which one-third of those experts were transshipments via the Netherlands and 10% of all vegetables traded in the world market were grown in the Netherlands. Main Dutch export products include tomato (23%), peppers (17%) and cucumbers (8%) and principal destinations are Germany, the UK and Belgium. Of total world exports in tomatoes (� 3.7 billion), over one-fourth (� 0.97 billion) is trade in Dutch tomatoes supplying Germany and the UK (Pinckaers, 2005).
The Dutch vegetable chain has undergone several changes in the period of 1980-2006. In the 1980�s, the Dutch vegetable supply chains had a homogenous
8

structure. A large group of small sized growers were supplied by a small group of seed companies. Growers in their turn supplied vegetables to the auction, where vegetables were sold to wholesalers and through retailers to end consumers in the Netherlands, Germany, UK or Belgium. In 1980�s, new technical developments were introduced such as information technology (e.g. Decision Support Systems, Management Information Systems), climate control and introduction of rockwool, which improved the horticultural growing system. This has led to an �industrial production method� of fresh vegetables. Artificial light, climate control, integrated and biological pest control and fertigation in hydroponics enabled producing year-round products from a standardized quality (Wijnands et al., 2004). However, in the period 1986-1992 consumer demand for Dutch vegetables (especially for tomatoes) significantly declined. Apart from growing competition from countries like Spain and Morocco, one of the reasons was the relative bad image, due to (presupposed) high use of pesticides, in production and the quality and taste of the product (Folmer, 1995). Germans named Dutch tomatoes �Wasserbomben� (water bombs). German consumers preferred varieties from unprotected cultivation rather than the Dutch product. This forced the Dutch tomato chain to shift from a supply to a demand driven chains (e.g. producing other types of tomatoes with better taste). In the 1990�s many Dutch auctions disappeared. The auctions were a common marketplace where growers and wholesalers and/or retailers met and the auction clock determined the price of goods. From 28 auctions in 1991 the number of auctions declined to six in 2001. Many auctions got another organizational; a form of a cooperative which involves growers and wholesalers and the prices of the products are no longer determined by auction clock, but based on supply and demand of the products and direct contracting between growers and wholesalers. The largest one of these types of cooperatives is the Greenery, which was established in 1996. At the same time growers who did not want to market their products via the Greenery or other former auctions have established growers� organizations, who incorporate packaging and marketing of their products. During the period between 1995- 2006 more variation/differentiation in the products is seen (supplied by seeds companies). At the same period the size of selected growers increased and some wholesaling companies have become logistics service providers.
9

1.3 Objective and Research Questions
Agri-food supply chains lack an accurate performance measurement system for comparison, benchmarking and decision-making.
The objective of this thesis is to contribute to the development of a performance measurement system (PMS) that involves the entire agri-food supply chain (i.e. all stages starting from raw materials to retailers) and includes a comprehensive set of performance indicators.
The PMS framework is evaluated and applied to Dutch vegetable supply chains.
In order to achieve the objective of this study four research questions are addressed:
1. What is the impact of different factors, particularly marketing channel, on performance of Dutch vegetable growers?
2. What performance indicators and PMS are currently in use in supply chains and what problems can be identified in measuring performance of agri-food supply chains? How can this knowledge be used for the development of a framework for PMS?
3. What are the key performance indicators for measuring performance of vegetable supply chains and what should a framework for performance indicators look like?
4. What method can bring different performance indicators into one overall system of agri-food supply chain performance measurement?
1.4 Structure and Outline of the Thesis
Chapter 2 (Research Question 1) of the thesis is focused on one aspect of performance, which is efficiency in vegetable supply chains. Efficiency is a very important indicator because of its effect on costs, prices and margins. Moreover, a principal objective of performance measurement is to enhance efficiency (Thanassoulis, 2001). This chapter focuses mainly on the grower-wholesaler part of
10

the chain (dyadic perspective) (See Figure 1) and gives an overview of the factors influencing the performance of the Dutch vegetable growers. It investigates the relationship between alternative distribution channels (mixed marketing channels versus traditional auctions) and the performance of growers, namely, determines the impact of different marketing channels on the technical and scale efficiency of growers. Besides, it analyses the impact of the managerial factors (e.g. firm age, firm size, ownership structure, growers� age, firm location) on the performance of the growers. The study consists of two stages. In the first stage, Data Envelopment Analysis (DEA) determines technical and scale efficiency of the Dutch vegetable sector relative to the type of final distribution (mixed marketing channels versus traditional auctions). In the second stage a Truncated Regression Model (TRM) is applied to explain grower efficiency from a managerial point of view. From a dyadic perspective and a single aspect of performance, the research moved on to a chain perspective and to the development of a PMS framework that involves multiple indicators of performance (See Figure 1).
Chapter 3 (Research Question 2) consists of a review of the literature on performance measurement, and based on this literature review a conceptual framework for measuring performance of agri- food supply chains has been developed.
Chapter 4 (Research Question 3) evaluates the usefulness of a conceptual framework for supply chain performance measurement in an agri-food supply chain and further develops it into a condensed framework with the key performance indicators, applicable for practical use. The conceptual framework for the agri-food supply chain performance measurement has been evaluated in a Dutch�German tomato supply chain by means of a case study approach. This particular supply chain has been chosen as a case study, because it is a complete chain starting from breeder till the end consumer.
Chapter 5 (Research Question 4) deals with application of the conceptual framework in the entire tomato supply chain. The application of the framework has been carried out by looking at the perceived impact of different requirements of Quality Assurance Systems (QAS) on the performance of the Dutch tomato supply chain. Chapter 5 uses perceptions of the Dutch tomato supply chain members in an effort to understand the perceived impact of different QAS requirements on the performance of the tomato supply chain. These perceptions are obtained using an adapted self-explicated method.
11

Chapter 6 reviews the previous chapters and includes the discussions on the limitations of the study. Main results and conclusions are presented with the possibilities for the future studies. An overview of the structure of this thesis is presented in Figure 1.
Ch
ai
np
er
sp
ec
ti
ve
Dy
ad
ic
p
er
sp
ec
ti
ve
Findings
Empirical research
Literature
Chapter 2 Performance analysis
of growers
Chapter 4 Evaluation of the
conceptual framework
Chapter 3 Development of a
conceptual framework
Chapter 5 Application of the
conceptual framework
Chapter 6 Discussion and
Conclusions
Chapter 1 Introduction
Figure 1. Outline of the thesis
12

References
Apaiah, R.K. (2006), Designing food supply chains-a structured methodology: A case on novel protein foods. PhD-thesis Wageningen University, Wageningen
Beamon, B.M. (1998), �Supply chain design and analysis: Models and methods�, International Journal of Production Economics, Vol. 55 No 3, pp. 281-294
Beamon, B.M. (1999), �Measuring supply chain performance�, International Journal of Operations and Production Management, Vol. 9 No 3, pp. 275-292
Bijman, J. (2002), Essays on Agricultural Co-operatives. Governance Structure in Fruit and Vegetable Chains, PhD. Thesis, Erasmus University, Rotterdam
Chopra, S. and Meindl, P. (2001), Supply chain management: strategy, planning, and operation, Prentice Hall, New York
Christopher, M.G., (1998), Logistics and supply chain management; strategies for reducing costs and improving services, Pitman Publishing, London
Coelli, T.J., Prasada Rao, D.S, O�Donnell, C.J. and Battese, G.E. (2005), An introduction to efficiency and productivity analysis, Second edition, Springer, New York
Collins, A., Henchion, M. and O�Reilly, P. (2001), �Logistics customer service: performance of Irish food exporters�, International Journal of Retail and Distribution Management, Vol. 29 No 1, pp. 6-15
Cox, A. (1999), �Power, value and supply chain management�, Supply Chain Management, Vol. 4 No 4, pp. 167-175
Fearne, A. (1998), �The evaluation of partnership in the meat supply chain: insights from the British beef industry�, Supply Chain Management: An International Journal, Vol. 3 No 4, pp. 214-231
Folmer, C. (1995), �Agricultural relationship between Germany and The Netherlands�, Research Memorandum No 122, Central Planning Bureau, The
13

Hague
Gunasekaran, A., Patel, C. and Tirtiroglu, E. (2001), �Performance measures and metrics in a supply chain environment�, International Journal of Operations and Production Management, Vol. 21 No1/2, pp. 71-87
Gunasekaran, A., Patel, C., McGaughey, R. (2004), �A framework for supply chain performance measurement�, International Journal of Production Economics, Vol. 87 No 3, pp.333-347
Hobs, J.E. and Young, L.M. (2000), �Closer vertical co-ordination in agri-food supply chains: a conceptual framework and some preliminary evidence�, Supply Chain Management: An International Journal, Vol. 5 No 3, pp. 131-143
Ittner, C.D. and Larcker, D.F. (2003), �Coming up short on nonfinancial performance measurement�, Harvard Business Review, Vol. 81 No. 1, pp. 88-95
Lambert, D.M. and Cooper, M.C. (2000), �Issues in supply chain management�, Industrial Marketing Management, Vol. 29, pp. 65-83
Lambert, D.M. and Pohlen, T.L. (2001), �Supply chain metrics�, The International Journal of Logistics Management, Vol. 12 No 1, pp. 1-19
Land- en tuinbouwcijfers (2004), Centraal Bureau voor de Statistiek (CBS) [Central bureau for statistics]. LEI, Wageningen University and Research Center.
Le Heron, R. (2001), �Creating food futures: Reflecting on food governance issues in New Zeeland�s agri-food sector�, Workshop on Alternative Agro-food Networks: Quality, Embeddedness and Bio-politics, University of California, Santa Cruz, October 12-13.
Li, D. and O�Brien, C. (1999), Integrated decision modelling of supply chain efficiency, International Journal of Production Economics, 59 Vol. 1/3, pp. 147-157
Lohman, C., Fortuin L. and Wouters M. (2004), �Designing a performance
14

measurement system: a case study�, European Journal of Operational Research, Vol. 156 No 2, pp. 267�286
Neely, A., Mills, J., Platts, K., Gregory, M. and Richards, H. (1994), �Realizing Strategy through Measurement�, International Journal of Operations and Production Management, Vol. 14 No 3, pp.140-52
Neely, A. (1998), Performance measurement: Why, what and how, Economist Books, London.
Neely, A., Gregory, M. and Platts, K. (2005), �Performance measurement system design�, International Journal of Operations and Production Management, Vol. 25 No 12, pp. 1228-1263
Pinckaers, M. (2005), �Netherlands agricultural situation: The Benelux horticultural market 2005�, GAIN report No: NL 5002, USDA Foreign Agricultural Service.
Ploos van Amstel, R. and D�hert, G. (1996), �Performance indicators in distribution�, The International Journal of Logistics Management, Vol. 7, No1, pp. 73-82
Rosenau, M.D., Griffin, A., Castellion, G.A. and Anschuetz, N.F. (1996), The PDMA Handbook of New Product Development, John Wiley and Sons, New York.
Simmons, D., Francis, M., Bourlakis, M. and Fearne, A. (2003), �Identifying the determinants of value in the U.K. red meat industry: a value chain analysis approach�, Chain and Network Science, Vol. 3 No 2, pp. 109-121
Thanassoulis, E., (2001), Introduction to the theory and application of data envelopment analysis, Kluwer Academic Publisher, Massachusetts
Theodoras, D, Laios, L. and Socrates, M. (2005), �Improving customer service performance within a food supplier-retailers context�, International Journal of Retail and Distribution Management, Vol. 33 No 5, pp. 353-370
Van Hoek, R.I. (1998), �Measuring the unmeasurable� � measuring and improving performance in the supply chain�, Supply Chain Management, Vol. 3 No 4, pp.
15

187�192
Van der Vorst, J.G.A.J. (2000), Effective food supply chains; Generating, modeling and evaluating supply chain scenarios, PhD-thesis Wageningen University, Wageningen
Van der Vorst, J.G.A.J. (2005), �Performance Measurement in Agri-Food Supply chain Networks. An overview�, in Ondersteijn, C.J., Wijnands, J.H., Huirne R.B. and van Kooten O. (Eds.), Quantifying the Agri-food Supply Chain, Springer, Dordrecht
Wijnands, J.H., Ondersteijn, C. and Wertheim-Heck, S. (2004), �Value creation in the greenhouse industry by product specificity: myth or reality?�, Paper presented at the 14th IAMA Annual World Food and Agribusiness Forum, symposium and case conference, Montreux, Switzerland. June 12-15
Wijnands, J.H and Ondersteijn, C. (2006), Quantifying the Agri-food Supply Chain, Springer, Dordrecht
Zhu, J., (2003), Quantitative models for performance evaluation and benchmarking. Kluwer Academic Publishers, Dordrecht
Ziggers, G.W. and Trienekens, J.H. (1999), �Quality assurance in food and agribusiness supply chains: Developing successful partnerships�, International Journal of Production Economics, Vol.60-61, pp.271-279
16

2
CHAPTER 2 Analyzing Greenhouse Firm Performance
Across Different Marketing Channels
Lusine H. Aramyana, Christien J.M. Ondersteijnb, Alfons G.J.M. Oude Lansinka, Olaf van Kootenc, Jo H.M. Wijnandsd
a Business Economics Group, Wageningen University, Hollandseweg 1, 6706 KN Wageningen, The Netherlands
b Alfa-Accountants en Adviseurs, P.O. Box 27, 4200 AA Gorinchem, The Netherlands
c Horticultural Production Chains group, Wageningen University, Marijkeweg 22, 6709 PG Wageningen, The Netherlands
d Agricultural Economics Research Institute (LEI), P.O. Box 29703, 2502 LS The Hague, The Netherlands
Published in Agribusiness: An International Journal, (2006) Vol. 22, No 2, pp. 267-280
17

Abstract
In recent years supply chain performance measures have been in the spotlight of many authors. Many performance measures have been used. In this paper efficiency was measured as an indicator of performance in the vegetable supply chain. The study consisted of two stages. In the first stage, Data Envelopment Analysis (DEA) evaluated technical and scale efficiency of the Dutch vegetable sector relative to the type of final distribution (mixed marketing channels versus traditional auctions). In the second stage a Truncated Regression Model (TRM) was applied to explain grower efficiency from a managerial point of view. The results of the first stage showed that growers who sell their products through auctions are less efficient. The second stage revealed that variables such as firm size, age, ownership structure and distribution channel strategy significantly contribute to the explanation of technical efficiency of the growers, while the variables firm location, firm size and firm age affect their scale.
Key words: marketing channel, performance, efficiency measurement, greenhouse vegetables
2.1 Introduction
Recently, measuring supply chain performance has become a topic of interest for many authors (Beamon, 1998). An efficient and effective supply chain management strategy is considered to involve value maximization, process integration, responsiveness improvement and cycle time reduction (Li and O�Brien, 1999). To evaluate the success of a strategy a large number of different types of performance measures, both quantitative and qualitative, have been used and their number makes selecting specific performance measures rather difficult.
Channel performance is a function of marketing effectiveness (i.e. how well customer needs are satisfied) and marketing efficiency (i.e. at what cost) (Macdonald, 1998). The bottom line of this issue is the choice of distribution channel (Shipley et al., 1991). A producer can choose between the channels available, including selling directly to a retailer or consumer. Another option is to sell the entire output through intermediaries (an auction in this study). The benefits to suppliers (growers) from intermediaries are continuity and intimacy in local
18

markets, and the possibility to generate efficiency through the exploitation of specialization in sorting, assorting, storing and transporting (Stern and El-Ansary, 1977; Shipley et al., 1991). Efficiency is important because of its effect on costs, prices and margins. To facilitate efficiency, firms reviewing channel design often find it advantageous to implement separate and unique structures to achieve basic marketing requirements (Bowersox and Cooper, 1992). The Dutch greenhouse vegetable industry is currently seeing a move away from auctions towards direct or other marketing channels, but little research has been done on the relative efficiency of alternative channels. The goal of this study was therefore to investigate the relationship between alternative distribution channels (mixed marketing channels versus traditional auctions) and the performance of growers, namely, to determine the impact of the distribution channel on the technical and scale efficiency of growers. Different levels of efficiency among firms producing under equal conditions depend not only on economic factors, but also on the growers� specific characteristics. Therefore the technical and scale efficiency scores obtained in this study were regressed on managerial variables to explain the efficiency measures.
The structure of the paper is as follows. The next section encompasses the background to the Dutch greenhouse vegetable sector and a literature review of efficiency variables. DEA and TRM models are discussed in the �Materials and methods� section, which is followed by the data description and relevant statistics. The paper ends with a discussion of results and conclusions.
2.2 Background
In recent decades the distribution of the end products of the Dutch vegetable sector has undergone several changes. Traditionally, Dutch vegetable supply chains consist of suppliers, growers, auctions, wholesalers, and retailers. The auctions are a common marketplace where growers and wholesalers and/or retailers meet and the auction clock determines the price of goods. In the last decade the number of Dutch fruit and vegetable auctions has rapidly declined, from 28 auctions in 1990 to six in 2001. The three largest ones are the Greenery, Zon and Fruitmasters. The Greenery (annual turnover 1.52 billion Euros) and Zon (annual turnover of 330 million Euros including ornamentals, which account for about 25% of turnover) sell the major part of Dutch greenhouse vegetables. A small amount of Dutch
19

greenhouse vegetables is also auctioned in Belgium and Germany (being mostly the produce of nearby growers).
In 1996 most Dutch horticultural auctions merged into the Greenery (except for Zon) (Bijman, 2002). The aim of the newly established auction was to convert the traditional auction, which only offered products to potential buyers, into a market organization selling products through long-term relationships, arranged weekly prices and delivery according to the requirements of the client (Boonekamp, 2002). Many large, leading growers did not join the Greenery, but formed growers� associations to market their own tomatoes, peppers, cucumbers and eggplants under their own brand names. These groups were the first offering flexible, last-minute and year-round delivery, high quality standards, certification, and 'tracking and tracing'. Another group of growers made delivery arrangements with different big exporters/wholesalers on a yearly basis (e.g. Holland Crop with Bakker Barendrecht BV). Some of these exporters also formed growers� associations in order to benefit especially from EU subsidies for marketing activities (Bijman, 2002). In developing their marketing strategy, growers� associations make decisions to sell: 1) through auction or contract negotiation, 2) under producer or retailer brand, 3) to specific wholesalers or retailers, 4) individual products or packages of products (Boonekamp, 2002). The emergence of growers� associations is a response to the increasing differentiation of demand and supply on agri-food markets (Hendrikse and Bijman, 2001). Growers in associations are considered more flexible in terms of making specific products for different outlets. This flexibility results in the opportunity for growers to seize added value from wholesalers by making production demand specific. Moreover, growers� associations generally have transaction security by means of contracts assuring product sale, while some of the newly established auctions no longer apply the traditional minimum price approach. This flexibility could influence grower efficiency since flexibility is said to enhance chain performance (Christopher, 2000). With this slow but evolving change from a supply to a market orientation in Dutch horticulture, strategic policies are developed more and more from a marketing rather than production perspective. This implies that growers� interests are no longer perceived to be the main interests that the Greenery takes into account (Bijman, 2002). Dissatisfaction over auction strategies, lack of influence over management decisions, and low prices have caused many growers to search for other marketing options.
20

2.3 Managerial Variables
Differences in the technical efficiency of firms producing under equal conditions can be interpreted as the result of variation in growers� knowledge and/or experience in management skills. Thus growers� decisions depend not only on purely economic factors, but also on their specific characteristics. Ondersteijn et al. (2003) explained the relationship between farmer characteristics and farm decisions by the fact that in the Netherlands farms are mainly family businesses where the farmer (grower) is at the same time entrepreneur, manager and labor force. They found that farmer education is one of the main influences on performance change. Burki and Terrel (1998) demonstrated similar results indicating a positive dependence between manager education and efficiency. In addition to this finding they also found a positive dependency between the experience of entrepreneurs and efficiency of the firm, while firm age was shown to have a negative impact on efficiency. Bremmer (2004) reported a negative influence of grower age and greenhouse location on farm technical efficiency, and a positive effect of the presence of a successor and greenhouse location on the scale efficiency of the farm. Wilson and Hadley (1998) showed that farmer age and experience have a negative impact on technical efficiency, while firm size has a positive effect on efficiency. Unlike them, Alvarez and Gonzalez (1999) and Amara et al. (1999) found a negative relation between firm size and efficiency and a positive relation between experience, ownership structure and efficiency. Bezlepkina and Oude Lansink (2003) found a negative relation between firm size and technical efficiency and a positive relation between firm size and scale efficiency. Note that of the above-mentioned publications only Bremmer (2004) is based on research in the greenhouse sector.
2.4 Material and Methods
2.4.1 Data Envelopment Analysis
To measure and compare the performance of supply chains an approach that incorporates multiple performance criteria is required. One such approach is Data Envelopment Analysis (DEA). The idea of DEA is to estimate a frontier that envelops all the input/output data with those observations lying on the frontier considered technically efficient. Any decision-making unit (DMU) lying below the
21

frontier is said to be inefficient. This means that it could either reduce its input use while maintaining output or it could use the same amount of input and increase output.
The discussion of efficiency measurement begins with Farell (1957). Farell proposed that the efficiency of a firm consists of two components: technical efficiency and allocative efficiency. Technical efficiency reflects the ability of the DMU to obtain maximum output from a given set of inputs or to minimize inputs to produce a given bundle of output; allocative efficiency is the ability of a DMU to use inputs in optimal proportions, given their respective prices and production technology. DEA was developed by Charnes et al. (1978), who took up Farell's piece-wise linear convex hull approach to frontier estimation. DEA uses linear programming to construct a non-parametric piece-wise frontier over the data. Efficiency measures are then calculated relative to this frontier. There have been many studies on DEA, wherein models with constant return-to-scale (CRS) and variable return-to-scale (VRS) are proposed (for more on DEA models see Charnes et al., 1978; Banker et al., 1984; Färe et al., 1994; Chambers et al., 1998).
There are several reasons for using DEA to assess the efficiency of supply chains. Firstly, DEA is a systems approach, which means that it accounts for the relationship between all inputs and outputs simultaneously. Secondly, DEA generates detailed information about efficient firms within a sample and tells which of them are important as benchmarks (Fraser and Cordina, 1999). Thirdly, DEA does not require parametric specification of a functional form to construct the frontier. Thus there is no need to impose restrictions on the functional forms that very often cause distorted efficiency measures (Fraser and Cordina, 1999). DEA, however, has the disadvantage of being a deterministic approach. This implies that statistical noise may be confounded with inefficiency (Oude Lansink and Silva, 2003).
This paper uses an input-oriented approach, justified by the fact that growers have a more or less fixed amount of output due to, e.g., contracts and greenhouse size. Therefore, they should be focused on minimizing the inputs necessary to producing a given bundle of output.
22

The CRS and VRS Input-oriented Models
Using the duality in linear programming the DEA problem can be expressed in envelopment form:
θλθ ,
− y
Min
0≥
λst Y i
0≥− λθ Xx
0≥
i
(1) λ
where θ is a scalar and λ is a vector of constants. The estimated value of θ is the efficiency score for each of the N farms. The estimate will satisfy the restriction θ with a value θ = 1 indicating a technically efficient firm. The linear programming problem must be solved N times, once for each firm in the sample. Equation (1) is known as constant return-to-scale (CRS). The CRS assumption is only appropriate when all firms are operating at optimal scale. Most of the time firms do not operate at optimal scale. Imperfect competition, constraints in finance, etc., may be reasons for this phenomenon. The CRS linear programming problem can be easily modified to account for variable return-to-scale (VRS) by adding the convexity constraint: 1= to equation (1), where N1 is a vector of ones1.
1×N
1≤
1′λN 1×N
Scale Efficiency
Total technical efficiency can be further decomposed into pure technical efficiency (TE under VRS) and scale efficiency (SE). Coelli et al. (1998) suggest calculating SE as a ratio of TE (CRS) to TE (VRS). If SE = 1, then the firm is scale efficient, i.e., its combination of inputs and outputs is efficient both under CRS and VRS. If SE < 1, then the firm operates at sub-optimal size.
1 The inclusion of the convexity constraint means that the data were enveloped more closely than with the constant return-to-scale model, which means that the technical efficiency scores obtained with the VRS were greater than or equal to those obtained under the CRS. The convexity constraint equation ensures that an inefficient firm is only benchmarked against firms of a similar size.
23

In this study input-based technical efficiency scores under (VRS) are obtained under strong disposability (SD) of inputs. Strong disposability of inputs means that an increase in inputs cannot decrease, i.e. �congests� the output (Färe and Grosskopf, 2000).
2.4.2 Truncated Regression Model
The nature of efficiency scores requires attention when regressing them on explanatory variables. Since efficiency scores are truncated between [0, 1], a Truncated Regression Model (TRM) can be applied to explain technical and scale efficiency of growers.
TRM is a non-linear regression model and involves information loss. The information is lost for both dependent and independent variables. For some observations neither the left nor right-hand variables are observed (Johnston and Dinardio, 1997). In this study values above 1 and/or below 0 not observed for technical and scale efficiency. Therefore upper and lower thresholds set up strictly at 1 and 0 respectively. The estimator used in this model was maximum likelihood.
2.4.3 Data Description
The data used in this study were derived from a sample of Dutch horticultural firms that participated in the Farm Accountancy Data Network (FADN) of the Agricultural Economics Research Institute (LEI). Observations for the period 1995-1999 were taken into account. The sample used in the analysis consisted of 289 observations in 86 firms (unbalanced panel). The data set contained observations from greenhouses producing tomato, pepper and cucumber or a combination thereof. The firms in the analysis were assumed homogeneous in terms of physical conditions (greenhouse type, climatic conditions, etc.). Even though three different products were distinguished, production characteristics can be considered similar.
To determine DEA efficiency scores, one output (total sales) and six inputs (energy, materials, logistics, structures, machinery and labor) were used. Energy inputs included costs of gas, oil, electricity and also thermal energy from electricity plants. Materials costs included fertilizer, pesticides, crop protection and plant costs. Logistics costs were for storage, delivery of the final product and the
24

services of contract workers. Total sales from all three vegetables were aggregated using price indices. Labor included family as well as hired labor. It was measured in quality-corrected man-years2. Capital invested in structures (buildings, greenhouses and land) and machinery was measured at constant 1995 prices and valued at replacement cost3. The statistical description (mean and standard deviation) of the data set is given in Table 1.
Table 1. Mean values of the variables used in the DEA model
Input Unit
1995 Mean (S.D.)*
1996 Mean (S.D.)
1997 Mean (S.D.)
1998 Mean (S.D.)
1999 Mean (S.D.)
Energy � 1000
85.27 (48.32) 79.10 (46.73) 72.72 (44.23) 64.28 (40.61) 55.11 (38.86)
Materials � 1000
67.29 (43.14) 62.06 (37.93) 65.11 (39.48) 62.87 (35.94) 62.54 (42.19)
Logistics � 1000
41.91 (19.56) 39.89 (23.86) 42.64 (29.24) 35.18 (20.98) 35.76 (30.61)
Structure � 1000
422.08 (297.36) 369.71 (217.96) 429.89 (292.95) 383.69 (232.17) 440.86 (353.40)
Machinery � 1000
417.27 (293.71) 369.05 (268.01) 377.50 (277.89) 367.37 (244.54) 323.79 (262.77)
Labor Man years
7.09 (3.62) 7.16 (3.94) 8.05 (5.35) 8.07 (5.46) 8.31 (6.58)
Output Total sales � 1000
455.22 (249.65) 504.11 (376.44) 598.37 (387.72) 591.18 (382.34) 433.79 (227.42)
Mixed sales 5% 4% 8% 13% 24% * S.D. is standard deviation
2 The quality correction of labor was performed by LEI, and was necessary to aggregate the labor of able-bodied adults with labor supplied by young people or partly disabled workers. 3 The deflator for capital in structures was calculated from the data supplied by the LEI accounting system. Comparison of the end balance value in year t and the beginning balance value in year t-1 gives the yearly price corrections used by LEI. This price correction was used to construct a price index for capital and was used as deflator.
25

Tornquist indices were calculated for three composite variable inputs (energy, materials and logistics) and for output, with prices obtained from LEI. The price indices varied over years but not among firms, implying that quality differences were reflected in the quantity (Cox and Wohlgenant, 1986). Implicit quantity indices were generated as the ratio of value to the price index.
Price indices were calculated with 1995 as the base year. This list of variables resulted in 6 inputs and 1 output, meeting the rule of thumb suggested by Chambers et al. (1998) that there should be at least three times as many observations as variables in the model. A small ratio of observations to variables in the model specification may result in a large proportion of efficient firms.
The descriptive statistics of the data (Table 1) revealed that the Dutch vegetable supply chains using marketing channels other than auction (called mixed marketing channels in the remainder of the paper) increased in the period 1995-1999. The percentage of mixed sales in 1999 was almost 5 times the 1995 percentage, indicating crucial changes in growers' product distribution. Sales through mixed marketing channels included sales directly to the consumer and all indirect sales other than sales through auctions. Firms making more than 5% of their total sales through other channels than auctions were considered firms using mixed marketing channels. The arbitrary limit of 5% of total sales may appear to be marginal compared to the total business operations. However, given the large amount of total sales of the firms (the mean is about 517,000 Euros) even 5% of total sales still comprises a large amount of produce (more than 25,000 Euros) and cannot be explained from own consumption or farm-gate sales. Therefore, even if only 5% of total sales is sold via other sales channels than auctions, it has an influence on the managerial approach of these firms, so it was assumed that they apply marketing strategies for final distribution. Besides, the majority of firms in the sample that sold outside auctions did so for a much larger percentage of their total sales. In the sample of mixed sales, 13% of the firms had, of total sales, 5-10% non-auction sales, 9% had 20-40% non-auction sales and 78% made 65-100% of all sales through channels other than auction. It was assumed that firms having less than 5% of total non-auction sales consumed the products themselves or sold to consumers �at the farm-gate�.
To explain the DEA efficiency measures the following variables were used in the second stage of this study: grower age, availability of a successor, firm size and age, greenhouse location, firm ownership structure and the distribution channel.
26

Table 2 presents descriptive statistics of explanatory variables. Variables were selected based on the literature and the availability in FADN. The literature suggests that education may have a significant influence on the efficiency of growers, but unfortunately data from the FADN database on education were not available for use.
Table 2. Descriptive statistics of the explanatory variables used in the TRM
Variable Description Mean Standard deviation
FIRMSIZE Size of the firm in Standard Firm Units* 843.43 489.14 AGE Age of the entrepreneur in years 46.21 10.05 SUC = 1 if successor is available
= 0 if otherwise 0.14 0.35
ZUIDHOLL = 1 if firm in Zuid-Holland = 0 if otherwise
0.56 0.50
BRABLIMB = 1 if firm in Noord Brabant or Limburg = 0 if otherwise
0.36 0.48
FIRMAGE Age of the firm in years 20.13 10.47 ENTD1 = 1 if single entrepreneur
= 0 if otherwise 0.21 0.40
ENTD2 = 1 if two entrepreneurs = 0 if otherwise
0.73 0.44
DISTRIBCHAN = 1 if the firm used mixed marketing channel = 0 if otherwise
0.11 0.31
* One standard firm unit represents � 248 standardized net added value in 1999 (FADN)
Different studies have shown contradictory effects of grower age on efficiency. Age can be interpreted in different ways. On the one hand it reflects the level of experience as a manager, i.e. the older the manager, the more experience he has. On the other hand young managers are more inclined to innovations and emphasize marketing. Age is used as a proxy variable for managerial skills. Another variable representing managerial skills is the firm's year of establishment (firm age), indicating the number of the years it has existed. This implies that, with the increase in the number of years of operation, firms tend to be more efficient due to past experience.
Ownership structure may have a significant impact on the efficiency score, as
27
single-owner firms may take greater care to use production inputs efficiently, avoid financial costs due to inefficiency in inputs and adverse effects on long-term productivity (Amara et al., 1999). In this study a distinction was made between three groups of entrepreneurs, represented by two dummy variables. The first group included firms with a single entrepreneur, the second group involved firms with two entrepreneurs (e.g. father and son), and the third group consisted of firms with more than two entrepreneurs.
The availability of a successor may have a positive impact on efficiency, since a successor means a longer planning horizon to be taken into account by an entrepreneur, who thus invests to reach the right scale (Bremmer, 2004).
The location of the greenhouse may play an important role in efficiency of the firm. Greenhouses may benefit from production in a region where their supplier and/or distributor is located as they can then develop synergies and thereby reduce such things as transportation costs and order costs. In this study vegetable firms are grouped according to auction locations e.g. Zuid-Holland is close to the Greenery, while Noord-Brabant and Limburg are near the Zon.
Firm size has been found to have an ambiguous effect on efficiency. Large-scale firms may be more efficient than small-scale farms due to size economies, as larger growers can achieve greater output from a given quantity of labor and machinery (Wilson and Hadley, 1998). However, on large-scale farms, activities are spread over time, making it more difficult to execute them at the optimal time and, hence, to use inputs most efficiently than is the case for small-scale farms (Amara et al., 1999).
The effect of alternative distribution channels has to be isolated from the effect of managerial variables, in order to clarify the impact of alternative distribution channels on grower efficiency. For this, apart from the managerial variables, a variable distribution channel has been introduced, a dummy variable which takes value 1 when a firm markets its product through mixed marketing channels, and value 0 if a firm markets through auctions.
28

2.5 Results and Discussion
2.5.1 Efficiency
Input-based scale efficiency and technical efficiency scores under variable returns-to-scale (VRS) were obtained using the program ONFRONT (Färe and Grosskopf, 2000). Table 3 includes summary statistics of efficiency measures for growers with mixed and auction sales for the whole period 1995-1999.
Table 3. Summary statistics of efficiency measures for growers with mixed and auction sales
Mean Standard Deviation
Minimum Maximum Share of firms fully
efficient (%) Technical Efficiency Mixed Sales 0.91 0.13 0.46 1 69 Auction Sales 0.87 0.15 0.33 1 44 Scale Efficiency Mixed Sales 0.94 0.12 0.60 1 47 Auction Sales 0.86 0.09 0.15 1 21
As seen in Table 3 firms with mixed sales had, as expected, higher relative efficiency scores (mean of 0.91) than firms that sold only through auction (mean of 0.87). These mean values for technical efficiency show that growers could reduce all inputs by an average of 9% (for mixed marketing channels) and 13% (for auction sales), while producing the same output. Average input-based scale efficiency scores show that horticultural firms could reduce all inputs by 6% (mixed marketing channel) and 14% (for auction sales) by scaling operations up or down to optimal size, i.e. using the lowest overall amount of input per unit of output, given the output level.
Another interesting observation is that growers using mixed channels operate on a more efficient scale than those who sell through auction, suggesting that they have a more optimal firm size.
29

The statistical significance of differences in technical efficiency in the two groups (auction sales and mixed sales) was assessed using a non-parametric Mann-Whitney U test. The null hypothesis (no difference) was rejected for the whole sample of the firms. This indicates that the difference is statistically significant at the critical 5% level.
Table 4 shows the average efficiency scores for the entire 1995-1999 period, but not how efficiency scores have changed over the years. In order to analyze this, efficiency scores were determined for each year. Results can be found in Table 4.
Table 4. Technical and scale efficiency of greenhouse growers with mixed sales and with auction sales
1995 1996 1997 1998 1999 Average Technical Efficiency Mixed Sales 0.96 0.72 1 0.99 0.89 0.91 Auction Sales 0.94 0.77 0.91 0.95 0.80 0.87 Scale Efficiency Mixed Sales 0.98 0.80 1 0.98 0.94 0.94 Auction Sales 0.94 0.66 0.92 0.87 0.90 0.86
Table 4 makes obvious that firms using mixed marketing channels were more efficient than firms making sales only through auction for the entire period 1995-1999, except for 1996, when the lowest efficiency scores were recorded for firms using mixed marketing channels (72% compared to 77%). In 1996 a large restructuring of auctions in the Netherlands took place. The larger ones demonstrated a distinct initiative in marketing strategy by means of brand promotion, product innovation and high quality, aiming to become a preferred supplier to major retailers in north-western Europe (Bijman, 2002). However, a small group (4% of our sample) of discontented growers did not want to commit to auction sales and looked into other marketing channels. Wholesalers are generally not interested in dealing with individual growers unless they are atypically large producers (Bijman, 2002). This may influence the efficiency of growers using mixed marketing channels. It is remarkable, that in 1996, 96% of growers were selling their products solely through auctions. Growers became less and less
30

involved in marketing decisions, which the auctions considered their sole responsibility, and this restriction caused resentment among many growers. As consequence many growers left the large auctions (Hendrikse, 2004). For instance in 1996 the Greenery started with approximately 10000 members, but by the end of 2000 only 6000 remained, representing 4000 firms (Bijman, 2002).
A non-parametric Mann-Whitney U test is conducted to test whether technical efficiency differs significantly over the years between these two groups. The results reveal that technical efficiency between these groups significantly differs in 1998 (at 5% critical level) and in 1999 (at 10 % critical level).
It is difficult to assess the cause of this inefficiency. It is possible that growers, dissatisfied with the auctions and preferring mixed marketing channels, are also better overall managers who want to influence their product sales. The second stage of this study therefore focused on the effects of managerial (grower-specific) characteristics on technical and scale efficiency. The efficiency scores were regressed on the explanatory variables listed in Table 2.
2.5.2 Explaining Efficiency
Results of the TRM4 of (VRS) technical efficiency scores and scale efficiency scores are found in Table 5 and 6 respectively. The parameter estimates and t-values indicated that five out of nine parameters used in the first model, and four out of nine parameters in the second model were significant at the critical 5% level. The null hypothesis that coefficients of explanatory variables are equal zero was rejected (F1-value =3.62, F2=6.01, F-critical at 5% =1.90), implying that the explanatory variables in the model were useful in explaining efficiency. The McKelvey-Zavoina R2 was used to assess the goodness of fit of the model. The McKelvey-Zavoina R2 is a Pseudo-R2 and the best predictor of what OLS-R2 would be under uncensored data (Veall and Zimmermann, 1994). These were 20% and 39.7% for the first and the second models respectively.
4 Because an endogeneity problem could have arisen when using the variable �distribution channel� in the second stage (in TRM), the Hausman test was used to test the endogeneity in the second stage. The test yielded a Hausman test statistic of 6.94, which is less than =16.92. Therefore, the null hypothesis, that endogeneity is present, was rejected.
205.0;9χ
31

Table 5. Maximum Likelihood estimates of the Truncated regression for VRS technical efficiency scores
Variable Coefficient S.E. T-value P-value CONSTANT 1.241 0.137 9.017* 0.000 FIRMSIZE -0.001 0.001 -3.042* 0.002 AGE -0.002 0.002 -1.424 0.155 SUC -0.022 0.040 -0.545 0.585 ZUIDHOLL 0.022 0.052 0.409 0.682 BRABLIMB -0.019 0.574 -0.338 0.735 FIRMAGE 0.005 0.002 2.734* 0.006 ENTD1 -0.231 0.093 -2.465* 0.013 ENDT2 -0.191 0.083 -2.277* 0.023 DISTRIBCHAN 0.111 0.054 2.025* 0.042 σ 0.176 0.014 12.613* 0.000 McKelvey-Zavoina R2 = 20% F-value = 3.62; Prob > F = 0.000 * = P < 0.05
Table 6. Maximum Likelihood estimates of the Truncated regression for Scale efficiency scores
Variable Coefficient S.E. T-value P-value CONSTANT 0.791 0.236 3.344* 0.001 FIRMSIZE 0.001 0.001 3.938* 0.000 AGE -0.002 0.003 -0.749 0.454 SUC -0.064 0.071 -0.902 0.367 ZUIDHOLL 0.177 0.090 1.958* 0.049 BRABLIMB 0.242 0.102 2.364* 0.018 FIRMAGE -0.006 0.003 -1.990* 0.046 ENTD1 0.040 0.166 0.240 0.810 ENDT2 0.034 0.154 0.221 0.825 DISTRIBCHAN 0.163 0.110 1.481 0.110 σ 0.272 0.029 9.449* 0.000 McKelvey-Zavoina R2 = 39.7% F-value = 6.01; Prob > F = 0.000 * = P < 0.05
Firm size has a significant negative impact on technical efficiency of the firm and a significant positive impact on scale efficiency. This outcome is in line with the
32

results of Bezlepkina and Oude Lansink (2003) and Amara et al. (1999), implying that management is more efficient in small-scale firms, while larger firms are more difficult to manage. The positive effect on scale efficiency suggests that larger firms are closer to optimal scale due to size economies. This means that larger firms can, ceteris paribus, achieve greater output with a given combination of all inputs. However, this does not necessarily imply better management.
Age5 and availability of a successor are non-significant in explaining technical and scale efficiency. While experience and the existence of a �future� for the business are relevant in sectors like dairy farming, it does not affect the present sample of greenhouse firms. These results correspond to those of Bremmer (2004) and indicate that at any age (or level of experience) good technical results and optimal size can be achieved even when corrected for the presence of a successor.
Firm location has no significant effect on technical efficiency, and a positive significant effect on scale efficiency. Firms that are located near the auctions are also located next to each other. The close location of the firms may imply the presence of study groups. Study groups act by means of exchanging experiences, sharing knowledge about a new technology and keeping informed firm operators about new developments. This is a good opportunity for growers to learn from each other and more easily attain the optimal scale of operations. This could be a reason behind the positive relation between firm location and scale efficiency.
Firm age appeared to have a significant positive influence on the technical efficiency of growers and a significant negative influence on scale efficiency. A possible explanation for this is that, with experience, firms tend to waste less inputs (are technically more efficient), but fail to operate at optimal size, which implies that older firms may have been working at a certain ratio of inputs to outputs for a long time. The initial outlay for a greenhouse, say ten years ago, might have been appropriate at that time, but not anymore, in view of the changes that have taken place in prices and technology. Besides that, more recently established firms may use more up-to-date technology in vegetable production, having recently invested
5 The variable age squared was introduced to avoid the linearity problem between efficiency scores and age. However, the variable age squared appeared not to have a significant impact on the final analysis and was therefore excluded.
33

in it, while relatively older firms have to make costly conversions from their existing technology to the new technology.
Ownership structure of the firm has a significant impact on technical efficiency. Contrary to the results of Amara et al. (1999), single-entrepreneur as well as two-entrepreneur firms are less efficient than firms with a multi-entrepreneur structure. A possible explanation for this is that collective decision-making may increase efficiency due to differences in thinking and experience of the entrepreneurs, each of whom may have a specialization that can be optimally used.
Table 5 makes evident that firms selling their products using mixed marketing channels are technically more efficient than firms marketing solely through auctions. This � in line with the results of the first stage of this study � indicates that using other distribution channels goes hand in hand with increased producer efficiency.
One explanation for the poor performance of firms selling through auctions could be that the firms with mixed marketing channels are relatively free to develop their marketing strategies. They have the choice of selling their products through auctions or contracts, under producer or retailer brand, to wholesalers or retailers, and as individual products or packages of products. Therefore these firms are able to implement separate and unique structures in channel design to achieve basic marketing requirements, thus facilitating efficiency. Furthermore, this outcome could be caused by a price effect. Growers who market their products through mixed marketing channels take a larger portion of the added value from wholesalers by making their product more demand specific. Moreover, they have lower transportation costs since wholesalers take these costs upon themselves. Some of these growers supply their products directly to retailers (e.g. Best Growers Benelux supplies directly to UK retailers), thus reducing transaction costs. Besides, these firms work as a chain with wholesalers and/or retailers and get feedback on their production, which helps to improve efficiency.
2.6 Conclusions
In this paper, DEA was used to generate efficiency scores. DEA is a flexible method to calculate efficiency scores and has the advantage of being a non-
34

parametric approach. DEA efficiency measures also have an advantage of being unit invariant, which means that changing the units of measurement does not change the value of efficiency measures. However, this approach is deterministic, meaning that DEA applications represent point estimates of efficiency without properly accounting for uncertainty surrounding these estimates (Simar and Wilson, 2000). To overcome this problem Simar and Wilson (2000) have suggested the bootstrap procedure. Future research therefore might focus on bootstrapping DEA efficiency scores in order to estimate bias and variance and to construct confidence intervals over efficiency scores.
Our analysis has shown that vegetable growers in general had high relative technical efficiency scores, indicating that the variation in performance was small. But those growers who used mixed marketing channels on average were relatively more efficient than those who sold their total production through auctions. Differences in the efficiency measurements of these two groups were statistically significant, in particular, in 1998 and 1999. Further analysis revealed that these were the years in which the majority of growers switched to mixed marketing channels. The second stage of the analysis was carried out to explain the cause of this inefficiency.
Results of the second stage showed that small-scale firms were technically more efficient than large-scale firms due to their relatively easier management task. The older firms tended to operate with less waste of inputs due to past experience, but failed to operate at optimal scale. Results also suggested that firms with more than two owners were more efficient because of collective decision-making and diversity in experiences. In line with expectations it is found that firms who marketed their products through mixed marketing channels were more efficient in comparison to those using solely auctions as distribution channel. This was the outcome of lower production costs (transport and transaction costs), higher prices for products due to specific demand, freedom in developing unique marketing strategies and the flexibility to produce specific products for different outlets.
References
Alvarez, A., and Gonzalez, E. (1999), �Using cross-section data to adjust technical efficiency indexes estimated with panel data�, American Journal of
35

Agricultural Economics, Vol. 81, No 4, pp. 894-901
Amara, N., Traore, N., Landry, R. and Romain. R. (1999), �Technical efficiency and farmers� attitudes toward technological innovation: The case of the potato farmers in Quebec�, Canadian Journal of Agricultural Economics, Vol.47, pp.31-43.
Banker, R.D., Charnes, A. and Cooper, W.W. (1984), �Some models for estimating technical and scale inefficiencies in data envelopment analysis�, Management Science, Vol. 30, pp. 1078-1092
Beamon, M. (1998), �Supply chain design and analysis: Models and methods�, International Journal of Production Economics, Vol. 55, pp. 281-294.
Bezlepkina, I. and Oude Lansink, A. (2003), �Debts, subsidies and performance of Russian agricultural enterprises�, in A. Balmann and A. Lissitsa (Eds.), Proceedings of the International Workshop �Large farm management�, Vol. 20, pp.67-90, Halle (Saale), Germany, AgriMedia.
Bijman, J. (2002), Essays on agricultural co-operatives. Governance structure in fruit and vegetable chains. PhD thesis, Erasmus University, Rotterdam
Boonekamp, G.F.J. (2002), Significant changes in the European greenhouse vegetable industry. Paper presented at the Canadian Greenhouse Conference, Toronto, Ontario, October, 2002
Bowersox, D.J. and Cooper, M.B. (1992), Strategic marketing channel management, McGraw-Hill, Inc., New York
Bremmer, J. (2004), Strategic decision making and firm development in Dutch greenhouse horticulture, PhD thesis, Wageningen University, Wageningen
Burki, A. and Terrel, D. (1998), �Measuring production efficiency of small firms in Pakistan�, World Development, Vol.26, pp. 155-169
Chambers, R.G., Cooper, WW, Fare, R., Jaenicke, E. and Lichtenberg, E. (1998), �Using dominance in forming bounds on DEA model: The case of experimental agricultural data�, Journal of Econometrics, Vol. 85 No 1, pp.189-203
36
Charnes, A., Cooper, W.W., and Rhodes, E. (1978), �Measuring the efficiency of decision-making units�, European Journal of Operational Research, Vol. 2 No 6, pp. 429-444
Christopher, M. (2000), �The agile supply chain�, Industrial Marketing Management, Vol. 29, pp. 37-44
Coelli, T., Rao, D.S.P. and Battese, G.E. (1998), An introduction to efficiency and productivity analysis. Norvell, Mass, Kluwer Academic Publisher
Cox, T.L. and Wohlegenant, M.K. (1986), �Prices and quality effects in cross-sectional demand analysis�, American Journal of Agricultural Economics, Vol. 68, No 4, pp.908-919
Färe, R. and S. Grosskopf. (2000), Reference guide to ONFRONT, Measurement and Quality, I Lund AB
Färe, R., Grosskopf, S. and Lovell, C.A.K. (1994), Production frontiers, Cambridge University Press, London
Farell, M.J. (1957), �The measurement of productive efficiency�, Journal of the Royal Statistical Society, Vol. 3, pp. 253-290
Fraser, I. and Cordina, D. (1999), �An application of data envelopment analysis to irrigated dairy farms in Northern Victoria, Australia�, Agricultural Systems, Vol.59, pp. 267-282
Hendrikse, G.W.J (2004), Restructuring agricultural cooperatives, Rotterdam, Erasmus University Press
Hendrikse, G.W.J. and Bijman, W.J.J. (2001), �On the emergence of growers� associations: Self-election versus market power�, Working paper ERIM Report Series Research in Management. ERS-2001-34-ORG
Johnston, J. and DiNardo, J. (1997), Econometric methods, Fourth Edition, McGraw-Hill International Edition
Li, D. and O�Brien, C. (1999), �Integrated decision modelling of supply chain efficiency�, International Journal of Production Economics, Vol. 59, pp. 147-
37

157
Macdonald, M. (1998), Marketing Plans, How to prepare them, how to use them, Fourth Edition. Butterworth Heinemann, London
Ondersteijn, C., Giesen, G. and Huirne, R. (2003), �Identification of farmer characteristics and farm strategies explaining changes in environmental management and environmental and economic performance of dairy farms, Agricultural Systems, Vol. 78 No1, pp. 31-55
Oude Lansink, A. and Silva E. (2003), �CO2 and energy efficiency of different heating technologies in the Dutch glasshouse industry�, Environmental and Resource Economics, Vol. 21, pp. 395-407
Simar, L. and Wilson, P. (2000), �A general methodology for bootstrapping in nonparametric frontier models� Journal of Applied Statistics, Vol. 27, pp. 779-802
Shipley, D., Colin, E. and Edgett, S. (1991), �Meeting source selection criteria: Direct versus distribution channels�, Industrial Marketing Management, Vol. 20, pp. 297-303
Stern, L.W. and El-Ansary, A.I. (1977), Marketing channels, Prentice-Hall Inc., Englewood Cliffs, New Jersey
Veall, R. and Zimmermann, F. (1994), �Goodness of fit measures in the tobit model�, Oxford Bulletin of Economics and Statistics, Vol.56, pp. 485-99
Wilson, P. and Hadley, D. (1998), �Measuring and explaining technical efficiency in UK potato production�, Journal of Agricultural Economics, Vol.49, pp. 294-305
38

3
CHAPTER 3 Performance Indicators in Agri-Food
Production Chains
Lusine H. Aramyana, Christien J.M. Ondersteijnb, Alfons G.J.M. Oude Lansinka, Olaf van Kootenc
a Business Economics Group, Wageningen University, Hollandseweg 1, 6706 KN Wageningen, The Netherlands
b Alfa-Accountants en Adviseurs, P.O. Box 27, 4200 AA Gorinchem, The Netherlands
c Horticultural Production Chains group, Wageningen University, Marijkeweg 22, 6709 PG Wageningen, The Netherlands
Published in Ondersteijn et al. (2006), Quantifying the Agri-Food Supply Chain, pp. 47-64, Springer, Dordrecht
39

Abstract
The last decade has seen an increasing interest in indicators of supply chain performance. A large number of various performance indicators has been used to characterize supply chains, ranging from highly qualitative indicators like customer or employee satisfaction to quantitative indicators like return on investments. This large number of different performance indicators, and the lack of consensus on what determines performance of supply chains, complicates the selection of performance measures. Furthermore, combining these indicators into one measurement system proves to be difficult. Efforts as well as progress have been made in this area but supply chain performance measurement received little attention in the field of food and agribusiness. This paper provides a literature review on existing performance indicators and models, and discusses their usefulness in agri-food supply chains. Furthermore, based on this overview, a conceptual framework is developed for further research in this area.
Key words: measure, efficiency, responsiveness, flexibility, food quality
3.1 Introduction
A supply chain is generally defined as a network of physical and decision making activities connected by material and information flows that cross organizational boundaries (Van der Vorst, 2000). According to Lambert and Cooper (2000) there are four main characteristics of a supply chain: first it goes through several stages of increasing intra- and inter- organizational, vertical co-ordination. Second, it includes many independent firms, suggesting that managerial relationship is essential. Third, a supply chain includes a bi-directional flow of products and information and the managerial and operational activities. Fourth, chain members aim to fulfill the goals to provide high customer value with an optimal use of resources. Agri-food chains is nothing more than a supply chain which produces and distributes an agricultural or horticultural product and where product flows and information flows take place simultaneously (Bijman, 2002). What makes agri-food supply chains different from other supply chains is (1) the nature of production, which is partly based on biological processes, thus increasing variability and risk (2) the nature of the product, which has specific characteristics like perishability and bulkiness that require a certain type of supply chain, and (3)
40

the societal and consumer attitudes towards issues like food safety, animal welfare and environmental pressure.
Within a chain, co-ordination may take various forms: vertical integration, long-term contracts or market transactions. Recent studies have shown that in agri-food supply chains, transactions are undergoing several changes (Bijman, 2002). Most agri-food sectors are moving closer to vertical co-ordination. Some industries (e.g. poultry) developed tight vertical co-ordination some time ago, while in others it is a relatively new phenomenon (Hobbs and Young, 2000). The major change is the shift from a production orientation to a market orientation in the strategy of producers. This change leads to an increase in the information exchange among agri-food chain members. Another change relates to product innovation, which has become very important in agri-food chains. All these changes are the result of an increasing consumer demand for more quality and a larger variety of products. Moreover, issues such as food safety and production conditions are major concerns for consumers nowadays. Apart from the changes in preferences of consumers, there are also structural changes in processing and retailing of agri-food products. Processors and retailers have become larger and more internationalized. Agricultural polices have undergone several changes at national and EU level as well, which lead to a decreasing level of market protection and to shifting priorities in spending public funds.
The development of more integrated supply chains was not followed by simultaneous development of supply chain performance indicators and metrics in order to assess the effectiveness of a particular chain organization (Gunasekaran et al., 2001). This is not only true for agri-food chains, but reflects the general developments in this area. Measurement of supply chain performance gives decision-makers inside (e.g. producers, distributors, marketers) and outside (e.g. policy makers, investors) the supply chain information for decision-making, policy development etc. The goal of this study is to develop a flexible conceptual framework for measuring the performance of agri-food supply chains that can be used by different decision-makers. The objectives of this paper are therefore:
1. To provide a literature review on existing performance indicators in supply chains;
2. To give an overview of different methods and models used to measure performance of supply chains;
41

3. Based on the literature review to develop a conceptual framework on performance indicators selection in agri-food supply chains.
3.2 Performance Indicators in Supply Chains
In 1992 Lee and Billington found that no adequate supply chain metrics exist, and firms, even if they are participating in coordinated supply chains, only aim at achieving their own performance standards. Beamon (1999) looked at performance indicators used in supply chain modeling and concluded that �current supply chain performance measurement systems are inadequate because they rely heavily on the use of cost as primary measure, they are not inclusive, they are often inconsistent with the strategic goals of the organization, and do not consider the effects of uncertainty. A few years later, Gunasekaran et al. (2001) reviewed the literature of performance metrics of supply chains again and concluded that there is still a lack of a balanced approach with regards to financial as well as non-financial indicators and the number of performance indicators to be used. Furthermore, no distinction is made between indicators of operational, tactical and strategic level. In their work Gunasekaran et al. (2004) develop a conceptual model for supply chain performance at three levels: strategic, tactical and operational. There seems to be consensus about the fact that no supply chain measurement system exists that is inclusive, universal, measurable as well as consistent (Beamon 1998). There is less agreement, however, on the matter of what such a system should look like. Hannus1 (1991) emphasizes that a supply chain measurement system should reflect the objectives of main interest groups (customers, owners and personnel), it should combine operational and financial follow-up data, and link operational objectives to critical success factors and goals. He suggests using three main categories of performance indicators: customer satisfaction, flexibility and efficiency, and to pay attention to three main indicators such as quality, time and costs in these main categories. In his paper he developed an approach for business process re-engineering. This approach was lately described in the work of Korpela et al.
1 The work of Hannus is taken from the paper written by Korpela et al., 2002
42

(2002) as the basic theoretical framework in supply chain development and combined with the theory of analytic hierarchy process (AHP). This paper was an attempt to demonstrate how the analytic hierarchy process can be used for supporting the supply chain development process.
Murphy et al. (1996) conducted a two-stage study, where the first stage gave an overview of performance indicators and their dimensions used in literature from 1987-1993 and the second stage examined the relationship between performance variables and the existing performance dimensions. In their work Murphy et al. (1996) used 19 performance indicators, mostly being of financial nature such as net income or return on investments. In 1999, Beamon suggested a system of three dimensions: resources (i.e. efficiency of operations), output (i.e. high level of customer service) and flexibility (i.e. ability to respond to a changing environment). Persson and Olhager (2002) adhered to this three-dimension system. Based on results of simulation model they concluded that good quality and short lead-times in integrated and synchronized supply chains leads to superior performance. The payoff in terms of total cost is more than proportional to the improvements in quality and lead-times.
Li and O�Brien (1999) suggested a model to improve supply chain efficiency and effectiveness based on four criteria, profit, lead-time performance, delivery promptness and waste elimination. Their model analyses the supply chain performance at two levels, the chain level and the operational level. At the chain level, assumptions for these four criteria are set for each supply chain stage so that the supply chain performance can meet the customer service objectives. At the operations level, manufacturing and logistics procedures are optimized under the given objectives and three different strategies. The results of the model revealed that lead-time performance is the most influential factor for the choice of the strategy. Berry and Naim (1996) and later on Li and O�Brein (1999) emphasize that the efficiency of supply chains can generally be improved by reducing the number of manufacturing stages, reducing lead-times, working interactively rather than independently between stages and speeding up the information flow. Efficiency and effectiveness were also used in the work of Lai et al. (2002) to evaluate the supply chain performance in transport logistics. Lai et al. identified three dimensions of supply chain performance in transport logistics. Those dimensions are service effectiveness for shippers, operational efficiency and service effectiveness for consignees. Within these dimensions they identified four
43

performance indicators such as responsiveness, reliability, costs and assets.
Van der Vorst (2000) distinguished several performance indicators for food supply chains on three levels: supply chain, organization and process. At supply chain level five indicators are distinguished: product availability, quality, responsiveness, delivery reliability and total supply chain costs. At organization level again five indicators are distinguished: inventory level, throughput time, responsiveness, delivery reliability and total organizational costs. Finally at process level four indicators are distinguished: responsiveness, throughput time, process yield and process costs. Thonemann and Bradley (2002) follow the line of Eppen (1979) and analyze the effect of product variety on supply chain performance, measured in terms of expected lead time and expected cost at the retailer level in a single manufacturer and multiple retailer model. They showed that underestimating the cost of product variety leads companies to offer product variety that is greater than optimal. The authors also demonstrate how supply chain performance can be managed by reducing the set up time, the unit manufacturing time, the number of retailers or the demand rate.
In 2003 Claro et al. built an integrated framework for Dutch potted plants and flower production that aimed at the combination of constructs on the transaction, dyadic and business environment level for testing their impact on relational governance and performance. Each of these three levels consists of different determinants. Determinants of transaction level are exchange mode, human and physical transaction-specific assets, determinants of dyadic level are length of business interaction and organizational trust, and finally, determinants of business environmental level are network intensity and environmental instability. As an indicator of relational governance they used joint planning and joint problem solving and as indicator of performance they used sales growth rate and perceived satisfaction. The results revealed that the dimensions of relational governance positively affect sales growth and perceived satisfaction, except that joint planning is not related to perceived satisfaction.
The literature review shows that many attempts have been made to develop a measurement system for supply chains. However, measuring performance of agri-food supply chains received little attention. Table 1 summarizes the papers described above in the most commonly used categorization: efficiency, flexibility and responsiveness. Efficiency aims to maximize value added by the process and minimize the cost absorbed in inventories. It includes several indicators, but the
44

most commonly used are costs, profit, return on investment and inventory (inventory investments, inventory obsolescence). Flexibility indicates the degree to which the supply chain can respond to a changing environment. Flexibility includes customer satisfaction, reduction in the number of backorders, lost sales, late order. Responsiveness aims at a high level of customer service and may include fill rate, product lateness, customer response time, lead time, and shipping errors.
Table 1. Literature review on supply chain performance measures
Author Sector Customer responsiveness
Efficiency Flexibility Other Number of indicators
Eppen (1979) Steel Production X 1 Hannus (1991) Manufacturing X X 3 Lee & Billington (1992)
Manufacturing X 1
Berry and Naim (1996)
Manufacturing X X X 4
Murphy et al.(1996) Different industries
X X 35
Beamon (1998) Manufacturing X X X X 16 Beamon (1999) Manufacturing X X X X 33 Li & O�Brien (1999) Manufacturing X X X X 11 Talluri et al. (1999) Manufacturing X X X 9 Van der Vorst (2000) Food X X X X 8 Gunasekaran (2001) Not specified X X X X 43 Thonemann & Bradley (2002)
Manufacturing X X 2
Korpela et al. (2002) Not specified X X X 3 Lai et al. (2002) Transport X X X X 4 Talluri & Baker (2002)
Manufacturing X X X X 15
Persson & Olhager (2002)
Manufacturing X X X X 7
Claro et al. (2003) Horticulture X X 2 Gunasekaran (2004) Different
industries X X X X 45
As can be seen from Table 1 research on agri-food supply chains is rather limited. Furthermore, the literature review showed several performance indicators which could not be placed under one of the three categories and are therefore placed in a category �other�. These performance indicators are, for instance, range of products
45

and services, variations against budget, product differentiation, stockout probability, etc.
3.3 Models and Methods to Assess Supply Chain Performance
Different methods exist which can incorporate multiple performance indicators into one measurement system. Some of the most well-known are the Supply Chain Council�s SCOR Model, the Balanced Scorecard, Multi-Criteria Analysis, Data Envelopment Analysis, Life-Cycle Analysis, and Activity-Based Costing. The review in this section discusses different measurement methods and the advantages and disadvantages of these methods.
The Supply Chain Council's Supply Chain Operations Reference (SCOR®) Model is a standard supply chain process reference model designed to fit all industries (Supply-Chain Council, 2004). This model provides guidance on the types of metrics decision-makers can use to develop a balanced approach towards measuring the performance of an overall supply chain. The SCOR® Model advocates a set of supply chain performance indicators as a combination of:
1. reliability measures (e.g. fill rate, perfect order fulfillment)
2. cost measures (e.g. cost of goods sold)
3. responsiveness measures (e.g. order fulfillment lead-time)
4. asset measures (e.g. inventories)
The SCOR® Model directly addresses the needs of supply chain management at the operational level. One of the tenets of the SCOR® Model is that a supply chain must be measured and described in multiple dimensions. These dimensions include reliability, responsiveness, flexibility, cost, and efficiency of asset utilization. The SCOR model is a cross-industry model that decomposes the processes within a supply chain and provides a best-practice view of supply chain processes. The advantages of the SCOR® model are that it takes into account the performance of the overall supply chain, it proposes a balanced approach by describing performance of supply chain in multiple dimensions. Disadvantages include the
46

fact that SCOR® is very operations oriented and does not attempt to describe all relevant business processes or activities such as sales and marketing, research and technology developments, product developments, post-delivery customer support. Secondly, and related to the pervious disadvantage, SCOR® assumes but does not explicitly address training, quality, information technology and administration (Supply-Chain Council, 2004). Scientific research using the SCOR® model is limited. Based on the SCOR model (developed by Stephens, 2000) Lai et al. (2002) used the model to evaluate supply chain performance. Lai et al. (2002) identified three dimensions of supply chain performance in transport logistics, which are service effectiveness for shippers, operational efficiency and service effectiveness for consignees. Based on these three dimensions a 26-item supply chain performance measurement instrument was constructed, which was tested empirically and found to be reliable and valid for evaluating supply chain performance in logistics. Wang (2003) related product characteristics to supply chain strategy in order to analyse a product-driven supply chain selection and adopted SCOR-model�s performance metrics as the decision criteria for supplier selection. Based on the SCOR model they developed an analytic hierarchy process (AHP) with overall objective to achieve optimal supplier efficiency. Then, authors developed an integrated multi-criteria decision-making methodology based on AHP and pre-emptive goal programming (PGP) so that it takes into account both qualitative and quantitative factors in supplier selection. They found that integrated AHP-PGP methodology can select the best set of multiple suppliers to satisfy suppliers� capacity constraint.
The Balanced Scorecard is a popular performance measurement scheme initially developed by Kaplan and Norton (1992). This method employs performance metrics from financial (e.g. cost of manufacturing and cost of warehousing), customer (e.g. on-time delivery and order fill rate), business process (e.g. manufacturing adherence-to-plan), innovation and technology perspective (e.g. new product development cycle time). By combining these different perspectives, the balanced scorecard helps a manager to understand the interrelationships and tradeoffs between alternative performance metrics and leads to improved decision making. This method is not specifically designed for supply chains but could be adapted to focus on supply chain performance. The Balanced Scorecard is more tactical and strategically oriented compared with the SCOR® model, which is an operation oriented method.
47

The advantages of the Balanced Scorecard are that it uses four performance dimensions, both financial and non-financial, which ensures that management is given a balanced view on performance. Finally, a top level strategy and middle management level actions are clearly connected and appropriately focused. Disadvantages are that this approach requires considerable thoughts and effort to develop an appropriate scorecard, the scorecard do not include market-oriented performance indicators, and complete implementation should be staged (Coronel, 1998). The Activity-Based Costing (ABC) method is based on accounting methods and involves breaking down activities into individual tasks or cost drivers, while estimating the resources (i.e., time and costs) needed for each one. Costs are then allocated based on these cost drivers, such as allocating overhead either equally or based on less-relevant cost drivers. This approach allows for better assessing the productivity and costs of a supply chain process. By means of the ABC method companies can more accurately assess, for instance the costs of services for a specific customer or the costs of marketing a specific product. Hence, businesses can understand the factors that drive each major activity, the costs of activities, and the relationship between activities and products. ABC analysis does not replace traditional financial accounting, but provides a better understanding of performance by looking at the same numbers in a different way (Lapide, 2000).
The advantages of ABC are that it gives more than just financial information and it recognizes the changing cost behavior of different activities as they grow and mature. Disadvantages are that ABC, like the Balanced Scorecard is not developed for supply chains but could be adapted. Furthermore, data collection can be costly and time consuming. While it is difficult to determine appropriate cost drivers in ABC for businesses, this may even prove to be a bigger challenge for supply chains. ABC focuses primarily on costs.
Traditional accounting is focused on short-term financial results like profits and revenues, providing little insight into the success of an enterprise towards generating long-term value to its shareholders. To overcome this problem, the estimation of a company's Economic Value-Added (EVA) was introduced. This method is based on the assumption that shareholder value is increased when a company earns more than its cost of capital. Unlike balanced scorecards, which offer a functional focus toward performance, the EVA offers a project focus. EVA attempts to quantify value created by an enterprise, basing it on operating profits in excess of capital employed (through debt and equity financing). EVA metrics are
48
less useful for measuring detailed supply chain performance. They can be used, however, as the supply chain metrics within an executive-level performance scorecard, and can be included in other measurement systems such as e.g., The Logistics Scoreboard approach (Lapide, 2000). The advantages of EVA are that it explicitly considers the cost of capital and allows projects to be viewed separately. Disadvantages of EVA are its difficulties with computations and allocation of EVA among divisions.
Multi-Criteria Analysis (MCA) establishes preferences between options by reference to an explicit set of objectives that the decision-maker has identified, and for which he or she has established measurable criteria to assess the extent to which the objectives have been achieved. This method is designed to support decision-makers facing complex, multi-dimensional problems (Romero and Rehman, 2003). Several techniques exist, like direct analysis of the performance matrix, multi-attribute utility theory, linear additive models, procedures that use qualitative data inputs and so on. The following steps are carried out by the decision-makers in MCA:
1. identify the feasible alternatives or preferred outcomes
2. identify the criteria by which to judge these outcomes
3. apply appropriate weights on each of the criteria which reflects their particular preferences.
One of the biggest advantages of MCA is that it facilitates a participatory approach to decision making. Another advantage is that the interactive nature of the approach enables both analyst and decision maker to learn more about the problem. Finally, it is suitable for problems where monetary values of the effects are not readily available. On the other hand, although MCA does not necessarily require quantitative or monetary data, the information requirements to derive the weights can be considerable. Furthermore, despite the use of explicit weights in MCA, the analyst may unintentionally introduce implicit weights during the evaluation process that may lead to results that cannot be explained.
Life-Cycle Analysis (LCA) involves making detailed measurements of input use and environmental waste during the production of a product, from the mining of the raw materials used in its production and distribution, through to its use,
49

possible re-use or recycling, and its eventual disposal. LCA has thus far focused on the environmental burden a product poses throughout its life. It offers possibilities for extension to economic performance, when combined with life cycle cost assessment method (Azapagic and Clift, 1999; Hagelaar and Van der Vosrt., 2002; Carlsson-Kanyama et al., 2003). Using life cycle cost assessment method it is possible to integrate economic and environmental cost information into LCA framework and assess the cost and environmental effects associated with life cycle of a product or process. The advantage of this method lies in the fact that LCA allows the establishment of comprehensive baselines of information on a product�s or processor�s resource requirement. Secondly, it allows identifying areas within a product�s life cycle, where the greatest reduction of environmental burdens can be achieved. LCA has two main disadvantages. First, it is data-intensive methodology. Second, the proliferation of conflicting life cycle analyses on the same products (environmental indexes assigned to each type of material can be influenced by the criteria and priority in developing the indices) are causing customers confusion and a lack of confidence in the LCA methodology.
Hagelaar and Van der Vorst (2002) used Life Cycle Assessment (LCA) to structure environmental supply chains. Their main objectives were:
1. to develop guidelines for managers of supply chains from an environmental perspective
2. to relate a supply chain to its environmental performance
3. to assess the applicability of LCA as a tool for environmental supply chain management.
They concluded that if chains use LCA as a management instrument, they may have to adjust the chain structure to meet requirements set for the use of that instrument. In their paper they argue that in line with a differentiation between environmental care, chain strategies, and environmental chain performances, a differentiation between types of LCA should be made, i.e., between compliance-process and market-oriented LCAs. To execute these different types of LCAs, the chain structure should be adjusted to meet the specific requirements of these types. They found that the choice of the type of LCA is conditional on factors external and internal to the chain such as competition, governmental laws, consumer preferences (external) and budget, knowledge, technology, co-operation (internal)
50

etc. Thus the integration of different types of LCAs in the chain brings about a different chain structure.
Data Envelopment Analysis (DEA) measures the efficiency of a firm (chain) relative to the efficiency of competitors. The problem with respect to efficiency in supply chains is that beside direct outputs, which are delivered directly to the market, a firm also produces output, which is input to a firm in the next stage. These intermediate outputs are intermediate inputs to the firm in the adjacent stage, next to the direct inputs. Contributions of Zhu (2003) in this field are a first step towards measuring supply-chain-efficiency. The method allows inclusion of various dimensions, e.g. economic and environmental performance. The problem with measuring supply-chain -efficiency using DEA model is that it requires an enormous amount of data, while data gathering is one of the most complex issues in a supply chain context. The advantages of DEA modeling are numerous. DEA takes a systems approach which means, that it takes into account the relationship between all inputs and outputs simultaneously. DEA generates detailed information about the efficient supply chain within a sample and which supply chains can be used as a benchmark. DEA does not require a parametric specification of a functional form to construct the frontier. Thus there is no need to impose unnecessary restrictions on the functional forms that very often become a cause of distorted efficiency measures. DEA has the disadvantage of being a deterministic approach, which implies that statistical noise may be confounded with inefficiency.
Talluri et al. (1999) studied the importance of partner selection process in designing efficient value chains. They propose a two-stage framework, where the first stage involves identification of efficient candidates for each type of business process (manufacturing, distribution, etc.) using DEA and the second stage encompasses the use of an integer goal programming model to select an effective combination of the efficient business processes. Talluri and Baker (2002) proposed a multi-phase mathematical programming approach for effective supply chain design. They developed a combination of multi-criteria efficiency models based on game theory concepts and linear integer programming methods. The first phase evaluates suppliers, manufacturers and distributors in terms of their efficiencies with respect to input used and output generated. The model developed in this phase is a combination of a DEA model and a Pair-wise Efficiency Game (PEG). These methods generate an efficiency score for each candidate. The second phase includes the application of an integer-programming model, which optimally selects
51

candidates for supply chain network design by integrating efficiency scores from the first phase, demand and capacity requirements, and location constraint. The third phase identifies the optimal routing for all individuals in the network by solving a minimum-cost transshipment model.
Table 2. Advantages and disadvantages of methods to assess supply chain performance
Method Advantages Disadvantages Activity-Based Costing (ABC)
• Gives more than just financial information • Recognizes the changing cost behavior of different
activities
• Costly data collection • Difficulties to collect initial required
data • Difficulties to determine appropriate
and acceptable costs drivers Balanced Scorecard
• Balanced view about the performance • Financial and non-financial factors • Top level strategy and middle management level
actions are clearly connected and appropriately focused
• Not a quick fix • Complete implementation should be
staged
Economic Value-added (EVA)
• Considers the cost of capital • Allows projects to be viewed separately
• Computations difficulties • Difficult to allocate EVA among
divisions Multi-Criteria Analysis (MCA)
• A participatory approach to decision making • Enables decision-maker to learn more about the
problem • Suitable for problems where monetary values of the
effects are not readily available
• Information requirements to derive the weights can be considerable
• Possibility to introduce implicit weights leading to results that cannot be explained
Life-Cycle Analysis (LCA)
• Allows to establish comprehensive baselines of information on a product�s or processor�s resource requirement
• Allows to identify areas where the greatest reduction of environmental burdens can be achieved
• Possibility to assess the cost and environmental effects associated with life cycle of a product or process
• Data-intensive methodology • Lack of confidence in the LCA
methodology
Data Envelopment Analysis (DEA)
• All inputs and outputs are included • Generates detailed information about the efficient
firms within a sample • Does not require a parametric specification of a
functional form
• Deterministic approach • Data-intensive
Supply Chain Council�s SCOR Model
• Takes into account the performance of overall supply chain
• Balanced approach • Performance of supply chain in multiple dimensions
• Does not attempt to describe every business process or activity
• Does not explicitly address training, quality, information technology and administration
52

It is clear from Table 2 that all described methods have their advantages and disadvantages. Therefore, there is a need to carefully consider all arguments for and against the selected method to measure supply chain performance. It is also possible to combine two different methods to measure supply chain performance. For instance balanced scorecard can be combined with economic value-added, because economic value added method is project focused, while balanced scorecard is functional focused. Nevertheless, when using a combination of different performance measurement methods, great care needs to be taken to avoid conflicts between different performance matrices used to evaluate the performance of the chain in different dimensions.
3.4 Agri-food Supply Chains
When developing a supply chain measurement system it is imperative to consider the supply chain to be measured since they may have specific characteristics. In general two types of agri-food supply chains can be distinguished:
1. supply chains for fresh products such as fresh vegetables, flowers, and fruit
2. supply chains for processed food products such as canned food products, dessert products, etc.
This research is focused on supply chains for fresh agricultural products, more specifically on vegetable supply chains. These supply chains consist of growers, auctions, wholesalers, importers and exporters and retailers. The main processes are producing, storing, packing, transportation and trading of these products. These supply chains have many specifications, which set them apart from other types of supply chains. Several authors (Van der Vorst, 2000; Van der Spiegel, 2004) have summarized the following specific aspects of agri-food supply chains:
1. Shelf life constraints for raw materials and perishability of product, intermediates and finished products and changes in product quality level while progressing the supply chain (decay)
2. Long production throughput time (production of new or additional products requires long time)
53

3. Seasonality in production
4. Seasonal supply of products requires global sourcing
5. Requires conditioned transportation and storage
6. Variable process yield in quantity and quality due to biological variations, seasonality, factors connected with weather, pests and other biological hazards
7. Storage buffer capacity restrictions, when materials or products can only be kept in special containers
8. Governmental rules concerning environmental and consumer-related issues (CO2 emission, food safety issues)
9. Physical product features: like sensory properties such as taste, odor, appearance color, size and image
10. Additional features: e.g. convenience of ready-to-eat meal
11. Product safety: increased consumer attention concerning both product and method of production. No risks for the consumer of foods are allowed
12. Perceived quality: is also relevant for food applications. For example advertisement or brands (marketing) can have a considerable influence on quality perception
Recent socio-economic developments have resulted in a change in performance requirements for food supply chains as a whole and for all stages in the supply chain (Van der Vorst, 2000). This change is the outcome of the variation in buying behaviour of consumers. Consumer preferences have become the major determinant of quality and production methods. Food safety and human health are important social concerns, particularly, when it comes to greenhouse vegetables (Buurma, 2001). Consequently, demand for fresher products and products with higher added values increases. The use of pesticides and other chemicals negatively affect consumers buying behavior. Consequently, consumers have high demands on a broad range of quality aspects like food safety, production characteristics, sensory properties, shelf life, reliability, convenience, availability and quality/price
54

ratio (Van der Spiegel, 2004). The risks associated with poor quality, (e.g. outbreaks of animal diseases and low food safety), are so high, that retailers and consumers claim to be increasingly prepared to pay more for higher quality (Van der Vorst et al., 2001). Nonetheless, �price-wars� in supermarkets that are vying for consumers� loyalty and international competition are putting pressure on prices. Furthermore, regardless of all the demands for specific attributes, many consumers around the world remain price-buyers.
Agri-food supply chains are very sensitive to policy changes concerning the environmental issues. During the past 7-10 years, in The Netherlands public concerns arose about the production system for greenhouse vegetables (Buurma, 2001). These concerns were associated with pollution, industrial processes and bulk production. The government took responsibility and covenants, were concluded to reduce the use of pesticides and energy by 50%. Besides the consumers� preference variation, environment plays a crucial role in agri-food supply chain performance assessment, because agricultural products strongly influenced by nature. The environmental variability (e.g. weather conditions) can be reflected in the quantity and the quality of the farm products. The perishability of fresh products such as fruits and vegetables put strains on logistics and quality management. Given these facts we can say that food quality and environmental issues have a great impact on agri-food supply chain performance. Thus, based on the specifications of agri-food production, when developing a performance measurement system for agri-food supply chains, the indicators that reflect the quality aspects of product and processes are highly relevant (freshness, food safety, environmental issues, etc.) and together with other financial and non-financial indicators, included into one performance measurement system.
Quality is difficult to define and therefore difficult to measure. The quality indicators of a product in literature are often divided into intrinsic and extrinsic quality attributes (Jongen, 2000; Luning et al., 2002; Tijskens, 2004) or similarly into product and process quality indicators (Northen, 2000). For years, performance of production systems has commonly been evaluated by measuring costs or by measuring the intrinsic product quality such as product safety and sensory properties (taste, color, texture) (Van der Spiegel, 2004). Quality is a multidimensional construct that is based on both perceived intrinsic and extrinsic quality attributes available in the shop (Acebrón et al., 2000). This means that a buying decision is based on more than only intrinsic properties of a product,
55

extrinsic properties also play a role.
Intrinsic quality indicators refer to physical properties such as flavor, texture, appearance, shelf life and nutritional value. The properties are directly measurable and objective. Quality is formed by turning physical properties of a product into quality attributes by the perception of the consumer (Jongen, 2000). The intrinsic product properties define the state of the product, which is evaluated with respect to quality criteria imposed by a producer or user (Sloof et al., 1996).
Extrinsic quality attributes refer to the production system and include factors such as the amount of pesticides used, type of packaging material, and use of biotechnology (Jongen 2000). Extrinsic factors do not necessarily have a direct influence on physical properties, but influence the acceptance of the product for consumers. The total of intrinsic and extrinsic factors determines the purchase behavior (Jongen, 2000).
In this study we follow the division according to the division into intrinsic (product) and extrinsic (process) quality indicators by Luning et al., 2002. In their work, Luning et al., (2002) have divided product quality into three aspects:
1. food safety and health
2. sensory properties and shelf life
3. product reliability and convenience
Process quality also consists of three aspects:
1. production system characteristics
2. environmental aspects
3. marketing.
Within product safety and health, health refers to food composition and diet. Food safety refers to the requirement that products must be �free� of hazards with an acceptable risk. The sensory perception of food is determined by the overall sensation of taste, odor, color, appearance, texture and sound, which are determined by physical features and chemical composition. The shelf life of a
56

product can be defined as the time between harvesting or processing and packaging of the product and the point at which it becomes unacceptable for consumption. Product reliability refers to the compliance of actual product composition with product description and convenience relates to the ease of use or consumption of the product for the consumer (Luning et al., 2002). Production system characteristics refer to the way a food product is manufactured and includes factors such as pesticides used, animal welfare and use of genetic engineering. Environmental implications of agri-food products refer mainly to the use of packaging and food waste management. Marketing efforts determine quality attributes, affecting quality expectation. Process specifications include the type of equipment needed and handling conditions required. Jongen, (2000) and Northen (2000) name traceability and organic production as examples of process indicators.
3.5 Developing a Conceptual Framework
Based on the literature review on existing performance indicators and taking into account the theoretical frameworks underlying the different methods and models such as SCOR® model and/or Balanced Scorecard, the conceptual framework has been developed. The framework takes into consideration specific characteristics of agri-food supply chains. For this purpose, the agri-food supply chain performance indicators are grouped in four main categories: efficiency, flexibility, responsiveness and food quality. The categories efficiency, flexibility and responsiveness are chosen based on Table1. These main categories contain more detailed performance indicators. Based on framework of food quality developed by Luning et al. (2002), the specification of agri-food supply chains are grouped under the category �food quality�. Adding the category �food quality� to the three other categories derived from the literature review results in a complete conceptual framework for measuring the performance of agri-food supply chain (Figure 1).
57

Food Quality
Customer satisfaction Volume flexibility Delivery flexibility The number of: ! Back orders ! Lost sales
Flexibility
Costs ! Production costs ! Distribution costs ! Transaction cots Profit Return on investment Inventory
Efficiency
Product Quality ! Sensory properties and
shelf-life ! Product safety & health ! Product reliability and
convenience Process quality ! Production system ! Environmental aspects ! Marketing
Fill rate Product lateness Customer response time Lead time Shipping errors Customer complaints
Responsiveness
Performance
Figure 1. Conceptual framework of agri-food supply chain performance indicators
3.6 Future Outlook
This paper reviewed the available supply chain performance indicators and models and methods used to asses the performance of supply chains. Based on the existing body of research in supply chain performance measurement systems a research
58

framework has been suggested for measuring the performance of agri-food supply chains. The suggested framework is based on a literature review and needs to be empirically tested. In future research this conceptual framework will be tested by interviewing the experts (managers) and stakeholders across the entire agri-food supply chain. During the interviews experts will be asked to judge the feasibility and the measurability of suggested indicators. Experts will be given the opportunities to suggest new indicators and to reject the proposed ones and to provide suggestions for better (practically possible) ways to measure the suggested indicators. This procedure should be provided with sufficient argumentation. Based on the results of interviews the final research framework for measuring the performance of agri-food supply chain will be developed.
References
Acebrón, L.B. and Dopico, D.C. (2000), �The importance of intrinsic and extrinsic cues to expected and experienced quality: an empirical application for beef�, Food Quality and Preference, Vol. 11, pp. 229-238
Azapagic, A and Clift, R. (1999), �The application of life cycle assessment to process optimisation�, Computers and Chemical Engineering, Vol.23, pp. 1509-1526
Beamon, B.M. (1998), �Supply chain design and analysis: Models and methods�. International Journal of Production Economics, 55, pp. 281-294
Beamon, B.M. (1999), �Measuring supply chain performance�, International Journal of Operations and Production Management, Vol.19 No 3, pp. 275-292
Berry, D. and Naim, M.M. (1996), �Quantifying the relative improvements of redesign strategies in P.C. supply chain�, International Journal of Production Economics, Vol. 46-47, pp. 181-196
Bijman, J. (2002), Essays on Agricultural Co-operatives, Governance Structure in Fruit and Vegetable Chains, PhD. Thesis, Erasmus University, Rotterdam
Buurma, J.S. (2001), �Dutch agricultural development and its importance to China. Case study: The evaluation of Dutch greenhouse horticulture�, Agriculture
59

Economics Research Institute (LEI), Report 6.01.11, The Hague
Carlsson-Kanyama, A., Pipping Ekström, M. and Shanahan, H. (2003), �Food and life cycle energy inputs: consequences of diet and ways to increase efficiency�, Ecological Economics, Vol. 4, pp. 293-307
Claro, D.P., Hagelaar, G. and Omta, O. (2003), �The determinants of relational governance and performance: How to manage business relationships?� Industrial Marketing Management, Vol. 32 No 8, pp. 703-716
Coronel, P., (1998), Balanced scorecard, performance measurement http://www.benchmarkingplus.com.au
Eppen, G.D. (1979), �Effects of centralization on expected costs in a multi-location newsboy problem�. Management Science, Vol. 25 No 5, pp. 498-501
Gunasekaran, A., Patel, C. and Tirtiroglu, E. (2001), �Performance measures and metrics in a supply chain environment�, International Journal of Operations and Production Management, Vol. 21 No 1/2, pp. 71-87
Gunasekaran, A., Patel, C. and McGaughey, R. (2004), �A framework for supply chain performance measurement�, International Journal of Production Economics, Vol.87 No 3, pp. 333-347
Hagelaar, G.J.L.F. and Van der Vorst, J.G.A.J. (2002), �Environmental supply chain management: Using life cycle assessment to structure supply chains�, International Food and Agribusiness Management Review, Vol. 4, pp. 399-412
Hobbs, J.E. and Young, L.M. (2000), �Closer Vertical Co-ordination in Agri-food Supply Chains: A Conceptual Framework and Some Preliminary Evidence�, Supply Chain Management, Vol. 5 No 3, pp. 132-142
Jongen, W.M.F. (2000), �Food supply chains: From productivity toward quality�. In: R. Shewfelt and B. Brückner, (Eds.), Fruit and vegetable quality: an integrated view. Chapter 1, Cambridge: Woodhead, 2000, pp. 3-18
Kaplan, R.S. and Norton, D.P. (1992), �The balances scorecard- measures that drive performance�, Harvard Business Review, January-February, pp. 92-100
60

Korpela, J., Kyläheiko, K., Lehmusvaara, A. and Tuominen, M. (2002), �An analytical approach to production capacity allocation and supply chain design�, International Journal of Production Economics, Vol.78 No 2, pp. 187-195
Lai, K., Ngai, E.W.T. and Cheng, T.C.E. (2002), �Measures for evaluating supply chain performance in transport logistics�, Transportation Research, Part E 3, pp. 439-456
Lambert, D.R. and Cooper, M.C. (2000), �Issues in supply chain management�. Industrial Marketing Management, Vol. 29 No 1, pp. 65-83
Lapide, L. (2000), �What about measuring supply chain performance?� White paper, (Ascet, Vol. 2, April 15), Available at http://lapide.ASCET.com
Lee, H.L. and Billington, C. (1992), �Managing supply chain inventory: pitfalls and opportunities�, Sloan Management Review, Vol.33, pp. 65-73
Li, D. and O�Brien, C. (1999), �Integrated decision modelling of supply chain efficiency�, International Journal of Production Economics, Vol. 59, No 1-3, pp. 147-157
Luning, P.A., Marcelis, W.J. and Jongen, W.M.F. (2002), Food Quality Management: a techno managerial approach, Wageningen Academic Publishers
Murphy, G.B., Trailer, J.W. and Hill, R.C. (1996), �Measuring performance in entrepreneurship research�, Journal of Business Research, Vol. 36, pp. 15-23
Northen, J.R., (2000), �Quality attributes and quality cues. Effective communication in the UK meat supply chain�. British Food Journal, Vol. 102 No 3, pp. 230-245
Persson, F. and Olhager, J. (2002), �Performance simulation of supply chain design�, International Journal Production Economics, Vol. 77 No 3, pp. 231-245
Sloof, M., Tijskens, L.M.M. and Wilkinson, E.C. (1996), �Concepts for modelling the quality of perishable products�, Trends in Food Science and Technology,
61

Vol. 78, pp. 165-171
Stephens, S. (2000), �The supply chain council operations reference (SCOR) model: integrating process, performance measurements, technology and best practice�, Logistics Spectrum, Vol. 1 No July, pp. 16-18
Supply Chain Council (2004), http://www.supply-chain.org
Romero, C. and Rehman, T. (2003), Multiple Criteria Analysis for Agricultural Decisions, Oxford, Elsevier Science, Ltd
Talluri, S. and Baker, R.C. (2002), �A multi-phase mathematical programming approach for effective supply chain design�, European Journal of Operational Research, Vol. 141 No 3, pp. 544-558
Talluri, S., Baker R.C. and Sarkis, J. (1999), �A framework for designing efficient value chain networks�, International Journal of Production Economics Vol. 62 No 1-2, pp. 133-144
Thonemann, U.W. and Bradley, J.R. (2002), �The effect of product variety on supply chain performance�, European Journal of Operational Research, Vol. 143, pp. 548-569
Tijskens, L.M.M. (2004), Discovering the future: Modelling quality matter, Ph.D. thesis, Wageningen University, Wageningen
Van der Spiegel, M. (2004), Measuring effectiveness of food quality management. Ph.D. thesis, Wageningen University, Wageningen
Van der Vorst, J.G.A.J. (2000), Effective food supply chains. Generating, modelling and evaluation supply chain scenarios, PhD thesis Wageningen University, Wageningen
Van der Vorst, J.G.A.J., Van Dijk, S.J. and Beulens, A.J.M. (2001), �Supply chain design in the food industry�, The International Journal on Logistics Management, Vol. 12 No 2, pp. 73-85
Wang, N. (2003), �Measuring transaction costs: An incomplete survey�, Conference on transaction Costs, Chicago, Ronald Coas Institution
62

Zhu, J. (2003), Quantitative models for performance evaluation and benchmarking, Kluwer Academic Publishers, Dordrecht
63

64

4
CHAPTER 4 Performance Measurement in Agri-food
Supply Chains: A Case Study
Lusine H. Aramyana, Alfons G.J.M. Oude Lansinka, Jack G.A.J. van der Vorstb, Olaf van Kootenc
a Business Economics Group, Wageningen University, Hollandseweg 1, 6706 KN Wageningen, The Netherlands
b Horticultural Production Chains group, Wageningen University, Marijkeweg 22, 6709 PG Wageningen, The Netherlands
c Logistics and Operations Research Group, Wageningen University, Hollandseweg 1, 6706 KN Wageningen, The Netherlands
Published in Supply Chain Management: An international Journal, (2007), Vol. 12, No 4 (Forthcoming)
65

Abstract
Purpose - Measurement of the performance of entire supply chains is an important issue because it allows for �tracking and tracing� of efficacy and efficiency failures and leads to more informed decision-making with regards to chain design. However, the choice of appropriate supply chain performance indicators is rather complicated due to the presence of multiple inputs and multiple outputs in the system. Therefore, this paper evaluates the usefulness of a novel conceptual model for supply chain performance measurement in an agri-food supply chain.
Methodology/approach - A conceptual model for integrated supply chain performance measurement has been evaluated in a Dutch�German tomato supply chain by means of a case study approach.
Findings - The proposed conceptual framework is found to be useful for measuring performance of the tomato supply chain. From the case study it is concluded that four main categories of performance measures (efficiency, flexibility, responsiveness and food quality) are identified as key performance components of the tomato supply chain performance measurement system.
Originality/value of the paper - This research evaluates a novel concept for measuring performance of agri-food supply chains. This concept is the first step in developing an integrated performance measurement system, which contains financial as well as non-financial indicators combined with the specific characteristics of agri-food supply chains. Based on a case study in the tomato supply chain, this concept is found to have potential.
Key words: agri�food, performance measurement, supply chains, case study research
4.1 Introduction
In order to be able to assess the success of supply chains, an adequate Performance Measurement System (PMS) needs to be developed. In this study, a PMS is defined as a system that enables a firm to monitor the relevant performance indicators of products, services and production processes in the appropriate time frame (Rosenau
66

et al., 1996). Performance indicators are the criteria with which the performance of products, services and production processes can be evaluated. Besides, performance indicators are operationalized process characteristics, which compare the efficiency and/or effectiveness of a system with a norm or target value (Van der Vorst, 2000). A PMS comprises systematic methods of setting business goals together with periodic feedback reports that indicate progress against those goals (Simons, 2000). PMS informs decision makers whether they are meeting their goals, whether customers are satisfied and whether and where improvements are necessary.
In order to improve performance of the entire supply chain there is a need to look outside the boundaries of individual firms incorporating the whole chain. So, there is a need for a PMS that integrates different aspects of performance into a cohesive system, because such an integrated system enhances the information flow within the chain. According to Bititci et al. (1997), the integrated PMS is the information system which is at the heart of the performance management process and it is of critical importance to the effective and efficient functioning of the PMS. Integrated PMS provides more comprehensive measurement of entire supply chain performance, than single-measure approaches do.
The complexity that supply chain actors are often facing, are the conflicting goals of individual actors in the chain. Each individual actor has its own goals, performance indicators and optimization criteria. These do not necessarily contribute positively to the performance of the chain as a whole because their own performance improvements can be detrimental to other chain actors. The position of actors in the chain (supplier, manufacturer, wholesaler, service supplier) affects their contribution (Van Hoek, 1998). Conflicting interests of different actors in the chain complicates the availability of the information. The relevance of the information differs in each stage of the chain, even if the information is of high importance for the overall supply chain performance. Moreover, the strategic value of some of the information inhibits a free exchange between chain partners (Wijnands and Ondersteijn, 2006). However co-operation generally leads to a win-win situation. Information sharing, clear communication, recognition of mutual benefits, and high level of cooperation lead to increasing likelihood of supply chain relationship success (Bowersox and Closs, 1996). Alignment of the goals and optimization procedures of individual actors in the chain may be enhanced by providing insight into the effect of opposing goals on performance. Therefore, a
67

well defined PMS should give insight into the contribution of individual chain actors to the performance of the entire chain.
Recent studies have shown that supply chains lack accurate indicators of performance for comparison, benchmarking and decision-making. Beamon (1999) concluded that current supply chain PMS are inadequate because they rely on the use of costs as primary indicator. Gunasekaran et al. (2001) concluded that there is no balanced approach with regards to financial as well as non-financial indicators and the number of performance indicators to be used. Lee and Billington (1992) found that supply chains do not have ample performance indicators and firms aim at accomplishing their own performance standards. Authors in different disciplines generally have different views on what a supply chain PMS should look like. A main debate in literature is about the indicators to be included in PMS.
Cristopher (1998) suggested that whilst there are many indicators of performance that can be deployed in an organization, there is a relative small number of critical dimensions which contribute more than proportionally to success or failure in the market, which he named key performance indicators (KPI). According to Bunte et al. (1998) (in marketing), performance indicators should relate to both effectiveness and efficiency of the supply chain and its actors. Van der Vorst (2000) (in logistics) makes a distinction between performance indicators on three main levels: supply chain level (e.g. product availability, quality, responsiveness, delivery reliability and total supply chain costs), organization level (e.g. inventory level, throughput time, responsiveness, delivery reliability and total organizational costs) and process level (e.g. responsiveness, throughput time, process yield and process costs). Li and O�Brien (1999) (in manufacturing) proposed a model to improve supply chain efficiency and effectiveness based on four criteria: profit, lead-time performance, delivery promptness and waste elimination. In 1996 the Supply Chain Consul has been initiated, which developed the Supply Chain Operations Reference (SCOR®) Model. This model provided guidance on the types of indicators decision-makers can use to develop a balanced approach towards measuring the performance of an overall supply chain. The SCOR® Model advocates a set of supply chain performance indicators as a combination of (Supply-Chain Council, 2004):
1. reliability measures (e.g. fill rate, perfect order fulfillment)
2. cost measures (e.g. cost of goods sold)
68
3. responsiveness measures (e.g. order fulfillment lead-time)
4. asset measures (e.g. inventories)
Lai et al. (2002) distinguished three dimensions of supply chain performance in transport logistics: service effectiveness for shippers, operational efficiency and service effectiveness for consignees. Within these dimensions they identified four performance indicators: responsiveness, reliability, costs and assets. Beamon (1999) (in manufacturing) suggested a system of three dimensions: resources (i.e. efficiency of operations), output (i.e. high level of customer service) and flexibility (i.e. ability to respond to a changing environment).
This literature review shows that many efforts have been made to develop a PMS for various supply chains. Despite their importance, little attention has been given in the literature to integrated PMS. To our knowledge no integrated measurement system exists in agri-food supply chains that combines different aspects of performance (e.g. financial and non-financial, qualitative and quantitative) into one measurement system, therefore we aim to fill this gap.
Measuring the performance of agri-food supply chains is rather difficult, because they have many characteristics that set them apart from other types of supply chains. Examples are:
1. Shelf life constraints for raw materials and perishability of products
2. Long production throughput time
3. Seasonality in production
4. Physical product features like sensory properties such as taste, odor, appearance, color, size and image
5. Requires conditioned transportation and storage
6. Product safety issues
7. Natural conditions affect the quantity and the quality of farm products
69

Furthermore, recent socio-economic developments have resulted in a change in performance requirements for food supply chains as a whole and for all stages in the supply chain. Consumers put new demands on different attributes of food such as quality, integrity, safety, diversity and services (Van der Vorst, 2005). The policy changes concerning the environmental issues have a great impact on agri-food supply chains. The use of pesticides and other chemicals has a negative impact on consumers� buying behavior. As a result, consumers have high demands on a broad range of quality aspects like food safety, production characteristics, sensory properties, shelf life, reliability, convenience (Van der Spiegel, 2004). Thus, when developing a PMS for agri-food supply chains, the indicators that reflect the quality aspects of product and processes are important and together with other financial and non-financial indicators should be included in a PMS.
Recently Aramyan et al. (2006) developed a preliminary conceptual framework of a PMS for agri-food supply chains based on literature, which captures the characteristics of agri-food supply chain as well as other financial and non-financial indicators. The conceptual framework consists of four main categories: efficiency, flexibility, responsiveness and food quality, and it is described in the next section.
The goal of this study is to evaluate and further develop the conceptual framework of Aramyan et al. (2006) using data from a Dutch-German tomato supply chain. In this study we investigate two research questions:
1. Are the four categories (efficiency, flexibility, responsiveness and food quality) of performance measures suggested in the conceptual framework the key performance components for an integrated PMS in tomato supply chains?
2. Do the different indicators within these categories vary in different links of the tomato supply chain, given the different objectives of these different links in the chain?
This paper is organized as follows. The next section provides the details of the conceptual framework, followed by the method used to carry out the research and the case study description. Thereafter, the results of the case study are analyzed. The paper ends with conclusions and discusses areas for future research.
70

4.2 A Conceptual Framework
This section discuses a conceptual framework for measuring performance of agri-food supply chains.
Based on a literature review of existing performance indicators for supply chains, a conceptual framework for measuring the performance of agri-food supply chains has been developed (Aramyan et al., 2006). Agri-food supply chain performance indicators are grouped in four main categories: efficiency, flexibility, responsiveness and food quality. These four categories are the bottom line of the PMS. Each of these main categories contains more detailed performance indicators (Figure 1). The suggested performance indicators can be used at the organizational level as well as the supply chain level. This means that supply chain members, besides their own set of performance indicators have a common set of performance indicators within four main categories that help them to evaluate their own performance and the performance of the chain. These common set of indicators for complete supply chain can be identified as key performance indicators. Efficiency measures how well the resources are utilized (Lai et al., 2002). It includes several measures such as production costs, profit, return on investment and inventory. Flexibility indicates the degree to which the supply chain can respond to a changing environment and extraordinary customer service requests (Bowersox and Closs, 1996; Beamon, 1998). It may include customer satisfaction, volume flexibility, delivery flexibility, reduction in the number of backorders and lost sales. Responsiveness aims at providing the requested products with a short lead time (Persson and Olhager, 2002). It may include fill rate, product lateness, customer response time, lead time, shipping errors, and customer complaints.
The specific characteristics of agri-food supply chains are captured in the measurement framework in the category food quality. The latter is based on the framework of food quality developed by Luning et al. (2002). Food quality is divided into product and process quality. Product quality consists of:
1. product safety and health
2. sensory properties and shelf life
3. product reliability and convenience
71

Within product safety and health, health (salubrity) refers to food composition and diet. Product safety refers to the requirement that products must be �free� of hazards with an acceptable risk. Sensory perception of food is determined by the overall sensation of taste, odor, color, appearance and texture, which are determined by physical features and chemical composition. Shelf life of a product is defined as the time between harvesting or processing and packaging of the product, and the point in time at which it becomes unacceptable for consumption. Product reliability refers to the compliance of actual product composition with product description, and convenience relates to the ease of use or consumption of the product for the consumer (Luning et al., 2002).
Process quality is divided into:
1. production system characteristics
2. environmental aspects
3. marketing
Production system characteristics refer to the way a food product is manufactured and includes factors as pesticides used, animal welfare and use of genetic engineering. Environmental implications of agri-food products refer mainly to the use of packaging and food waste management. Marketing efforts determine quality attributes (e.g. promotions, service), affecting quality expectation (Luning et al., 2002).
Adding the category food quality to the three other categories completes the conceptual framework for measuring the performance of agri-food supply chain (Figure 1). Table 1 includes the definitions of all suggested performance indicators based on an extensive literature review, and the possible ways to measure them.
72

Food Quality
Customer satisfaction Volume flexibility Delivery flexibility The number of: ! Back orders ! Lost sales
Flexibility
Costs ! Production costs ! Distribution costs ! Transaction cots Profit Return on investment Inventory
Efficiency
Product Quality ! Sensory properties and
shelf-life ! Product safety & health ! Product reliability and
convenience Process quality ! Production system ! Environmental aspects ! Marketing
Fill rate Product lateness Customer response time Lead time Shipping errors Customer complaints
Responsiveness
Performance
Figure 1. Conceptual framework of agri-food supply chain performance indicators
73

Table 1. Definitions of performance indicators used in the framework
Categories Indicators
Definitions Measures
Efficiency* Production costs/Distribution costs
Combined costs of raw materials and labor in producing goods/Combined costs of distribution, including transportation and handling cost
The sum of the total costs of inputs used to produce output/services (fixed and variable costs)
Transaction costs The costs other than the money price that are incurred in trading goods or services( e.g. searching cost, negotiation costs, and enforcement costs)
The sum of searching costs (the costs of locating information about opportunities for exchange) negotiation costs (costs of negotiating the terms of the exchange) enforcement costs (costs of enforcing the contract)
Profit The positive gain from an investment or business operation after subtracting all expenses
Total revenue less expenses
Return on investments
A measure of a firm�s profitability and measures how effectively the firm uses its capital to generate profit
Ratio of net profit to total assets
Inventory A firm�s merchandise, raw materials, and finished and unfinished products which have not yet been sold.
The sum of the costs of warehousing of products, capital and storage costs associated with stock management and insurance
Flexibility* Customer satisfaction The degree to which the customers are
satisfied with the products or services The percentage of satisfied customers to unsatisfied customers
Volume flexibility The ability to change the output levels of the products produced
Calculated by demand variance and maximum and minimum profitable output volume during any period of the time
Delivery Flexibility The ability to change planned delivery dates The ratio of the difference between the latest time period during which the delivery can be made and the earliest time period during which the delivery can be made and the difference between the latest time period during which the delivery can be made and the current time period
Backorders An order that is currently not in stock, but is being re-ordered (the customer is willing to wait until re-supply arrives) and will be available at a later time
The proportion of the number of backorders to a total number of orders
Lost sales An order that is lost due to the stock out, because the customer is not willing to permit the backorder
The proportion of the number of lost sales to a total number of sales
Responsiveness* Fill rate Percentage of units ordered that are shipped
on a given order Actual fill rate is compared to the target fill rate
Product lateness The amount of time between the promised product delivery date and the actual product delivery date
Delivery date minus due date
Customer response time
The amount of time between an order has been done and its corresponding delivery
The difference between the amount of the time an order has been done and its corresponding delivery
Table continued overleaf ...
74

� Table continued below Lead time Total amount of time required to produce a
particular item or service Total amount of time required to complete one unit of product or service
Customer complaints The registered complaints from customers about product or service
The total number of complaints registered
Shipping errors Wrong products shipments The percentage of wrong shipments Product quality** Sensory properties and shelf life
Appearance First sight of the tomato, combination of different attributes (color, size and form, firmness, lack of blemishes and damages)
Number of damages, color scale, size and form scale
Taste Determined by the sweetness, mealiness and aroma of a vegetable/fruit
Brix value, which is measurement of a soluble dry substance in a liquid (providing an approximate measure of sugar content)
Shelf life The length of time a packaged food will last without deteriorating
The difference in time between harvesting or processing and packaging of the product and the point in time at which it becomes unacceptable for consumption
Product safety and health
Salubrity The quality of the products being healthful and nutritious
Nutritional value and lycopene content
Product safety Product does not exceed an acceptable level of risk associated with pathogenic organisms or chemical and physical hazards such as microbiological, chemical contaminant in products, micro-organisms
Lab checks and monitoring processes according to certification schemes
Product reliability and convenience
Product reliability Refers to the compliance of the actual product composition with the product description
Number of registered complaints
Convenience The information provided on the packaging is useful, complete and easy understandable
Number of registered complaints
Process quality** Production system characteristics
Traceability Traceability is the ability to trace the history, application or location of an product using recorded identifications
Information availability, use of barcodes, standardization of quality systems
Storage and transport conditions
Standard conditions required for transportation and storage of the products that is optimal for good quality
Measure of relative humidity and temperature, complying with standard regulations
Working conditions Standard condition that ensure a hygienic, safe working environment, with correct handlings and good conditions
Compliance with standard regulations
Environmental aspects
Energy use The amount of energy used during production process
The ratio of cubic meter gas used per squire meter glasshouse
Water use The amount of water used during production process
The ratio of a liter water used per squire meter land under the vegetables
Table continued overleaf �
75

� Table continued below Pesticide use A permitted amount of pesticides used in
production process The amount and the frequency of the pesticide use complying with standard regulations
Recycling/re-use Collected used product from crop, packaging etc. that is disassembled, separated and processed into recycled products, components and/or materials or re-used, distributed or sold as used, without additional processing
Percentage of materials recycled/re-used
Marketing Promotion Activities intended to increase market share
for product (e.g. branding, pricing and labeling.)
Increase in number of customers and sales
Customer service The provision of labor and other resources, for the purpose of increasing the value that buyers receive from their purchases and from the processes leading up to the purchase
Ratio of provision of resources used to increase customer service to increased sales
Display in stores Demonstration of the product in the store Increase in number of customers and sales * Sources: Beamon, 1998, 1999(a); Bowersox and Closs, 1996; Hobbs, 1996; Persson and Olhager, 2002; Lai et al., 2002; Womack and Jones, 2002; Gunasekaran, 2001; SCOR model, 2004; Berry, 2006 ** Sources: Luning et al., 2002; Van der Spiegel, 2004; Valeeva, 2005; Beamon, 1999(b); Berry, 2006
4.3 Methodology
In order to evaluate the conceptual framework a case study research has been designed. The case study has been carried out in a Dutch-German tomato supply chain. The sources of information are interviews with:
1. chain manager of a breeding company
2. seven owner-growers of tomato producing firms
3. wholesaler of wholesale company
4. manager of a distribution center
5. two managers of supermarkets
The type of interview is a focused interview (Yin, 2003), in which the interview consists of open-ended questions and a set of questions in the form of a
76

questionnaire. The questionnaire1 consists of three parts. The first part includes general open-ended questions to become familiar with the firm. In the second part interviewees are given definitions of possible performance indicators that can be integrated into a PMS. Interviewees were asked to judge the feasibility and the measurability of suggested indicators. Interviewees were given the opportunity to suggest new indicators and/or to reject the proposed ones and to provide suggestions for better (i.e. feasible) ways to measure the suggested indicators. Next, the interviewees were asked to rank the listed indicators of performance according to the perceived importance for their firm, using an interval ranking (Churchill, 1999). A 5-point Likert scale was used with 1 being not important at all for measuring performance and 5 being very important. The last part of the questionnaire consisted of evaluating the usefulness of the whole conceptual framework in general, where interviewees were asked to judge the categories in the framework, and to propose new and/or reject categories.
The interviews were conducted in February-March 2005, in the Netherlands and in the Rhine-Ruhr area in Germany, where Dutch tomatoes from this chain are sold. Prior to the interviews, pre-test interviews were conducted with three interviewees external to the chain in order to test the questionnaire. In the tomato chain in total 12 interviewees were interviewed. Seven growers agreed to participate in the interview. One breeder and one wholesaler took part in the interview, because there is only one of each in the chain. Finally, one manager of one distribution center and two managers of two supermarkets were interviewed.
4.4 Case Study Description and Research Design
The supply chain in this case is a tomato chain and consists of two parts: a Dutch and a German part. The Dutch part consists of one breeder and 12 growers. The German part consists of one wholesaler and multiple distribution centers and retailers in Germany.
This particular supply chain has been chosen as a case study, because it is a
1 The questionnaire can be obtained upon request from the corresponding author
77

complete chain starting from breeder till the end consumer. Besides, this chain experiences problems with the information flow throughout the entire chain. Breeder and growers do not receive feedback about their products from the supermarkets. Information sources are not always clear for all members of the chain. For instance, growers implemented EUREP-GAP (the global certification of Good Agricultural Practices (GAP) developed by Euro-Retailer Produce Working Group (EUREP) based on supposed requirements of German supermarkets, while German supermarkets were not aware of those requirements. This lack of information complicates the improvement of the performance of the overall supply chain.
The chain consists of relatively small-scale growers with an average of about 2 ha tomato cultivation. Currently, the number of large growers producing a high volume of vegetables is small, while the number of small growers is relatively large. In the Netherlands, the total number of firms producing tomatoes is 543, from which 422 (77.5 %) firms have less than 3 ha of tomato cultivation (Land en tuinbouwcijfers, 2004).
Breeder
In this tomato chain there is one breeder, situated in the Netherlands. The company is specialized in breeding of many different vegetable seeds. The company developed an Integral Chain Care system, which is a certification system based on quality standards aiming to guarantee product quality (e.g. quality of seeds, healthiness, food safety, etc.).
Growers
In this chain there are 12 tomato growers of which 7 were interviewed. Most of them are situated in the south of the Netherlands. Together they add up to an area of 24.35 hectares of tomatoes. Quality standards used by the growers are Integral Chain Care and Integrierte Anbau (German control system of integrated cultivation). Starting from January 2005 EUREP-GAP has been implemented.
Wholesaler
The wholesaler involved in this supply chain is located in Germany. The company
78

delivers half of the production to supermarkets in Germany. The share of tomatoes in total sales is 25%. The company is working on certification according to the International Food Standard (IFS).
Retail Distribution Centers
There are three distribution centers one of which agreed to participate. The three distribution centers are part of an organization with a turnover of 32.16 billion Euros in 2003. The company is one the of the largest European food trading companies. The share of fruits and vegetables in total sales is 12%, from which the share of tomatoes is 6-7%. The quality standards used by the firm are Integrierte Anbau and HACCP.
Retail Outlets
The last link in the chain before the end-consumer is formed by the retailers, which are part of the same group as the distribution centers. It is a group of 15 cooperatives composed of many largely independent retailers supplied by its own regional food wholesalers.
The schematic representation of the tomato supply chain is given in Figure 2.
Figure 2. Schematic representation of the tomato supply chain
Breeder
Growers
Wholesaler
Distribution
Centers
Supermarkets
GermanyThe Netherlands
4.5 Findings of the Case Study
Table 2 presents perceived importance scores of the performance indicators for all members of the tomato supply chain. All interviewees agreed with the suggested categories in the framework and indicated that they cover all relevant aspects.
79

Some of the interviewees suggested including other indicators in the framework.
Table 2. Perceived importance scores of indicators for all members of tomato chain
Categories Indicators
Breeder Growers Wholes1 DC2 Supm3 Mean SD
Efficiency Production costs 4 4.86 4 5 4.5 4.47A 0.47 Transaction costs 3 3.86 3 3 3.5 3.27B,W 0.39 Profit 4 5.00 5 5 4.5 4.70A 0.45 Return on investments 4 4.71 4 4 3.5 4.04A 0.43 Inventory 4 3.14 3 3 3.5 3.33B,W 0.43 Flexibility Customer satisfaction 5 4.86 5 5 5 4.97B,W,S 0.06 Volume flexibility 4 3.71 4 4 4.5 4.04B,S 0.28 Delivery Flexibility 4 4.29 5 4 2.5 3.96N 0.91 Backorders 3 2.43 3 1 1.5 2.19N 0.90 Lost sales 4 3.14 3 1 1 2.43N 1.36 Responsiveness Fill rate 4 3.57 5 5 3 4.11W 0.88 Product lateness 5 3.57 5 5 4.5 4.61W 0.62 Customer response time 4 3.86 5 5 4.5 4.47B,W,D 0.54 Lead time 4 4.00 4 5 4.5 4.30A 0.45 Customer complaints 4 4.43 3 4 5 4.09A 0.73 Shipping errors 3 3.86 4 4 4 3.77N 0.44 Product quality Appearance 5 4.71 5 5 5 4.94A 0.13 Taste 5 4.71 5 3 4 4.34B,G 0.85 Shelf life 5 4.71 5 5 4 4.74B,G,W 0.43 Salubrity 4 4.00 5 3 4 4.00B 0.71 Product safety 5 4.43 5 5 4 4.69B,G,W 0.46 Product reliability 5 4.71 5 5 5 4.94N 0.13 Convenience 4 4.14 4 3 4 3.83N 0.47 Process quality Traceability 5 4.57 5 5 3.5 4.61B,G,W 0.65 Storage and transport conditions
5 4.29 5 5 3.5 4.56W,D 0.67
Working conditions 4 4.14 4 5 3.5 4.13A 0.54 Energy use 5 4.71 4 2 5 4.14A 1.27 Water use* 4 4.00 2 2 - 3.00B,G,W 1.15 Re-use 4 3.57 3 4 4.5 3.81A 0.56 Pesticide use* 4 4.14 - - - 4.09B,G 0.10 Emissions 3 2.57 3 2 1.5 2.41N 0.66 Promotions 4 4.00 5 4 5 4.40S 0.55 Client service 5 4.14 3 5 5 4.43S 0.88 Display in supermarkets 3 3.71 5 5 5 4.34S 0.93 1=Wholesalers; 2=Distribution Centers; 3=Supermarkets *Indicators Water and Pesticide use were left out from the questionnaire as not applicable for some members of the chain based on results of pre-tests A=given indicator is measured by all chain members; N=given indicator is not measured at all; B, G, W, D, S= given indicator is measured by breeder, grower, wholesaler, distribution center and supermarket respectively
80

Efficiency - Within the category efficiency interviewees suggested to include the efficiency of the salesman (for wholesale, distribution center and supermarkets) measured as the number of pallets sold per year and efficiency per ha of the production (for breeder and growers). Suggested indicators from the framework for efficiency were production/distribution and transaction costs, profit, return on investments and inventory. All suggested indicators of efficiency are currently measured only in the breeding and wholesale companies. From the five suggested indicators of efficiency only three (production costs, profit and return on investments) are measured by the growers. Inventory costs and transaction costs are not measured. Not all suggested indicators of efficiency are measured in the distribution center, e.g. transaction costs are not calculated. From the five indicators of efficiency, three are measured by the supermarkets.
In the category efficiency, all chain members but one, found two indicators of medium importance: transaction costs and inventory; the exception being the breeder, who found inventory costs important (See Table 2). A possible explanation can be that this chain is structured such that transaction costs (e.g. searching costs and transportation costs) are kept to a minimum. Since growers are not allowed to sell their products to wholesalers outside the chain, they do not seek other channels such as auctions or direct marketing. Growers benefit from the arrangement with the wholesaler since they have no transportation costs and save time for marketing their products. On the other hand the wholesaler is assured of a constant supply of products. Unlike the other chain members, the breeder emphasized the importance of inventory costs. Inventory costs are important for the breeder given the large amount of expensive seeds that are kept in storage for a long time-period, which increases the costs of warehousing. The wholesaler and the distribution center sell their whole stock within one day and therefore inventory costs are not of interest to them. There is a high level of agreement between chain members on production cost and profit indicators in the efficiency category, which shows that the costs remain one of the major concerns for measuring supply chain performance.
Flexibility - Suggested indicators for flexibility were customer satisfaction, volume flexibility, delivery flexibility, the number of backorders and lost sales. Customer satisfaction is the most important indicator of performance for all chain members. However, it is either not measured at all, or it is measured indirectly. The breeding company registers complaints from customers which are used as an indicator of the
81
customer satisfaction. Occasionally, the breeder surveys customers to ask directly for satisfaction of growers (e.g. opinion about the breeder, its image and reliability). In the supermarkets customer satisfaction is measured by the turnover and the number of customers. Sometimes, supermarkets send out questionnaires to their customers asking how satisfied they are with the supermarkets. The results are used to improve customer satisfaction. Although customer satisfaction was ranked the highest by the growers and the distribution center, it is not measured in these firms at all, which is remarkable.
Although delivery flexibility is important for all members in the supply chain (except for supermarkets), companies do not measure it. Most companies have a list of priority customers, which receive preferential treatment in case they ask for a rush order. Volume flexibility is calculated in the breeding company, on the basis of expected sales. Volume flexibility is not calculated by growers. Their major intention is to produce as much as possible, even if the demand for the product is low and they make losses. One explanation for this is that they are restricted by the size of their glasshouses. However, interviewees agreed that it would be very useful for them to be able to measure this indicator in order to predict over production and prevent fundamental losses. There is an interesting approach to volume flexibility in the wholesale company: if there is a high level of decayed production then fewer products are ordered. The interviewee stressed the importance of measuring volume flexibility because German regulations do not allow holding large stocks. In the supermarkets volume flexibility is approximated using data on daily demand for the products. One of the interviewees noticed that approximation of this indictor is based on experience. Two indicators of flexibility (backorders and lost sales) are perceived to be unimportant by all chain members. The argument of the majority was that these events do not happen and do not have to be measured.
Responsiveness - Suggested indicators for the category responsiveness are fill rate, product lateness, customer response time, lead time, customer complaints and shipping errors. Three indicators are used in the breeding company: lead time (with the help of planning), customer response time (by sending out a questionnaire to customers) and customer complaints (all complaints are registered). Fill rate and shipping errors are not measured, because the company does not do transportation. Growers use only two indicators: lead time (production time and required harvesting and packaging time) and customer complaints (all complaints are
82

registered). In general, growers think that this part is more applicable to the wholesaler, because the wholesaler collects products. In the wholesale company and in the distribution center, only product lateness is not measured, though it is perceived to be very important. The interviewees argued that the product has to be in time: mistakes are not allowed and usually do not happen. From all suggested indicators of responsiveness, customer complaints and lead time are measured by the supermarkets, while others are not. The reason why the others are not measured was explained by an interviewee: they usually do not occur. Shipping error is not measured. Interviewees explain that shipping errors can happen weekly; however, it is not measured or documented because they are aware of wrong shipments. Surprisingly, nothing is done to minimize shipping errors, although they occur often.
Food quality - Suggested indicators for product quality were: appearance, taste, shelf life, salubrity, product safety, product reliability, convenience in information on packaging. These indicators fall in three subcategories (see section �Conceptual Framework�).
All indicators of product quality are measured by the breeding company inside the firm. Besides, additional product quality measurements take place in the firms of growers and in retail shops. In the wholesale company all indicators are measured (except for salubrity) inside the company by quality inspectors of the company and by the KCB (Dutch Quality Control Bureau). In the distribution center and in the supermarkets most of the indicators are measured on the basis of subjective perceptions, without performing formal tests, e.g. for appearance of the tomato color is checked by looking how red the tomatoes are. Product safety and salubrity are not measured in the distribution center and in the supermarkets, though these indicators are important, and should be checked according to standard regulations (especially product safety). Interviewees from the supermarkets believe that it is checked in the distribution center. However, the interviewee from the distribution center believes that measurement is done by the wholesaler. Obviously the different actors in the supply chain do not have adequate information about what the previous actor does to the products, which can have grave consequences for product safety.
Shelf life is not measured in the supermarket, because products are supposed to be fresh. When a product is too old, it is sold for a lower price. Here arises a conflict between growers and supermarkets, because some growers prefer to incur costs of
83

disposal than to have poor quality tomatoes sold for a lower price.
These results show that there is joint agreement between supply chain members on the category product quality, where all indicators (except for salubrity, taste and convenience) scored high on importance in all links of the supply chain, indicating that the chain as a whole claims to take product quality very seriously. The high level of agreement in the product quality category may be explained by the fact that the breeding company developed the integral chain care system to guarantee product quality down the supply chain.
Suggested indicators for process quality are traceability, storage and transportation conditions, working conditions, energy use, water use, reuse, pesticide use, emissions, promotions in supermarkets, client service and displays in supermarkets. These indicators fall into three subcategories (see section �Conceptual Framework�). The findings from the interviews about process quality indicators are not uniform. Suggested indicators obtained scores ranging from not important at all to very important. However, indicators reflecting environmental aspects are generally perceived to be of low importance.
Water use received different scores in different links, because of differences in use of this indicator. Interesting results are obtained concerning traceability in the supermarkets, which appeared to be of medium importance but it is not measured. It is difficult to maintain traceability. When products reach the supermarket they often end up in one large bin, and the growers can no longer be identified, while until that stage the product is 100% traceable.
The suggested indicators are all measured in each link of the chain, except for the last three indictors of marketing (they are not measured in the first three links of the chain) and the indicator emissions. The interviewees argued that indicators of marketing are difficult to measure. In supermarkets, the indicators of marketing are measured by comparing total returns to marketing efforts. Emissions are perceived to be not very important or even not important at all across the entire supply chain. Most of the links of the chain do not have direct restrictions from the government for emissions and therefore they do not measure emissions. In general, all indicators of process quality (except for indicators of marketing) are already measured and controlled as basic requirements of the quality certification systems that companies use. Therefore, interviewees suggested that these indicators should not be included as separate items in the PMS framework.
84
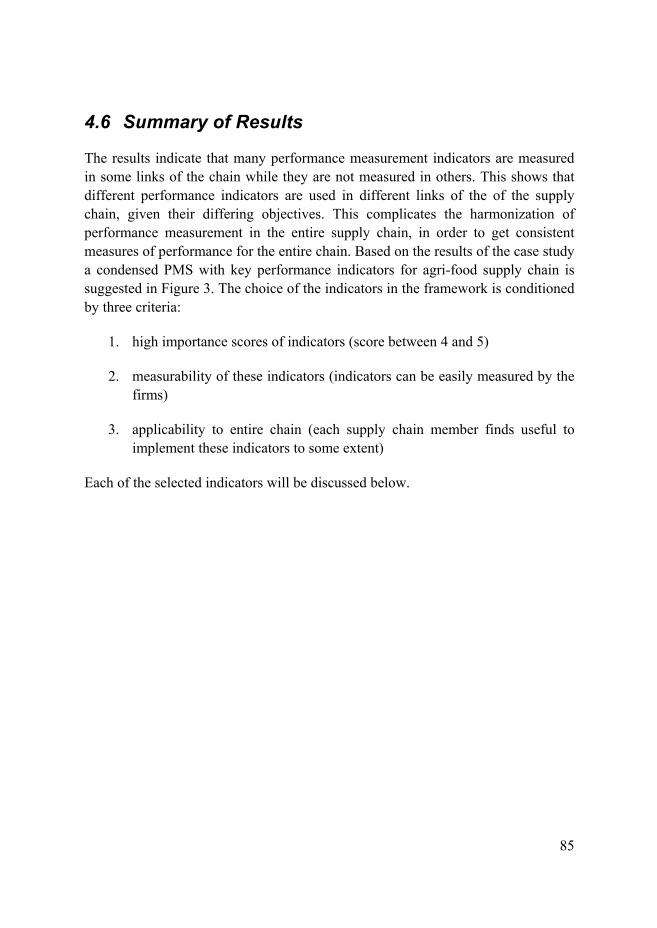
4.6 Summary of Results
The results indicate that many performance measurement indicators are measured in some links of the chain while they are not measured in others. This shows that different performance indicators are used in different links of the of the supply chain, given their differing objectives. This complicates the harmonization of performance measurement in the entire supply chain, in order to get consistent measures of performance for the entire chain. Based on the results of the case study a condensed PMS with key performance indicators for agri-food supply chain is suggested in Figure 3. The choice of the indicators in the framework is conditioned by three criteria:
1. high importance scores of indicators (score between 4 and 5)
2. measurability of these indicators (indicators can be easily measured by the firms)
3. applicability to entire chain (each supply chain member finds useful to implement these indicators to some extent)
Each of the selected indicators will be discussed below.
85

Food Quality Appearance Product safety
Lead time Customer complaints
Responsiveness
Mix flexibility Volume flexibility
Flexibility Costs Profit Return on investment
Efficiency
Performance
Figure 3. Resulting conceptual framework of agri-food supply chain performance with key performance indicators
Efficiency - Three indicators suggested in this category received a high importance score (costs 4.47, profit 4.7, return on investments 4.04), are easily measured and used by all chain members. Therefore, they have been included in the framework.
Flexibility - Customer satisfaction received a high importance score (4.97) and is perceived to be a useful indicator for measuring performance of the entire supply chain. In this research, customer satisfaction was defined as the degree to which the customers are satisfied with the products or services. However, this indicator is difficult to measure and turned out to be too broad and ambiguous to meaningfully compare different chain members. Therefore, it has been replaced with another indicator. This replacement has been carried out based on the model developed by Kano et al. (1984), which states that in order to increase customer satisfaction the customer must be delighted. Given that the product of our study is tomato, there is
86

a little variance between competing products, because it is a natural product (i.e. good, fresh product is implied by customer, not expressed). In order to increase customer satisfaction, the customer needs to be delighted, therefore there is a need for customer tailored, attractive requirements for the product. The major attractive requirement that came out of the case study is having a large variety of the product (e.g. cherry tomato, cocktail tomato), which is captured by the indicator mix flexibility. Mix flexibility is the ability to change the variety of the products produced, which enables the firm to enhance customer satisfaction by providing the kinds of product that customers request, in a timely manner. This indicator can be easily measured by the number of different products that can be produced within a given time period and therefore, has been included in the framework.
Volume flexibility received a high score of importance (4.04), it is measurable indicator and although it is currently only measured by the breeder and by supermarkets; other supply chain members have indicated the usefulness of this indicator. Therefore, it is also included in the framework.
Responsiveness - Two indicators suggested in this category received a high importance score (lead time 4.3 and customer complaints 4.09) are easily measurable and used by all chain members, therefore, can be included in the framework.
Food Quality - Two indicators of product quality have been included in the framework. These two indicators are considered to be of a high importance (appearance 4.94 and product safety 4.69). These indicators are measurable and applicable for all chain members. Although some indicators of process quality received high scores of importance (e.g. traceability, storage and transportation conditions, pesticide use, working conditions), they are not included as separate indicators into the condensed framework, because, as the respondents suggested, these indicators are already included as basic requirements in the quality certifications systems used by firms.
4.7 Discussion and Conclusions
This research evaluated a conceptual framework for measuring performance of agri-food supply chains. The framework is the first step to develop an integrated
87

performance measurement system, which contains financial as well as non-financial indicators combined with the specific characteristics of agri-food supply chains. The framework was evaluated in a Dutch-German tomato supply chain which is a complete chain starting from the breeder till the retailer.
In this study we hypothesized that efficiency, flexibility, responsiveness and food quality are the key performance components that form base for an agri-food supply chain performance measurement system. All interviewees agreed about the necessity of these four categories within one integrated performance measurement framework and evaluated the framework as complete for measuring performance of an agri-food supply chain. This provides an answer to the first research question. Some of the suggested indicators such as transaction costs, backorders or emissions are perceived to be unimportant for measuring the performance of the chain. However, these indicators can be used in measuring performance at the organizational level, if chain members perceive them important. The results show that many performance measurement indicators are measured in some links of the chain while they are not measured in others, given the different objectives in the chain. This provides answer to the second research question.
The most relevant indicators for measuring the performance of the entire supply chain appeared to be costs, profit, customer satisfaction, lead time and the majority of the product quality indicators. Some of the indicators, though perceived to be important, are not measured by supply chain members, e.g. delivery flexibility, and marketing indicators. The major argument for not measuring these indicators lies in difficulties to quantify these measures.
Based on these results a condensed PMS framework for agri-food supply chains has been suggested, where supply chain members, besides their own set of performance indicators are suggested to have a common set of performance indicators within four main categories, which will help them to compare the performance within chain members and end performance of the chain. Similar multi-level PMS has been suggested by Van der Vorst in 2000 (See Section �Introduction�).
The framework can be adjusted to each member of the chain, based on the importance of the given indicators for each chain member. By using the four main categories (efficiency, flexibility, responsiveness and food quality) with the common set of key performance indicators for the entire supply chain integrated
88

into one measurement system, chain members have the choice to include or exclude additional indicators in the system based on their own perceptions about the importance of these indicators. So, the measurement system can be designed for each link of the supply chain, where the main four categories with common set of key performance indicators must be the same for each link, while each chain member may have additional own performance indicators within categories given different objectives of the firms. The performance measurement framework suggested in this study allows supply chain members to develop a clear view on performance of the entire supply chain, as well as on the different aspects of the performance of their own organization, which allows them to make tradeoffs between different aspects of performance (e.g. increased costs, but higher quality products). The system allows for making a comparison between the categories to evaluate the performance of the firms and the chain (e.g. If efficiency increases what happens to flexibility? What impact has improved food quality on responsiveness and efficiency?). This system also allows observing the impact of e.g. policy implications/regulations or innovations on the whole performance of the supply chain.
Given the fact that the framework was evaluated in one particular case study, i.e. the tomato supply chain, caution is needed when generalizing the results. This chain consists of relatively small growers and large breeding and wholesale companies. Moreover, this chain is rather long. In other chains some adjustments may need to be carried out in the suggested framework with respect to the total selection of (key) performance indicators.
In order to apply this framework, more empirical research needs to be carried out. A difficulty with determining the performance of the entire supply chain is the combination of different indicators into a performance function that measures overall performance. Given the fact that multiple indicators in the framework have different dimensions, one of the suitable methods of analysis could be Multi Criteria Decision Making (MCDM) approach. This approach allows for making explicit trade-offs between multiple indicators by installing weighing factors for each indicator in an aggregating function. Other approach could be the use of conjoint analysis. A suggestion for future research is to build a performance measurement system, based on the framework developed in this research and taking into account tradeoffs between multiple indicators by means of MCDM. Another suggestion for future research could be using this framework and conjoint
89

analysis to test the impact of different management systems (e.g. quality assurance systems) on the performance of the whole agri-food supply chains.
References
Aramyan, L., Ondersteijn, C., Van Kooten O. and Oude Lansink, A. (2006), �Performance Indicators in agri-food production chains,� in Ondersteijn, C.J., Wijnands, J.H., Huirne R.B. and Van Kooten O. (Eds.), Quantifying the Agri-food Supply Chain, pp. 47-64, Springer, Dordrecht
Beamon, B.M. (1998), �Supply chain design and analysis: Models and methods�, International Journal of Production Economics, Vol. 55 No 3, pp. 281-294
Beamon, B.M. (1999a), �Measuring supply chain performance�, International Journal of Operations and Production Management, Vol. 19 No 3, pp. 275-292
Beamon, B.M. (1999b), �Designing the green supply chain�, Logistics Information Management, Vol. 12 No 4, pp. 332-342
Berry, L. (2006), On Great Service: A Framework for Action, Free Press, New York
Bititci, U.S., Carrie, A.S. and McDevitt, L. (1997), �Integrated performance measurement systems: a development guide�, International Journal of Operations and Production Management, Vol. 17 No 5, pp. 522-534
Bowersox, D.J. and Closs, D.J. (1996), Logistical management: The integrated supply chain process, McGraw-Hill, New York, USA
Bunte, F., Mulder, M., Van Tongeren, F. and De Vlieger, K. (1998), �Meting van de �performance� van agrarische productiekolommen�, LEI-onderzoeksverslag 163, The Hague (research report by the Dutch Agricultural Economics Institute)
Churchill, G.A. (1999), Marketing research: Methodological foundations, The Dryden Press, Orlando
90

Christopher, M.G. (1998), Logistics and supply chain management; strategies for reducing costs and improving services, Pitman Publishing, London, UK
Gunasekaran, A., Patel, C. and Tirtiroglu, E. (2001), �Performance measures and metrics in a supply chain environment�, International Journal of Operations and Production Management, Vol. 21 No 1/2, pp. 71-87
Hobbs, J.E. (1996), �A transaction cost approach to supply chain management�, Supply Chain Management, Vol. 1, No 2, pp. 15-27
Kano, N, Seraku, N., Takahashi F. and Tsuji, S. (1984), �Attractive quality and must-be quality�, The Journal of the Japanese Society for Quality Control, Vol. 14 (April), pp. 39-48
Lai, K.H., Ngai, E.W.T. and Cheng, T.C.E. (2002), �Measures for evaluating supply chain performance in transport logistics�, Transportation Research, Part E Logistics and Transportation Review, Vol. 38 No 6, pp. 439-456
Land- en tuinbouwcijfers (2004), Centraal Bureau voor de Staitistiek (CBS), LEI, Wageningen University and Research Center
Lee, H.L. and Billington, C. (1992), �Managing supply chain inventory: pitfalls and opportunities�, Sloan Management Review, Vol. 33, pp. 65-73
Li, D. and O�Brien, C. (1999), �Integrated decision modelling of supply chain efficiency�, International Journal of Production Economics, Vol. 59 No 1/3, pp. 147-157
Luning, P.A., Marcelis, W.J. and Jongen, W.M.F. (2002), Food quality management: A techno managerial approach, Wageningen Academic Publishers, Wageningen
Persson, F. and Olhager, J. (2002), �Performance simulation of supply chain designs�, International Journal of Production Economics, Vol 77 No 3, pp. 231-245
Rosenau, M.D, Griffin, A., Castellion, G.A. and Anschuetz, N.F. (1996), The PDMA Handbook of New Product Development, John Wiley and Sons, New York
91

Simons, R. (2000), Performance measurement and control systems for implementing strategy, Prentice Hall, New Jersey
Supply Chain Council, (2004). http://www.supply-chain.org
Valeeva, N.I. (2005), Cost-effectiveness of improving food safety in the dairy production chain, PhD thesis, Wageningen University, Wageningen
Van Hoek, R.I., (1998), �Measuring the unmeasurable �measuring and improving performance in the supply chain�, Supply Chain Management, Vol3 No 4, pp. 187�192
Van der Spiegel, M. (2004), Measuring effectiveness of food quality management, PhD thesis, Wageningen University, Wageningen
Van der Vorst, J.G.A.J. (2000), Effective Food Supply Chains. Generating, modelling and evaluating supply chain scenarios, PhD thesis Wageningen University, Wageningen
Van der Vorst, J.G.A.J. (2005), �Performance Measurement in Agri-Food Supply chain Networks. An overview�, in Ondersteijn, C.J., Wijnands, J.H., Huirne R.B. and Van Kooten O. (Eds.), Quantifying the Agri-food Supply Chain, pp. 13-24. Springer, Dordrecht
Wijnands, J.H. and Ondersteijn, C. (2006), Quantifying the Agri-food Supply Chain, Springer, Dordrecht
Womack, J. and Jones, D. (2002), Seeing the whole: Mapping the extended value stream, Lean Enterprise Institute, Cambridge, USA
Yin, R.K. (2003), Case study research, design and methods, Third edition, Sage, London
92

5
CHAPTER 5 The Perceived Impact of Quality Assurance
Systems on Tomato Supply Chain Performance
Lusine H. Aramyana, Miranda P.M. Meuwissena, Alfons G.J.M. Oude Lansinka, Jack G.A.J. van der Vorstb, Olaf van Kootenc, Ivo A. van der Lansd
a Business Economics Group, Wageningen University, Hollandseweg 1, 6706 KN Wageningen, The Netherlands
b Logistics and Operations Research Group, Wageningen University, Hollandseweg 1, 6706 KN Wageningen, The Netherlands
c Horticultural Production Chains, Plant Sciences Group, Wageningen University, Marijkeweg 22, 6709 PG Wageningen, The Netherlands
d Marketing and Consumer Behavior Group, Wageningen University, Hollandseweg 1, 6706 KN Wageningen, The Netherlands
Submitted for publication
93

Abstract
Agri-food supply chains are currently being confronted with many requirements regarding the quality of their products. In recent years, concerns about food quality have risen among consumers as a result of several outbreaks of diseases and various environmental concerns. This has stimulated governments to introduce stricter regulations concerning food quality and safety issues. Besides governmental regulations, retailers also impose food quality requirements and standards on their supply chains. The goal of this paper is therefore to develop a method for analyzing the impact of different QAS requirements on the performance of the different stages of the supply chain and of the chain as a whole. Performance in this study includes components of efficiency, flexibility, and responsiveness as well as food quality. This study uses perceptions of the Dutch tomato supply chain members in an effort to understand the perceived impact of different QAS requirements on the performance of the tomato supply chain. These perceptions are obtained using an adapted self-explicated method. Results indicate that some QAS requirements are perceived to have a positive impact on some supply chain members� performance, while they are perceived to have a negative impact on other supply chain members� performance. Overall, results reveal that all selected QAS requirements are perceived to have a positive impact on the performance of the supply chain, as a whole, although the total impact is relatively small. The performance measurement model developed in this study allows supply chain members to develop a clear view of the impact of QAS requirements. Also, the model makes it possible to make tradeoffs between issues such as production costs and food safety, within the own firm as well as throughout the chain.
Key words: performance measurement, self-explicated method, supply chain, QAS
5.1 Introduction
Food safety and the environment are important concerns in agri-food production (Van der Vorst 2000). To assure the quality of products, various types of certification systems have been introduced in agri-food supply chains, such as HACCP, ISO, EUREP GAP, BRC, and IFS (for a discussion of these, see section 5.2). Besides, due to globalization, firms in agri-food supply chains find themselves in a fast-changing environment and faced with high competition. In
94

order to be competitive in the world market, agri-food supply chain firms need to comply with additional demands on food quality requirements imposed by international retailers. Literature shows that the adoption of new certification systems generates advantages and disadvantages in terms of performance (Singels et al., 2001; Llopis and Tari, 2003; Meuwissen et al., 2003) (See Table 1). Meuwissen et al. (2003) gave an overview of costs and benefits associated with certification systems for meat producers. However, they did not quantify any of these indicators.
Singels et al. (2001) performed a questionnaire survey among 300 Dutch organizations (some were ISO certified while others did not have any certification). Performance was measured by 5 performance indicators:
1. production process
2. company results
3. customer satisfaction
4. personnel motivation
5. investments in means
They found no significant difference in performance improvement between organizations with certified quality systems and those without. Carlsson and Carlsson (1996) carried out telephone interviews and a questionnaire survey among 214 ISO certified companies in Sweden. They used several performance indicators such as customer relations, better internal routines and procedures, lead times, product quality, sales, and competitive ability. They found that ISO certification leads to improvements of the performance of only a few business aspects, i.e. improvements of internal routines and procedures. Jeng (1998) carried out a questionnaire survey among 838 ISO 9000 certified companies in Taiwan and distinguished six major performance dimensions (leadership, information and analysis, strategic quality planning, human resource development and management, management of process quality, and customer focus and satisfaction) within a total of 40 key elements related to performance. He found that companies that had been ISO 9000 certified over three years have a higher performance than those that had participated for just one year. Corbett et al. (2005) tested weather the impact of ISO
95

9000 leads to productivity improvements (i.e. lower ratio of cost of goods to the sales), market benefits (i.e. higher relative sales growth and increased asset turnover) and improved financial performance (i.e. increase in return on asset and return to sales). The financial data from 1987 to 1997 of ISO 9000 certified manufacturing firms in United States were used. The results revealed certified firms after three years displayed significant improved financial performance. Moll and Igual (2005) analyzed the average production costs of citrus cultivated under EUREPGAP certification in Spain and citrus cultivated in the conventional way. They compared fixed costs (e.g. equipment, depreciation, maintenance, taxes and insurance) and variable costs (e.g. costs for irrigation water, fertilizer, pesticides, labor costs and other inputs) of certified and conventional firms. The results revealed that the variable costs are lower for certified firms than for conventional firms due to lower variable costs as a result of restrictions on the use of fertilizers, pesticides and herbicides following on from EUREPGAP regulations. Summarizing then, the results from different studies are contradictory: some research found a positive relationship between certification and performance of the firm, while other research found no effect, or even a negative effect, on performance. It is noteworthy that different studies used similar and distinctive performance indicators. Furthermore, there is no common agreement on the performance indicators to be used.
Whereas research on QAS at the firm level has generated contradictory findings, research at the chain level is, to our knowledge, non-existent. Therefore, the objective of this study is to develop a method for analyzing the impact of different QAS requirements on the performance of the different stages of the supply chain and the chain as a whole. In order to study how QAS requirements affect the performance of the chain, an adequate chain performance measurement system is required. Recently, Aramyan et al. (2006 a) developed a conceptual model for a performance measurement system for agri-food supply chains. In order to achieve the objective of this paper, the performance measurement model developed by Aramyan et al. is applied to a Dutch fresh tomato supply chain. The tomato chain consists of four stages: breeder, tomato growers, wholesalers and retailers. This study measures perceptions of supply chain members on the impact of different QAS requirements on the performance of the tomato supply chain. These perceptions are obtained using an adapted self-explicated method. In order to analyze the impact of QAS requirements on the performance of the whole chain, the perceptions of the supply chain members are aggregated to the chain level,
96

using importance weights obtained from the chain members.
The remainder of this paper is organized as follows. The next section reviews QAS used in agri-food supply chains. This is followed by an explanation of the performance measurement system model, a description of the self-explicated method and survey design, and the data collection. The results are then presented, followed by conclusions and discussion.
Table 1. Advantages and disadvantages of adoption of QAS for firms
Advantages Disadvantages • Competitive advantage • Costs for achieving certification • Increase in sales and market share • Costs for capital purchases • Increased customer satisfaction • Costs for maintenance and audits • Better management control • Training costs • Clearly-defined organizational tasks, structure,
and responsibilities • Reduced flexibility
• More effective recalls • Increase in administration workload • Price premium • Extra storage, production materials, personnel,
and documentation Sources: Jensen et al., 1998; Singels et al., 2001; Llopis and Tari, 2003; Meuwissen et al. 2003
5.2 QAS used in Agri-food Supply Chains
In this study four Quality Assurance Systems used in agri-food supply chains are discussed. These are EUREPGAP, ISO 22000, BRC, and IFS. The choice of these four QASs is governed by the fact that they have a set of comparable and distinctive requirements, and they are most commonly used in agri-food supply chains.
EUREPGAP was initiated in 1997 by retailers cooperating in the Euro-Retailer Produce Working Group (EUREP). The mission of EUREPGAP is to develop widely-accepted standards and procedures for the global certification of Good Agricultural Practices (GAP) (GAP is a collection of principles to apply for on-farm production and post-production processes, resulting in safe and healthy food and non-food agricultural products, while taking into account economical, social and environmental sustainability; see EUREP, 2004). The aim is to cultivate
97

marketable products using integrated production methods in order to obtain healthy food, while respecting the environment (Moll and Igual 2005).
ISO standards aim to build confidence between suppliers and customers in business-to-business transactions and in international trade. The ISO 9000 series demands that organizations follow specific well-documented procedures in the production and delivery of their products or services. These procedures aim to guarantee that the products or services of an organization are in accordance with customer specifications (Van der Wiele et al., 2005). ISO 22000 is a recent international standard designed to ensure safe food supply chains worldwide (ISO 22000, 2005).
BRC (British Retail Consortium) was initiated in 1998 and aims to assure product quality and safety. It has been developed for companies supplying retail branded food products. BRC provides a checklist that combines HACCP (i.e. a systematic approach used in food production to assure food safety by identifying and controlling the critical production steps) with specific Good Manufacturing Practices (GMP) (GMP is a term for the control and management of manufacturing and quality control testing of products) and parts of ISO (Van der Spiegel et al., 2005). It encompasses technological and managerial aspects.
In order to create a common food safety standard, German food retailers developed a common audit standard in 2002 called International Food Standard or IFS. In 2003, French food retailers (and wholesalers) joined the IFS Working Group. The goal of the standard and its protocol is to cut costs and bring transparency to the whole chain (IFS, 2003). IFS aims to create a consistent evaluation system for all companies supplying retailer branded food products with uniform formulations, uniform audit procedures and mutual acceptance of audits, designed to create a high level of transparency throughout the supply chain.
5.3 Performance Measurement System Model
Measuring supply chain performance has recently become a topic of interest for many authors (Beamon 1998, 1999; Gunasekaran et al., 2001; Li and O�Brien, 1999; Lohman et al., 2004; Van der Vorst, 2000; Persson and Olhager, 2002). Measuring the performance of agri-food supply chains is complicated, since these
98

chains have many characteristics that distinguish them from other types of supply chains (e.g. perishability of the products, seasonality, shelf-life constraints, and food safety issues). Therefore, performance measurement systems, developed for other supply chains, and which do not include these characteristics, are not fully applicable for measuring the performance of agri-food supply chains. Aramyan et al. (2006a) developed a conceptual model for measuring the performance of agri-food supply chains that captures the special characteristics of agri-food supply chains. In their model, they distinguish four main categories of performance indicators. Per category, they suggest a number of measurable performance indicators (See Figure 1).
Food Quality Appearance Product safety
Lead time Responsiveness
Mix flexibility Volume flexibility
Flexibility Costs Efficiency
Performance
Figure 1. Conceptual model of agri-food supply chain performance with categories and indicators (source: Aramyan et al., 2006b)
99

The model has been tested by Aramyan et al. (2006b) by means of case studies. On the basis of this research, a number of performance indicators achieved noticeably high importance scores. These indicators are used in the present study to measure the performance of the whole supply chain. The chosen indictors are relatively easily measured for all chain members. Moreover, these performance indicators were considered to be mutually independent, which reduces the risks of double-counts in the aggregation procedure.
Agri-food supply chain performance indicators are grouped into four main categories: efficiency, flexibility, responsiveness and food quality. These four categories are the bottom line of the performance measurement system. Each of these main categories contains one or two performance indicators. Efficiency measures how well the resources are utilized (Lai et al., 2002). It includes the indicator production costs, which is defined as costs of inputs used to produce output (for example, material costs, labor costs, transportation costs, product handling costs, storage costs, and maintenance costs). Flexibility indicates the degree to which the supply chain can respond to a changing environment (Beamon, 1998). It includes the performance indicators volume flexibility and mix flexibility. Volume flexibility is defined as the ability of the firm to change the output volume of the products produced in order to stay within a profitable range. Mix flexibility is the ability to change the variety of the products produced, which enables a firm to enhance customer satisfaction by providing the kinds of products that customers request, in a timely manner. Responsiveness aims at providing the requested products with a short lead time. It includes lead time defined as the total amount of time required to produce a particular item/service.
The specific characteristics of agri-food supply chains are captured in the measurement model in the food quality category. Two indicators of food quality are product safety and appearance. Product safety refers to the extent that a product does not exceed acceptable levels of risk associated with pathogenic organisms or chemical and physical hazards (such as microbiological or chemical contaminants in products, micro-organisms). Appearance is defined as the first view of the product, and is a combination of different specifications (color, lack of blemishes and damage, size etc.).
100

5.4 Methodology
5.4.1 QAS Requirements Used in this Study
Based on a review of QAS used in agri-food supply chains, seven key requirements were chosen (five of which are the same for all chain members and two are different for different chain members, i.e. breeders and growers versus wholesalers and retailers) for a four-stage supply chain consisting of breeder, growers, wholesalers and retailers (see Table 2). The choice for these seven requirements was driven by basic requirements needed to adopt QAS and these have been verified, based on expert opinion, as being the most important requirements for adoption of QAS. The description of the requirements is given in Table 2 together with the chain stages that use these requirements and the QAS from which these requirements are derived.
101

Table 2. Description of QAS requirements
Requirements Description Chain stages* QAS Records of varieties & rootstocks
Records kept for: • Seed quality (a seed record/certificate of
seed quality, purity, etc.) • Pest and disease resistance (the varieties
grown have resistance to disease and pests)
• Seed/plant treatment (a record of the seed/plant treatment)
• Propagation material (records to show propagation material fit for the purpose)
B, G EUREPGAP
Product recall & control of non-conforming products
• Procedure for the control of non-conforming material including rejection, acceptance by concession, or regarding alternative use, shall be in place and understood by authorized personnel
• Ability of an effective product recall procedure for all products
W, R BRC, IFS, ISO 22000
Management commitment towards food safety
Business objective of the firm supports food safety
B, G, W, R ISO 22000, BRC
Records of residue analysis and chemical use
Records are kept with information about product residue analysis and the use of chemicals
B, G, W, R EUREPGAP, BRC, IFS
Worker health, safety and welfare
• Risk assessment (safe and healthy conditions for work)
• Training (hygiene training, first aid training)
• Facilities/clothing (warning signs on equipment, protective clothing, etc)
• Work environment/Welfare (records about the concerns of workers about health, safety and welfare and communications about these issues)
B, G, W, R EUREPGAP, BRC, ISO 22000
Hazard Analysis • Availability of information • Hazard assessment (possibility of
elimination or reduction of the hazard) • Identification of critical control points • System of monitoring critical control
points
B, G, W, R BRC, IFS, ISO 22000
Traceability • Documented traceability system • Handling of potentially unsafe products
B, G, W, R EUREPGAP, BRC, IFS, ISO 22000
*B=Breeder, G=Grower, W=Wholesaler, R=Retailer
102

5.4.2 Survey Design
In this research a self-explicated method has been adapted and applied to evaluate the impact of QAS requirements on performance. The self-explicated method is an alternative method to conjoint analysis, which is a technique for measuring consumers� tradeoffs among multi-attributed products (Green and Srinivasan; 1990, Hair et al., 1998; Valeeva, 2005). Both the self-explicated method and conjoint analysis are based on the simple premise that consumers evaluate the value of a product by combining the separate amounts of value provided by each product�s attribute1. Using an additive model, the individual�s utility for a multi-attribute product concept can be expressed as the sum of the utilities for its attributes.
)(...)()( auauauU +++=
a
21 inii
Where U is utility of product concept, and u is the utility for level)( ija 2 i of attribute (j=1 to n) and (i=1 to mij j), where mj is the number of levels of attribute
j.
In a general set-up of the self-explicated method, respondents first evaluate the levels of each attribute on a desirability scale (e.g. 0-10, where the most preferred level for the attribute receives the value 10 and the least preferred level receives 0). Respondents are then asked to allocate 100 points, for example, across attributes to reflect their relative importance. Part-worths3 are calculated by multiplying the importance rating with the desirability rating (Srinivasan, 1988; Van der Lans and Heiser, 1992; Srinivasan and Park, 1997). The difference between conjoint analysis and the self-explicated method is that the self-explicated method is a compositional method that asks respondents directly for part-worths of an attribute level without making choices, while conjoint analysis is a decompositional method in which
1 It is assumed that consumers purchase products based on their characteristics, which are called attributes (e.g. size or color of a tomato). 2 Attribute may have two or more levels (e.g. a small, medium or large tomato). 3 Estimates of whole preference or utility associated with the level of each attribute used to define the product or service.
103

respondents react to a set of full-profile4 descriptions.
In general, conjoint analysis has several advantages over the self-explicated method5. These advantages are:
1. conjoint analysis creates a greater similarity to the real situation (i.e. profile descriptions used in traditional conjoint analysis are realistic representations of a real product), and may result in higher predictive validity, e.g. when predicting real product choices
2. part-worths are asked for in an indirect manner, which prevents respondents underreporting the importance (e.g. when a respondent is asked about importance of price, he/she may underreport the importance to give the impression that money does not matter)
3. smaller probability of double-count, since it is easier to detect any redundancy in the attributes when attributes are presented in the conjoint full profile, rather than when attributes are asked about separately
On the other hand, the self-explicated method has several advantages over the traditional conjoint method:
1. the information overload problem is minimized because respondents are questioned separately on each attribute
2. ease in analyzing data (e.g. no need for special software)
3. greater ability to handle a large number of attributes
4. less likelihood of simplifying effects (e.g. in full profile conjoint analysis with a large number of attributes, respondents tend to focus on just a subset of attributes, while overlooking the others, which may lead to biased
4 An approach to collecting respondents� judgments in which respondents have to judge a combination of each of the attributes. 5 For extensive research on the compression between advantages and disadvantages of two methods see Sattler and Hensel-Börner (2000).
104

estimates)
5. high speed of data collection with lower costs (e.g. telephone interview)
In this research, the attributes are QAS requirements of EUREP GAP, ISO, etc., which are introduced to a supply chain. By using conjoint analysis or the self-explicated method, it is possible to see the contribution of each QAS requirement to the total performance of the whole supply chain. Given the small amount of attributes (six for each respondent), a full-profile conjoint method with six attributes (two levels each) was tried first. However, respondents experienced severe problems when trying to judge the impact of the combination of these six attributes on different performance indicators (i.e. a significant information overload). Therefore, the self-explicated method has been used. As stated, the self-explicated method minimizes the information overload problem as respondents are questioned separately on each attribute (Srinivasan and Park, 1997).
In this study, the self-explicated method has been adapted in the sense that respondents were asked to judge the desirability and importance of the attribute in one question. An example of questions asked to the respondent included �Please indicate the impact of having management commitment toward food safety on your organization�s production costs� The reference point was the situation in which the requirement was not present. An 11-point scale was used from -5 (very negative) to 5 (very positive). In this question, for each attribute, the level that has the most positive perceived impact on performance is reflected in the positive or negative answers of respondents, while the rating of importance is reflected in the assigned values indicating how negative or positive the impact is.
The questionnaire consisted of three main parts subdivided into six sections6. The first part of the questionnaire consisted of the self-explicated task, where respondents are asked to judge the impact of different QAS requirements on the performance indicators and a number of conjoint holdouts, which were presented to the respondents so that consistency checks could be performed. In the second part of the questionnaire, interviewees were asked to judge the contribution of each supply chain member to the performance of the whole supply chain. For this
6 The questionnaire is available upon request from the first author
105

purpose, the interviewees were asked to divide 100 percentage points between supply chain members for each performance indicator. The last part of the questionnaire consists of an evaluation of the performance measurement categories, and an aggregation of performance indicators into performance categories. Here, interviewees focused on the importance of performance categories as part of the supply chain performance.
5.4.3 Data Collection
Data has been collected in the context of a Dutch tomato supply chain. The choice of a Dutch tomato supply chain as a case of agri-food supply chain is motivated by the fact that the Netherlands is one of the largest producers and exporters of tomatoes in the world. Of total world exports of tomatoes (�3.7 billion), over one-quarter is trade in Dutch tomatoes supplying Germany and UK (Pinckaers 2005). From the total area of 3802 ha under glass, 33% consists of tomatoes (Land-en tuinbouwcijfer 2004). Under the conditions of increasing global competition, these chains need to comply strictly with national and international demands on quality in order to remain competitive in the world market. Thus, these chains are facing the necessity to adopt different QAS.
To represent the whole tomato chain, respondents from the individual links of the chain, starting from breeding companies through to retailers, were interviewed. In total, 20 respondents took part in the case study, i.e. the one breeder in the chain, 13 tomato growers, three wholesalers and three retailers. The choice of one breeder is governed by the fact that there are few breeding companies in the Netherlands, given their capital-intensive nature. To collect data from growers, a workshop was organized. The invitation for the evening workshop was sent to 41 tomato growers in the Netherlands. In November 2006, 13 respondents took part in the workshop. After technical explanations related to the questionnaire, each respondent filled out the questionnaire individually at his/her own speed. Data collection from other members of the chain was carried out through personal interviews, in a similar way to the growers� workshop but on a smaller scale. The wholesale companies interviewed for this study buy tomatoes from the interviewed growers, as well as from growers in other supply chains. The same applies for retailers with respect to their choice of wholesalers.
106

5.5 Results of Analysis
5.5.1 Results for Individual Supply Chain Members
Self-explicated analyses started with a validity check of each respondent. Validity checks were performed using conjoint analysis with eight partial-profile holdouts. These checks were performed for the product safety indicator. Respondents were presented eight different situations with all combinations of three QAS attributes (management commitment toward food safety; worker health, safety and welfare; and traceability), with the levels of attributes in each situation being changed. In each situation where the attribute was available (e.g. fully committed, adequate, possible) it was highlighted in green, and where the attribute was not available (e.g. not committed, not adequate, not possible) it was highlighted in red. Based on these different levels, respondents were asked to evaluate how different situations contribute to product safety. The results of conjoint analysis were compared with the results of the self-explicated analysis, and respondents with inconsistent answers were omitted from further analysis. To compare the results of the two methods, correlation analyses were performed between part-worths obtained by conjoint analysis and self-explicated methods. The hypothesis was that if the respondent is consistent in his/her answers, there should be a high significant positive correlation between part-worths of the two methods. The consistency check revealed that 18 respondents (90%) were consistent in their answers (significant positive correlation, with correlation coefficients of 0.71 and higher). Two respondents (growers) appeared to be inconsistent in their answers and were omitted from further analysis. The Pearson correlation coefficient was used as a measure of the goodness-of-fit. As its mean value is very close to one (R=0.89), the main effect model (conjoint model) fits the data well, and there seems to be no need for interaction effects. Results of self-explicated analysis are presented in Table 3. The part-worth estimates show the contribution of each QAS requirement to each performance indicator for each supply chain member on a scale of -5 to 5 (-5 and 5 mean that a requirement has a very negative and a very positive impact, respectively).
107

Table 3. Part-worth estimates of the impact of the QAS requirements on each performance indicator for each supply chain member
Impact on Performance Indicator Breeder Grower Wholesale Retail Records of varieties & rootstocks NR* NR 1. Impact on Production Costs -1 3.18 2. Impact on Volume Flexibility 0 2.91 3. Impact on Mix Flexibility 0 1.36 4. Impact on Lead Time -1 2.64 5. Impact on Product Safety 4 2.09 6. Impact on Appearance 3 3.00 Product recall & control of non-conforming products NR NR 1. Impact on Production Costs -0.67 -1.67 2. Impact on Volume Flexibility 1.00 -1.33 3. Impact on Mix Flexibility -0.33 -1.00 4. Impact on Lead Time -1.67 -1.33 5. Impact on Product Safety 1.00 2.67 6. Impact on Appearance 0 1.33 Management commitment toward food safety 1. Impact on Production Costs 0 1.00 -1.67 -1.67 2. Impact on Volume Flexibility 0 0.91 -0.33 -1.33 3. Impact on Mix Flexibility 0 0.36 0 -0.67 4. Impact on Lead Time 0 0.82 -0.33 -1.67 5. Impact on Product Safety 1 2.27 3.00 4.00 6. Impact on Appearance 0 0.91 1.00 0 Records of residue analysis and chemical use 1. Impact on Production Costs -1 1.00 -1.00 -1.67 2. Impact on Volume Flexibility 1 1.00 0 -1.00 3. Impact on Mix Flexibility 0 0.36 1.00 -1.00 4. Impact on Lead Time 0 0.18 0 -1.67 5. Impact on Product Safety 4 3.82 2.67 2.33 6. Impact on Appearance 4 0.73 1.00 0 Worker health, safety and welfare 1. Impact on Production Costs -2 1.45 -0.67 -1.00 2. Impact on Volume Flexibility 0 1.09 0 0 3. Impact on Mix Flexibility 0 0.18 0 0 4. Impact on Lead Time 0 0.64 0 -1.33 5. Impact on Product Safety 0 3.00 0.67 1.67 6. Impact on Appearance 0 1.55 1.00 0 Hazard Analysis 1. Impact on Production Costs -3 0.36 -0.67 -1.33 2. Impact on Volume Flexibility 0 0.36 0 -0.33 3. Impact on Mix Flexibility -1 0 0 -0.33 4. Impact on Lead Time 0 0.18 0 -0.33 5. Impact on Product Safety 0 2.27 2.33 4.00 6. Impact on Appearance 2 0.36 0 0 Traceability 1. Impact on Production Costs -1 0.36 -2.67 -1.67 2. Impact on Volume Flexibility 0 0.64 -1.33 -1.67 3. Impact on Mix Flexibility 0 0.55 -1.33 -1.67 4. Impact on Lead Time 0 0.64 -1.33 -1.67 5. Impact on Product Safety 3 2.64 4.00 3.00 6. Impact on Appearance 3 2.18 0 0 *NR =not relevant to the chain member
108

From the results we can see that, in general, QAS requirements are perceived to have little impact on performance indicators. If we look at the signs of part-worths, we notice disagreement between supply chain members about the impact of QAS requirements on their performance.
Keeping records of varieties and rootstocks has a positive perceived impact on the production costs of the growers. The reason given for this is generally that this requirement gives an opportunity to comply with the changes in the market. It may increase the costs in the short run, but in the longer run it increases returns, since growers gain a more competitive position in the market. This requirement also has a positive perceived impact on volume flexibility and appearance of the product in the supermarket. In general, from a grower�s point of view, it is almost impossible to influence the volume flexibility of the products, because demand changes much faster than the duration of the production cycle. However, having all records about the plant�s lifetime (e.g. watering, temperature in the glasshouse, light) may allow growers to adjust the volume of their products to a certain extent, by comparing these records against each other over a number of years. A similar explanation can be given for the positive effect of this requirement on the appearance of the product in the supermarket, where having good records about seeds/plants used (e.g. quality, purity, pest resistance) may provide insight into the final product�s appearance in the supermarket. This requirement has a positive perceived impact on lead time, because records may allow growers/breeders to gain information about the reasons for differences in the length of the production process over years (e.g. input of temperature in the glasshouse) and to act upon it at an early stage. This requirement has a positive perceived impact on product safety as well, since records contain all information about seed/plant treatments (e.g. resistance to disease and pests).
The part-worths for product recall and control of non-conforming products have a negative sign for impact on production costs for wholesalers and retailers, suggesting that this requirement involves the incurring of costs. However, these are not major costs, since several respondents mentioned that product recalls do not happen very often in tomato chains. This requirement has a perceived positive impact on product safety, since it improves control over non-conforming materials and recalls of products from retailers in cases where they are not safe.
Management commitment toward food safety is perceived to have a slightly negative impact on production costs of wholesalers and retailers since it involves
109

additional costs with respect to food safety controls (e.g. additional labor costs for quality managers). It has a positive perceived impact on product safety for all chain members.
A record of residue analysis and chemical use is perceived to have a slightly negative impact on costs of retailers and no impact for other chain members. It has a positive perceived impact on product safety for all chain members. An interesting result is obtained from the breeder concerning the perceived positive impact of this requirement on the appearance of the product in the supermarket. The argument presented was that keeping records of residue analysis and chemical use allows the optimization of the amount of the chemical use and the timing (e.g. during the life-cycle of the plant, when and how much to spray certain chemicals to obtain the best appearance for the end product).
Worker health, safety and welfare is perceived to have a slightly positive impact on production costs of the growers. According to growers, this requirement itself probably costs money, but it has a very positive effect, because it increases the productivity of employees in the long run. This requirement is perceived to have a positive impact on product safety from a grower�s perspective and a slightly positive impact from a retailer�s perspective.
Hazard analysis is perceived to have a negative impact on the costs for breeder, a slightly negative impact for retailers, and no impact for costs of growers and wholesalers� costs. The explanation for this could be that the breeder is the crucial point for providing safe/hazardless raw material (seeds) for the rest of the chain. Therefore, they spend more on having a good system of control over hazards. This requirement has a positive perceived impact on the product safety for all chain members, except for the breeder, who perceived no impact.
Traceability has a negative perceived impact on production costs of wholesalers and a slightly negative impact on costs of retailers. This may be explained by the fact that wholesalers play an extremely important role in the traceability. Wholesalers receive product batches from growers with the grower�s number in each batch. However, many products are repackaged to make them attractive for retailers (e.g. red, green and yellow paprika in one package, or paprika and eggplant in one package). These mixed products should be recoded, which costs time and extra labor. Traceability has a slightly negative perceived impact on mix and volume flexibility of wholesalers and retailers. This can be explained by the
110

fact that wholesalers and retailers are limited in their options for increasing their product volume due to traceability requirements. In the case of mix flexibility, the higher the variety of products, the more additional traceability systems should be applied, since more different products need to be traceable. This requirement appeared to have a slightly negative perceived impact on the lead time of the wholesalers and retailers, which might be explained by the fact that stamping all batches costs time and increases the lead time. Traceability has a positive perceived impact on product safety for all chain members. Interesting results are obtained from breeder and growers about the high positive perceived impact of the traceability on the appearance of the product. One explanation, provided by one of the respondents, is that without traceability there is no possibility of continuous improvements since there is no information on the tomatoes in the supermarket. Traceability motivates growers to improve their product if they know how their tomato appears in the supermarket.
To compare the perceptions of respondents from different supply chain links, a Mann-Whitney U test was performed to detect differences between groups. This test was chosen because it can be used with ordinal data and does not assume a normal distribution (Carver and Nash, 2000). Given the small number of respondents, we defined two groups of respondents: growers are considered as one group, and wholesalers plus retailers are considered as the second group. The null hypothesis (no difference) was rejected for the impact of several requirements on several performance indicators (Table 4). A significant difference was found for the impact of all five requirements on production costs at 5% critical level (�Keeping records of varieties and rootstocks� and �Product recall and control of non-conforming products� could not be tested because they are relevant only to one of the groups). A significant difference was found for the impact of management commitment toward food safety on volume flexibility (p < 0.10), on lead time, and product safety (p < 0.05). The impact of traceability on volume flexibility, mix flexibility and product appearance in the supermarket is found to be significantly different between the groups (p < 0.05)
111

Table 4. Significant differences in perceptions between growers (group 1) and wholesalers and retailers (group 2)
Impact on Performance Indicator Growers (mean) Wholesalers & retailers (mean)
Management commitment toward food safety Impact on Production Costs 1.00 -1.67* Impact on Volume Flexibility 0.91 -0.83** Impact on Lead Time 0.82 -1.00* Impact on Product Safety 2.27 3.50* Records of residue analysis and chemical use Impact on Production Costs 1.00 -1.34* Worker health, safety and welfare Impact on Production Costs 1.45 -0.84* Hazard Analysis Impact on Production Costs 0.36 -1.00* Traceability Impact on Production Costs 0.36 -2.17* Impact on Volume Flexibility 0.64 -1.50* Impact on Mix Flexibility 0.55 -1.50* Impact on Appearance 2.18 0* *Significant at α=0.05; **Significant at α=0.10
In order to see if there is disagreement between the chain members of the same group, the percentage of agreement between chain members of the same group has been taken into account. Given the non-metric nature of our data (i.e. ordinal data) and the small sample size, performing statistical tests (e.g. t-test) is not an option. Therefore, the percentage of similar answers between chain members of the same group with respect to the perceived impact of QAS on performance indictors was used as an indicator of agreement. Given the small sample size of each group, this procedure was carried out only for growers. The results revealed that there is a high level of agreement (between 64% and 100%) between growers on perceived impact of QAS requirements on all but two indicators. These are: 1) perceived impact of requirement worker health, safety and welfare on production costs and volume flexibility, where 54% of respondents perceived a positive impact on these indicators, while the rest perceived no impact, 2) perceived impact of management commitment toward food safety on volume flexibility, where 54% of respondents perceived a positive impact, while the rest perceived no impact, or a negative impact.
112

The results of the two analyses show that there is a higher level of disagreement concerning the impact of QAS requirements on performance indicators between the different groups of chain members, than between chain members of the same group (i.e. growers).
The differences in the perceptions of different groups of chain members can be explained by looking at the position of the group in the supply chain. For instance, keeping records of residue analysis and chemical use is perceived to have a positive impact on most of the performance indicators for growers, while it is perceived to have a negative impact for the wholesalers and retailers. Keeping records of residue analysis and chemical use helps growers to reduce their costs, because in the past growers had to preventively spray their crops with chemicals on a weekly basis, which is rather expensive (both in terms of the labor involved and the chemicals used). Keeping records of residue analysis and chemical use enables growers to pinpoint exactly when and what needs to be sprayed with a certain amount of chemicals, thereby reducing costs dramatically. Moreover, the spraying of chemicals may have an impact on growers� volume flexibility and lead time. Spraying which does not happen on time may delay the growing process and the quantity of the product produced, and thus has an effect on the volume of the products and on lead time. If an organization has kept good records of residue analysis and chemical use, then the possible cause of, for example, delay in production processes, can be traced. A good example is the records which are kept in growers� organizations. Each grower keeps a list of all chemicals used in the growing process together with the temperature records, etc. At harvesting time, growers compare their results, which allows them to identify the best practice. Keeping records of residue analysis and chemical use is perceived to have a negative impact on the performance of the wholesalers and retailers, since the product has to be tested in the laboratory for residues of chemicals, which is a costly procedure. In addition, records of analysis need to be kept, which increases the administrative burden and takes time.
Management commitment toward food safety is perceived to have a negative impact on most performance indicators for wholesalers and retailers, as it might imply the need for them to employ an additional quality manager (e.g. one of the retailers indicated that they are being urged to employ a second quality manager as a result of this requirement). This requirement involves additional food safety controls, which increases the lead time. For growers, this requirement has only
113

positive impacts, because this requirement increases their competitiveness in the market, while there is no need for them to perform additional checks for safety of their products, since all the information about chemicals and pesticides used during the life-cycle of the plant is recorded continuously by the growers.
Traceability is perceived to have a positive impact on most performance indicators for growers, suggesting that it may not be costly for growers to have a traceability system in place and that it increases their competitiveness in the market. Each grower provides a special grower number in each batch of his/her product that goes to the wholesaler/retailer, so this is basically the first step in the chain for the traceability system, while wholesalers and retailers receive products from many different tomato suppliers. This requirement is not only costly for wholesalers/retailers (e.g. recoding of products costs additional labor and time), but also limits their flexibility (e.g. limited number of reliable suppliers).
These issues may explain why supply chain members from different stages have different perceptions about the impact of the same QAS requirements on their performance.
5.5.2 Contribution of Supply Chain Members to Different Performance Indicators
In the second part of the questionnaire, respondents were asked to assess the contribution of each supply chain member to the chain performance indicators. For that purpose, the respondents were asked to divide 100 percentage points between supply chain members for each chain performance indicator, given the chain member�s contribution to the performance indicator. Table 5 presents the mean results of perceptions about the four supply chain links, normalized by the number of respondents in each link. From Table 5 it becomes clear that the perceptions of the respondents about the contribution of different links to the whole chain performance are very diverse (given the large standard deviations between and within groups). The results in Table 5 show that growers are perceived to have the highest contribution to chain production costs (47.3%), chain volume flexibility (35.1%), and chain product safety (47.9%). Retailers are perceived to have the highest contribution to chain mix flexibility (35.7%) and to the appearance of the product in the supermarket (45.7%). According to respondents, the breeder has the smallest contribution to the whole chain performance.
114

Table 5. Contribution of Chain Members to Whole Chain Performance (N=18)
Breeder % Grower % Wholesaler % Retailer % Performance Indicators Mean SD Mean SD Mean SD Mean SD
Total %
Chain Production Costs 8.0 (2.1) 47.3 (11.5) 13.4 (4.7) 31.5 (13.1) 100 Chain Volume Flexibility 10.7 (13.0) 35.1 (7.3) 24.6 (15.8) 29.6 (13.2) 100 Chain Mix Flexibility 13.4 (9.6) 29.5 (8.2) 21.5 (12.6) 35.7 (17.1) 100 Chain lead time 10.4 (8.7) 31.5 (4.9) 28.4 (5.8) 29.7 (13.2) 100 Chain Product Safety 8.5 (5.8) 47.9 (27.5) 17.0 (8.8) 26.9 (22.9) 100 Appearance in the supermarket 7.1 (3.5) 28.2 (16.6) 19.1 (10.3) 45.7 (26.8) 100
To compare the perceptions of respondents from different supply chain links about their contribution to the whole chain performance, the perspectives of growers, wholesalers and retailers are presented in Figures 2A-2F. The breeder�s perspective is not included because there is only one breeder in the case study.
From Figure 2A it can be seen that the perceptions of growers about the contribution of each member to the total production costs differ from the perspective of the wholesalers and the retailers. According to growers, they have the highest contribution to the total chain (62%), while from the wholesalers� point of view it is divided across growers (49%) and retailers (30%). From the retailers� perspective, wholesalers and retailers share almost the same portion of production costs (20% and 26%). An interesting result is obtained for the contribution of chain members to chain volume flexibility (Figure 2B). From the growers� perspective, growers contribute the most to volume flexibility, while wholesalers and retailers contribute more or less equally. Wholesalers have a different perception, allocating growers 43% and retailers 38%. However, retailers do not share this view, giving the highest percentage to wholesalers (47%) and then to growers (30%), leaving only 17% for themselves. Another interesting observation is the perception of the chain members concerning mix flexibility (Figure 2C). From the growers� perspective, retailers make a smaller contribution to chain mix flexibility (23%) than growers (41%) and wholesalers (31%). Wholesalers assign the highest percentage to retailers (45%), 31% to growers and only 18% to themselves. Lead time received also diverse perceptions, where all chain members share rather diverse perceptions (Figure 2D). Growers and wholesalers have similar perceptions about product safety, which is different from the perceptions of retailers (Figure 2E). Perceptions about the contribution of supply chain members to the appearance of the product in the supermarket are not very different (Figure 2F). Summarizing
115

these results, we may conclude that the supply chain members do not have a consistent view of the chain as a whole or about the contribution of each chain member to different performance indicators in the chain.
C h ain Produ ction C osts
0%
20%
40%
60%
80%
100%
Gro
wer
Pers
pect
ive
Who
lesa
ler
Pers
pect
ive
Reta
iler
pers
pect
ive
R e ta ile rWho le s a le rG ro we rB re e de r
C h ain Volu m e Fle xibi l i ty
0%
20%
40%
60%
80%
100%
Gro
wer
Pers
pect
ive
Who
lesa
ler
Pers
pect
ive
Reta
iler
pers
pect
ive
R e ta ile rWho le s a le rG ro we rB re e de r
Figure 2A Figure 2B
C h ai n Mix Fle xi bi l i ty
0%
20%
40%
60%
80%
100%
Gro
wer
Pers
pect
ive
Who
lesa
ler
Pers
pect
ive
Reta
iler
pers
pect
ive
R e ta ile rWho le s a le rG ro we rB re e de r
Total C h ain Le ad Ti m e
0%
20%
40%
60%
80%
100%
Gro
wer
Pers
pect
ive
Who
lesa
ler
Pers
pect
ive
Reta
iler
pers
pect
ive
R e ta ile rWho le s a le rG ro we rB re e de r
Figure 2C Figure 2D
116
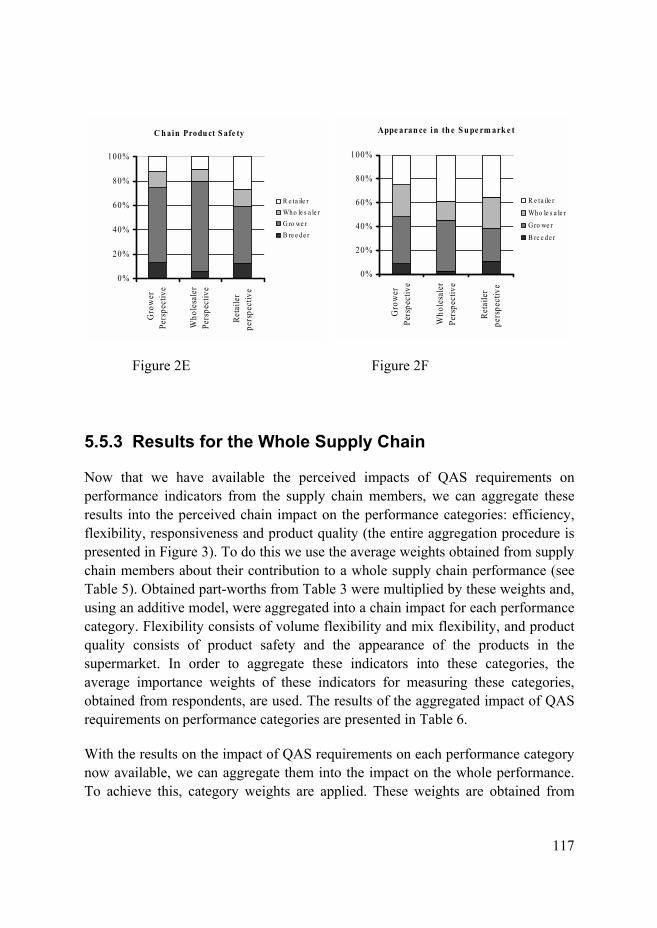
C h ain Produ ct S afe ty
0%
20%
40%
60%
80%
100%G
row
erPe
rspe
ctiv
e
Who
lesa
ler
Pers
pect
ive
Reta
iler
pers
pect
ive
R e ta ile rWho le s a le rG ro we rB re e de r
Appe aran ce i n th e S u pe rm ark e t
0%
20%
40%
60%
80%
100%
Gro
wer
Pers
pect
ive
Who
lesa
ler
Pers
pect
ive
Reta
iler
pers
pect
ive
R e ta ile r
Who le s a le r
G ro we r
B re e de r
Figure 2E Figure 2F
5.5.3 Results for the Whole Supply Chain
Now that we have available the perceived impacts of QAS requirements on performance indicators from the supply chain members, we can aggregate these results into the perceived chain impact on the performance categories: efficiency, flexibility, responsiveness and product quality (the entire aggregation procedure is presented in Figure 3). To do this we use the average weights obtained from supply chain members about their contribution to a whole supply chain performance (see Table 5). Obtained part-worths from Table 3 were multiplied by these weights and, using an additive model, were aggregated into a chain impact for each performance category. Flexibility consists of volume flexibility and mix flexibility, and product quality consists of product safety and the appearance of the products in the supermarket. In order to aggregate these indicators into these categories, the average importance weights of these indicators for measuring these categories, obtained from respondents, are used. The results of the aggregated impact of QAS requirements on performance categories are presented in Table 6.
With the results on the impact of QAS requirements on each performance category now available, we can aggregate them into the impact on the whole performance. To achieve this, category weights are applied. These weights are obtained from
117

respondents, given their assessments about the importance of each category for measuring the whole performance of the chain (See Figure 3).
R W
B G
w=7%
w=46%
w=28% w=19%
Appearance
R W
B G
w=27%
w=48% w=8%
w=17% Product safety
R W
B G
w=30%
w=32% w=10%
w=28% Lead Time
R W
B G
w=30%
w=25% w=35% w=10% Volume
flexibility
R2
B2
w=32%
w=47%w=8%
G2
W2 w=13%
Production costs
w=43%
w=11%
w=24%
w1=22%
w=44%
w=56%
w=100%
w=100%
w=44%
w=56%
R w=36%
w=29% w=13%
W
B G
w=22% Mix
flexibility
Food quality
Responsiveness
Flexibility
Efficiency
Chain Performance
1: w indicates average weights obtained from respondents
2: part-worths obtained from B=Breeder, G=Grower, W=Wholesaler, R=Retailer
Figure 3. Aggregation procedure for the supply chain
118

The aggregated results show that QAS requirements in general have a small impact on the performance categories. The requirement for records of varieties and rootstocks has a slightly positive impact on efficiency. However, the other six requirements have a slightly negative impact, meaning that they slightly decrease the efficiency of the entire supply chain. All requirements have a slightly positive impact on product quality. Flexibility and responsiveness are slightly affected by QAS requirements. The results of the perceived impact of QAS requirements on the performance of the chain revealed that each requirement separately has a slightly positive impact on the whole performance.
All QAS requirements have a positive impact on the overall performance of the chain. The mean of all QAS requirements has a slightly positive impact (0.57) on the overall performance of the chain, suggesting that QAS might be useful to implement. Note that the numbers given in Table 6 are on a scale between -5 and 5, which are the extremely negative and extremely positive points, respectively. The outcome of a small impact might be also a result of the disagreement of the supply chain members about the impact of QAS requirements on their performance (negative and positive answers cancel each other out during the aggregation process, revealing a small impact).
The performance measurement model used in this study allows supply chain members to see the impact of QAS requirements on the different aspects of the whole performance (efficiency, flexibility, responsiveness, and food quality). This allows the decision makers to make tradeoffs between different aspects of the performance. For instance, although management commitments toward food safety slightly decreases efficiency (-0.27), flexibility (-0.15) and responsiveness (-0.38) for the whole chain, it increases the food quality for the whole chain (1.52). And given that supply chain members weigh the food quality as the most important aspect of the performance (43%), we may conclude that this requirement has a positive impact on the whole performance (0.51).
119

Table 6. Aggregated results* of the perceived impact of QAS requirements on the performance of supply chain using average weights
QAS Requirements Efficiency Flexibility Responsive-ness
Product Quality
Whole Chain Impact
Category weights 22% 24% 11% 43% 100% Records of varieties & rootstocks
1.43 0.75 0.2 1.18 1.02
Product recall & control of non-conforming products
-0.61 -0.27 -0.69 0.73 0.03
Management commitment towards food safety
-0.27 -0.15 -0.38 1.52 0.51
Records of residue analysis and chemical use
-0.26 0.08 -0.2 1.87 0.73
Worker health, safety and welfare
0.12 -0.24 -0.08 1.33 0.64
Hazard Analysis -0.58 -0.09 -0.59 1.27 0.32 Traceability -0.79 -0.3 0 1.79 0.69 Mean of all QAS requirements 0.57 *Results are presented on a scale of -5 (very negative) to +5 (very positive impact)
In order to test the robustness of the aggregated results, we performed a sensitivity analysis using different weights obtained from the respondents about their contribution to the performance of the supply chain (the average weights used in the aggregation procedure from Figure 3 were replaced by weights from Figures 2A-2F). The perspectives of growers, wholesalers and retailers have been taken into account. The breeder�s perspective is not included as there is only one breeder in the case study.
The results revealed that by using weights from the growers� perspective in the aggregation process, the mean of perceived impact of all QAS requirements on chain performance is slightly higher (0.68 compared to 0.57) than when using average weights. Mean results of perceived impact of all QAS requirements on chain performance using wholesalers� and retailers� perspectives correspond very closely (0.60 versus 0.59).
In general, when the results obtained by using the different weights were compared to the results obtained by using average weights, it appeared that the results are not divergent. This means that the model results are not sensitive to these weight changes. Therefore, we may assume that the results are rather robust.
120

5.6 Discussion and Conclusions
This study applies an adapted self-explicated method to measure the perceived impact of QAS requirements on the performance of the different stages of the supply chain and the chain as a whole. As such, it provides insights into the performance of a complete supply chain, from different supply chain members� points of view, which is an approach rarely taken in empirical research. The contribution of this study is therefore in the application of a method that enables researchers to study performance measurement in a broader context than the traditional context of a single firm.
The results reveal that QAS requirements slightly impact the performance of the whole supply chain. The mean of all QAS requirements has a slightly positive impact (0.57) on the overall performance of the chain, suggesting that QAS might be useful to implement. Results also indicate that a number of QAS requirements are perceived to have a positive impact on some supply chain stages, while they are perceived to have a negative impact on other supply chain stages. This finding may help to explain why previous studies at firm level found contradictory results on the impact of QAS on performance. The position of the firm in a supply chain seems to be of influence on the impact of QAS requirements. Results revealed that supply chain members do not have a clear view of the whole chain or about the contribution of each supply chain member to the whole supply chain performance. So it is important to explain the whole chain performance to all chain members. Sharing information within and between chain members is very important in the chain, because supply chain partners can work in tight coordination (e.g. to encourage a mutual learning process) to optimize the chain-wide performance, and the realized return may be shared among the partners.
When interpreting the results of this research, caution is needed since this research is a case study with a small sample size, which attempts to show an application of the method to understand the perceptions of the chain members about the impact of QAS requirements on the performance of the whole chain.
The performance measurement model used in this study allows supply chain members to develop a clear view of the impact of QAS requirements on different dimensions of the whole supply chain performance, as well as on the different dimensions of the performance of their own organization. This allows them to make tradeoffs between different aspects (e.g. increased costs, but higher quality
121
products). A sensitivity analysis showed that model results are not sensitive to weight changes, implying that the results are rather robust. For future research, using the methodology and the performance measurement model suggested in this research, it is possible to reveal the perceived impacts of not only QAS on performance, but also the perceived impact of other management systems on the whole performance of the supply chain. Given that this study uses perceived impact, which has a subjective nature, for future research it would be interesting to focus on measuring the actual impact (using the same performance model) of QAS requirements on the performance of the chain.
References
Aramyan, L., Ondersteijn, C., Van Kooten, O. and Oude Lansink, A. (2006a), �Performance Indicators in agri-food production chains,� in Ondersteijn, C.J., Wijnands, J.H., Huirne, R.B. and Van Kooten, O. (Eds.), Quantifying the Agri-food Supply Chain, pp. 47-64, Springer, Dordrecht
Aramyan, L., Oude Lansink, A., Van der Vorst, J. and Van Kooten, O. (2006b), �Performance Measurement in Agri-food Supply Chains: A Case Study�, Supply Chain Management: An International Journal, Vol. 12, No 4, (Forthcoming)
Beamon, B.M. (1998), �Supply chain design and analysis: Models and methods�, International Journal of Production Economics, Vol. 55 No 3, pp. 281-294
Beamon, B.M. (1999), �Measuring supply chain performance�, International Journal of Operations and Production Management, Vol. 19 No 3, pp. 275-292
Carlsson, M. and Carlsson, D. (1996), �Experiences of implementing ISO 9000 in Swedish industry�, International Journal of Quality and Reliability Management, Vol. 13 No 7, pp 36-47
Carver, R.H. and Nash, J.G. (2000), Doing data analysis with SPSS 10.0, Thomson Learning, Duxbury
Corbett, C.J., Montes-Sancho, M.J. and Kirsch, D.A. (2005), �The financial impact
122

of ISO 9000 certification in the United States: an empirical analysis", Management Science, Vol 51, No 7, pp. 1046-1059
Eurep (2004), General regulations fruits and vegetables, version 2.1 January http://www.eurep.org.
Green, P.E. and Srinivasan, V. (1990), �Conjoint analysis in marketing: new developments with implications for research and practice�, Journal of Marketing, Vol. 53, pp. 3-19
Gunasekaran, A., Patel, C. and Tirtiroglu, E. (2001), �Performance measures and metrics in a supply chain environment�, International Journal of Operations and Production Management, Vol 21 No 1/2, pp. 71-87
Hair, J.F., Anderson, R.E., Tatham, R.L. and Black, W.C. (1998), Multivariate data analysis, Fifth Edition, Prentice-Hall, Inc., New Jersey
IFS (2003), International Food Standard. Standard for auditing suppliers, Version 3, Bundesvereinigung Deutscher Handelsverbande (Federals Association of German Trade Companies)
ISO 22000 (2005), IDT, �Food safety management systems-requirements for any organization in the food chain�, Ref. No. EN ISO 22000:2005
Jeng, Y.C. (1998), �Performance evaluation of ISO 9000 registered companies in Taiwan�, The TQM Magazine, Vol. 10 No 2, pp. 132-138
Jensen, H.H, Unnevehr, L.J. and Gomez, M.I. (1998), �Costs for improving food safety in the meat sector�, Journal of Agriculture and Applied Economics, Vol. 30 No 1, pp.83-94
Land- en tuinbouwcijfers (2004), Centraal Bureau voor de Staitistiek (CBS) [Central bureau for statistics]. LEI, Wageningen University and Research Center
Lai, K.H., Ngai, E.W.T. and Cheng, T.C.E. (2002), �Measures for evaluating supply chain performance in transport logistics�, Transportation Research. Part E Logistics and Transportation Review, Vol 38 No 6, pp. 439-456
123

Li, D. and O�Brien, C. (1999), �Integrated decision modelling of supply chain efficiency�, International Journal of Production Economics, Vol 59 No 1/3, pp. 147-157
Llopis J. and Tari J. (2003), �The importance of internal aspects in quality improvement�, International Journal of Quality and Reliability Management, Vol. 20 No. 3, pp. 304-324
Lohman, C., Fortuin, L., Wouters, M. (2004), �Designing a performance measurement system: A case study�, European Journal of Operational Research, Vol 152, No 2, pp 267-286
Meuwissen, M., Velthuis A., Hogeveen H. and Huirne, R. (2003), �Traceability and certification in meat supply chain�, Journal of Agribusiness, Vol. 21 No2, pp. 167-181
Mol, E.P. and Igual, J.J.F, (2005), �Production costs of citrus growing in the Comunidad Valenciana (Spain): EUREPGAP protocol versus standard production�, in Theuvsen L., Spiller A., Peupert M., Jahn G. (Eds.), Quality management in food chains, Wageningen Academic Publishers
Persson, F. and Olhager, J. (2002), �Performance simulation of supply chain designs�, International Journal of Production Economics, Vol. 77 No 3, pp. 231-245
Pinckaers, M. (2005), �Netherlands agricultural situation: The Benelux horticultural market 2005�, GAIN report No: NL 5002, USDA Foreign Agricultural Service
Sattler, J. and Hensel-Börner, S. (2000), �A comparison of conjoint measurement with self-explicated approach�, in Gustafsson, A., Herrmann, A. and Huber, F. (eds.), Conjoint measurement: Methods and applications, pp 121-131, Springer Verlag, Berlin
Singels, J., Ruel, G and Van de Water, H. (2001), �ISO 9000 series certification and performance�, International Journal of Quality and Reliability Management, Vol. 18 No. 1, pp. 62-75
124

Srinivasan, V. (1988), �A Conjunctive-compensatory approach to the self-explication of multiattributed preferences�, Decision Science, Vol. 19, No 2, pp. 295-305
Srinivasan, V. and Park C.S. (1997), �Surprising robustness of the self-explicated approach to customer preference structure measurement�, Journal of Marketing Research, Vol. 34, pp.286-291
Valeeva, N., Meuwissen, M., Oude Lansink, A. and Huirne, R. (2005), �Improving food safety within the dairy chain: an application of conjoint analysis�, Journal of Dairy Science, Vol. 88, pp 1601-1612
Van der Lans, I. and Heiser, W. (1992), �Constrained part-worth estimations in conjoint analysis using the self-explicated utility model�, International Journal of Research in Marketing, Vol. 9, pp 325-344
Van der Spiegel, M, Luning, P., Ziggers G. and Jongen W., (2005), �Development of the instrument IMAQE-food to measure effectiveness of quality management�, International Journal of Quality and Reliability Management, Vol. 22 No. 3, pp. 234-255
Van der Vorst, J.G.A.J. (2000), Effective Food Supply Chains. Generating, modelling and evaluating supply chain scenarios, PhD thesis Wageningen University, Wageningen
Van der Wiele, A., Van Iwaarden, J.D., Williams, A.R.T. and Dale, B.G. (2005), �Perceptions about the ISO 9000 (2000) quality system standard revision and its value: The Dutch experience�, International Journal of Quality and Reliability Management, Vol. 22 No 2, pp. 101-119
125

126

6
CHAPTER 6 General Discussion
127

6.1 Introduction
This final chapter evaluates and discusses the overall research. It presents the main conclusions and suggestions for future research, as well as problems experienced while carrying out this research. This chapter is organized as follows. Section 6.2 presents a brief outline of the research. This is followed by main conclusions of this research in Section 6.3. Section 6.4 presents an evaluation of the research which discusses the contribution this study has made to the literature, and it discusses research limitations and methodological issues. In Section 6.5, the practical implications of the research are discussed. The chapter ends with the suggestions for further research and the final remark.
6.2 Brief Outline of the Research
The objective of this thesis was to contribute to the development of a performance measurement system (PMS) that involves the entire agri-food supply chain (i.e. all stages starting from raw materials to retailers) and includes a comprehensive set of performance indicators. The PMS framework was evaluated and applied to Dutch vegetable supply chains.
In order to achieve the objective of this study four research questions were addressed:
1. What is the impact of different factors, particularly marketing channel, on performance of Dutch vegetable growers?
2. What performance indicators and PMS are currently in use in supply chains and what problems can be identified in measuring performance of agri-food supply chains? How can this knowledge be used for the development of a framework for PMS?
3. What are the key performance indicators for measuring performance of vegetable supply chains and what should a framework for performance indicators look like?
128
4. What method can bring different performance indicators into one overall system of agri-food supply chain performance measurement?
Chapter 2 focused on performance analysis of the Dutch vegetable supply chain members from a dyadic perspective (i.e. grower-wholesaler relationship). This chapter involved efficiency analysis as one aspect of performance. It provides insight in the impact of different marketing channels of Dutch vegetable growers on their performance. From a dyadic perspective and a single aspect of performance, the research moved on to a chain perspective and to the development of a PMS framework that involves multiple indicators of performance (See Chapters 3 and 4). Before such a framework could be developed, a review of existing performance indicators and models was carried out. This literature review is presented in Chapter 3 and, based on this a conceptual framework for measuring performance of agri-food supply chains has been developed, which includes four main categories of performance (i.e. efficiency, flexibility, responsiveness and food quality). In Chapter 4, the developed conceptual framework that involved all stages of the chain (i.e. starting from seed breeder till retailers) was evaluated. The outcome of this case study was a condensed conceptual framework for measuring performance of agri-food supply chains, with a reduced set of key performance indicators (See Figure 3 in Chapter 4). In Chapter 5, this framework was applied to a Dutch tomato supply chain. The application of the model was carried out by looking at the perceived impact of different requirements of Quality Assurance Systems (QAS) on the performance of the Dutch tomato supply chain that involves chain as a whole (i.e. seed breeder till retailer).
6.3 Main Conclusions
The main conclusions of this research are presented below by answering the research questions formulated in Section 6.2 (See also Chapter 1).
Answer to Research Question 1
Dutch vegetable growers in general have high relative technical efficiency scores, indicating that the variation in performance is small. However, the choice of the marketing channel plays an important role in the performance (i.e. growers who used mixed marketing channels on average were relatively more efficient than
129
those who sold their total produce through auctions). Besides marketing channel, there are other factors (e.g. firm size, firm-age, ownership structure) that significantly influence the efficiency of the vegetable growers. Small-scale firms were technically more efficient than large-scale firms due to their relatively easier management task. The older firms tended to operate with less waste of inputs due to past experience, but failed to operate at optimal scale. Firms with more than two owners were more efficient because of collective decision-making and diversity in experiences. These conclusions are based on a dyadic perspective of the chain, and a single performance measure (See Chapter 2).
Answer to Research Question 2
Measuring performance of agri-food supply chains is very complex due to specific characteristics of the chain. Despite the importance of measuring performance in obtaining competitive advantage in the supply chain, relatively little research has been done to provide understanding of measuring and improving performance in agri-food supply chain. A PMS involving a comprehensive set of indicators and incorporating all supply chain members to measure performance of entire agri-food supply chains was not found in the literature. These findings are in line with the conclusions of Theodoras et al. (2005) (See Chapter 1). The specific characteristics of agri-food supply can be incorporated in performance indicators reflecting food quality and together with other financial and non-financial indicators can be included into a PMS framework. Financial and non-finical performance indicators of a PMS framework can be categorized into main performance components such as efficiency, flexibility and responsiveness (See Chapter 3).
Answer to Research Question 3
Efficiency, flexibility, responsiveness and food quality are four key performance components and form the basis for the PMS framework for agri-food supply chains. Within these categories, the most relevant indicators for measuring the performance of the entire supply chain are costs, profit, return on investments, mix flexibility, volume flexibility, lead time, customers� complaints, product appearance and product safety. These indicators are of high importance to all supply chain members, and they are measurable and applicable to all chain members. Therefore, these indicators are included in a PMS framework as a common set of key performance indicators within four main categories for all
130

supply chain members. The developed PMS framework allows chain members, next to the common set of key performance indicators at supply chain level, to include additional indicators in the system based on their own perceptions about the importance of these indicators at organizational level. This means that the PMS can be designed for each link of the supply chain: the four main categories with their key performance indicators must be the same for each link, while each chain member may have its own additional performance indicators within categories, given the different objectives of the firms (See Chapter 4).
Answer to Research Question 4
The adapted self-explicated method is a useful tool that brings different performance indicators into one overall framework of supply chain performance and provides insights in the performance of a complete supply chain from different supply chain members� point of view. The PMS framework that involves a comprehensive set of key performance indicators combined with the adapted self-explicated method allows supply chain members to develop a clear view on the impact of QAS requirements on different aspects of the whole supply chain performance, as well as on the different aspects of the performance of their own organization. This allows them to make tradeoffs between different performance components. The developed PMS allows revealing the impact of other management systems (for quality assurance, as well as other purposes) on the whole performance of the supply chain (See Chapter 5).
Apart from the above-mentioned answer to the research question, the following interesting findings are emphasized:
• The requirements of QAS are perceived to have a slightly positive impact on the overall performance of the studied tomato chain, suggesting that QAS are useful to implement. The position of a firm in the supply chain is of influence on the impact of QAS requirements (i.e. positive or negative) (See Chapter 5).
• Supply chain members do not have a clear view of the whole chain and about the contribution of each supply chain member to the whole supply chain performance. This conclusion is in line with the conclusion of Le Heron (2001) (See Chapter 1). Information sharing within and between
131

chain members is very important to the chain, because it allows supply chain members to work in close coordination to optimize chain-wide performance, and the realized return may be shared among the chain members (See Chapter 5).
6.4 Discussion of the Research
This section discusses the contribution of the research to the existing literature. In addition, it indicates the limitations of the research and some methodological issues.
6.4.1 Contributions of This Study
An analysis of the Dutch vegetable supply chain revealed that it is currently seeing a move away from auctions towards direct marketing or other marketing channels, but little research has been done on the relative efficiency of these alternative channels. Chapter 2 of this thesis contributes to this area of research by investigating the relationship between alternative distribution channels (mixed marketing channels versus traditional auctions) and the performance of growers, namely, it evaluates the impact of the marketing channel on the efficiency of growers.
This study has developed a novel conceptual framework, which forms a basis for measuring performance of agri-food supply chains. This framework is the first step in developing an integrated PMS, which contains financial as well as non-financial indicators combined with the specific characteristics of agri-food supply chains and involves the entire agri-food supply chain (i.e. all stages starting from raw materials to retailers). The conceptual framework consists of two levels: supply chain level and organizational level. At the supply chain level it contains the key performance indicators within four main categories of performance (i.e. efficiency, flexibility, responsiveness and food quality) which are the same for all supply chain members at the chain level. Next to these key performance indicators, each supply chain member may have its own set of additional performance indicators at organizational level based on its own objectives (See Figure 1). The evaluation of this framework indicates that the framework is sound and has potential. This
132

framework is a contribution to the literature since we have not found any previous studies that have attempted to develop a PMS framework for agri-food supply chains involving a comprehensive set of performance indicators and linking all chain partners.
Level 2
Actor A
Actor B
Actor C
Actor D
End User
Level 1
Performance Actor D
Performance Actor C
Performance Actor B
Performance Actor A
Supply Chain Performance
Figure 1. Two levels of supply chain performance indicators Adapted from: Van der Vorst (2000)
The study demonstrates an application of the adapted self-explicated method combined in the case of a Dutch tomato supply chain. The complexity of the evaluation of the entire supply chain performance lies in the difficulty to aggregate different indicators into one performance function that measures overall performance. The adapted self-explicated method is a suitable approach in solving this problem. The employed method in combination with the PMS framework enabled us to develop an understanding of the perceived impact of QAS requirements on performance of the different stages of the supply chain and the chain as a whole. As such, it provides insights in the performance of a complete supply chain, from different supply chain members� point of view, which is an approach seldom taken in empirical research. Therefore, another contribution of this study is the demonstration of a method that enables researchers to study performance measurement in a broader context than the traditional single firm. Besides, the self-explicated method enables to carry out a chain-wide performance analysis for which hard data are lacking.
133

In brief, the main contributions of this study can be summarized as follows. This study developed an agri-food supply chains PMS framework that contains four performance components (i.e. efficiency, flexibility, responsiveness and food quality) and a comprehensive set of common key performance indicators for all supply chain members. Clear definitions of key performance indicators usable through the whole chain are presented (See chapter 4). In addition, we have demonstrated that the developed PMS framework in combination with the self-explicated method allows the inclusion of different performance indicators into one overall system of supply chain performance and provides insights in the performance of a complete supply chain from different supply chain members� point of view.
6.4.2 Limitations of the Research
Obviously, the findings of this research should be considered within certain boundaries. The research model has been evaluated and applied to a tomato supply chain only. Therefore, further research is needed to generalize the findings to other agri-food supply chains. Another limitation of the research is that the application of PMS framework in combination with the adapted self-explicated method assumes equal power distribution in the supply chain. Under such circumstances the individual chain links have a certain degree of autonomy in the way they manage their processes and measure their performance. Under circumstances where one or a few chain links have substantial market power over other chain links, PMS may be strongly geared towards the most powerful chain link(s). This means that the most powerful chain link can dictate to whole chain what should be measured, how and when and can set the target values for indicators. The PMS framework has not been tested under the circumstances of asymmetric market power, so no conclusions can be drawn about the applicability of the framework under these conditions. This is, however, an important issue to consider for further research, given that the structure of agri-food retail in Europe, USA and Canada is experiencing rapid change towards retail power (Bell et al, 1997; Cotterill, 1999; Hobbs and Yong, 2001; Aalto-Setälä, 2002). Some elements of market power have been captured though, during the application of the framework to study the impact of QAS requirements on performance of the chain (See Chapter 5). These requirements are to a great extent imposed by retailers on their supply chains, while, for example, growers have to comply with these requirements (sometimes even to the detriment of their own business). However, the results show that in
134

some cases retailers experience an even more negative impact on their performance from these requirements than growers do. So, even though powerful supply chain links can impose requirements upon weaker links, the effects on performance are not always straightforward (i.e. the strongest links do not necessarily benefit at the expense of weaker links). Some possibilities for further investigation are discussed in Section 6.6.
Currently, organizations increasingly find themselves in a fast changing business environment. This leads to high uncertainty in the supply chain. These uncertainties may be reflected in high variability in demand or supply, product technology, competitors and governmental regulations (Fisher et al., 1997; Sabri and Beamon, 2000). Due to specific characteristics of agri-food supply chains, such as perishability of the product, seasonality, and impact of weather conditions on consumers� demand, these chains are extremely vulnerable to uncertainties. Effective supply chain management should have corresponding performance indicators to be able to cope with these uncertainties (Van der Vorst and Beulens, 2002). The developed PMS framework in this research involves some elements of uncertainty, which are reflected in the flexibility category (e.g. volume and mix flexibility are both determined by demand fluctuations). This research has not explicitly studied the effects the developed supply chain PMS framework has on a supply chain�s ability to cope with uncertainties. Given the fact that each chain link�s success is highly dependent on all preceding chain links, we hypothesize that a supply chain PMS framework that involves all supply chain members is superior to a number of individual organizational PMS in achieving performance improvements in the chain. Further research is needed to test this hypothesis. Some possibilities for further investigation are discussed in Section 6.6.
6.4.3 Methodological Issues
In this subsection the methodological issues dealing with developing and evaluating of the PMS framework are pointed out. The subsection describes issues related to data availability and limitations of the used methodology.
PMS Framework
The selection of performance indicators and performance categories has been done on the basis of a literature review in 2004 (Aramyan et al., 2006). The PMS
135

framework for agri-food supply chains has been developed based on works of Beamon (1998, 1999), Li and O�Brien (1999), Van der Vorst (2000), Gunasekaran et al. (2001, 2004), Persson and Olhager (2002) and Luning et al. (2002). In the literature review we have pointed out that little attention is paid to the research on measuring performance and performance indicators of agri-food supply chain (See Chapter 3). Fortunately, very recently more attention has been paid to this topic. See for instance Theodoras et al., (2005); Gilbert et al., (2004), Sachan et al., (2005), Ondersteijn et al., (2006). Theodoras et al., (2005) conducted a research on improving customer service performance within food supplier-retailers context. In their study, the authors provided insight into the ten customer service elements in Greek sausage sector for improving and maintaining suppliers� performance. These elements are order completeness, error-free invoice, delivery of products without defect, efficient handling of returned products, on-time delivery, informing about shortages in the orders, providing technical information, efficient handling of customer requests, product availability, and efficient handling of emergency. Analysis revealed that suppliers should apply measures in the first eight service elements, from which performance should be improved in the first three elements and maintained as it is in the following five elements.
Sachan et al., (2005) have modeled the total supply chain cost of Indian grain supply chain in order to set up policies to reduce the total supply chain cost. In their study, they considered five major players in Indian grain chain: farmers, traders, commission agents, wholesalers and retailers. Authors found that cost ratio of the consumer�s end and farmer�s end is one of the important performance measures in the grain supply chain, and proposing the action plane to reduce this ratio is a step towards performance improvements in the grain supply chain. In 2004 Gilbert et al., published the results of a study on cross-cultural comparison of service satisfaction of fast food organizations in four English-speaking countries. The study was based on data collected from customers of five globally-franchised fast-food chains, using a previously developed universal service satisfaction instrument for conducting customer satisfaction survey. Customer satisfaction was measured by several factors such as timely service, easy to get help, neat and clean place, helpful personnel, etc. The study revealed two cross-cultural fast-food customer satisfaction dimensions: satisfaction with personal service and satisfaction with the service. Authors argued that due to globalization of food industry, domestic companies will extend their business internationally, which means these companies need to examine the suitability of their business approaches
136

in a global market, so they can continue to satisfy new customers with different cultural expectations pertaining to product and service quality. Therefore, they concluded that the need to continue to find ways to measure service effectiveness, accurately and in a cost effective manner remains imperative in food industry.
Ondersteijn et al. (2006) discussed possibilities and limitations of quantifying performance in agri-food supply chains and demonstrated a wide variety of approaches from different economic disciplines as to be useful in analyzing the agri-food supply chains. Different studies in their research contributed to five key issues in the agri-food supply chains: concepts of measuring performance, empirical research in measuring costs, risk and benefits, modeling agri-food chains, value of information; and governance and performance. The conclusions were that performance of the chain as a whole is more than the sum of performance of each individual organization, meaning that just a single performance indicator is not sufficient for measuring performance of agri-food supply chains. Moreover, the choice for performance indicators depends on the scope of performance measurement. Another conclusion is that a collaborative partnership between retailers and suppliers can help a firm in an agri-food supply chain to improve its performance. Authors recognized that the position of retailers, their concentration and their influence on consumer prices are important topics for future research. Moreover, understanding the complex system of agri-food supply chains requires more investments in retrieving data for testing propositions and developing appropriate models for measuring performance of agri-food supply chain.
These publications appeared later than the PMS framework for this study has been developed. However, with hindsight, the performance indicators used in above-mentioned publications are in line with those used in the developed PMS framework.
Data availability
In general, a research that involves the chain-wide approach suffers from limited availability of hard data (Van der Gaag et al., 2004; Valeeva, 2005). We had the same experience, while undertaking this study. Hard data were available only for Chapter 2, where research was carried out from a dyadic perspective and taking only efficiency into account as a single measure of performance. The data used in Chapter 2 were derived from a sample of Dutch horticultural firms that participated
137

in the Farm Accountancy Data Network (FADN) of the Agricultural Economics Research Institute (LEI). Observations for the period 1995-1999 were taken into account, because more recent data were not available.
This study presents evidence on the weakness of factual data availability for analyzing performance of the entire agri-food supply chain. Despite the lack of factual data, the research makes considerable efforts to evaluate and apply the developed PMS framework in agri-food supply chains. The lack of factual data forced us to look for other possibilities for evaluation and application of the developed conceptual framework. The solution was found by conducting case studies and using expert opinions/perceptions in evaluating and applying the developed conceptual framework. However, these methods of data gathering have some limitations which are further discussed in this subsection.
Data Envelopment Analysis
Data Envelopment Analysis (DEA) was used in Chapter 2 to generate efficiency scores. DEA is a flexible method to calculate efficiency scores and has the advantage of being a non-parametric approach. DEA efficiency measures also have an advantage of being unit invariant, which means that changing the units of measurement does not change the value of efficiency measures. However, this approach is deterministic, meaning that DEA applications represent point estimates of efficiency without properly accounting for uncertainty surrounding these estimates. To overcome this problem Simar and Wilson (2000) have suggested the bootstrap procedure. Future research therefore might focus on bootstrapping DEA efficiency scores in order to estimate bias and variance and to construct confidence intervals over efficiency scores. Another disadvantage of this method is that it requires a large number of observations, while data gathering is one of the most complex issues in a supply chain context.
Case Study Research
Conducting case studies is a very useful method when the theoretical part of the research needs evaluation and further development (Chapter 4). Yin (2003) emphasized the value of the information delivered by case studies. The information source in this case was in-depth personal interviews with experts (i.e. managers of each supply chain link). It has brought us many interesting and relevant insights
138

that we have not come across in the few existing empirical papers on agri-food supply chain performance measurement. Note that the object of our case study was one single tomato supply chain, which comprised one complete chain starting from breeder till the end consumer. Yin (2003) compared a single-case study to a single experiment and gave a rationale for a single-case as appropriate method for evaluating a theory (i.e. single case can be used to determine whether a theory�s propositions are correct, to confirm, challenge and extend the theory). However, we emphasized that caution is needed when generalizing the results, given the fact that the framework was evaluated in one particular case study. In other chains some adjustments to the suggested framework may be needed with regards to performance indicators.
Adapted Self Explicated Method
The adapted self explicated method is a helpful tool for obtaining the contribution of each supply chain member to the overall performance of the chain as well as for eliciting the impact of e.g. QAS or other management systems to the overall chain performance. It gives insights in the performance of a complete supply chain, from different supply chain members� point of view and allows observing of the aspects on which supply chain members have disagreement and how it impacts overall performance of the chain (See Chapter 5). The disadvantage of this method is that it is based on expert opinion, and thus it reflects perceptions rather than factual data. Questions may arise about the reliability of the results. To overcome these questions, a validity test has been performed to check if respondents were consistent in their answers, which proved that 90% of respondents were consistent. Another problem that may arise concerns the reliability of aggregated results, because in the aggregation process the average weights obtained from respondents about their contribution to the overall performance were used. Again, these weights reflect perceptions of respondents about their contribution to the overall performance. Respondents may be biased in their answers (e.g. underestimate or overestimate) about their own contribution. To overcome this problem, sensitivity analyses have been performed to assess the sensitivity of the aggregated results to weight changes. The results revealed that the outcomes were not sensitive to weight changes, supporting the robustness of the results.
139

6.5 Practical Implications of Results
The main outcome of this study is an agri-food supply chains PMS framework that contains four performance components (i.e. efficiency, flexibility, responsiveness and food quality) and a comprehensive set of common key performance indicators, and in combination with the self-explicated method allows to bring different performance indicators into one overall system of supply chain performance measurement.
The PMS framework helps to guide supply chain members in making trade-offs between performance components in order to improve the performance of entire supply chain. For instance, the implementation of a specific management system (or plan or strategy) in the chain may increase the costs of the product, but at the same time it may increase the flexibility or improve food quality. If supply chain members consider food quality or flexibility as the most important aspect of performance a trade-off can be made between increased costs, and increased flexibility or improved food quality. In practice, it might be the case that some additional common indicators for the entire chain have to be added to the PMS framework next to the already developed ones, depending on type of the chain (e.g. fruits, processed food). Besides, this PMS framework allows supply chain partners to identify where in the chain problems/disagreements happen and to solve them by aligning the goals of individual actors in the chain, because this PMS framework provides an understanding into the effect of opposing goals on performance and gives insight into the contribution of individual chain actors to the performance of the entire chain.
Due to globalization agri-food supply chains are faced with stricter (governmental) regulations (e.g., food safety, traceability, environmental regulations, healthy food) and requirements, imposed by retailers (e.g. quality certifications). However, supply chain members do not have a clear indication how these regulations and requirements affect the entire supply chain and which parts of the chain benefit from particular requirement/regulation to the detriments of the others. This PMS framework in combination with the adapted self-explicated method helps in providing insights into the impact of different regulations/requirements on the performance of entire chain as well as on the performance of individual actors. This may result in finding an optimal balance of different objectives of the chain actors (e.g. subsidizing/supporting or adjusting the levers in favor of loss-making organization) to enhance the entire performance of the chain.
140
The results of this study indicate that supply chain members have a poor comprehension about the whole chain and about the contribution of each supply chain member to the whole supply chain performance. So it is important to make the chain more transparent and explain the whole chain performance to all chain members. The introduction of an integrated PMS framework sheds a light on this problem.
This framework is the first step in developing an integrated PMS that contains financial and non-financial indicators that suits the specific characteristics of agri-food supply chains and involves the entire agri-food supply chain. This framework needs a supporting infrastructure (as it was defined in Chapter 1) that enables data to be acquired, sorted, analyzed, interpreted and disseminated in order to be converted into a PMS. For that purpose the PMS framework should be integrated in an organization�s control system that contains objectives (e.g. financial objectives that outline cost effectiveness) and strategies. The developed PMS framework can be incorporated into such a system by setting target values for performance indicators and the timeframe for measuring the indicators.
Based on the arguments discussed above and findings described in the earlier chapters of the thesis, the results can be interesting and helpful for the actors along the supply chain as well as for policy makers involved in regulating issues in relation to agri-food supply chains (e.g. CO2 emissions, food safety, traceability).
6.6 Suggestions for Further Research
6.6.1 Application of PMS Framework using Factual Data
The results of the study revealed that, based on the case studies and subjective judgments of supply chain members, the developed PMS framework has potential. However, for future research it would be interesting to test this PMS framework using factual data. A difficulty with determining the performance of the entire supply chain is the combination of different indicators into a performance function that measures overall performance. Given the fact that multiple indicators in the framework have different dimensions, one of the suitable methods of analysis could be the several techniques of the Multi-Criteria Decision Making (MCDM) approach, such as multi-attribute utility theory (MAUT) in combination with
141

Extended Goal Programming (EGP) (e.g. used by van Calker et. al., 2006) or multi-objective programming (e.g. used by Sabri and Beamon, 2000 in supply chain design), and multi goal programming (e.g. used by Kongar and Gupta 2000 for re-manufacturing supply chain models). MCDM establishes preferences between options with reference to an explicit set of objectives that the decision-maker has identified, and for which he or she has established measurable criteria to assess the extent to which the objectives have been achieved. This method is designed to support decision-makers facing complex, multi-dimensional problems (Romero and Rehman, 2003).
Van Calker et al. (2006) used MAUT to develop a method to determine the overall sustainability function for Dutch dairy farms by using data at attribute level and using stakeholders and experts for assessment of subjective and objective attributes respectively. In order to aggregate the preferences of different stakeholders and experts for attributes into one overall sustainability function, authors used EGP model, which optimizes the disagreement between group (i.e. maximizes agreement and minimizes disagreement between different respondents). One possibility for future research could be to adapt the method developed by van Calker et al. (2006) to this research to determine an overall performance function for agri-food supply chains. This method will also allow making a comparison between performances of different supply chains. Another possibility for future research could be building a multi-objective programming (MOP) model, where the model will have four objectives based on the agri-food supply chain PMS framework (i.e. maximize efficiency, flexibility, responsiveness and food quality). As simultaneous optimization of all objectives is not possible, given a certain level of conflict between them in most real problems, MOP tries to find the set of Pareto efficient solutions, instead of trying to determine a non-existent optimum (Ballestero and Romero, 1998). In other words, MOP aims to establish a partition of the feasible set into to subsets: the subset of Paretian efficient solutions and the subset of inferior or non-efficient solutions.
In this study we have examined the impact of Quality Assurance Systems (QAS) requirements on the performance of an entire supply chain, based on the case study performed in the Netherlands (See Chapter 5). However, The Netherlands is not only an exporter of vegetables, but also an importer (e.g. from Spain, Italy, France). Although many attempts have been made to synchronize QAS in European countries (e.g. by introducing QAS such as EUREPGAP, BRC, IFS), the
142

strictness of QAS requirements/regulations differs in different countries (e.g. the use of post harvest biocides or waxes are regulated by governmental organizations in each country (EUREPGAP, 2004)). This means that in some countries the government could be more tolerant to some requirements, while in others less, meaning that the agri-food products may not always comply with regulations. Therefore, it would be interesting to conduct further research on the impact of QAS on the performance of the chains by comparing the results from different countries.
6.6.2 Market Power
As was discussed above, one of the limitations of the developed PMS framework is that it assumes equal power distribution in the chain. Recently, the concentration in food retailing has increased rapidly in the US, Canada and in Europe. This structural change in retail is reflected in two ways: through ownership and store size. The reduction in number of food stores continues in all countries of Europe (Bell et al., 1997). Many empirical studies dealing with the relationship between concentration and prices in food retailing have indicated that concentration raises prices (Lamm, 1981; Cotterill, 1999). Market power refers to conditions where the providers of service/products can consistently charge prices above those that would be established by a competitive market, which means that it may lead to rise in prices. Increased market power of retailers may lead to: 1) high manufacturer competition and low manufacturer profits and 2) low retailer competition and high retailer profits (Ailawadi, et al., 1995). In the literature market power is often related to product prices, and a profit and consequently to economic performance. However, there has been a little research done on market power related to non-economic performance, e.g. food quality. For future research it would be interesting to investigate:
1. whether a shift of power from manufacturers to retailers has occurred in agri-food supply chains
2. which factors determine market power in the Dutch agr-food supply chain
3. to investigate the impact of market power on economic and non-economic performance of agri-food supply chains using the developed PMS framework
143

6.6.3 Uncertainty and PMS Framework
In section 6.4.2 several sources of uncertainty that surround agri-food supply chains have been discussed. Yet another increasing source of uncertainty are the current trends of increasing product variety and shortening product life cycles. These trends are widely discussed in other industries such as automotive, electronics and clothing (Noori, 1991; Fisher et al., 1999; Mukherjee et al., 2000, van Iwaarden et al., 2006). However, these trends are becoming more important in the field of agriculture and food industry as well, as can be seen the increasing product variety offered in the supermarkets (e.g. organic/biological product lines, special diet food, healthy food, �free from� products) and the frequent introductions of new products and additional flavors, etc. The average supermarket in the USA and Europe now stocks more than 30,000 different products, which is three times as many as 30 years ago (Grieder, 2005; Tesco, 2007). A wide variety of choice is supposedly good for sales since it allows customers to select dishes in accordance with their tastes (Corstjens and Corstjens, 1995).
Increasing product variety requires a company�s management to focus its attention on a broader range of products that are updated frequently, while traditional production processes requires attention to only few products that are stable over time. Increasing product variety increases the complexity and uncertainty for organizations. The complexity is caused by the large number of different processes that require attention, since it is more straightforward to manage a single mass production process than a range of production processes with a large variety of products (Mukherejee, et al., 2000; Meiners, 2006). The uncertainty is caused by the constant flow of new product introductions, which implies that success in the market may last for a short time, because the balance may shift again once competitors introduce a new variety of their product (Van Iwaarden et al., 2006). Therefore, the consequence of increasing product variety and shortening product life cycle for companies is a shift from relatively simple and stable environments towards more complex and unpredictable environments. The result of this is that measuring supply chain performance becomes more complex (Lee, 2002; van Iwaarden et al., 2006). Thonemann and Bradley (2002) analyzed the effect of product variety on supply chain performance, measured in terms of expected lead time and expected costs. They found that if set up time for the new product variety is significant, then the effect of product variety on costs is high. They also showed that discarding the effect of product variety on lead time can lead to poor decisions
144

and can lead companies to offer product variety that is greater than optimal. In 1996, MacDaffie et al. made a distinction between different levels of product variety and examined the impact of the product variety on the manufacturing performance in terms of productivity and consumer-perceived quality. These authors found that an intermediate level of product variety has a persistent negative impact on productivity. Randall and Ulrich (2001) examined the relation among product variety, supply chain structure and firm performance using data from the US bicycle industry. As performance indicators they distinguish production costs (i.e. costs including the incremental fixed investments associated providing additional product varsities) and market mediation costs (i.e. costs raised because of uncertainty in product demand created by variety such as variety-related inventory holding costs, lost sales costs occurring when demand exceeds supply). They found that some types of product variety incur high production costs and some types of variety incur marketing mediation costs. They also found firms with high volumes of production will offer types of varieties associated with high production costs and firms with local production will offer types of variety associated with high market mediation costs.
Research on the impact of increasing product variety and shorting life cycles on performance of agri-food supply chains is limited. Therefore, future research should investigate the impact of these trends on the performance of agri-food supply chains and, more specifically, on the ability of integrated PMS framework to contribute to coping with these trends.
6.7 Final Remarks
Performance measurement is an old concept, since organizations recognized the need for a proper PMS to judge their achievements already decades ago. However, the concept of measuring performance of entire supply chains is relatively new. Traditionally, most organizations have viewed themselves as entities that exist independently from others and need to compete with each other in order to survive. Increasingly, organizations are now focusing on their core business (i.e. the activities that they do really well and where they have competitive advantage over other organizations), while any other activities and products are procured from other organizations. This trend towards outsourcing and globalization has been a major development in global business. To effectively manage and control a chain
145
of organizations, involvement of all supply chain members is necessary. Therefore, organizations are forced to look beyond the performance of their own organization, focusing also on the performance of the entire supply chain. Measuring performance of supply chains received considerable research attention but has led to contradictory findings. Moreover, performance measurement of agri-food supply chains has until a few years ago received little research attention. Recently, due to globalization and competition in the world market, consumers� demands, governmental regulations of food quality, and environmental issues, measuring performance of agri-food supply chains has become a topic of in interest for many researchers. Within the four years of our research, the number of papers devoted to this issue has increased, and is most likely to increase even further in the future. Organizations in the agri-food sector are generally interested in the implications and benefits that a supply chain approach to performance measurement could bring. However, during our research, we have experienced that the actual practice of implementing a supply chain PMS is still very limited. One of the reasons being the many difficulties in measuring and controlling performance of organizations that have no legal power or other form of authority over each other. Future research on supply chain PMS has to pay explicit attention to these challenging issues of confronting the chain members to come to mutual agreement for implementation of such PMS. Supply chain PMS will have a big impact on business organizations since advanced organizations will realize the benefits of involvement of all supply chain partners in performance measurement. No system, however skillfully designed, will make a difference unless supply chain members will come to an agreement to use it in their daily practice.
References
Aalto-Setälä, V., (2002), �The effect of concentration and market power on food prices: Evidence from Finland�, Journal of Retailing, Vol. 78 No 3, pp. 207-216
Ailawadi, K., Borin, N. and Farris, P. (1995), �Market power and performance: A cross-industry analysis of manufacturers and retailers�, Journal of Retailing, Vol. 71 No 3, pp. 211-248
Aramyan, L., Ondersteijn, C., Van Kooten O. and Oude Lansink, A. (2006),
146

�Performance Indicators in agri-food production chains,� in Ondersteijn, C.J., Wijnands, J.H., Huirne R.B. and van Kooten O. (Eds.), Quantifying the Agri-food Supply Chain, pp. 47-64, Springer, Dordrecht
Ballestero, E. and Romero, C. (1998), Multiple Criteria decision making and its applications to economic problem, Kluwer, Boston
Beamon, B.M. (1998), �Supply chain design and analysis: Models and methods�, International Journal of Production Economics, Vol. 55 No 3, pp. 281-294
Beamon, B.M. (1999), �Measuring supply chain performance�, International Journal of Operations and Production Management, Vol. 9 No 3, pp. 275-292
Bell, R., Davies, R. and Howard, E. (1997), �The Changing structure of food retailing in Europe: the implications for strategy�, Long Range Planning, Vol. 30, No. 6, pp. 853-861
Corstjens, J. and Corstjens, M. (1995), Store wars. The battle for mindspace and shelfspace, John Wiley and Sons, Chichester, West Sussex
Cotterill, R. (1999), �Market power and Demsetz quality critique: An evaluation of food retailing�, Agribusiness, Vol. 15 No I, pp. 101-118
Eurep (2004), Control points and compliance criteria, Fruit and vegetables, version 2.1, October, 29th, http://www.eurep.org
Fisher, M.L, Hammond, J., Obermeyer, W. and Raman, A. (1997), �Configuring a supply chain to reduce the cost of demand uncertainty�, Production and Operations Management, Vol. 6 No.3, pp. 211-25
Fisher, M.L., Ramdas, K. and Ulrich, K. (1999), �Component sharing in the management of product variety: a study of automotive breaking systems�, Management Science, Vol. 45 No. 3, pp. 297-315
Gilbert, G.R., Veloutsou, C., Goode, M.M.H. and Moutinho, L. (2004), �Measuring customer satisfaction in the fast food industry: a cross-national approach�, Journal of Service Marketing, Vol. 18 No 5, pp. 371-383
Grider, E. (2005), �When choice consumes�, Feature Story, 2005, University of
147

Texas at Austin, www.utexas.edu./features/archive/2005/hyperchoice.html
Gunasekaran, A., Patel, C. and Tirtiroglu, E. (2001), �Performance measures and metrics in a supply chain environment�, International Journal of Operations and Production Management, Vol. 21 No 1/2, pp. 71-87
Gunasekaran, A., Patel, C. and McGaughey, R. (2004), �A framework for supply chain performance measurement�, International Journal of Production Economics, Vol. 87 No 3, 333-347
Hobbs, J.E. and Young, L.M. (2001), �Vertical linkages in agri-food supply chains in Canada and United States�, RAD publication (June), Strategic Policy Branch, Agriculture and Agri-food Canada
Kongar, E. and Gupta, S.M.A. (2000), �Goal Programming Approach to the remanufacturing supply chain model�, Proceedings of the SPIE International Conference on Environmentally Conscious Manufacturing (Vol. 4193), 167-178
Li, D. and O�Brien, C. (1999), �Integrated decision modelling of supply chain efficiency�, International Journal of Production Economics, Vol. 59 No 1/3, pp. 147-157
Lamm, R. (1981), �Prices and concentration in the food retailing industry�, Journal of Industrial Economics, Vol. 30 No 1, pp. 67-78
Lee, H.L. (2002), �Aligning supply chain strategies with product uncertainty�, Californian Management Review, Vol. 44 No 3, pp. 105-119
Luning, P.A., Marcelis, W.J. and Jongen, W.M.F. (2002), Food quality management. A techno managerial approach, Wageningen Academic Publishers, Wageningen
MacDuffie, J.P., Sethuraman, K. and Fisher, M.L. (1996), �Product variety and manufacturing performance: evidence from the International Automotive Assembly Plant study�, Management Science, Vol. 42, No 3, pp. 350-369
Meiners, J. (2006), �Zetsche will reduce options on Mercedes�, Automotive News, March, 6
148
Mukherejee, A., Mitchell, W. and Talbot, F.B. (2000), �The impact of new manufacturing requirements on production line productivity and quality at a focused factory�, Journal of Operations Management, Vol. 18 No 2, pp. 139-168
Noori, H. (1991), �Decoupling of product and process life cycles�, International Journal of Production Research, Vol. 29 No. 9, pp. 1853-1865
Ondersteijn, C.J.M, Wijnands, J.H, Huirne, R.B.M and Van Kooten, O. (2006), Quantifying the Agri-Food Supply Chains, Springer, Dordrecht
Persson, F. and Olhager, J. (2002), �Performance simulation of supply chain designs�, International Journal of Production Economics, Vol. 77 No 3, pp. 231-245
Randall, T. and Ulrich, K. (2001), �Product variety, supply chain structure and firm performance: analysis of the US bicycle structure�, Management Science, Vol.47 No. 12, pp. 1588-1604
Romero, C. and T. Rehman, (2003), Multiple criteria analysis for agricultural decisions. Elsevier, Amsterdam
Sabri, E.H. and Beamon, B.M. (2000), �A multi-objective approach to simultaneous strategic and operational planning in supply chain deign�, Omega, Vol. 28 No 5, pp. 581-598
Sachan, A., Sahay, B.S. and Sharma, D. (2005), �Developing Indian grain supply chain cost model: a system dynamic approach�, International Journal of Productivity and Performance Management, Vol. 54 No 3, pp. 187-205
Simar, L., and Wilson, P. (2000), �A general methodology for bootstrapping in nonparametric frontier models�, Journal of Applied Statistics, Vol. 27, pp. 779-802
Tesco (2007), �Competition commission product choice�, Talking Tesco, www.tesco.com/talkingtesco/productChoice
Theodoras, D., Laios L. and Socrates, M. (2005), �Improving customer service performance within a food supplier-retailers context�, International Journal of
149

Retail and Distribution Management, Vol. 33 No 5, pp. 353-370
Thonemann, U.W. and Bradley, J.R. (2002), �The effect of product variety on supply chain performance�, European Journal of Operational Research, Vol. 143, pp. 548-569
Valeeva, N.I. (2005), Cost-effectiveness of improving food safety in the dairy production chain, PhD thesis, Wageningen University, Wageningen
Van Calker, K.J, Berentsen, P.B.M., Romero C., Giesen, G.W.J and Huirne, R.B.M. (2006), �Development and application of a multi-attribute sustainability function for Dutch dairy farming systems�, Ecological Economics, Vol. 57 No 4, pp. 640-658
Van der Gaag, M.A., Saatkamp, H.W., Backus, G.B. C., van Beek, P. and Huirne, R.B.M. (2004), �Cost-effectiveness of controlling Salmonella in the pork chain�, Food Control, Vol.15 No 3, pp. 173-180
Van Iwaarden, J.D., Van der Wiele, A., Williams, A.R.T. and Dale, B.G. (2006), �A management control perspective of quality management: An example in the automotive sector�, International Journal of Quality and Reliability Management, Vol. 23 No 1, pp. 102-112
Van der Vorst, J.G.A.J. (2000), Effective food supply chains; Generating, modeling and evaluating supply chain scenarios, PhD-thesis Wageningen University, Wageningen
Van der Vorst, J.G.A.J. and Beulens, A.J.M. (2002), �Identifying sources of uncertainty to generate supply chain redesign strategies�, International Journal of Physical Distribution and Logistics Management, Vol. 32 No 6, pp. 409-430
Yin, R.K. (2003), Case study research, design and methods, Third edition, Sage, London
150

SUMMARY
Due to globalization, there has been an enormous increase in cross-border flows of food products, which means that agri-food supply chains have gained more complex relationships. This development requires enhanced quality, logistics and information systems that enable more efficient realization of processes and more frequent exchange of large amounts of information for coordination purposes. Yet, more considerable changes have taken place in agri-food chains. Nowadays consumers put more demands on issues such as product quality, food safety, product diversity and service than they used to do just a couple of years ago. In this era of globalization of markets, many companies realize that, in order to operate efficiently and effectively, tools are needed for assessing the performance of supply chains. Performance measurement can be used to help direct the allocation of resources, assess and communicate progress towards strategic objectives and evaluate managerial performance. Besides, chain performance measurement helps managers to identify good performance, it helps them to make tradeoffs between profit and investment, it provides means to set strategic targets, and it ensures that managers are aware when to get involved if business performance is deteriorating. Despite its usefulness, measuring supply chain performance has received very little research attention in agri-food supply chains to date. The objective of this thesis is therefore to contribute to the development of a Performance Measurement System (PMS) that involves the entire agri-food supply chain (i.e. all stages starting from raw materials to retailers) and includes a comprehensive set of performance indicators. This thesis is focused on Dutch vegetable supply chains, because the Netherlands is one of the largest producers and exporters of vegetables in the world. A Dutch tomato supply chain has been chosen as case study.
Chapter 2 of this thesis studies one aspect of performance, which is efficiency in vegetable supply chains. Its focus is mainly on the grower-wholesaler relation (i.e. taking a dyadic perceptive). The goal of this study was to investigate the relationship between alternative distribution channels (mixed marketing channels versus traditional auctions) and the performance of growers, more specifically, to determine the impact of the distribution channel on the technical and scale efficiency of growers. The study consisted of two stages. In the first stage, Data Envelopment Analysis (DEA) was used to determine technical efficiency and scale efficiency. In the second stage, a Truncated Regression Model (TRM) was applied to explain grower efficiency from a managerial point of view. This study showed
151

that the choice of marketing channel plays an important role in the performance of vegetable growers. Growers, who used mixed marketing channels, on average, were relatively more efficient than those who sold their total produce through auctions. Besides marketing channel, factors such as firm size, firm-age, and ownership structure were also found to significantly influence the efficiency of the vegetable growers.
Chapter 3 consists of a review of the literature on performance measurement. This chapter presents existing performance indicators and models, and discusses their usefulness in measuring performance of agri-food supply chains. Furthermore, an overview of different methodologies to design a PMS is presented. Based on this literature review, a conceptual framework for measuring performance of agri-food supply chains has been developed, which contains financial as well as non-financial performance indicators and it captures the specific characteristics of agri-food supply chains. Agri-food supply chain performance indicators are grouped into four main categories: efficiency, flexibility, responsiveness and food quality. These four categories are the bottom line of the performance measurement system. Each of these main categories contains a set of performance indicators. Efficiency measures how well the resources are utilized. Flexibility indicates the degree to which the supply chain can respond to a changing environment. Responsiveness aims at providing the requested products with a short lead time. The specific characteristics of agri-food supply chains are captured in the measurement model in the food quality category.
Chapter 4 evaluates the usefulness of the developed conceptual framework for measuring performance of agri-food supply chains. The conceptual framework has been evaluated in a Dutch�German tomato supply chain by means of a case study approach. The study further developed the conceptual framework into a condensed framework with four main performance categories that include only key performance indicators, applicable for practical use. Efficiency includes the indicator production costs, which is defined as costs of inputs used to produce output. Flexibility includes the performance indicators volume flexibility and mix flexibility. Volume flexibility is defined as the ability of the firm to change the output volume of the products produced in order to stay within a profitable range. Mix flexibility is the ability to change the variety of the products produced, which enables a firm to enhance customer satisfaction by providing the kinds of products that customers request, in a timely manner. Responsiveness includes lead time and
152
customer complaints. Lead time is defined as the total amount of time required to produce a particular item/service. Customer complaints are the registered complaints from customers about a product or service. Two indicators of food quality are product safety and appearance. Product safety refers to the extent that a product does not exceed acceptable levels of risk associated with pathogenic organisms or chemical and physical hazards (such as microbiological or chemical contaminants in products, micro-organisms). Appearance is defined as the first view of the product, and is a combination of different specifications (color, lack of blemishes and damage, size etc.) Based on the case study in the tomato supply chain, this framework is found to have potential for effectively and efficiently measuring the performance of an entire supply chain
Chapter 5 deals with the application of the conceptual framework to an entire tomato supply chain. This study uses perceptions of the Dutch tomato supply chain members to understand the perceived impact of different Quality Assurance Systems (QAS) requirements on the performance of the tomato supply chain. These perceptions were obtained using an adapted self-explicated method. The adapted self explicated method appeared to be a helpful tool for obtaining the contribution of each supply chain member to the overall performance of the chain. Moreover, this method allowed to aggregate the perceived impact of QAS on performance of each individual member of the supply chain into the overall chain impact. Results indicated that some QAS requirements were perceived to have a positive impact on some supply chain members� performance, while they were perceived to have a negative impact on other supply chain members� performance. Overall, results revealed that all selected QAS requirements were perceived to have a positive impact on the performance of the supply chain as a whole, although the total impact was small. The performance measurement framework applied in this study gave an insight in the impact of QAS requirements. Also, the framework allows to make tradeoffs between issues such as, for instance, production costs and flexibility, within the own firm as well as throughout the chain.
The main outcome of this study is an agri-food supply chain PMS framework that contains four performance components and a comprehensive set of common key performance indicators, and in combination with the self-explicated method allows to bring different performance indicators into one overall system of supply chain performance measurement. Organizations in the agri-food sector are generally interested in the implications and benefits that a supply chain approach to
153

performance measurement could bring. However, during our research, we have experienced that the actual practice of implementing a supply chain PMS is still very limited. One of the reasons being the many difficulties in measuring and controlling performance of organizations that have no legal power or other form of authority over each other. We feel that future research on supply chain PMS will have to pay explicit attention to the challenging issue of confronting the chain members to come to mutual agreement on implementation of such PMS.
154

SAMENVATTING
Als gevolg van globalisatie, heeft er de afgelopen jaren een enorme toename plaatsgevonden in de grensoverschrijdende stroom van voedselproducten, met als gevolg dat agri-voedsel ketens in toenemende mate gekenmerkt worden door complexe verhoudingen. Deze ontwikkeling vereist verbeterde kwaliteit, logistiek en informatiesystemen die de organisaties in staat stellen tot efficiëntere realisatie van processen en het veelvuldig uitwisselen van grote hoeveelheden informatie voor coördinatie doeleinden. Er hebben nog meer aanzienlijke veranderingen plaatsgevonden in agri-voedsel ketens. Tegenwoordig zijn consumenten veeleisender met betrekking tot productkwaliteit, voedselveiligheid, productverscheidenheid en dienstverlening dan enkele jaren geleden. In dit tijdperk van globalisatie van markten beseffen vele bedrijven dat, om efficiënt en doeltreffend te werken, de prestaties van hun productieketens gemeten moeten worden. Het meten van ketenprestaties kan gebruikt worden om de allocatie van hulpbronnen te sturen, het bepalen van en communiceren over vooruitgang in het bereiken van strategische doelen en het evalueren van de prestaties van het management. Bovendien helpt het meten van ketenprestaties managers om goede prestaties te identificeren, het helpt hen om afwegingen te maken tussen winst en investeren, het verschaft middelen om strategische doelen te stellen en het zorgt ervoor dat managers zich bewust zijn wanneer ze moeten ingrijpen als presentaties afnemen. Ondanks de noodzaak voor het doeltreffend en efficiënt meten van de prestaties van productieketens, heeft het onderwerp tot nu toe weinig aandacht gekregen in wetenschappelijk onderzoek over agri-voedsel ketens. Het doel van deze thesis is daarom bij te dragen aan de ontwikkeling van een Prestatie Meet Systeem (PMS) dat de volledige agri-voedsel keten beslaat (d.w.z. alle stadiums van grondstoffen tot detailhandelaars) en een uitgebreide set van prestatie indicatoren bevat. Dit proefschrift is gericht op Nederlandse groente productieketens, omdat Nederland één van de grootste producenten en exporteurs van groenten in de wereld is. Een tomaten productieketen is het onderwerp van de empirische analyses in de verschillende hoofdstukken.
Hoofdstuk 2 van dit proefschrift bestudeerde één aspect van prestaties, namelijk de efficiëntie in groenteproductieketens. De focus is hoofdzakelijk op de relatie tussen teler en groothandelaar. Het doel van deze studie was de verhouding tussen alternatieve distributiekanalen te onderzoeken (gemengde marketing kanalen tegenover traditionele veilingen) en de prestaties van telers; in het bijzonder om de
155

invloed van het distributiekanaal op de technische en schaal efficiëntie van telers vast te stellen. De studie bestond uit twee stadia. In het eerste stadium werd Data Envelopment Analyse (DEA) gebruikt om de technische en schaal efficiëntie van de Nederlandse groente sector te bepalen. In het tweede stadium werd een Truncated Regression Model (TRM) gebruikt om de efficiëntie van telers vanuit een management oogpunt te onderzoeken. Deze studie toonde aan dat de keuze van marketing kanaal een belangrijke rol in de prestaties van groente telers speelt. Telers die gemengde marketing kanalen gebruikten waren gemiddeld relatief efficiënter dan degenen die hun totale groenten productie via veilingen verkochten. Naast de keuze van marketing kanaal bleken factoren zoals bedrijfsgrootte, bedrijfsleeftijd en eigendomsstructuur ook de efficiëntie van de groente telers te beïnvloeden.
Hoofdstuk 3 bestaat uit een overzicht van de literatuur over het meten van prestaties. Dit hoofdstuk presenteert bestaande prestatie indicatoren en modellen; en bespreekt hun nut voor het meten van de prestaties van agri-voedsel ketens. Bovendien, wordt een overzicht gegeven van verschillende methodologieën voor het ontwerpen van een PMS. Gebaseerd op dit literatuuroverzicht is een conceptueel raamwerk voor het meten van de prestatie van agri-voedsel ketens ontwikkeld dat zowel financiële als niet-financiële prestatie indicatoren bevat; en het neemt de specifieke kenmerken van agri-voedsel ketens in acht. Agri-voedsel keten prestaties indicators zijn in vier hoofdcategorieën gegroepeerd: efficiëntie, flexibiliteit, responsiviteit en voedselkwaliteit. Deze vier categorieën zijn de essentie van het prestatie maat systeem. Efficiëntie geeft aan in welke mate de onderneming of de keten doelmatig omgaat met productiemiddelen. Flexibiliteit is de mate waarin de keten in staat is om te reageren op veranderende markt eisen. Responsiviteit is de mate van klantvriendelijkheid van de keten. Productkwaliteit heeft betrekking op zichtbare en onzichtbare kwaliteitsaspecten van producten.
Hoofdstuk 4 evalueert het nut van het ontwikkelde conceptuele raamwerk voor het meten van de prestaties van agri-voedsel ketens. Het conceptuele raamwerk is in een Nederlands�Duitse tomaten productieketen geëvalueerd door middel van een case study benadering. De studie ontwikkelde het conceptuele raamwerk verder in een gecomprimeerd raamwerk met vier hoofdcategorieën die alleen hoofd prestatie indicatoren omvatten, die toepasbaar zijn voor praktisch gebruik. Efficiëntie omvat de prestatie indicatoren productiekosten, winst en rentabiliteit over het geïnvesteerde vermogen (ROI). Productiekosten zijn kosten van inputs en diensten
156

die wordt gebruikt in het productieproces. Winst is het positieve resultaat of bedrijfsactiviteiten na het aftreken van alle kosten. ROI is een maat van winstgevendheid van een bedrijf en meet hoe doeltreffend het bedrijf zijn kapitaal gebruikt om winst te genereren. De flexibiliteit omvat de prestatie indicators volume flexibiliteit en mixflexibiliteit. Volumeflexibiliteit is de capaciteit om het productieniveau te veranderen, teneinde winstgevend te blijven. Mixflexibiliteit is de capaciteit om de productiemix aan te passen, waardoor de onderneming de klanttevredenheid kan verhogen omdat de klant op het juiste moment de juiste producten geleverd krijgt. Responsiviteit omvat de indicatoren doorlooptijd en klant klachten. Doorlooptijd is de totale tijd die nodig is voor de productie of levering van een product of dienst. Klant klachten zijn geregistreerde klachten van klanten over een product of dienst. Voedsel kwaliteit omvat de prestatie indicatoren productveiligheid en de uiterlijke kenmerken van product. Productveiligheid is de mate waarin het product geen onaanvaardbare risico�s oplevert voor consumenten als gevolg van fysieke gevaren, en chemische en microbiologische verontreinigingen. Uiterlijke kenmerken van het product is gedefinieerd als de combinatie van verschillende uiterlijke kenmerken van het product: kleur, vorm, gebreken, grootte. Gebaseerd op de case study in de tomaten productieketen, wordt dit raamwerk geacht potentie te hebben voor het doeltreffend en efficiënt meten van de prestaties van een volledige productieketen.
Hoofdstuk 5 bespreekt de toepassing van het conceptuele raamwerk in de volledige tomaten productieketen. Deze studie gebruikte percepties van spelers in de Nederlandse tomaten productieketen om de gepercipieerde impact van verschillende eizen uit Kwaliteit Waarborg Systemen (KWS) op de prestaties van de tomaten productieketen inzichtelijk te maken. Deze percepties werden verkregen doorgebruik te maken van een aangepaste self-explicated methode. De aangepaste self-explicated methode bleek een bruikbare tool te zijn voor het meten van de bijdrage van elk lid van productie keten aan de totale prestatie van de keten. Bovendien kan met behulp van deze methode de bijdrage van elk individueel lid van productie keten aan de totale ketenprestatie te aggregeren. De resultaten maken duidelijk dat sommige KWS vereisten verondersteld werden om een positieve impact op de prestaties van sommige spelers in de keten te hebben, terwijl zij tevens verondersteld werden om een negatieve impact op de prestaties van andere spelers te hebben. In totaliteit gaven de resultaten aan dat alle geselecteerde KWS vereisten verondersteld werden om een positieve impact op de prestaties van de gehele keten te hebben; hoewel deze totale impact klein was. Het prestatie meet
157
raamwerk dat toegepast is in deze studie gaf een inzicht in de impact van KWS vereisten. Ook is het model bruikbaar om trade-offs te maken tussen bijvoorbeeld productiekosten en flexibiliteit; zowel binnen het eigen bedrijf als in de hele keten.
Het belangrijkste resultaat van dit onderzoek is een agri-voedsel keten PMS raamwerk dat vier prestatie componenten en een veelomvattende set van gemeenschappelijke hoofd prestatie indicatoren bevat. Bovendien maakt dit PMS raamwerk het mogelijk om, in combinatie met de self-explicated methode, verschillende prestatie indicatoren in een overall PMS voor productie ketens onder te brengen. Organisaties in de agri-voedsel sector zijn over het algemeen geïnteresseerd in de implicaties en voordelen die een leveringsketen benadering van prestatie meting zou kunnen opleveren. Maar tijdens ons onderzoek hebben wij ervaren dat het gebruik in de praktijk van een leveringsketen PMS nog steeds heel beperkt is. Eén van de redenen hiervoor zijn de vele moeilijkheden in het meten en beheersen van de prestaties van organisaties die geen wettelijke macht of andere vorm van autoriteit over elkaar hebben. Wij vinden dat toekomstig onderzoek naar leveringsketen PMS expliciete aandacht zou moeten besteden aan de uitdaging om de spelers in de keten te confronteren om tot wederzijdse overeenstemming te komen over de implementatie van een dergelijk PMS.
158

LIST OF PUBLICATIONS
Journal Articles
Aramyan, L.H., C.J.M. Ondersteijn, A.G.J.M. Oude Lansink, O. Van Kooten, and J. Wijnands, (2006), �Analyzing greenhouse firm performance across different marketing channels�, Agribusiness: An International Journal, Vol. 22, No 2, pp. 267-280
Aramyan L.H., A.G.J.M. Oude Lansink, J.G.A.J. Van der Vorst and O. van Kooten, (2007), �Performance measurement in agri-food supply chains: an case study�, Supply Chain Management: An International Journal, Vol. 12, No 4, (Forthcoming)
Aramyan L.H, A.G.J.M. Oude Lansink and J.A.A.M. Verstegen (2007), �Factors underlying the investment decision in energy-saving systems in the Dutch Horticulture�, Agricultural Systems, Vol. 94, pp. 520-527
Aramyan L.H., M.P.M. Meuwissen, A.G.J.M. Oude Lansink, J.G.A.J. Van der Vorst, O. van Kooten and I.A. Van der Lans, (2007), �The perceived impact of Quality Assurance Systems on tomato supply chain performance�, submitted for publication
Book Chapters
Aramyan, L.H, C.J.M Ondersteijn, O. Van Kooten and A.G.J.M. Oude Lansink, (2006), �Performance Indicators in agri-food production chains�, in Ondersteijn, C.J.M., Wijnands, J.H.M., Huirne, R.B.M., van Kooten,. O. (Eds.), Quantifying the Agri-food Supply Chain, Springer, Dordrecht, pp. 47-64
Conference papers
Aramyan, L.H, C.J.M Ondersteijn, A.G.J.M. Oude Lansink, O. Van Kooten, and J. Wijnands (2004), �Marketing channels for greenhouse vegetables and grower performance�, In: Bremmers, H., S. Omta, J. Trienekens and E. Wubben (eds.), �Dynamics in Chains and Networks�, Proceedings of the Six International Conference on Chain and Network Management in Agribusiness and Food Industry, Ede, May 27-28, pp. 443 � 449
159

Aramyan, L.H., C.J.M Ondersteijn, A.G.J.M. Oude Lansink, and O. Van Kooten, O. van (2004), �Explaining Grower's Performance in different marketing channels for greenhouse vegetables�, 14th Annual IAMA Food & Agribusiness Forum, Symposium and Case Conference, Montreux, Switzerland, 12-15 June
Aramyan, L.H., C.J.M Ondersteijn, A.G.J.M. Oude Lansink, and O. Van Kooten, (2005), �Measuring performance of agri-food supply chains�, 15th Annual Food and Agribusiness Symposium, Chicago, USA, 25-28 June
Aramyan, L.H, A.G.J.M. Oude Lansink, and J.A.A.M. Verstegen (2005), �Investments in energy-saving systems in Dutch horticultural farms�, in: �Developing Entrepreneurship Abilities to Feed the World in a Sustainable Way�, 15th International Farm Management Association Congress, Campinas, Sao Paulo, Brazil, 14-19 August, pp. 39-47
Aramyan, L.H, A.G.J.M. Oude Lansink, and O. Van Kooten, (2005), �Testing a performance measurement framework for agri-food supply chains�, in: �Developing entrepreneurship abilities to feed the world in a sustainable way�, 15th International Farm Management Association Congress, Campinas, Sao Paulo, Brazil, 14-19 August, pp. 86-97
Aramyan, L.H, A.G.J.M. Oude Lansink, J.G.A.J. Van der Vorst and O. Van Kooten, (2005), �Integrated performance measurement system in a Dutch tomato supply chain�, in: �Economics and Social Sciences Research in Food, Agriculture, Environment and Development� Mansholt PhD-day, Wageningen, 22-23 September
Aramyan, L.H. (2006), �Impact of Quality Systems on the performance of entire agri-food supply chains�, Proceedings of 21st European Conference on Operational Research, Reykjavik, Iceland, July 2-5, pp. 113
Other Publications
Wijnands J., Aramyan, L.H, and C.J.M Ondersteijn, (2004), �Efficientie van glasgroentetelers kan verbeteren�, Agrimonitor 3, LEI
160

CURRICULUM VITAE
Lusine H. Aramyan was born on July 4, 1978 in Yerevan (Armenia). In 2000, she graduated with distinction from the economic faculty of the Armenian Agricultural Academy, obtaining her bachelor diploma of economics with a specialization in agri-production organization and management. Thereafter, she joined the Master�s study program at the Armenian Agricultural Academy. In 2001, she continued her Master�s study program at Wageningen University, The Netherlands, facilitated by the international Tempus project. She obtained her MSc degree in Agricultural Economics and Management from Wageningen University, in March 2003. The title of her MSc thesis was �Investments in Energy-Saving Systems in Dutch Horticulture�, and was later published in journal �Agricultural Economics�. In April 2003, she started as PhD candidate at the Business Economics Group of Wageningen University. During this period she followed her PhD education program at the Mansholt Graduate School of Wageningen University. From April 2007 she has been appointed at the Public Issues department of the Agricultural Economics Research Institute (LEI) as Scientific Researcher with a focus on agricultural and food policy issues.
161

162

TRAINING AND SUPERVISION PLAN
Scientific Writing Language Centre, Wageningen University
ogy School of
nd Presenting a Scientific Paper
2003 1.5
Research Methodol Mansholt GraduateSocial Sciences (MG3S)
2003 2
Techniques for Writing a MG3S 2003 1
II. Mansholt-specific part Mansholt Introduction course MG3S 2003 1
IAMA2 (Montreux, Switzerland, June 12-15)
2005 1
razil,
I. Discipline-specific part
Mansholt Multidisciplinary Seminar(Presentation at EAAEPhD-day in September 2005)Presentations at international conferences
MG3S 2003 1
IFMA3 (Campinas, BAugust 14-19)
2004 1
II MG3S
Quantitative Methods NOBEM 4Summer School on Efficiencyand Productivity; Non-Parametric Course Supply Chain ManagemTheory and applicat
MG3S 2003 2
New Institutional EconomicsProperty right, contracts atransaction costs Multiple criteria analysis for agricultural decisi
MG3S 2004 2
Study Group Discussions Total (minimum 20 c
Wageni 2003 4
11 credit point represents 40 hou d Ag anagement As iation; Association; 4Netherlands Organization for Research i ness
rs; 2International Food an ribusiness M soc3International Farm Management n BusiEconomics and Management
Description of Course Institute / Department Year Credits1 I. General Part
163
Food-Safety Risk Analysis 2003 3 4 2003
ent: ions
MG3S 2004 2
: nd
ons MG3S 2005 2
ngen University -2007 redits) 27.5

164
PRINTER Grafisch Bedrijf Ponsen & Looijen B.V., Wageningen
COVER DESIGN Jos van Iwaarden Photo copyright by Fotolia (www.fotolia.com)