measuring student progress in grades 3-8 english language arts and · pdf file ·...
TRANSCRIPT

Measuring Student Progress
in Grades 3-8
English Language Arts
and Mathematics
August 22, 2017

ESSA, Equity and Assessments
• NY’s draft ESSA plan will be submitted to USDE in September
• State assessments remain an important part of our draft plan
o Provide us with important information about how students, schools and school districts are performing
o Identify where the gaps in achievement persist that must be addressed
• Tests are only one piece of the puzzle
• NY’s draft ESSA plan stresses the need to foster equity and fairness throughout the entire education system
2

ESSA, Equity and Assessments
• New York’s draft ESSA plan:
expands measures for school support and accountability,
and for student and school success
expands accountability measures beyond ELA and math
to include science and social studies, and the acquisition
of English proficiency by ELLs and MLLs
• We are committed to evolving the State’s accountability
system over time to add additional measures of school quality
and student success
3

Next Generation
Learning Standards
• Deliberate, inclusive and transparent approach to develop our Next
Generation Learning Standards
• The standards are rigorous and will prepare children for successful
lives in the 21st century
• Board of Regents to act on the revised standards in September
4

Next Generation Learning Standards &
Assessment Time Line
• The projected time line for standards and assessments over the coming
years is:
September 2017: Adoption of Next Generation Standards
2017-2018 School Year: Two-day assessments measuring the current
standards; professional development on Next Generation Standards;
2018-2019 School Year: Two-day assessments measuring the current
standards; professional development continuing on Next Generation
Standards;
2019-2020 School Year: Two-day assessments measuring the current
standards; professional development continuing on Next Generation
Standards;
September 2020: Full implementation of the Next Generation
Standards;
Spring 2021: New tests measuring Next Generation Standards.
5

Computer-Based Testing
• Spring 2017 is the first time the state offered operational
assessments on computers
• More than 28,000 students took operational tests by computer
• Overall, implementation of computer-based testing (CBT) went very
well for both ELA and math
• CBT will reduce the need for stand-alone field tests, help prepare
students for the 21st century and has the potential to make our
assessments even better instructional tools for students with
disabilities
6
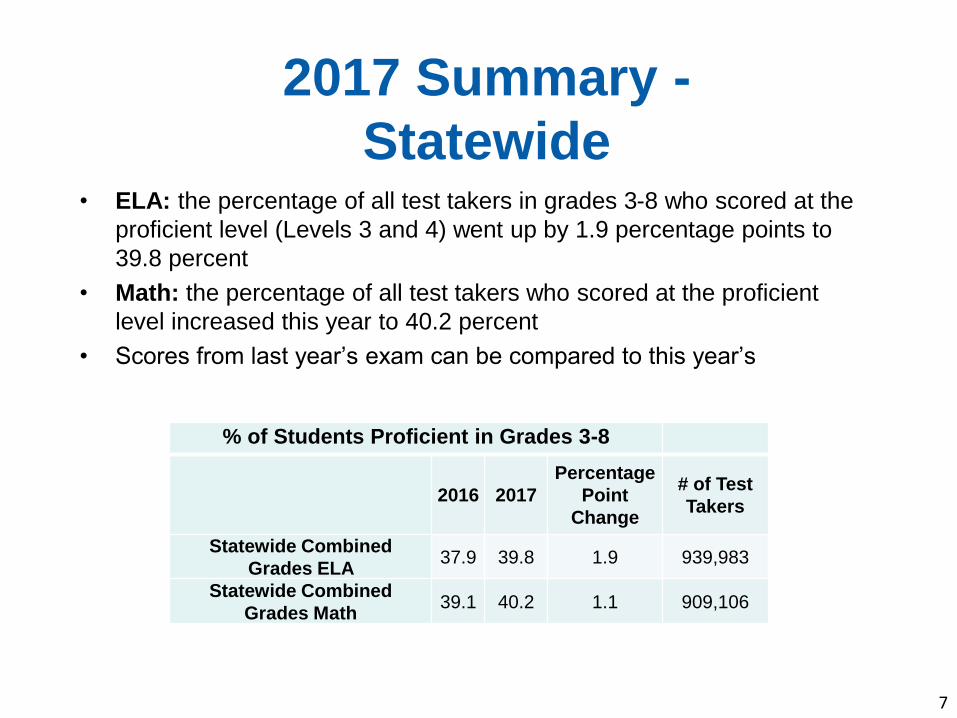
2017 Summary -
Statewide• ELA: the percentage of all test takers in grades 3-8 who scored at the
proficient level (Levels 3 and 4) went up by 1.9 percentage points to
39.8 percent
• Math: the percentage of all test takers who scored at the proficient
level increased this year to 40.2 percent
• Scores from last year’s exam can be compared to this year’s
% of Students Proficient in Grades 3-8
2016 2017
Percentage
Point
Change
# of Test
Takers
Statewide Combined
Grades ELA 37.9 39.8 1.9 939,983
Statewide Combined
Grades Math39.1 40.2 1.1 909,106
7

2017 Summary – NYC
The percentage of NYC students who scored at the proficient level
increased in both ELA and math and NYC now slightly exceeds the rest
of the State in proficiency in ELA.
% of Students Proficient in Grades 3-8
2016 2017Percentage
Point Change
Statewide Combined Grades
ELA 37.9 39.8 1.9
NYC Combined Grades ELA 38.0 40.6 2.6
Statewide Combined Grades
Math39.1 40.2 1.1
NYC Combined Grades Math 36.4 37.8 1.4
8
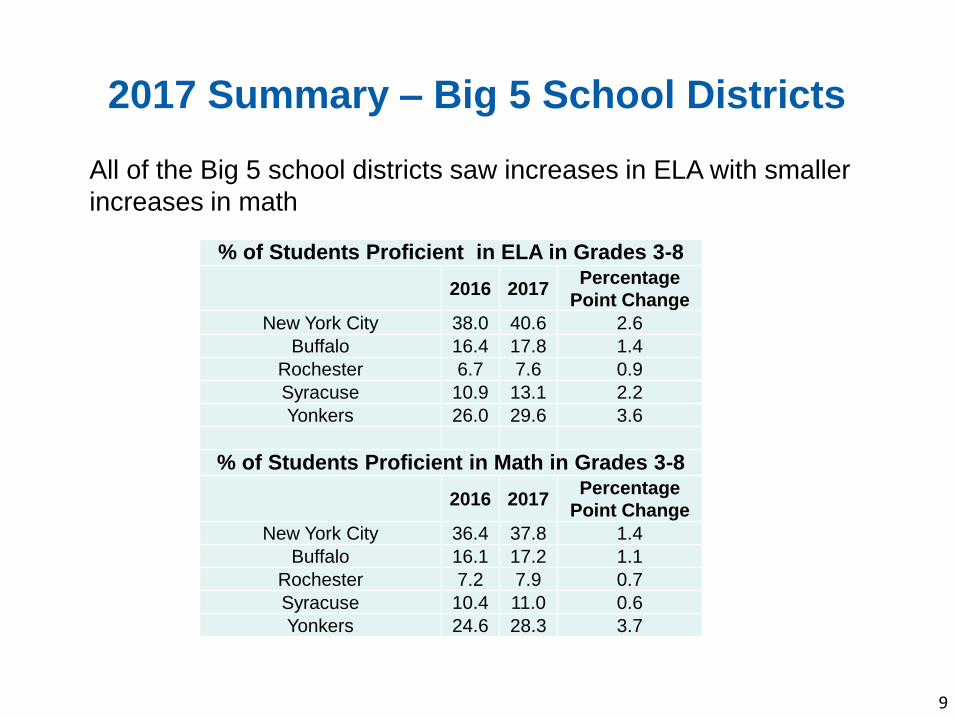
2017 Summary – Big 5 School Districts
All of the Big 5 school districts saw increases in ELA with smaller
increases in math
% of Students Proficient in ELA in Grades 3-8
2016 2017Percentage
Point Change
New York City 38.0 40.6 2.6
Buffalo 16.4 17.8 1.4
Rochester 6.7 7.6 0.9
Syracuse 10.9 13.1 2.2
Yonkers 26.0 29.6 3.6
% of Students Proficient in Math in Grades 3-8
2016 2017Percentage
Point Change
New York City 36.4 37.8 1.4
Buffalo 16.1 17.2 1.1
Rochester 7.2 7.9 0.7
Syracuse 10.4 11.0 0.6
Yonkers 24.6 28.3 3.7
9
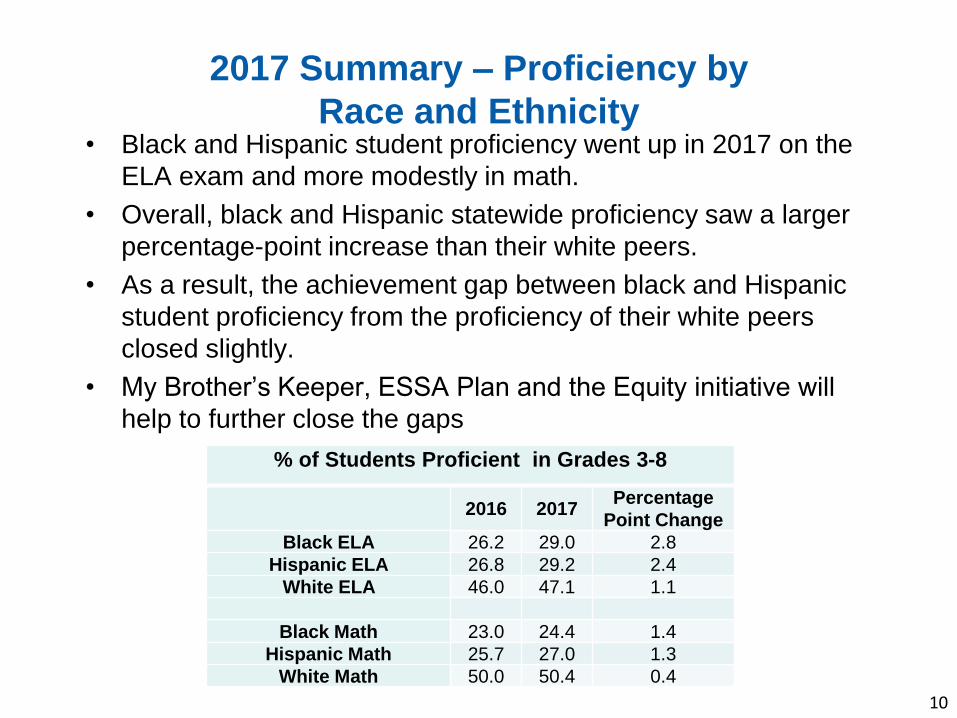
2017 Summary – Proficiency by
Race and Ethnicity• Black and Hispanic student proficiency went up in 2017 on the
ELA exam and more modestly in math.
• Overall, black and Hispanic statewide proficiency saw a larger
percentage-point increase than their white peers.
• As a result, the achievement gap between black and Hispanic
student proficiency from the proficiency of their white peers
closed slightly.
• My Brother’s Keeper, ESSA Plan and the Equity initiative will
help to further close the gaps
% of Students Proficient in Grades 3-8
2016 2017Percentage
Point Change
Black ELA 26.2 29.0 2.8
Hispanic ELA 26.8 29.2 2.4
White ELA 46.0 47.1 1.1
Black Math 23.0 24.4 1.4
Hispanic Math 25.7 27.0 1.3
White Math 50.0 50.4 0.4
10
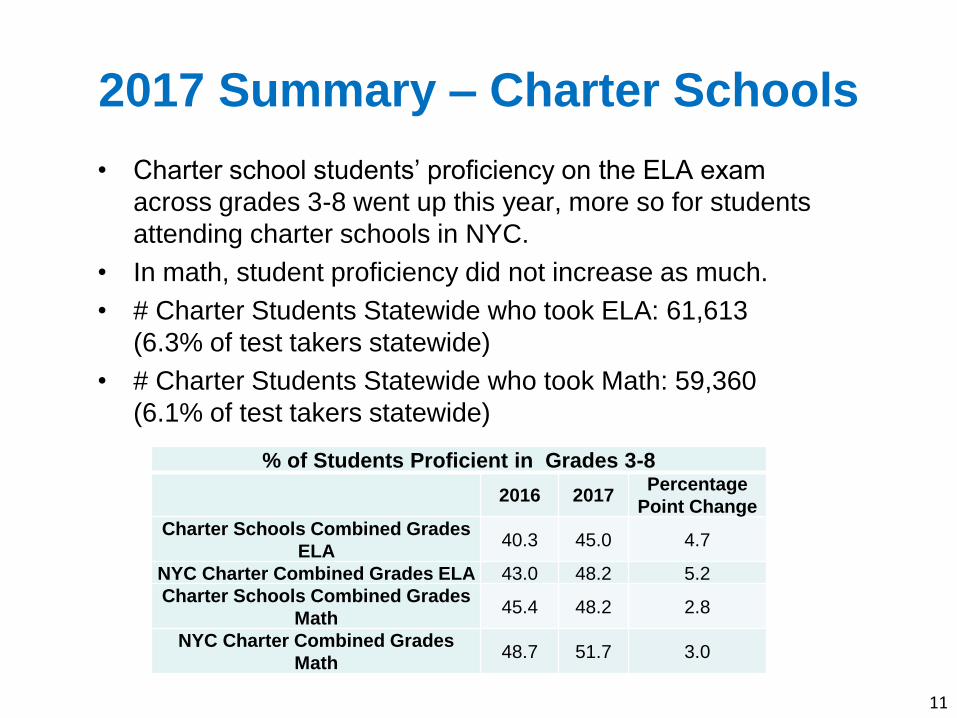
2017 Summary – Charter Schools
• Charter school students’ proficiency on the ELA exam
across grades 3-8 went up this year, more so for students
attending charter schools in NYC.
• In math, student proficiency did not increase as much.
• # Charter Students Statewide who took ELA: 61,613
(6.3% of test takers statewide)
• # Charter Students Statewide who took Math: 59,360
(6.1% of test takers statewide)
% of Students Proficient in Grades 3-8
2016 2017Percentage
Point Change
Charter Schools Combined Grades
ELA40.3 45.0 4.7
NYC Charter Combined Grades ELA 43.0 48.2 5.2
Charter Schools Combined Grades
Math45.4 48.2 2.8
NYC Charter Combined Grades
Math48.7 51.7 3.0
11

Test Refusal Rate Declined
• In 2017, the test refusal rate was approximately 19%
• That is a 2-percentage-point drop from 2016, when
the rate was approximately 21%
12
2017
Grades 3-8
ELA Test Results
13

62.9
%
31.6
%
69.2
%
32.4
%
64.1
%
29.0
%
72.6
%
28.0
%
64.5
%
28.4
%
72.0
%
34.2
%
67.5
%
30.6
%
62.9
% 69.1
%
32.7
%
64.7
%
29.8
%
69.4
%
30.6
%
62.2
%
29.2
%
70.5
%
34.7
%
66.4
%
31.3
%
73.3
%
41.9
%
75.6
%
40.8
%
63.8
%
33.5
%
72.6
%
34.4
%
71.7
%
35.5
%
76.3
%
40.9
%
72.2
%
37.9
%
72.2
%
42.9
%
75.9
%
41.2
%
67.2
%
35.4
%
70.9
%
32.4
%
78.3
%
41.9
%
45.5
%
73.7
%
31.0
%
39.8
%
78.8
%
2 &
above
3 &
above
2 &
above
3 &
above
2 &
above
3 &
above
2 &
above
3 &
above
2 &
above
3 &
above
2 &
above
3 &
above
2 &
above
3 &
above
2014201520162017
14
Grade 3 Grade 4 Grade 5 Grade 6 Grade 7 Combined
GradesGrade 8
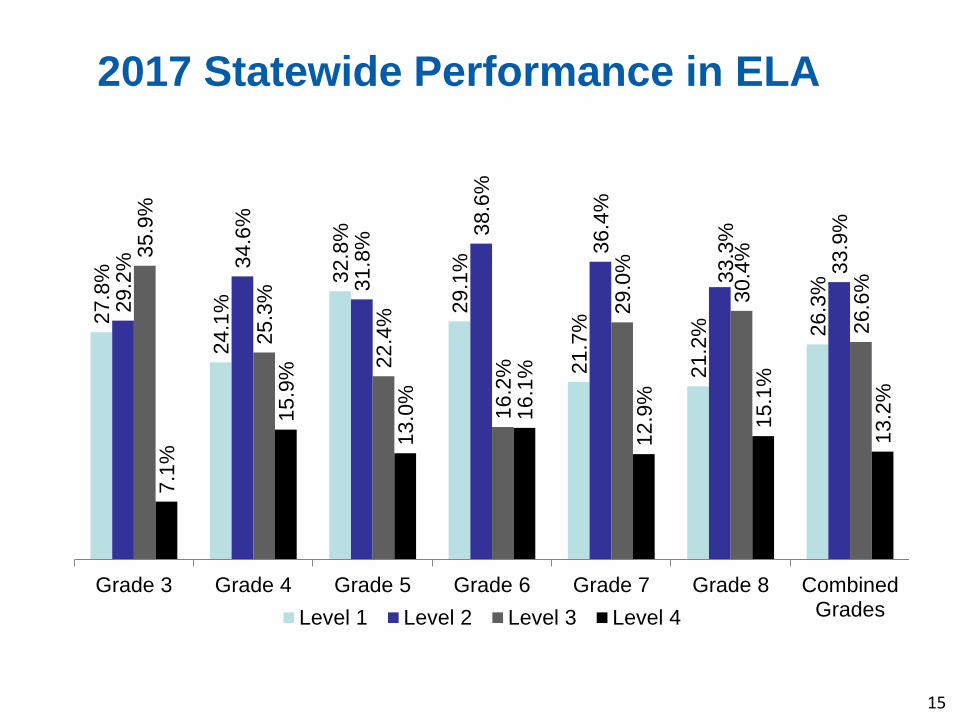
Students Statewide Made Gains in ELAThe percentage of students who met or exceeded the ELA proficiency standard (Levels 3 and 4)
increased to 39.8% in 2017 from 37.9% in 2016, an increase of 1.9 percentage points.
Percentage of All Test Takers Statewide in 2014, 2015, 2016, and 2017 who scored at Level 2 and Above and Level 3
and Above by Grade Level
15
27
.8%
24
.1%
32
.8%
29
.1%
21
.7%
21
.2% 2
6.3
%
29
.2% 3
4.6
%
31
.8%
38
.6%
36
.4%
33
.3%
33
.9%
35
.9%
25
.3%
22
.4%
16
.2%
29
.0%
30
.4%
26
.6%
7.1
%
15
.9%
13
.0%
16
.1%
12
.9%
15
.1%
13
.2%
Grade 3 Grade 4 Grade 5 Grade 6 Grade 7 Grade 8 CombinedGradesLevel 1 Level 2 Level 3 Level 4
2017 Statewide Performance in ELA
61.0
%
30.0
%
67.3
%
31.2
%
63.5
%
28.4
%
25.3
%
62.8
%
26.8
%
28.9
%
28.5
%
62.7
%
30.2
%
68.1
%
31.3
%
65.1
%
29.7
%
30.0
%
62.2
%
28.2
%
32.9
%
30.4
%
42.6
%
76.1
%
42.0
%
67.0
%
36.1
%
80.4
%
43.3
%
47.5
%
40.6
%
65.4
%
69.5
%
68.3
%
66.4
%
69.2
%
71.3
%76.4
%
41.4
%
72.7
%
40.9
%
64.1
%
34.1
%
72.8
%
34.7
%
73.7
%
36.0
%
77.9
%
40.5
%
72.9
%
38.0
%
71.2
%
69.7
%
32.3
%
81.2
%
74.2
%
2 &
above
3 &
above
2 &
above
3 &
above
2 &
above
3 &
above
2 &
above
3 &
above
2 &
above
3 &
above
2 &
above
3 &
above
2 &
above
3 &
above
2014201520162017
16
Grade 3 Grade 4 Grade 5 Grade 6 Grade 7 Combined
Grades
NYC
Grade 8
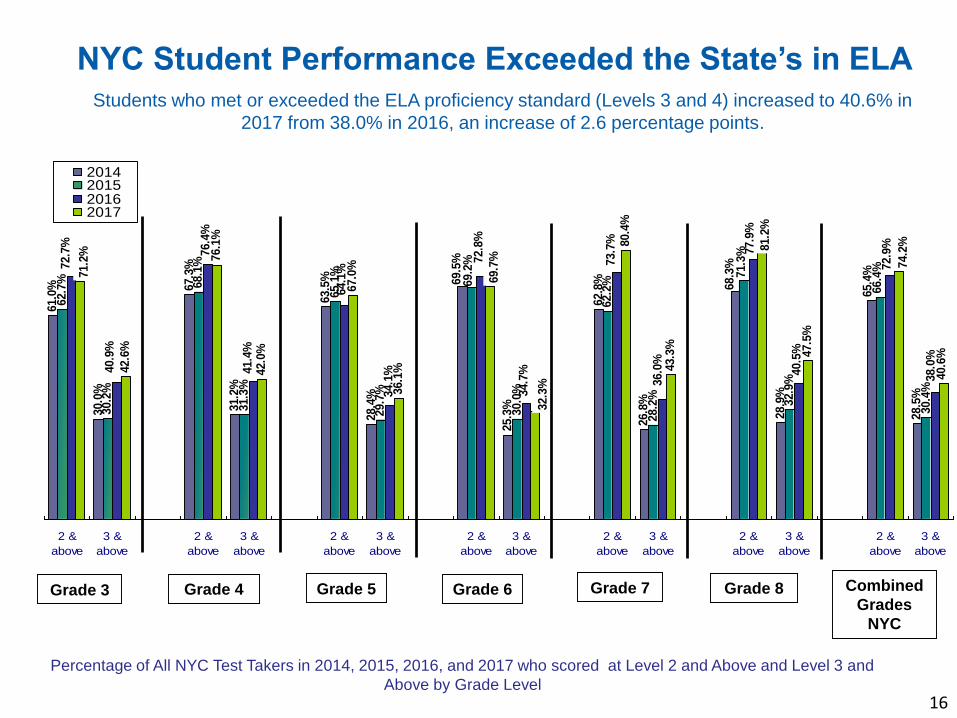
NYC Student Performance Exceeded the State’s in ELA
Percentage of All NYC Test Takers in 2014, 2015, 2016, and 2017 who scored at Level 2 and Above and Level 3 and
Above by Grade Level
Students who met or exceeded the ELA proficiency standard (Levels 3 and 4) increased to 40.6% in
2017 from 38.0% in 2016, an increase of 2.6 percentage points.

2017 NYC Performance in ELA
17
28
.8%
23
.9%
33
.0%
30
.3%
19
.6%
18
.8%
25
.8%
28
.7% 3
4.1
%
30
.9% 3
7.4
%
37
.1%
33
.7%
33
.6%
34
.0%
24
.4%
21
.7%
15
.1%
28
.5%
30
.5%
25
.7%
8.6
%
17
.6%
14
.4%
17
.2%
14
.8%
17
.0%
14
.9%
Grade 3 Grade 4 Grade 5 Grade 6 Grade 7 Grade 8 CombinedGrades
NYCLevel 1 Level 2 Level 3 Level 4

65.4
%
28.5
%
39.0
%
11.9
%
28.6
%
5.5
%
31.6
%
8.5
%
55.5
%
18.6
%
67.5
%
30.6
%
66.4
%
30.4
% 36.7
%
11.9
%
24.3
%
4.7
%
29.1
%
8.1
%
55.3
%
20.3
%
66.4
%
31.3
%
72.9
%
38.0
% 44.2
%
16.4
%
30.5
%
6.7
%
33.9
%
10.9
%
62.1
%
26.0
%
72.2
%
37.9
%
74.2
%
40.6
% 45.7
%
17.8
%
32.3
%
7.6
%
36.7
%
13.1
%
65.7
%
29.6
%
73.7
%
39.8
%
2 &
above
3 &
above
2 &
above
3 &
above
2 &
above
3 &
above
2 &
above
3 &
above
2 &
above
3 &
above
2 &
above
3 &
above
2014201520162017
18
YonkersBuffalo Total PublicSyracuseRochesterNYC
Big 5 City District Performance in ELAELA performance increased in each Big 5 City School District
Percentage of All Test Takers in 2014, 2015, 2016, and 2017 who scored at Level 2 and Above and Level 3 and
Above by Combined Grades

28.5
%
11.2
%
16.2
% 21.9
%
33.2
%
49.1
%
26.1
%
30.6
%
30.4
%
11.5
%
16.0
% 22.4
%
34.1
%
52.2
%
27.5
%
31.3
%38.0
%
15.4
% 21.2
% 27.3
%
39.4
%
58.9
%
40.3
%
37.9
%
40.6
%
17.5
% 23.2
%
28.0
%
40.1
%
60.1
%
45.0
%
39.8
%
NYC Large City Urban-
Suburban
Rural Average Low Charter Total Public
2014
2015
2016
2017
19
Statewide Performance in ELA by
Need/Resource GroupELA performance increased for all Need/Resource Groups, with low-need districts continuing to outperform
other groups but had less growth than large city and urban suburban districts. In addition, Charter Schools
demonstrated the most gain and NYC now slightly exceeds the performance of public schools statewide.
Percentage of All Test Takers in 2014, 2015, 2016, and 2017 who scored at Level 3 and Above
by Combined Grades
High Need Districts
82.4
%
50.4
%
54.4
%
17.4
%
57.2
%
18.5
%
59.9
%
22.0
%
75.5
%
38.5
%
83.2
%
52.5
%
54.3
%
18.5
%
57.3
%
19.7
%
60.4
%
23.8
%
74.7
%
40.4
%
86.2
%
59.0
%
62.9
%
26.2
%
64.5
%
26.8
%
66.8
%
29.9
%
78.6
%
46.0
%
86.6
%
60.8
%
65.0
%
29.0
%
66.2
%
29.2
%
68.8
%
32.7
%
80.1
%
47.1
%
2 &
above
3 &
above
2 &
above
3 &
above
2 &
above
3 &
above
2 &
above
3 &
above
2 &
above
3 &
above
2014201520162017
American
Indian/Alaska
Native
Asian/Pacific
IslanderHispanicBlack White
20
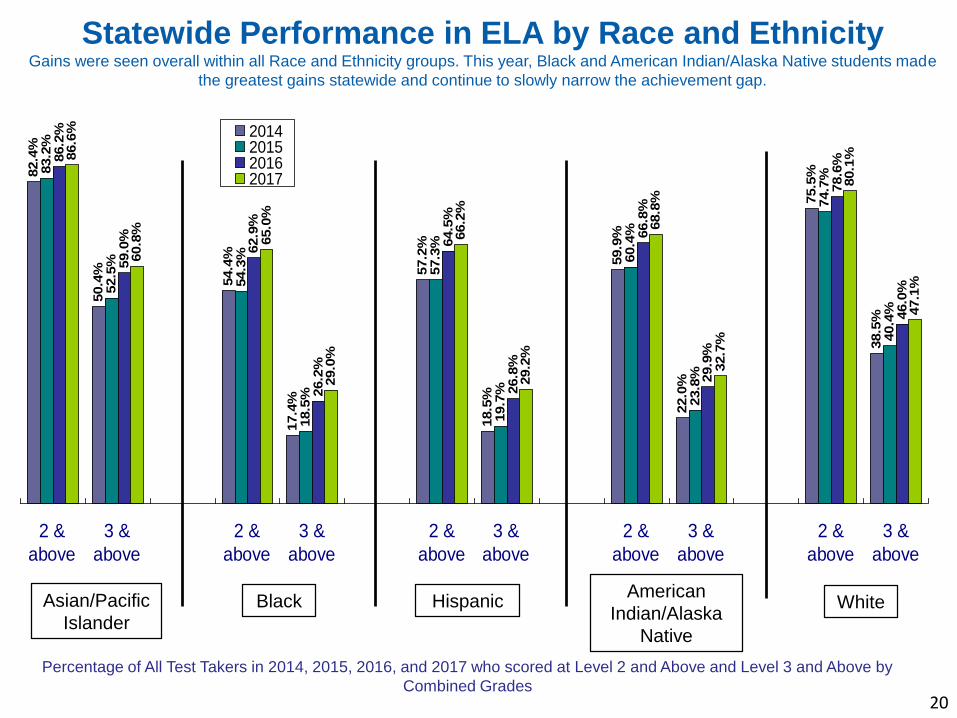
Statewide Performance in ELA by Race and EthnicityGains were seen overall within all Race and Ethnicity groups. This year, Black and American Indian/Alaska Native students made
the greatest gains statewide and continue to slowly narrow the achievement gap.
Percentage of All Test Takers in 2014, 2015, 2016, and 2017 who scored at Level 2 and Above and Level 3 and Above by
Combined Grades

82.0
%
49.2
% 56.6
%
18.1
%
57.4
%
18.3
%
65.7
%
26.7
%
82.6
%
49.5
%
83.3
%
52.0
%
57.0
%
19.0
%
58.4
%
19.8
%
66.9
%
28.7
%
82.8
%
51.3
%
86.5
%
58.8
% 65.7
%
26.6
%
65.8
%
27.2
%
72.3
%
34.9
%
86.3
%
58.9
%
86.9
%
61.0
% 67.1
%
28.9
%
67.2
%
29.7
%
73.6
%
37.4
%
87.2
%
61.0
%
2 &
above
3 &
above
2 &
above
3 &
above
2 &
above
3 &
above
2 &
above
3 &
above
2 &
above
3 &
above
2014201520162017
American
Indian/Alaska Native
Asian/Pacific
Islander
HispanicBlack White
NYC Performance in ELA by Race and Ethnicity
Percentage of All Test Takers in 2014, 2015, 2016, and 2017 who scored at Level 2 and Above and Level 3 and
Above by Combined Grades
NYC’s performance by Race and Ethnicity parallels statewide public school
performance with proficiency gains in all Race and Ethnicity groups.
21

72.6
%
35.1
%
62.7
%
26.3
%
72.1
%
36.4
%
61.0
%
26.5
%
77.8
%
43.9
%
66.8
%
32.2
%
79.1
%
46.0
%
68.6
%
33.9
%
2 & above 3 & above 2 & above 3 & above
2014 20152016 2017
Females Males
Girls Continued to Outperform Boys
Statewide in ELA in 2017
Percentage of All Test Takers Scoring at Level 2 and Above and Level 3 and Above for 2014, 2015, 2016, and 2017 Combined
Grades by Gender22

89.8
%
66.6
% 71.9
%
35.2
%
72.5
%
34.8
%
74.4
%
39.1
%
84.8
%
54.0
%
83.6
%
55.3
%
58.3
%
22.8
%
60.2
%
23.9
%
63.4
%
26.8
%
75.7
%
40.6
%
2 &
above
3 &
above
2 &
above
3 &
above
2 &
above
3 &
above
2 &
above
3 &
above
2 &
above
3 &
above
Females
Males
American
Indian/Alaska
Native
Asian/
Pacific
Islander
HispanicBlack White
Across all Race and Ethnicity groups, girls continued
to perform better than boys in ELA statewide
Percentage of All Test Takers Scoring at Level 2 and Above and Level 3 and Above for 2017 by
Gender and Race and Ethnicity23
24
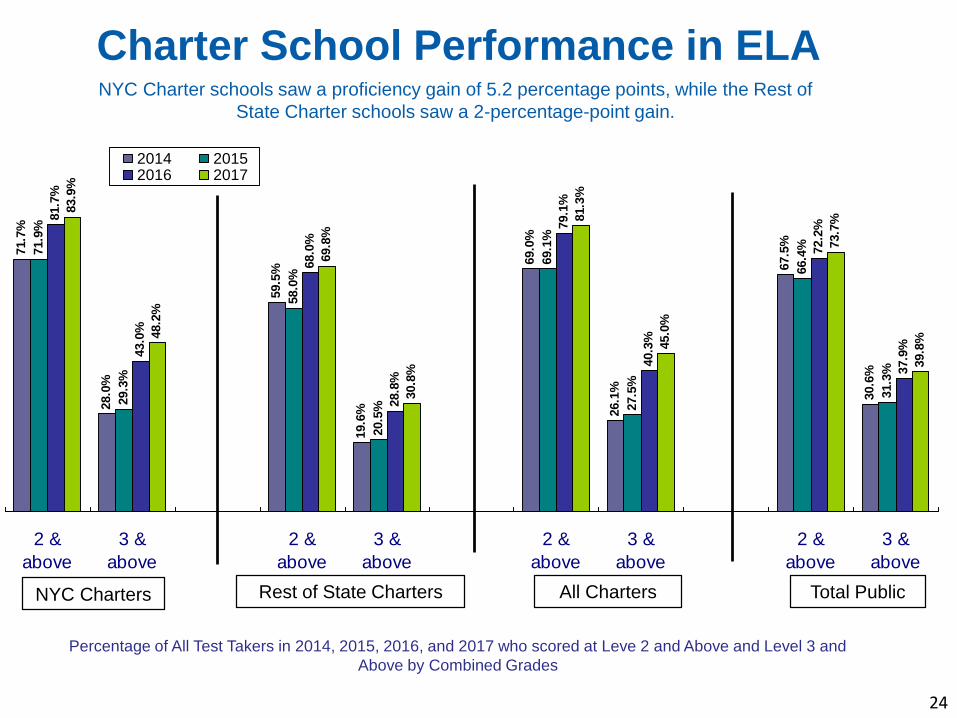
Charter School Performance in ELA71.7
%
28.0
%
59.5
%
19.6
%
69.0
%
26.1
%
67.5
%
30.6
%
71.9
%
29.3
%
58.0
%
20.5
%
69.1
%
27.5
%
66.4
%
31.3
%
81.7
%
43.0
%
68.0
%
28.8
%
79.1
%
40.3
%
72.2
%
37.9
%
83.9
%
48.2
%
69.8
%
30.8
%
81.3
%
45.0
%
73.7
%
39.8
%
2 &
above
3 &
above
2 &
above
3 &
above
2 &
above
3 &
above
2 &
above
3 &
above
2014 20152016 2017
Total PublicNYC Charters All ChartersRest of State Charters
Percentage of All Test Takers in 2014, 2015, 2016, and 2017 who scored at Leve 2 and Above and Level 3 and
Above by Combined Grades
NYC Charter schools saw a proficiency gain of 5.2 percentage points, while the Rest of
State Charter schools saw a 2-percentage-point gain.

Never ELLs3Current ELLs1 Ever ELLs2 Total Public
1Students identified as ELL during the reported year. 2Students identified as ELL any year prior to the reported year but not including the reported year.3Students never reported to have received ELL services.
Statewide English Language Learner
Performance in ELAELL students statewide continued to make gains in ELA. Ever ELLs have experienced a proficiency increase
of 5.5 percentage points. When compared to the total public student population a higher percentage of Ever
ELLs score at or above proficient.
25
24.5
%
3.3
%
74.6
%
27.8
%
70.1
%
33.0
%
67.5
%
30.6
%
25.1
%
3.9
%
75.1
%
30.5
%
69.1
%
33.9
%
66.4
%
31.3
%
28.5
%
4.0
%
82.6
%
39.7
%
74.9
%
40.8
%
72.2
%
37.9
%
32.4
%
5.2
%
85.8
%
45.2
%
76.4
%
42.6
%
73.7
%
39.8
%
2 &
above
3 &
above
2 &
above
3 &
above
2 &
above
3 &
above
2 &
above
3 &
above
2014
2015
2016
2017

26.4
%
3.6
%
77.8
%
31.1
%
69.1
%
32.0
%
67.5
%
30.6
%
27.4
%
4.4
%
78.8
%
34.2
%
70.1
%
33.8
%
66.4
%
31.3
%
30.9
%
4.4
%
85.5
%
43.2
%
76.7
%
42.1
%
72.2
%
37.9
%
34.6
%
5.6
%
88.4
%
49.1
%
77.9
%
44.7
%
73.7
%
39.8
%
2 &
above
3 &
above
2 &
above
3 &
above
2 &
above
3 &
above
2 &
above
3 &
above
2014201520162017
Never ELLs3Current ELLs1 Ever ELLs2 Total Public
1Students identified as ELL during the reported year. 2Students identified as ELL any year prior to the reported year but not including the reported year.3Students never reported to have received ELL services.
NYC English Language Learners
Performance in ELA
26

27.8
%
5.2
%
75.4
%
35.6
%
28.3
%
5.7
%
74.4
%
36.6
%
7.9
%
80.1
%
44.1
%
38.6
%
9.3
%
80.9
%
46.0
%
33.8
%
2 & above Students with
Disabilities
3 & above Students with
Disabilities
2 & above General
Education
3 & above General
Education
2014 2015 2016 2017
Students with Disabilities Performance in ELA9.3% of students with disabilities met or exceeded the ELA proficiency standard (Levels 3 and 4) in 2017,
and the percentage of students scoring at Level 2 and above rose to 38.6%.
27

2017
Grades 3-8
Math Test Results
28

A USED waiver eliminated unnecessary double testing and allowed accelerated math students to participate in high school math
Regents Exams instead of the Grade 8 Math Test, which may cause a decrease in the percentage proficient in Grade 8 as
compared to other grades.
73.1
%
42.2
%
73.3
%
41.8
%
67.9
%
39.3
%
72.6
%
37.2
%
64.6
%
32.0
%
62.6
%
21.5
%
69.3
%
36.2
%
72.1
%
42.0
%
73.0
%
43.1
%
69.2
%
42.7
%
71.6
%
38.9
%
66.4
%
34.8
%
60.3
%
21.9
%
69.3
%
38.1
%
74.8
%
44.1
%
72.5
%
44.7
%
68.0
%
40.1
%
74.1
%
40.1
%
66.3
%
35.9
%
60.1
%
23.8
%
69.9
%
39.1
%
67
.0%
58
.5%
69
.5%
40
.2%
75
.3%
48
.4%
73
.2%
43
.0%
67
.9%
43
.1%
39
.8%
37
.7%
21
.6%
70
.1%
2 &
above
3 &
above
2 &
above
3 &
above
2 &
above
3 &
above
2 &
above
3 &
above
2 &
above
3 &
above
2 &
above
3 &
above
2 &
above
3 &
above
2014 2015
2016 2017
29
Grade 3 Grade 4 Grade 5 Grade 6 Grade 7 Combined
Grades
Grade 8
The Percentage of All Test Takers Statewide in 2014, 2015, 2016, and 2017 who scored at Level 2 and
Above and Level 3 and Above by Grade Level
Students Statewide Made Progress in MathStudents who met or exceeded the proficiency standard (Levels 3 and 4) increased to 40.2% in 2017 from
39.1% in 2016, a gain of 1.1 percentage points.
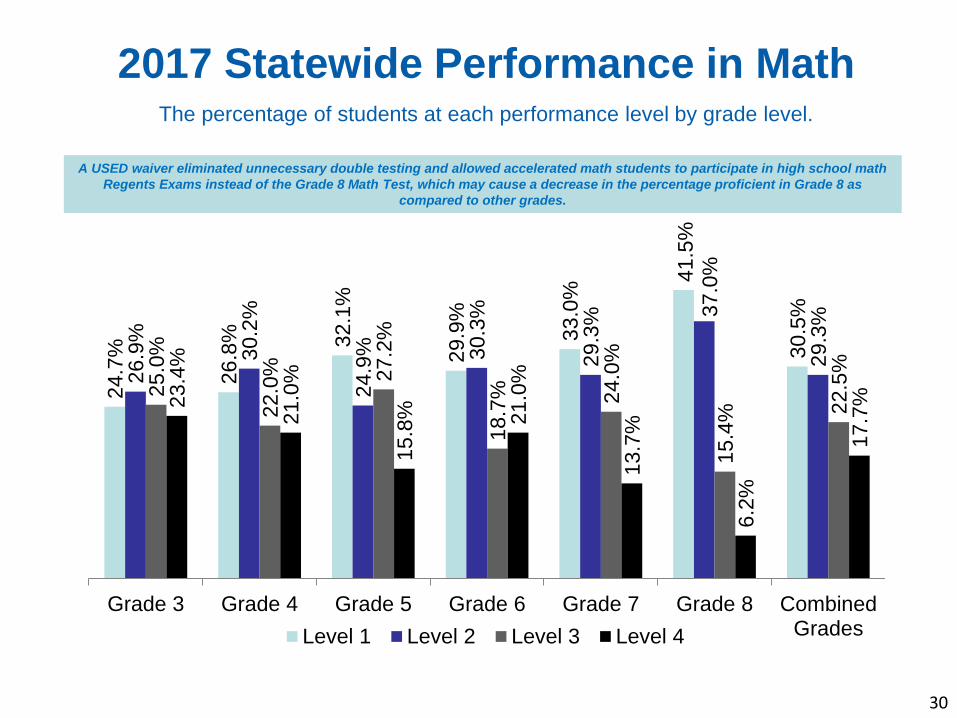
2017 Statewide Performance in MathThe percentage of students at each performance level by grade level.
30
24
.7%
26
.8% 32
.1%
29
.9%
33
.0%
41
.5%
30
.5%
26
.9%
30
.2%
24
.9% 30
.3%
29
.3% 3
7.0
%
29
.3%
25
.0%
22
.0% 27
.2%
18
.7% 24
.0%
15
.4% 2
2.5
%
23
.4%
21
.0%
15
.8% 21
.0%
13
.7%
6.2
%
17
.7%
Grade 3 Grade 4 Grade 5 Grade 6 Grade 7 Grade 8 CombinedGradesLevel 1 Level 2 Level 3 Level 4
A USED waiver eliminated unnecessary double testing and allowed accelerated math students to participate in high school math
Regents Exams instead of the Grade 8 Math Test, which may cause a decrease in the percentage proficient in Grade 8 as
compared to other grades.

70.1
%
38.7
%
70.7
%
40.0
%
66.9
%
38.8
%
67.6
%
33.8
%
60.2
%
29.7
%
60.5
%
22.8
%
66.2
%
34.3
%
69.7
%
38.5
%
69.9
%
39.1
%
68.0
%
40.9
%
67.7
%
35.5
%
63.4
%
32.5
%
59.0
%
22.5
%
66.5
%
35.2
%
72.8
%
41.0
%
69.3
%
41.4
%
66.0
%
37.5
%
71.0
%
36.9
%
63.4
%
34.0
%
59.4
%
25.0
%
67.3
%
36.4
%
73.7
%
46.0
%
70.4
%
40.0
%
65.3
%
40.8
%
65.7
%
36.1
%
64.2
%
35.9
%
59.1
%
24.2
%
66.8
%
37.8
%
2 &
above
3 &
above
2 &
above
3 &
above
2 &
above
3 &
above
2 &
above
3 &
above
2 &
above
3 &
above
2 &
above
3 &
above
2 &
above
3 &
above
2014 2015
2016 2017
31
Grade 3 Grade 4 Grade 5 Grade 6 Grade 7 Combined
Grades
NYC
Grade 8
NYC Students Made Progress in Math
Percentage of All NYC Test Takers in 2014, 2015, 2016, and 2017 who scored at Level 2 and
Above and Level 3 and Above by Grade Level
A USED waiver eliminated unnecessary double testing and allowed accelerated math students to participate in high school math
Regents Exams instead of the Grade 8 Math Test, which may cause a decrease in the percentage proficient in Grade 8 as
compared to other grades.
Students who met or exceeded the proficiency standard (Levels 3 and 4)
increased to 37.8% in 2017 from 36.4% in 2016, a gain of 1.4 percentage points.

2017 NYC Performance in Math
32
26
.3%
29
.6% 34
.7%
34
.3%
35
.8% 40
.9%
33
.2%
27
.8%
30
.4%
24
.5% 29
.6%
28
.3% 3
4.8
%
29
.0%
23
.2%
19
.4% 24
.3%
15
.8% 20
.3%
15
.6%
19
.9%
22
.8%
20
.7%
16
.5%
20
.4%
15
.6%
8.6
%
17
.8%
Grade 3 Grade 4 Grade 5 Grade 6 Grade 7 Grade 8 CombinedGrades
NYCLevel 1 Level 2 Level 3 Level 4
A USED waiver eliminated unnecessary double testing and allowed accelerated math students to participate in high school math
Regents Exams instead of the Grade 8 Math Test, which may cause a decrease in the percentage proficient in Grade 8 as
compared to other grades.

66.2
%
34.3
% 39.2
%
13.1
%
29.3
%
7.2
%
27.8
%
8.3
%
54.0
%
21.8
%
69.3
%
36.2
%
66.5
%
35.2
% 40.1
%
15.1
%
28.7
%
7.4
%
28.3
%
9.4
%
54.7
%
24.0
%
69.3
%
38.1
%
67.3
%
36.4
% 41.7
%
16.1
%
27.7
%
7.2
%
29.9
%
10.4
%
55.6
%
24.6
%
69.9
%
39.1
%
66.8
%
37.8
%
41.2
%
17.2
%
27.6
%
7.9
%
29.9
%
11.0
%
58.6
%
28.3
%
69.5
%
40.2
%
2 &
above
3 &
above
2 &
above
3 &
above
2 &
above
3 &
above
2 &
above
3 &
above
2 &
above
3 &
above
2 &
above
3 &
above
2014201520162017
33
YonkersBuffalo Total PublicSyracuseRochesterNYC
Big 5 City District Performance in MathAll Big 5 city districts had increases in the percentage of students scoring at Proficiency (Levels 3 and Above)
in 2017.
Percentage of All Test Takers in 2014, 2015, 2016, and 2017 who scored at Level 2 and Above and Level 3
and Above by Combined Grades

34.3
%
12.8
%
17.9
% 25.6
%
38.9
%
57.7
%
40.8
%
36.2
%
35.2
%
14.5
%
19.6
%
30.5
%
43.4
%
63.3
%
41.5
%
38.1
%
36.4
%
15.1
% 21.0
%
30.9
%
43.8
%
64.5
%
45.4
%
39.1
%
37.8
%
16.7
% 22.4
%
31.4
%
44.2
%
64.6
%
48.2
%
40.2
%
NYC Large City Urban-
Suburban
Rural Average Low Charter Total Public
2014201520162017
34
Statewide Performance in Math by
Need/Resource Group
In 2017, all Need/Resource Groups made progress in math, with low-need districts continuing to outperform
other groups. Charter schools saw the largest gain of 2.8 percentage points.
Percentage of All Test Takers in 2014, 2015, 2016, and 2017 who scored at Level 3 and Above by Combined Grades
High Need Districts
35
87.8
%
64.7
%
52.6
%
19.8
%
58.5
%
23.4
%
62.2
%
27.6
%
78.8
%
44.8
%
88.2
%
66.0
%
53.4
%
21.3
%
58.8
%
24.5
%
64.4
%
30.7
%
80.6
%
49.7
%
88.2
%
66.5
%
54.7
%
23.0
%
59.8
%
25.7
%
62.8
%
29.5
%
80.6
%
50.0
%
87.8
%
67.2
%
54.4
%
24.4
%
59.1
%
27.0
%
62.3
%
31.3
%
79.9
%
50.4
%
2 &
above
3 &
above
2 &
above
3 &
above
2 &
above
3 &
above
2 &
above
3 &
above
2 &
above
3 &
above
2014201520162017
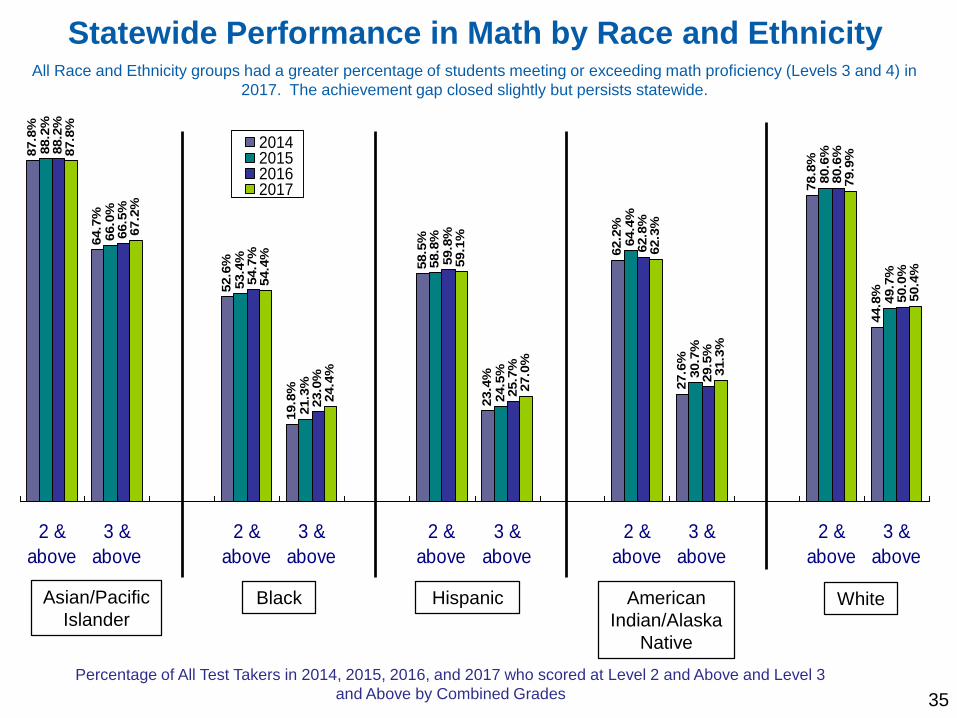
Statewide Performance in Math by Race and EthnicityAll Race and Ethnicity groups had a greater percentage of students meeting or exceeding math proficiency (Levels 3 and 4) in
2017. The achievement gap closed slightly but persists statewide.
American
Indian/Alaska
Native
Asian/Pacific
IslanderHispanicBlack White
Percentage of All Test Takers in 2014, 2015, 2016, and 2017 who scored at Level 2 and Above and Level 3
and Above by Combined Grades
36
88.9
%
66.0
%
52.6
%
18.6
%
58.6
%
23.2
%
67.3
%
34.4
%
84.4
%
56.0
%
89.2
%
66.8
%
52.5
%
19.1
%
58.8
%
23.7
%
67.2
%
34.3
%
84.5
%
56.7
%
89.0
%
67.2
%
53.5
%
20.0
%
59.3
%
24.3
%
65.3
%
32.2
%
84.4
%
57.8
%
88.5
%
67.8
%
52.6
%
20.7
%
58.1
%
25.3
%
63.8
%
33.1
%
84.2
%
59.0
%
2 &
above
3 &
above
2 &
above
3 &
above
2 &
above
3 &
above
2 &
above
3 &
above
2 &
above
3 &
above
2014201520162017
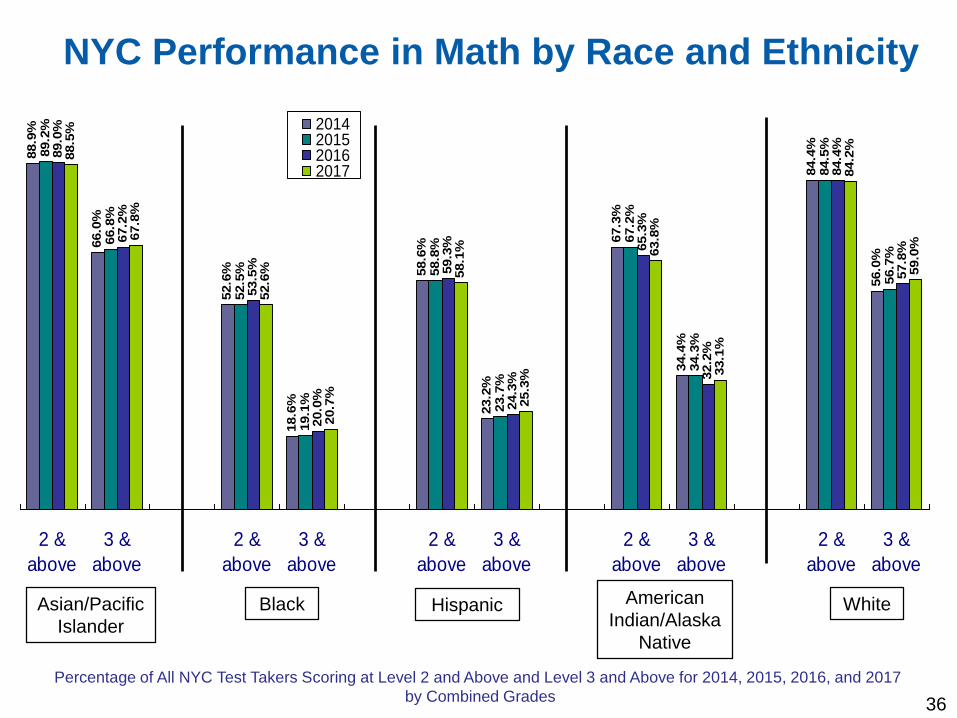
American
Indian/Alaska
Native
Asian/Pacific
IslanderHispanicBlack White
NYC Performance in Math by Race and Ethnicity
Percentage of All NYC Test Takers Scoring at Level 2 and Above and Level 3 and Above for 2014, 2015, 2016, and 2017
by Combined Grades

Percentage of All Test Takers Scoring at Level 2 and Above and Level 3 and Above for 2014, 2015, 2016, and 2017
by Combined Grades by Gender
70.7
%
36.7
%
67.8
%
35.8
%
70.9
%
38.7
%
67.8
%
37.5
%
71.6
%
39.6
%
68.4
%
38.6
%
71.1
%
40.7
%
67.9
%
39.7
%
2 & above 3 & above 2 & above 3 & above
2014 20152016 2017
37
Females Males
Girls Continued to Outperform Boys
Statewide in Math in 2017

Percentage of All Test Takers Scoring at Level 2 and Above and Level 3 and Above for 2017 by Gender and Race and Ethnicity
88.7
%
67.7
%
57.8
%
26.2
%
60.7
%
27.3
%
64.8
%
32.1
%
81.1
%
50.7
%
87.0
%
66.7
%
51.2
%
22.6
%
57.6
%
26.7
%
60.1
%
30.5
%
78.7
%
50.1
%
2 &
above
3 &
above
2 &
above
3 &
above
2 &
above
3 &
above
2 &
above
3 &
above
2 &
above
3 &
above
Females
Males
38
American
Indian/Alaska
Native
Asian/
Pacific
Islander
HispanicBlack White
Across all Race and Ethnicity groups, girls
performed better than boys in math statewide
39
78.6
%
43.9
%
68.4
%
30.4
%
76.4
%
40.8
%
69.3
%
36.2
%
77.8
%
44.2
%
66.7
%
30.2
%
75.6
%
41.5
%
69.3
%
38.1
%
80.0
%
48.7
%
65.2
%
30.9
%
77.3
%
45.4
%
69.9
%
39.1
%
80.4
%
51.7
%
65.2
%
32.4
%
77.7
%
48.2
%
69.5
%
40.2
%
2 &
above
3 &
above
2 &
above
3 &
above
2 &
above
3 &
above
2 &
above
3 &
above
2014 2015 2016 2017
Total PublicNYC Charters All ChartersRest of State Charters
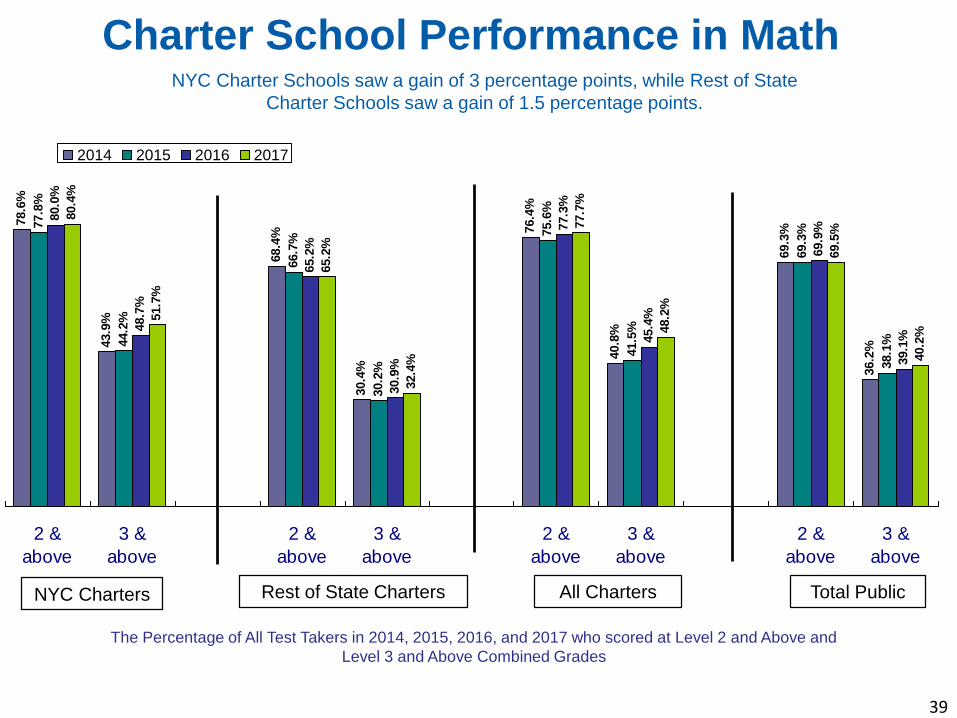
Charter School Performance in Math
The Percentage of All Test Takers in 2014, 2015, 2016, and 2017 who scored at Level 2 and Above and
Level 3 and Above Combined Grades
NYC Charter Schools saw a gain of 3 percentage points, while Rest of State
Charter Schools saw a gain of 1.5 percentage points.

37.3
%
12.1
%
70.3
%
35.6
%
72.5
%
39.1
%
69.3
%
36.2
%
37.4
%
12.7
%
76.9
%
40.6
%
72.0
%
40.7
%
69.3
%
38.1
%
37.5
%
11.5
%
78.5
%
43.6
%
72.5
%
41.7
%
69.9
%
39.1
%
38.5
%
13.2
%
79.3
%
46.8
%
72.1
%
42.7
%
69.5
%
40.2
%
2 &
above
3 &
above
2 &
above
3 &
above
2 &
above
3 &
above
2 &
above
3 &
above
2014201520162017
Never ELLs3Current ELLs1 Ever ELLs2
Total Public
1Students identified as ELL during the reported year. 2Students identified as ELL any year prior to the reported year but not including the reported year.3Students never reported to have received ELL services.
Statewide English Language Learner
Performance in Math
40

Never ELLs3Current ELLs1 Ever ELLs2 Total Public
1Students identified as ELL during the reported year. 2Students identified as ELL any year prior to the reported year but not including the reported year.3Students never reported to have received ELL services.
NYC English Language Learner
Performance in Math
41
41.2
%
14.0
%
71.5
%
38.1
%
69.5
%
37.3
%
69.3
%
36.2
%
41.3
%
14.6
%
79.8
%
44.3
%
68.6
%
37.3
%
69.3
%
38.1
%
40.6
%
13.0
%
80.7
%
46.8
%
69.5
%
38.7
%
69.9
%
39.1
%
41.4
%
14.7
%
80.9
%
49.7
%
69.1
%
40.1
%
69.5
%
40.2
%
2 &
above
3 &
above
2 &
above
3 &
above
2 &
above
3 &
above
2 &
above
3 &
above
2014201520162017
42
33.7
%
9.6
%
76.4
%
41.6
%
34.3
%
10.6
%
76.6
%
43.9
%
35.3
%
10.9
%
77.2
%
45.0
%
34.6
%
11.4
%
76.6
%
46.0
%
2 & above Students with
Disabilities
3 & above Students with
Disabilities
2 & above General
Education
3 & above General
Education
2014 2015 2016 2017
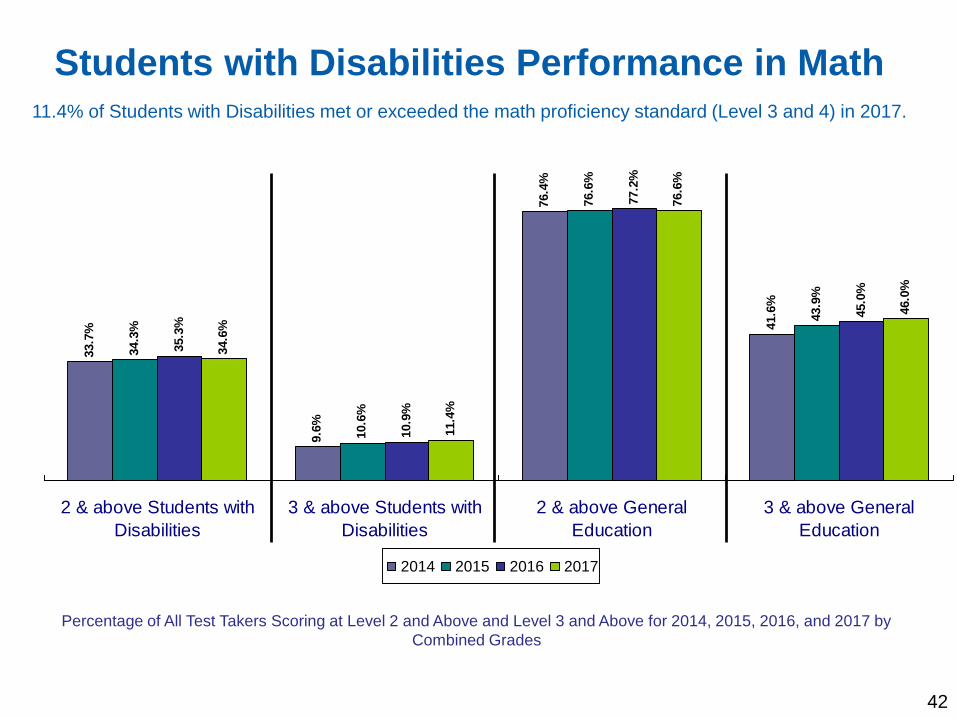
Students with Disabilities Performance in Math11.4% of Students with Disabilities met or exceeded the math proficiency standard (Level 3 and 4) in 2017.
Percentage of All Test Takers Scoring at Level 2 and Above and Level 3 and Above for 2014, 2015, 2016, and 2017 by
Combined Grades

2017
Test Refusal Data
43

Not Tested/Test Refusal Data
on 3-8 ELA and Math Assessments
• The test refusal rate is down 2 percentage points from
2016
• In 2015 the “not tested” rate was 20%
44
2015
Not Tested
2016
Test
Refusal
2017
Test
Refusal
20% 21% 19%

Test Refusal Data
45
• Proportionally, students who refused to test in 2017
were:
• Much more likely to be white
• Much more likely to be from a low-need or average-
need district
• Less likely to be economically disadvantaged
• Much less likely to be an English Language Learner
5.4% 6.4%
1.4% 2.1%
8.3% 8.9%
5.4% 5.8%
51.8% 51.1%
27.4%25.3%
0.3% 0.4%
ELA Math ELA Math ELA Math ELA Math ELA Math ELA Math ELA Math
New York City Big 4 Cities High NeedUrban/Suburban
High Need Rural Average Need Low Need Charter
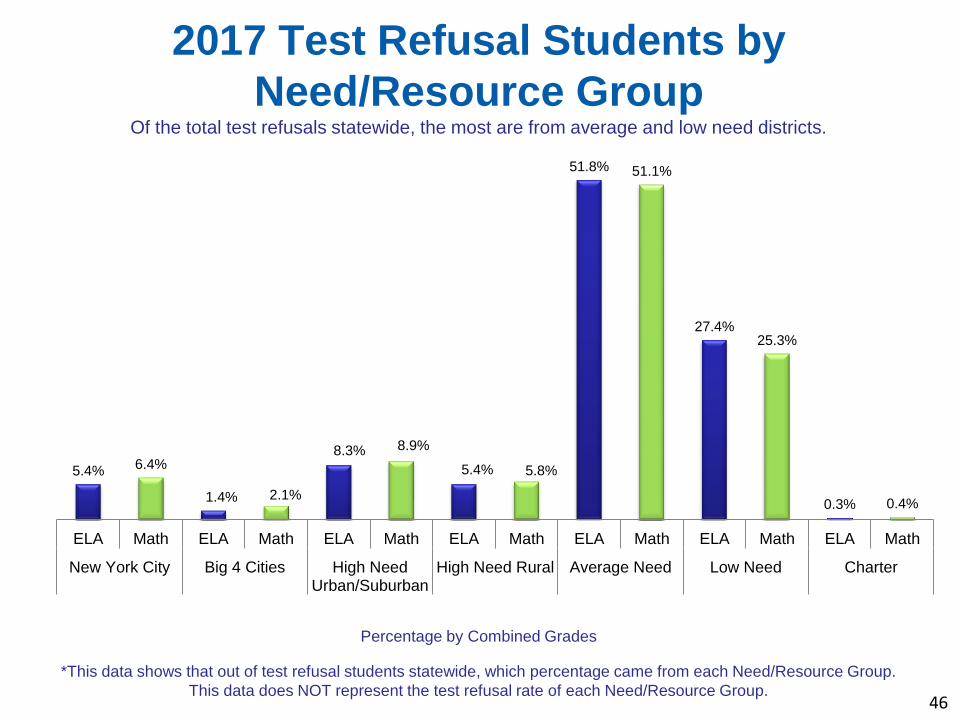
2017 Test Refusal Students by
Need/Resource GroupOf the total test refusals statewide, the most are from average and low need districts.
46
Percentage by Combined Grades
*This data shows that out of test refusal students statewide, which percentage came from each Need/Resource Group.
This data does NOT represent the test refusal rate of each Need/Resource Group.

Conclusion• Overall, students statewide have made progress in ELA
and math
• The Big 5 districts made progress in ELA & math
• All race and ethnicity groups made progress, continuing
to slowly close the achievement gap
• Will look at schools with significant gains to identify
exceptional practices
• Emphasis on fostering equity and closing gaps will
continue through My Brother’s Keeper initiative, ESSA
plan implementation and our Equity initiative
47