measuring status and change in naep inclusion rates...
TRANSCRIPT
Measuring Status and Change in NAEP Inclusion Rates of Students With DisabilitiesResults 2007-09
NCES 2011-457 U.S. DEPARTMENT OF EDUCATION

NATIONAL ASSESSMENT OF EDUCATIONAL PROGRESS
Contents
1 About the Study
3 Inclusion of Students With Disabilities
4 Understanding Inclusion Rates
5 Variation in the Population of Students With Disabilities Across States and Over Time
8 Measuring Change
9 Status of Inclusion
10 Example
11 Results 2007-09
16 Comparison of 2005-07 and 2007-09 Change
18 Consistency of Change
20 Endnotes and References
21 Appendices
ForewordIn 2005, the U.S. Government Accountability Office (GAO) released the report No Child Left Behind Act: Most Students With Disabilities Participated in Statewide Assessments, but Inclusion Options Could Be Improved (U.S. General Accounting Office 2005). In the report, the GAO recommended that the National Center for Education Statistics (NCES) “work with the states, particularly those with high exclusion rates, to explore strategies to reduce the number of students with disabilities who are excluded from the National Assessment of Educational Progress (NAEP) assessment.” NCES responded with the following actions:
• Researchedthelocaldecision-makingprocessforparticipationand accommodation of students with disabilities on NAEP;
• Implementedaprocesstodeterminewhetherstudentscould participate in NAEP without their normal state accommodations; and
• ImprovedtrainingofNAEPadministratorsandfieldstafffor2007andsubsequentassessmentsthatclarifiedthecriteriaforinclusion.
NCES also conducted research to develop a methodology for measuring state inclusion rates while taking into account the differingdemographicsandinclusionpoliciesineachstate.Thisstudy provides an update of that research and methodology using data from the 2009 NAEP administration.
1INCLUSION HIGHLIGHTS
About the StudyPrevious ResearchReportingoftrendsrequiresconsistencyininclusionpracticesacross years, and the lack of consistency in the inclusion of students with disabilities has been a concern for NAEP researchers (Forgione 1999; McLaughlin 2000, 2001, 2003). Numerous publications and working papers related to the inclusion of students in NAEP have been conducted and are available on the NCES website at: http://nces.ed.gov/nationsreportcard/about/inclusion.asp.
In2009,NCESreleasedaResearchandDevelopmentreport,Measuring the Status and Change of NAEP State Inclusion Rates for Students with Disabilities (Kitmitto and Bandeira de Mello 2009).Thereportprovidedamethodologyandtwomeasuresofchange in each state’s inclusion rate, taking into consideration thefollowingfactorsthatdifferacrossstatesandacrosstime:
• Theprevalenceofstudentswithdifferenttypesandseveritiesof disabilities; and
• Theaccommodationsthatstatespermitintheirowntestingprograms compared with those allowed for NAEP.
State-levelinclusionratesareexpectedtovaryaccordingtodifferingproportionsofstudentswithdifferenttypesandseveritiesofdisabilitiesandtheofferingofaccommodationsonthe state assessment that are not allowed on NAEP. Variations that result from other factors that we cannot measure are meant to be captured by our change measure.
Thatstudyreportedresultsforall50statesandtheDistrictof Columbia and used data from the 2005 and 2007 NAEP fourth-andeighth-gradereadingandmathematicsassessments.Themethodologydevelopedinthereportwasnextappliedtomeasuring change in districts participating in the Trial Urban DistrictAssessment(TUDA)program.
Thefullreportwithstate-levelresultsisavailabletodownloadat:http://nces.ed.gov/nationsreportcard/pubs/studies/2009453.asp.
TheresultsfortheapplicationtoTUDAdistrictsareavailableon the NCES website at: http://nces.ed.gov/nationsreportcard/about/tuda_status_change_inclusion.asp.
Current StudyNCES continues to be interested in addressing the issue identifiedbyGAO.Withthereleaseofthe2009NAEPreadingand mathematics assessments, NCES again had the opportunity to measure the status and change in inclusion rates and, hence, conducted this update to the 2009 report. Additionally, while
thegeneralmethodologydidnotchange,thespecificationofthestatistical model changed slightly. First, changes in the background information that NAEP collects on students with disabilities meant that one of the control factors that had been used in the previous report was not available in the 2009 administration andthereforewasnotusedinthemodel.Second,effortsweremadetore-specifythestatisticalmodeltobetterhandlestudentobservations with missing background information.
Thisreportislimitedtothediscussionandapplicationofmethodsformeasuringchangeinstate-levelinclusionrates.Notincluded here are discussions of the explanations, other than methodological, behind reported results or the implications of these reports for policy.
Thoughthefocusofthisstudyisonchangeover2007-09,resultsfrom2005-07werere-calculatedwiththeupdatedmodel.Changesininclusionfor2005-07and2005-09arepresentedwiththe2007-09resultsforcomparativepurposes.Detailsonthechangesinthemethodologyaswellasfullresultsare provided at: http://nces.ed.gov/nationsreportcard/studies/inclusion/.
DataAll data used in this report were obtained from the 2005, 2007, and2009NAEPadministrations.Thesamplewaslimitedtopublicschoolstudentswithdisabilities(SDs)whoarenotEnglishlanguagelearners(ELLs).ThisisdifferentfromotherNAEPreporting of students with disabilities that typically includes students who are also English language learners. ELLs were not included in the analysis because factors influencing the inclusion ofSDsandELLsaredistinct.WeexpectSDswhoarealsoELLstobeincludedonNAEPunderadifferentprocess;hence,we expect that the model and, possibly, results will change by includingthem.Therefore,findingsinthisreportmaynotbeapplicabletoSDswhoareELLsormaybedifferentwhenSDswho are ELL are included.
Information on the characteristics of students with disabilities wascollectedthroughNAEP’sSDQuestionnaire.TheSDQuestionnaireisintendedtobecompletedbythespecialeducationteacherorstaffmemberwhoismostfamiliarwiththestudent.Copiesofthe2005,2007,and2009SDquestionnaires (all subjects) can be found at: http://nces.ed.gov/nationsreportcard/bgquest.asp.
As in the earlier report (Kitmitto and Bandeira de Mello 2009), the discussions presented here are exploratory in nature and therefore cannot be used to draw causal inferences.
NATIONAL ASSESSMENT OF EDUCATIONAL PROGRESS2
Organization of the ReportThisreportstartswithabriefintroductiontotheinclusionof students with disabilities on NAEP and motivation for the methodology used in this study. Next is a discussion of the variability of inclusion rates across states and across student characteristics.Thisisfollowedbyadiscussionofvariabilityofstudentcharacteristicsacrossstatesandtime.Thecoremethodology for measuring change is then introduced as well as a measure of inclusiveness, or “status measure,” in the initial yearoverwhichchangeismeasured.Thestatusmeasureprovidescontext for understanding the change measure. An illustrated exampleisthenprovided.Theremainderofthereportisdevotedtoasummaryofresultsfor2007-09andacomparisonofchangeover2005-07tochangeover2007-09.Theconsistencyofchangeacross subjects (mathematics and reading), grades (4 and 8), and timeperiods(2005-07,2007-09,and2005-09)isexploredattheend of the report.
NOTE:ForthisreporttheDistrictofColumbiaisdefinedand referred to as a state.

INCLUSION HIGHLIGHTS 3
ThedecisionaboutwhetherastudentwithdisabilitiesisincludedinNAEPismadebyaschoolstaffmembermostknowledgeableabout the student. A student with disabilities is assumed to be able to participate in NAEP if he or she participated in the state assessment in the selected subject and can participate with accommodations allowed by NAEP. Schools are encouraged to have students with disabilities participate whenever possible.
Inthe2009NAEPgrade4mathematicsadministration,amongnationalpublicschools,12.1percentofallstudentswereidentifiedashaving a disability and were not also English language learners (table 1). Of those students with disabilities, 85.4 percent were assessed on NAEP. In 2009 grade 8 mathematics, 11.9 percent of all students were students with disabilities who are not English language learners, and of them, 78.5 percent were assessed on NAEP. Mathematics is displayed as an example.
Inclusion of Students With Disabilities
Table 1. Percentage of public school students with disabilities who are not English language learners and are identified and assessed in mathematics: 2005, 2007, and 2009
INCLUSION HIGHLIGHTS 3
Mathematics Grade 4 Mathematics Grade 8
National Public Schools 2005 2007 2009 2005 2007 2009
Percentage of students who are identified as students with disabilities and not English language learners 12.6 12.2 12.1 12.4 11.5 11.9
Percentage of students with disabilities who are not English language learners and who are assessed 82.2 81.3 85.4 77.0 70.6 78.5
SOURCE: U.S. Department of Education, Institute of Education Sciences, National Center for Education Statistics, National Assessment of Educational Progress (NAEP) 2005, 2007, and 2009 Mathematics Assessments.
Factors Affecting InclusionTheexpectationisthatstate-levelinclusionrateswillvaryaccordingtothedifferingproportionsofstudentswithdifferenttypesandseveritiesofdisabilitiesandtheofferingofaccommodations on the state assessment that are not allowed on NAEP. Variations that result from other factors that we cannot measure are not standard and are meant to be captured by our change measure. Student characteristics that are expected to have an impact on a state’s inclusion rate include the following:
• Typeofdisability;• Severityofdisabilities;• IndividualizedEducationPlan(IEP)asopposedtoa504or
other type of plan1; and• Accommodationwasreceivedonthestatetestbutwasnot
allowed on NAEP.
Students with less severe disabilities, such as a speech or hearing impairment, are more often included in NAEP testing. Students with more severe disabilities, such as mental retardation, are less often included in NAEP.
Variation in inclusion rates across states and time may be due to differencesintheprevalenceofthesefactorslistedaboveordueto unexplained sources of variation that include variation in state effortstoincreaseinclusiononNAEPandchangesinNCESpolicyandpractices.Thisstudyseekstoprovideameasureofthis
unexplained variation in inclusion rates across time and across states that controls for variation in the measurable student characteristics and state accommodation factors listed here.
Accounting for Differences in Student CharacteristicsA state with a 90 percent inclusion rate is not necessarily more inclusive than a state with an 80 percent inclusion rate, because studentswithdisabilitiesmayhavedifferentcharacteristicsacross states. If a state has a higher percentage of severely disabled students, for example, it would be expected to have a lower inclusion rate. Hence, to properly compare the status of inclusion rates across states or to properly measure a state’s changeininclusionratesacrosstime,differencesandchangesin states’ populations of students with disabilities must be taken into account. For example, if a state experiences a drop in the percentageofstudentsclassifiedwithmentalretardation(i.e., the percentage of students who are less often included), the state’s inclusion rate would be expected to increase.
4 NATIONAL ASSESSMENT OF EDUCATIONAL PROGRESS
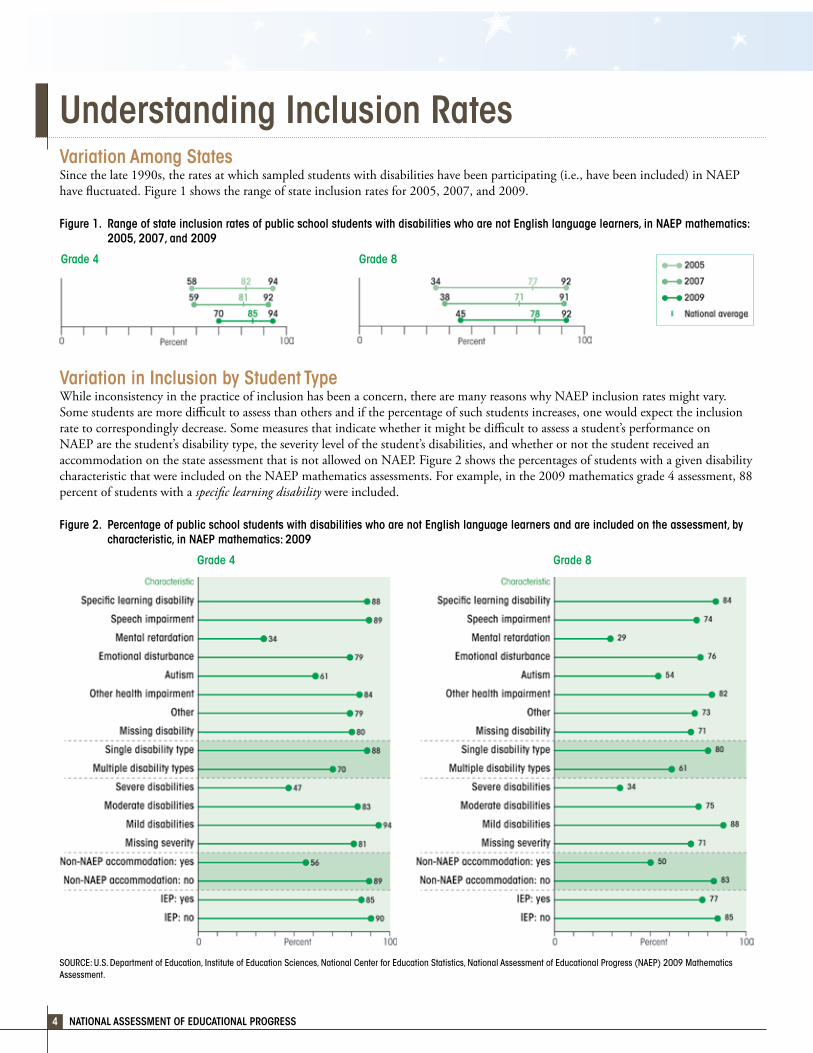
Variation Among StatesSince the late 1990s, the rates at which sampled students with disabilities have been participating (i.e., have been included) in NAEP have fluctuated. Figure 1 shows the range of state inclusion rates for 2005, 2007, and 2009.
Understanding Inclusion Rates
Grade 4 Grade 8
Figure 1. Range of state inclusion rates of public school students with disabilities who are not English language learners, in NAEP mathematics: 2005, 2007, and 2009
Grade 4
Variation in Inclusion by Student TypeWhileinconsistencyinthepracticeofinclusionhasbeenaconcern,therearemanyreasonswhyNAEPinclusionratesmightvary.Some students are more difficult to assess than others and if the percentage of such students increases, one would expect the inclusion rate to correspondingly decrease. Some measures that indicate whether it might be difficult to assess a student’s performance on NAEP are the student’s disability type, the severity level of the student’s disabilities, and whether or not the student received an accommodation on the state assessment that is not allowed on NAEP. Figure 2 shows the percentages of students with a given disability characteristic that were included on the NAEP mathematics assessments. For example, in the 2009 mathematics grade 4 assessment, 88 percent of students with a specific learning disability were included.
Figure 2. Percentage of public school students with disabilities who are not English language learners and are included on the assessment, by characteristic, in NAEP mathematics: 2009
SOURCE: U.S. Department of Education, Institute of Education Sciences, National Center for Education Statistics, National Assessment of Educational Progress (NAEP) 2009 Mathematics Assessment.
Grade 8
INCLUSION HIGHLIGHTS 5
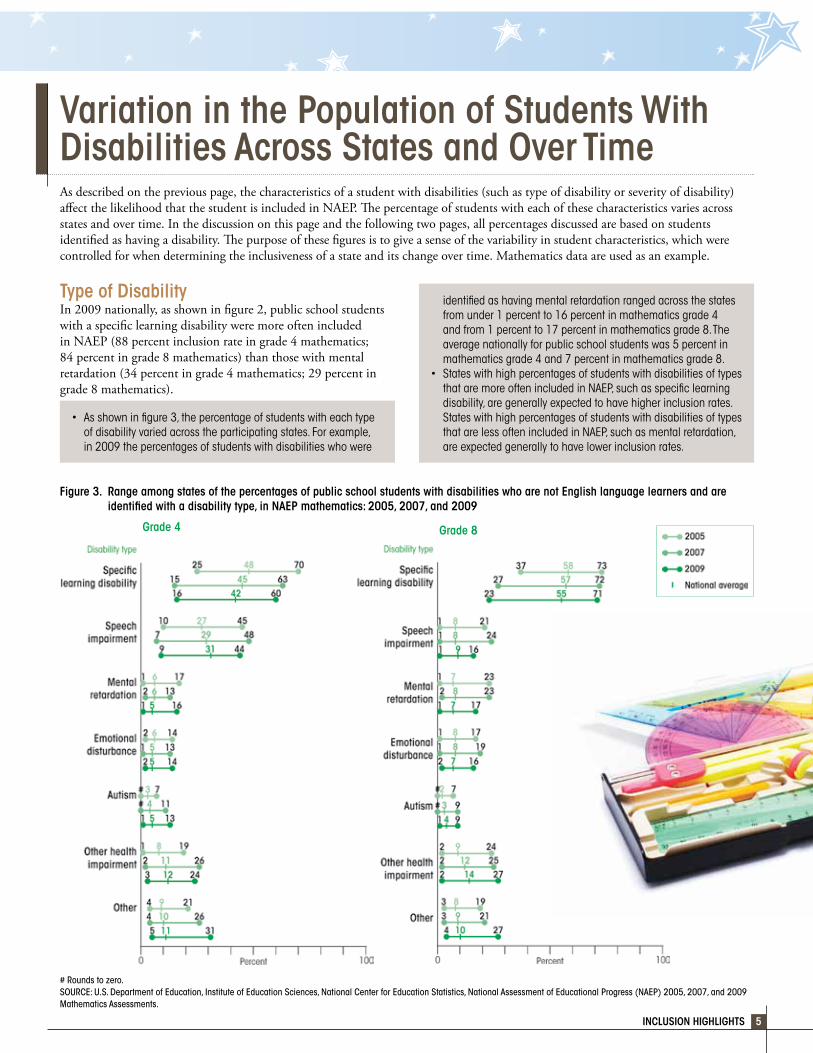
Variation in the Population of Students With Disabilities Across States and Over TimeAs described on the previous page, the characteristics of a student with disabilities (such as type of disability or severity of disability) affectthelikelihoodthatthestudentisincludedinNAEP.Thepercentageofstudentswitheachofthesecharacteristicsvariesacrossstates and over time. In the discussion on this page and the following two pages, all percentages discussed are based on students identifiedashavingadisability.Thepurposeofthesefiguresistogiveasenseofthevariabilityinstudentcharacteristics,whichwerecontrolled for when determining the inclusiveness of a state and its change over time. Mathematics data are used as an example.
Type of DisabilityIn2009nationally,asshowninfigure2,publicschoolstudentswithaspecificlearningdisabilityweremoreoftenincludedin NAEP (88 percent inclusion rate in grade 4 mathematics; 84 percent in grade 8 mathematics) than those with mental retardation (34 percent in grade 4 mathematics; 29 percent in grade 8 mathematics).
identified as having mental retardation ranged across the states from under 1 percent to 16 percent in mathematics grade 4 and from 1 percent to 17 percent in mathematics grade 8. The average nationally for public school students was 5 percent in mathematics grade 4 and 7 percent in mathematics grade 8.
• Stateswithhighpercentagesofstudentswithdisabilitiesoftypesthat are more often included in NAEP, such as specific learning disability, are generally expected to have higher inclusion rates. Stateswithhighpercentagesofstudentswithdisabilitiesoftypesthat are less often included in NAEP, such as mental retardation, are expected generally to have lower inclusion rates.
• Asshowninfigure3,thepercentageofstudentswitheachtypeof disability varied across the participating states. For example, in 2009 the percentages of students with disabilities who were
Figure 3. Range among states of the percentages of public school students with disabilities who are not English language learners and are identified with a disability type, in NAEP mathematics: 2005, 2007, and 2009
Grade 4 Grade 8
# Rounds to zero.SOURCE: U.S. Department of Education, Institute of Education Sciences, National Center for Education Statistics, National Assessment of Educational Progress (NAEP) 2005, 2007, and 2009 Mathematics Assessments.
NATIONAL ASSESSMENT OF EDUCATIONAL PROGRESS6
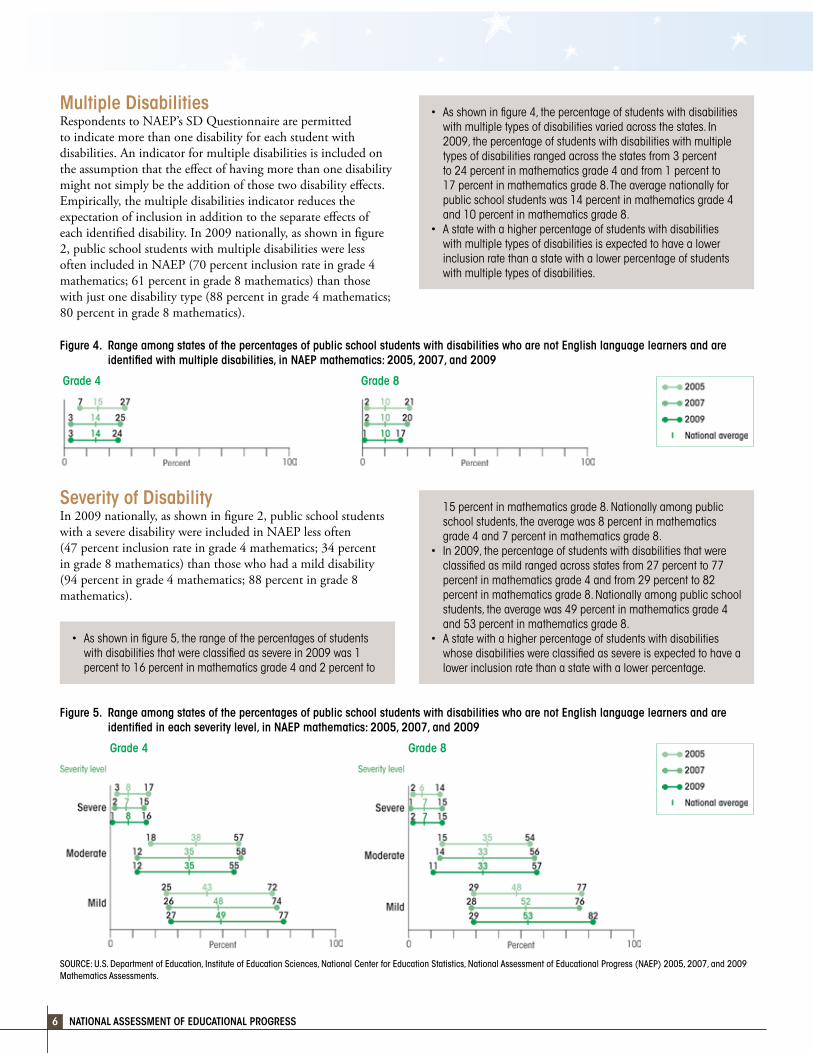
Multiple DisabilitiesRespondentstoNAEP’sSDQuestionnairearepermittedto indicate more than one disability for each student with disabilities. An indicator for multiple disabilities is included on theassumptionthattheeffectofhavingmorethanonedisabilitymightnotsimplybetheadditionofthosetwodisabilityeffects.Empirically, the multiple disabilities indicator reduces the expectationofinclusioninadditiontotheseparateeffectsofeachidentifieddisability.In2009nationally,asshowninfigure2, public school students with multiple disabilities were less often included in NAEP (70 percent inclusion rate in grade 4 mathematics; 61 percent in grade 8 mathematics) than those with just one disability type (88 percent in grade 4 mathematics; 80 percent in grade 8 mathematics).
• Asshowninfigure4,thepercentageofstudentswithdisabilitieswith multiple types of disabilities varied across the states. In 2009, the percentage of students with disabilities with multiple types of disabilities ranged across the states from 3 percent to 24 percent in mathematics grade 4 and from 1 percent to 17 percent in mathematics grade 8. The average nationally for public school students was 14 percent in mathematics grade 4 and 10 percent in mathematics grade 8.
• Astatewithahigherpercentageofstudentswithdisabilitieswith multiple types of disabilities is expected to have a lower inclusion rate than a state with a lower percentage of students with multiple types of disabilities.
Figure 4. Range among states of the percentages of public school students with disabilities who are not English language learners and are identified with multiple disabilities, in NAEP mathematics: 2005, 2007, and 2009
Grade 4 Grade 8
Severity of DisabilityIn2009nationally,asshowninfigure2,publicschoolstudentswith a severe disability were included in NAEP less often (47 percent inclusion rate in grade 4 mathematics; 34 percent in grade 8 mathematics) than those who had a mild disability (94 percent in grade 4 mathematics; 88 percent in grade 8 mathematics).
• Asshowninfigure5,therangeofthepercentagesofstudentswith disabilities that were classified as severe in 2009 was 1 percent to 16 percent in mathematics grade 4 and 2 percent to
15 percent in mathematics grade 8. Nationally among public school students, the average was 8 percent in mathematics grade 4 and 7 percent in mathematics grade 8.
• In2009,thepercentageofstudentswithdisabilitiesthatwereclassified as mild ranged across states from 27 percent to 77 percent in mathematics grade 4 and from 29 percent to 82 percent in mathematics grade 8. Nationally among public school students, the average was 49 percent in mathematics grade 4 and 53 percent in mathematics grade 8.
• Astatewithahigherpercentageofstudentswithdisabilitieswhose disabilities were classified as severe is expected to have a lower inclusion rate than a state with a lower percentage.
Figure 5. Range among states of the percentages of public school students with disabilities who are not English language learners and are identified in each severity level, in NAEP mathematics: 2005, 2007, and 2009
Grade 4 Grade 8
SOURCE: U.S. Department of Education, Institute of Education Sciences, National Center for Education Statistics, National Assessment of Educational Progress (NAEP) 2005, 2007, and 2009 Mathematics Assessments.
INCLUSION HIGHLIGHTS 7
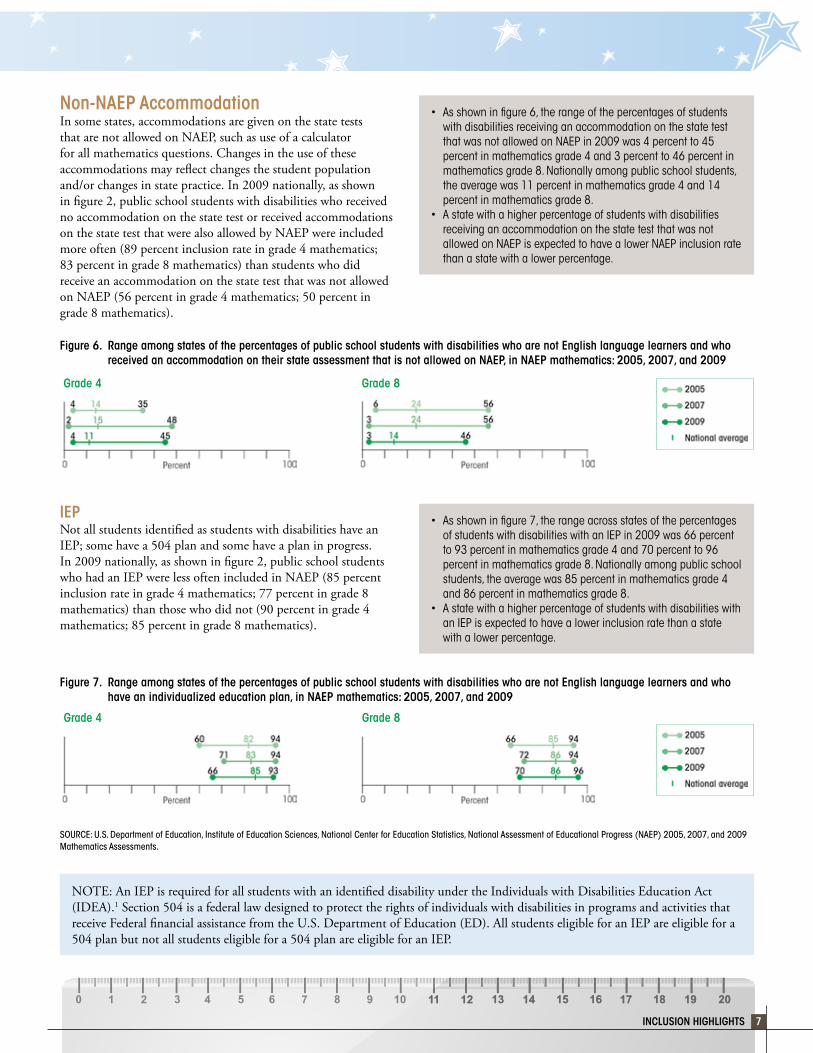
Non-NAEP AccommodationIn some states, accommodations are given on the state tests that are not allowed on NAEP, such as use of a calculator for all mathematics questions. Changes in the use of these accommodations may reflect changes the student population and/or changes in state practice. In 2009 nationally, as shown infigure2,publicschoolstudentswithdisabilitieswhoreceivedno accommodation on the state test or received accommodations on the state test that were also allowed by NAEP were included more often (89 percent inclusion rate in grade 4 mathematics; 83 percent in grade 8 mathematics) than students who did receive an accommodation on the state test that was not allowed on NAEP (56 percent in grade 4 mathematics; 50 percent in grade 8 mathematics).
• Asshowninfigure6,therangeofthepercentagesofstudentswith disabilities receiving an accommodation on the state test that was not allowed on NAEP in 2009 was 4 percent to 45 percent in mathematics grade 4 and 3 percent to 46 percent in mathematics grade 8. Nationally among public school students, the average was 11 percent in mathematics grade 4 and 14 percent in mathematics grade 8.
• Astatewithahigherpercentageofstudentswithdisabilitiesreceiving an accommodation on the state test that was not allowed on NAEP is expected to have a lower NAEP inclusion rate than a state with a lower percentage.
Figure 6. Range among states of the percentages of public school students with disabilities who are not English language learners and who received an accommodation on their state assessment that is not allowed on NAEP, in NAEP mathematics: 2005, 2007, and 2009
Grade 4 Grade 8
IEPNotallstudentsidentifiedasstudentswithdisabilitieshaveanIEP; some have a 504 plan and some have a plan in progress. In2009nationally,asshowninfigure2,publicschoolstudentswho had an IEP were less often included in NAEP (85 percent inclusion rate in grade 4 mathematics; 77 percent in grade 8 mathematics) than those who did not (90 percent in grade 4 mathematics; 85 percent in grade 8 mathematics).
• Asshowninfigure7,therangeacrossstatesofthepercentagesof students with disabilities with an IEP in 2009 was 66 percent to 93 percent in mathematics grade 4 and 70 percent to 96 percent in mathematics grade 8. Nationally among public school students, the average was 85 percent in mathematics grade 4 and 86 percent in mathematics grade 8.
• Astatewithahigherpercentageofstudentswithdisabilitieswithan IEP is expected to have a lower inclusion rate than a state with a lower percentage.
Figure 7. Range among states of the percentages of public school students with disabilities who are not English language learners and who have an individualized education plan, in NAEP mathematics: 2005, 2007, and 2009
Grade 4 Grade 8
SOURCE: U.S. Department of Education, Institute of Education Sciences, National Center for Education Statistics, National Assessment of Educational Progress (NAEP) 2005, 2007, and 2009 Mathematics Assessments.
NOTE:AnIEPisrequiredforallstudentswithanidentifieddisabilityundertheIndividualswithDisabilitiesEducationAct(IDEA).1 Section 504 is a federal law designed to protect the rights of individuals with disabilities in programs and activities that receiveFederalfinancialassistancefromtheU.S.DepartmentofEducation(ED).AllstudentseligibleforanIEPareeligiblefora504 plan but not all students eligible for a 504 plan are eligible for an IEP.
NATIONAL ASSESSMENT OF EDUCATIONAL PROGRESS8
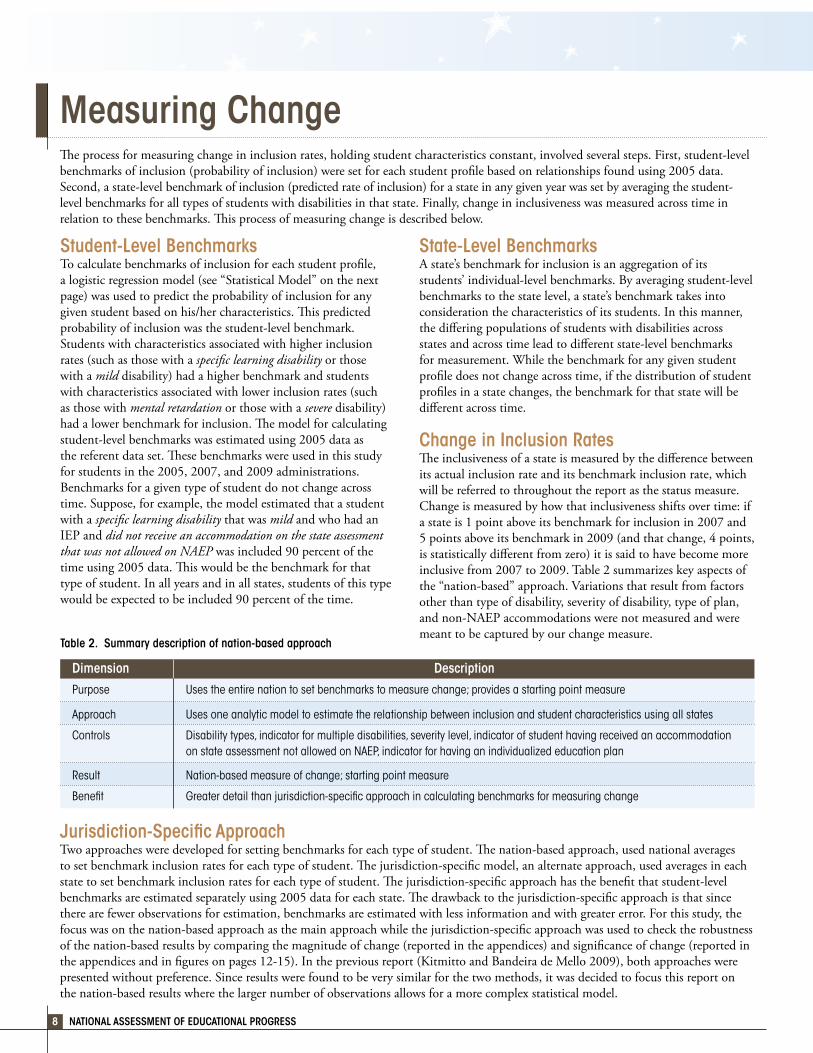
Measuring ChangeTheprocessformeasuringchangeininclusionrates,holdingstudentcharacteristicsconstant,involvedseveralsteps.First,student-levelbenchmarksofinclusion(probabilityofinclusion)weresetforeachstudentprofilebasedonrelationshipsfoundusing2005data.Second,astate-levelbenchmarkofinclusion(predictedrateofinclusion)forastateinanygivenyearwassetbyaveragingthestudent-level benchmarks for all types of students with disabilities in that state. Finally, change in inclusiveness was measured across time in relationtothesebenchmarks.Thisprocessofmeasuringchangeisdescribedbelow.
Student-Level BenchmarksTocalculatebenchmarksofinclusionforeachstudentprofile,a logistic regression model (see “Statistical Model” on the next page) was used to predict the probability of inclusion for any givenstudentbasedonhis/hercharacteristics.Thispredictedprobabilityofinclusionwasthestudent-levelbenchmark.Students with characteristics associated with higher inclusion rates (such as those with a specific learning disability or those with a mild disability) had a higher benchmark and students with characteristics associated with lower inclusion rates (such as those with mental retardation or those with a severe disability) hadalowerbenchmarkforinclusion.Themodelforcalculatingstudent-levelbenchmarkswasestimatedusing2005dataasthereferentdataset.Thesebenchmarkswereusedinthisstudyfor students in the 2005, 2007, and 2009 administrations. Benchmarks for a given type of student do not change across time. Suppose, for example, the model estimated that a student with a specific learning disability that was mild and who had an IEP and did not receive an accommodation on the state assessment that was not allowed on NAEP was included 90 percent of the timeusing2005data.Thiswouldbethebenchmarkforthattype of student. In all years and in all states, students of this type would be expected to be included 90 percent of the time.
State-Level BenchmarksA state’s benchmark for inclusion is an aggregation of its students’individual-levelbenchmarks.Byaveragingstudent-levelbenchmarks to the state level, a state’s benchmark takes into consideration the characteristics of its students. In this manner, thedifferingpopulationsofstudentswithdisabilitiesacrossstatesandacrosstimeleadtodifferentstate-levelbenchmarksformeasurement.Whilethebenchmarkforanygivenstudentprofiledoesnotchangeacrosstime,ifthedistributionofstudentprofilesinastatechanges,thebenchmarkforthatstatewillbedifferentacrosstime.
Change in Inclusion RatesTheinclusivenessofastateismeasuredbythedifferencebetweenits actual inclusion rate and its benchmark inclusion rate, which will be referred to throughout the report as the status measure. Change is measured by how that inclusiveness shifts over time: if a state is 1 point above its benchmark for inclusion in 2007 and 5 points above its benchmark in 2009 (and that change, 4 points, isstatisticallydifferentfromzero)itissaidtohavebecomemoreinclusivefrom2007to2009.Table2summarizeskeyaspectsofthe“nation-based”approach.Variationsthatresultfromfactorsother than type of disability, severity of disability, type of plan, andnon-NAEPaccommodationswerenotmeasuredandweremeant to be captured by our change measure.
Table 2. Summary description of nation-based approach
Dimension Description
Purpose Uses the entire nation to set benchmarks to measure change; provides a starting point measure
Approach Uses one analytic model to estimate the relationship between inclusion and student characteristics using all states
Controls Disability types, indicator for multiple disabilities, severity level, indicator of student having received an accommodation on state assessment not allowed on NAEP, indicator for having an individualized education plan
Result Nation-based measure of change; starting point measure
Benefit Greater detail than jurisdiction-specific approach in calculating benchmarks for measuring change
Jurisdiction-Specific ApproachTwoapproachesweredevelopedforsettingbenchmarksforeachtypeofstudent.Thenation-basedapproach,usednationalaveragestosetbenchmarkinclusionratesforeachtypeofstudent.Thejurisdiction-specificmodel,analternateapproach,usedaveragesineachstatetosetbenchmarkinclusionratesforeachtypeofstudent.Thejurisdiction-specificapproachhasthebenefitthatstudent-levelbenchmarksareestimatedseparatelyusing2005dataforeachstate.Thedrawbacktothejurisdiction-specificapproachisthatsincethere are fewer observations for estimation, benchmarks are estimated with less information and with greater error. For this study, the focuswasonthenation-basedapproachasthemainapproachwhilethejurisdiction-specificapproachwasusedtochecktherobustnessofthenation-basedresultsbycomparingthemagnitudeofchange(reportedintheappendices)andsignificanceofchange(reportedintheappendicesandinfiguresonpages12-15).Inthepreviousreport(KitmittoandBandeiradeMello2009),bothapproacheswerepresented without preference. Since results were found to be very similar for the two methods, it was decided to focus this report on thenation-basedresultswherethelargernumberofobservationsallowsforamorecomplexstatisticalmodel.

INCLUSION HIGHLIGHTS 9
Status of InclusionStatus of Inclusion Rates: A Context for Understanding ChangeChange is always relative to a starting point. Each state’s change measure needs to be understood in terms of how inclusive, as measured by the status measure, the state was in the initial year of any time period of change. States that are very inclusive relative to their benchmark (i.e., have high status measures) at the start have relatively less potential for improvement, while states that are less inclusive at the start relative to their benchmark (i.e., have low status measures) have more potential for improvement. If one is looking atchangeover2007-09,then2007istheinitialyear(and2005forchangeover2005-07and2005-09)andthe2007statusmeasureindicates how inclusive the state was relative to other states in 2007.
Fortheapproachtakentomeasuringchange,thenation-basedapproach,thestudent-levelbenchmarksofinclusionarethesameacrossstatesforanygivenstudentprofile.Hence,onecancomparestatesdirectlyonhowinclusivetheyarerelativetotheirstate-levelbenchmarks.Thestatusmeasureprovidesastartingpointthatcontrolsfordifferencesinthedistributionofstudentswithdisabilitiesineach state.
• In2007,ifStateAhadaninclusionrate7.1percentagepointsaboveitsstate-levelbenchmarkandStateBhadaninclusionrate1percentagepointaboveitsbenchmark,onewouldsaythatStateAwasrelativelymoreinclusivethanStateB.
• In2007,ifStateBhadaninclusionrate1percentagepointaboveitsstate-levelbenchmarkandStateChadaninclusionrate3percentagepointsbelowitsstate-levelbenchmark(astatusmeasureof-3),onewouldsaythatStateCwasrelativelylessinclusivethanStateB.
Statistical ModelIndividual-levelbenchmarkswereproducedbyestimatingalogisticregressionmodelofinclusionusingstudent-leveldata. ThedependentvariablewasanindicatorvariableforwhetherornotthestudenthadbeenincludedinNAEP.Controlvariablesincluded in the model were: indicators for each disability type, indicator for multiple disabilities, indicators for severity level of disabilities, indicator for students with an IEP, and an indicator for whether the student received an accommodation on the state assessmentthatwasnotallowedonNAEP.Disabilitytypeandseveritylevelindicatorswereincludedbythemselvesasmaineffectsandwerealsocrossedwitheachothertoallowforgreaterflexibilityinmeasuringtheireffects.
In the previous report, Kitmitto and Bandeira de Mello (2009), indicator variables for “grade level of instruction” were included inthemodel.ThisitemhasbeendiscontinuedaspartoftheNAEPSDbackgroundquestionnaireandthereforewasnotusedinthemodelforthecurrentstudy.TheindicatorforanIEPwasanadditiontotheanalysisthathadnotbeenpreviouslyincludedinthe model. Another change from the model used in the previous report is that missing disabilities was no longer collapsed with the other disability type. To better address the challenges that missing information poses, the model included main disability type and severityleveleffectsaswellascross-effects.Inthepreviousreport,onlyafullsetofcross-effectswasemployed.
Thenation-basedmodelwasestimatedusingdatafromalljurisdictions(i.e.all50statesplustheDistrictofColumbia),andtheestimatedeffectsoftheindependentvariablesdidnotchangeacrossjurisdictions.Asdiscussedpreviously,underthisapproachthestudent-levelbenchmarkforagivenstudentprofilewasthesameinalljurisdictions.Underthejurisdiction-specificapproach,incontrast,themodelwasestimatedseparatelyforeachstateusingonlythatstate’sdata.Thisledtodifferentstudent-levelbenchmarksforagivenstudentprofileestimatedineachstate.
For a full description of the methodology, see Kitmitto and Bandeira de Mello (2009): http://nces.ed.gov/nationsreportcard/pubs/studies/2009453.asp.
For a full description of changes in the methodology used for this report see: http://nces.ed.gov/nationsreportcard/studies/inclusion/.
NATIONAL ASSESSMENT OF EDUCATIONAL PROGRESS10
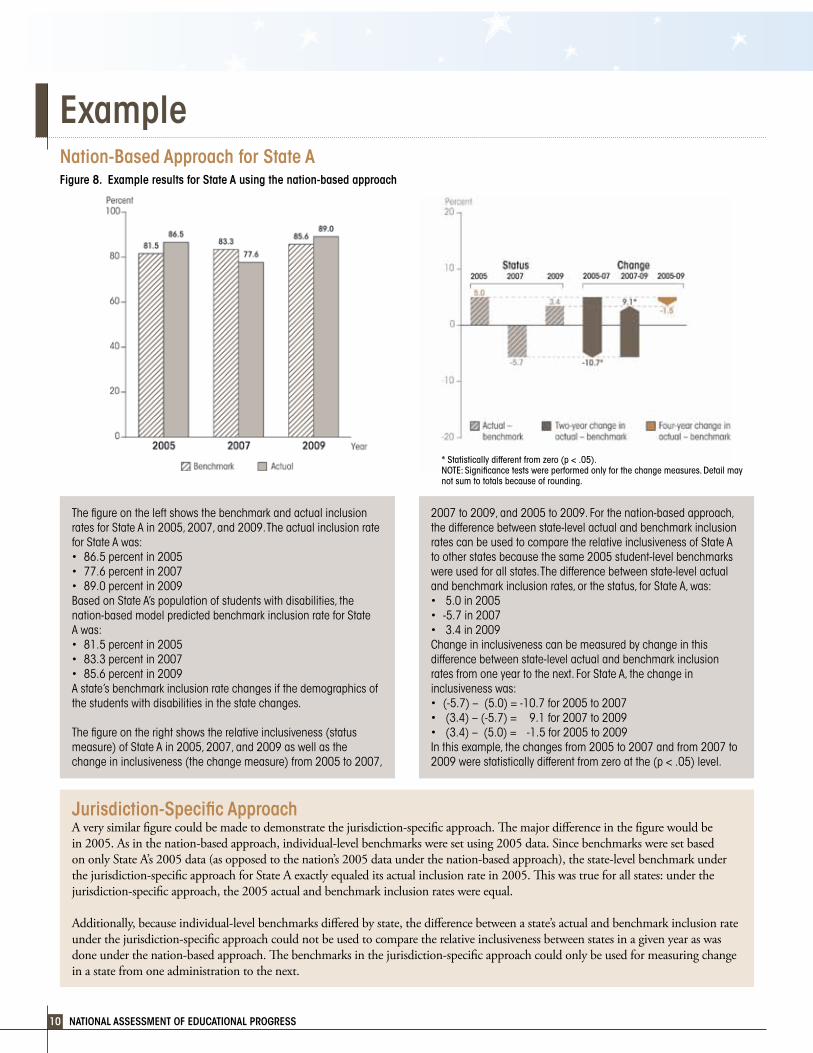
Example Nation-Based Approach for State AFigure 8. Example results for State A using the nation-based approach
The figure on the left shows the benchmark and actual inclusion ratesforStateAin2005,2007,and2009.TheactualinclusionrateforStateAwas:• 86.5percentin2005• 77.6percentin2007• 89.0percentin2009BasedonStateA’spopulationofstudentswithdisabilities,thenation-basedmodelpredictedbenchmarkinclusionrateforStateAwas:• 81.5percentin2005• 83.3percentin2007• 85.6percentin2009Astate’sbenchmarkinclusionratechangesifthedemographicsofthe students with disabilities in the state changes.
The figure on the right shows the relative inclusiveness (status measure)ofStateAin2005,2007,and2009aswellasthechange in inclusiveness (the change measure) from 2005 to 2007,
* Statistically different from zero (p < .05).NOTE: Significance tests were performed only for the change measures. Detail may not sum to totals because of rounding.
2007 to 2009, and 2005 to 2009. For the nation-based approach, the difference between state-level actual and benchmark inclusion ratescanbeusedtocomparetherelativeinclusivenessofStateAto other states because the same 2005 student-level benchmarks were used for all states. The difference between state-level actual andbenchmarkinclusionrates,orthestatus,forStateA,was:• 5.0in2005• -5.7in2007• 3.4in2009Change in inclusiveness can be measured by change in this difference between state-level actual and benchmark inclusion ratesfromoneyeartothenext.ForStateA,thechangeininclusivenesswas:• (-5.7)–(5.0)=-10.7for2005to2007• (3.4)–(-5.7)= 9.1for2007to2009• (3.4)–(5.0)= -1.5for2005to2009In this example, the changes from 2005 to 2007 and from 2007 to 2009 were statistically different from zero at the (p < .05) level.
Jurisdiction-Specific ApproachAverysimilarfigurecouldbemadetodemonstratethejurisdiction-specificapproach.Themajordifferenceinthefigurewouldbein2005.Asinthenation-basedapproach,individual-levelbenchmarksweresetusing2005data.SincebenchmarksweresetbasedononlyStateA’s2005data(asopposedtothenation’s2005dataunderthenation-basedapproach),thestate-levelbenchmarkunderthejurisdiction-specificapproachforStateAexactlyequaleditsactualinclusionratein2005.Thiswastrueforallstates:underthejurisdiction-specificapproach,the2005actualandbenchmarkinclusionrateswereequal.
Additionally,becauseindividual-levelbenchmarksdifferedbystate,thedifferencebetweenastate’sactualandbenchmarkinclusionrateunderthejurisdiction-specificapproachcouldnotbeusedtocomparetherelativeinclusivenessbetweenstatesinagivenyearaswasdoneunderthenation-basedapproach.Thebenchmarksinthejurisdiction-specificapproachcouldonlybeusedformeasuringchangein a state from one administration to the next.
INCLUSION HIGHLIGHTS 11
Results 2007-09Inthetablebelow,each2007-09changeresultiscategorizedasanincrease,nochange,oradecreaseininclusivenessbygradeandsubject.Thenumberofoccurrencesacrossgradesandsubjectsisprovidedinthesecondcolumnoftable3.Increasesanddecreasesarechangesthatarestatisticallydifferentfromzero(p<.05).Changesthatarenotstatisticallydifferentfromzeroaredesignatedas“nochange.”
Table 3. Number of states for each type of inclusiveness change by subject and grade: 2007-09
Mathematics Reading
Type of inclusiveness changeTotal numberof instances Grade 4 Grade 8 Grade 4 Grade 8
Increase 55 10 16 13 16
No change 145 40 34 36 35
Decrease 4 1 1 2 0
NOTE: Increases and decreases are changes that are statistically different from zero (p < .05). Changes that are not statistically different from zero are designated as “no change.”SOURCE: U.S. Department of Education, Institute of Education Sciences, National Center for Education Statistics, National Assessment of Educational Progress (NAEP) 2005, 2007, and 2009 Mathematics and Reading Assessments.
➤ ➤
Over 2007-09, most jurisdictions (34 to 40 out of 51 depending on the grade and subject area) did not have a change in inclusion rates.Among those jurisdictions that did have a change over 2007-09 in a given grade or subject, most increased in inclusiveness (minimum of 13 out of 15 in grade 4 reading; maximum of 16 out of 16 in grade 8 reading).
Full results are provided at: http://nces.ed.gov/nationsreportcard/studies/inclusion/.
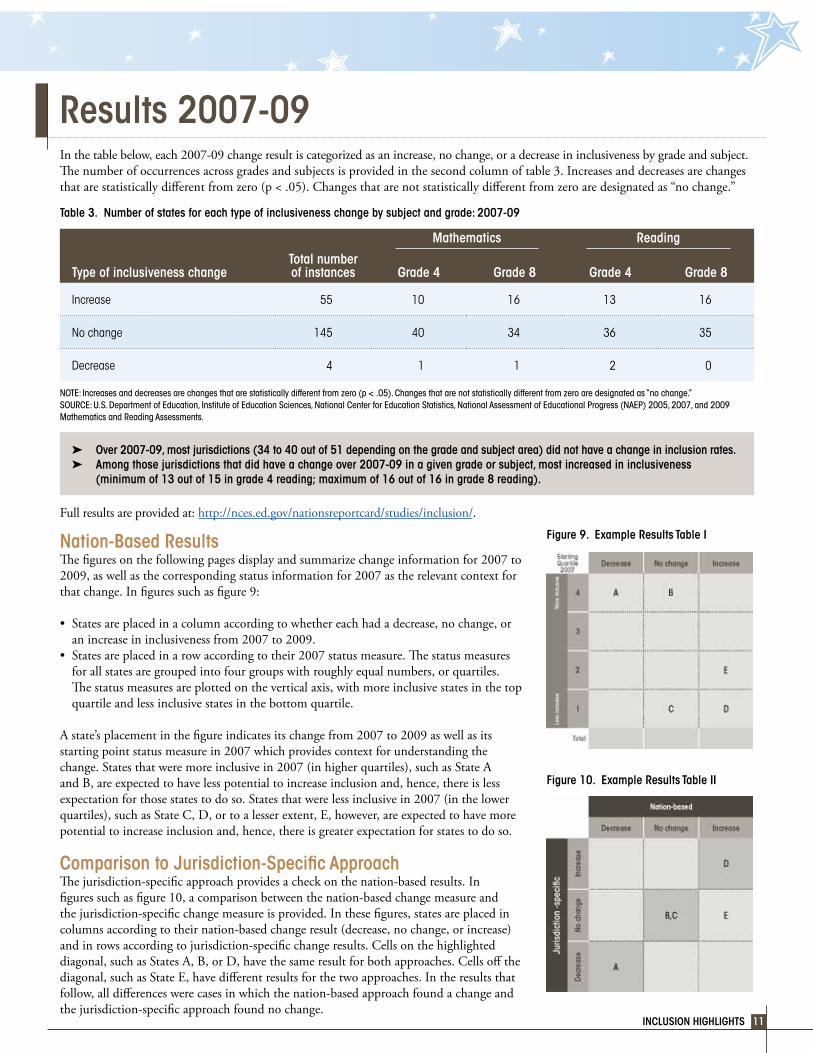
Nation-Based ResultsThefiguresonthefollowingpagesdisplayandsummarizechangeinformationfor2007to2009, as well as the corresponding status information for 2007 as the relevant context for thatchange.Infiguressuchasfigure9:
• Statesareplacedinacolumnaccordingtowhethereachhadadecrease,nochange,oran increase in inclusiveness from 2007 to 2009.
• Statesareplacedinarowaccordingtotheir2007statusmeasure.Thestatusmeasuresfor all states are grouped into four groups with roughly equal numbers, or quartiles. Thestatusmeasuresareplottedontheverticalaxis,withmoreinclusivestatesinthetopquartile and less inclusive states in the bottom quartile.
Astate’splacementinthefigureindicatesitschangefrom2007to2009aswellasitsstarting point status measure in 2007 which provides context for understanding the change. States that were more inclusive in 2007 (in higher quartiles), such as State A and B, are expected to have less potential to increase inclusion and, hence, there is less expectation for those states to do so. States that were less inclusive in 2007 (in the lower quartiles),suchasStateC,D,ortoalesserextent,E,however,areexpectedtohavemorepotential to increase inclusion and, hence, there is greater expectation for states to do so.
Comparison to Jurisdiction-Specific ApproachThejurisdiction-specificapproachprovidesacheckonthenation-basedresults.Infiguressuchasfigure10,acomparisonbetweenthenation-basedchangemeasureandthejurisdiction-specificchangemeasureisprovided.Inthesefigures,statesareplacedincolumnsaccordingtotheirnation-basedchangeresult(decrease,nochange,orincrease)andinrowsaccordingtojurisdiction-specificchangeresults.Cellsonthehighlighteddiagonal,suchasStatesA,B,orD,havethesameresultforbothapproaches.Cellsoffthediagonal,suchasStateE,havedifferentresultsforthetwoapproaches.Intheresultsthatfollow,alldifferenceswerecasesinwhichthenation-basedapproachfoundachangeandthejurisdiction-specificapproachfoundnochange.
Figure 10. Example Results Table II
Figure 9. Example Results Table I
NATIONAL ASSESSMENT OF EDUCATIONAL PROGRESS12
Mathematics Grade 4—Results 2007-09
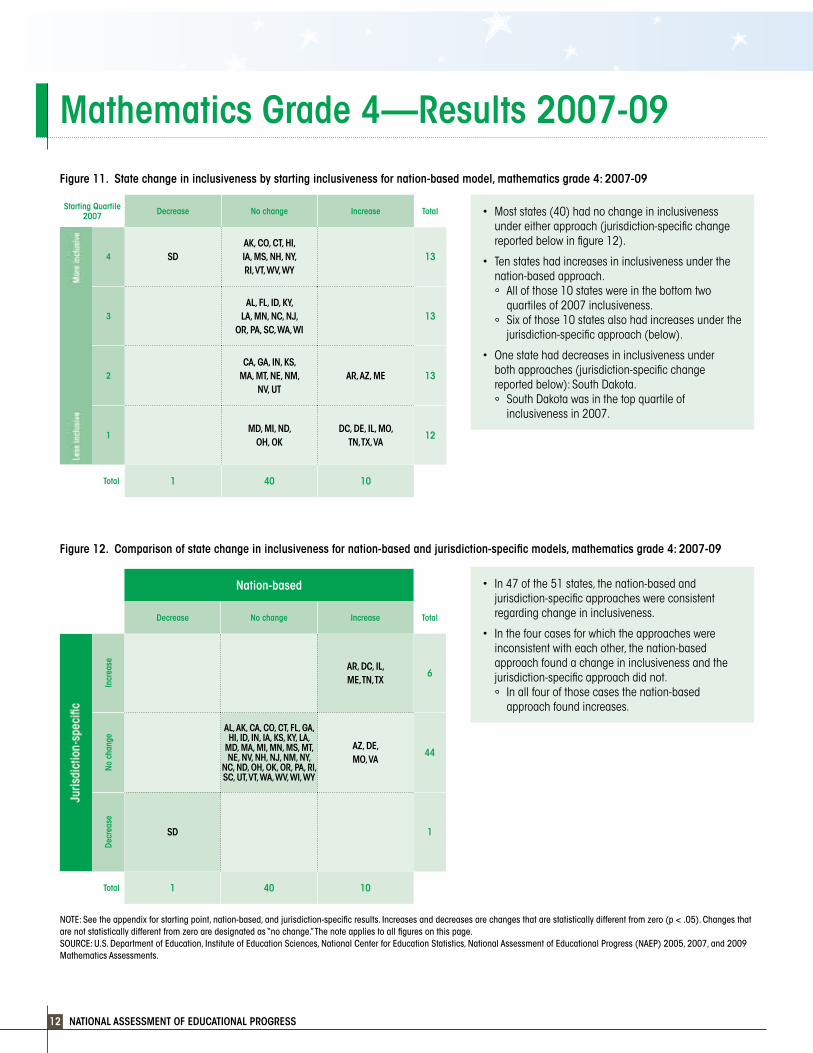
Figure 11. State change in inclusiveness by starting inclusiveness for nation-based model, mathematics grade 4: 2007-09
• Moststates(40)hadnochangeininclusivenessunder either approach (jurisdiction-specific change reported below in figure 12).
• Tenstateshadincreasesininclusivenessunderthenation-based approach. All of those 10 states were in the bottom two
quartiles of 2007 inclusiveness. Sixofthose10statesalsohadincreasesunderthe
jurisdiction-specific approach (below).
• Onestatehaddecreasesininclusivenessunder both approaches (jurisdiction-specific change reportedbelow):SouthDakota. SouthDakotawasinthetopquartileof
inclusiveness in 2007.
Starting Quartile 2007 Decrease No change Increase Total
More
inclusive 4 SD
AK, CO, CT, HI, IA, MS, NH, NY, RI, VT, WV, WY
13
3 AL, FL, ID, KY,
LA, MN, NC, NJ, OR, PA, SC, WA, WI
13
2 CA, GA, IN, KS,
MA, MT, NE, NM, NV, UT
AR, AZ, ME 13
Less
inclusive 1
MD, MI, ND, OH, OK
DC, DE, IL, MO, TN, TX, VA
12
Total 1 40 10
Figure 12. Comparison of state change in inclusiveness for nation-based and jurisdiction-specific models, mathematics grade 4: 2007-09
• In47ofthe51states,thenation-basedandjurisdiction-specific approaches were consistent regarding change in inclusiveness.
• Inthefourcasesforwhichtheapproacheswereinconsistent with each other, the nation-based approach found a change in inclusiveness and the jurisdiction-specific approach did not. In all four of those cases the nation-based
approach found increases.
Nation-based
Decrease No change Increase Total
Juris
dict
ion-
spec
ific
Incr
ease
AR, DC, IL, ME, TN, TX
6
Juris
dict
ion-
spec
ific
No c
hang
e
AL, AK, CA, CO, CT, FL, GA, HI, ID, IN, IA, KS, KY, LA,
MD, MA, MI, MN, MS, MT, NE, NV, NH, NJ, NM, NY,
NC, ND, OH, OK, OR, PA, RI, SC, UT, VT, WA, WV, WI, WY
AZ, DE, MO, VA
44
Juris
dict
ion-
spec
ific
Decr
ease
SD 1
Total 1 40 10
NOTE: See the appendix for starting point, nation-based, and jurisdiction-specific results. Increases and decreases are changes that are statistically different from zero (p < .05). Changes that are not statistically different from zero are designated as “no change.” The note applies to all figures on this page.SOURCE: U.S. Department of Education, Institute of Education Sciences, National Center for Education Statistics, National Assessment of Educational Progress (NAEP) 2005, 2007, and 2009 Mathematics Assessments.

INCLUSION HIGHLIGHTS 13
Mathematics Grade 8—Results 2007-09
Figure 13. State change in inclusiveness by starting inclusiveness for nation-based model, mathematics grade 8: 2007-09
Starting Quartile 2007 Decrease No change Increase Total
More inclusive
4 CTCO, FL, HI, ID,
MN, NC, NH, NM, RI, WV, WY
AR 13
3 AL, CA, IA, MT, NE, NJ, NY, OR,
PA, SD, UTVT, WI 13
2 AK, IN, KS, MI,
MO, MS, NV, OHAZ, IL, LA, ME, WA
13
Less
inclusive 1
MD, ND, SC, TX
DC, DE, GA, KY, MA, OK, TN, VA
12
Total 1 34 16
• Moststates(34)hadnochangeininclusivenessunder either approach (jurisdiction-specific change reported below in figure 14).
• Sixteenstateshadincreasesininclusivenessunderthe nation-based approach. Nine of those 16 also had increases under the
jurisdiction-specific approach (below).
• Onestatehadadecreaseininclusivenessunderthenation-basedapproach:Connecticut. Connecticut was in the top quartile of
inclusiveness in 2007. Connecticut did not show a decrease under the
jurisdiction-specific approach (below).
Figure 14. Comparison of state change in inclusiveness for nation-based and jurisdiction-specific models, mathematics grade 8: 2007-09
Nation-based
Decrease No change Increase Total
Juris
dict
ion-
spec
ific
Incr
ease
DE, DC, GA, IL, ME, MA, TN, VT, VA
9
Juris
dict
ion-
spec
ific
No c
hang
e
CT
AL, AK, CA, CO, FL, HI, ID, IN, IA, KS, MD, MI, MN, MS, MO, MT, NE,
NV, NH, NJ, NM, NY, NC, ND, OH, OR, PA, RI, SC,
SD, TX, UT, WV, WY
AZ, AR, KY, LA, OK, WA, WI
42
Juris
dict
ion-
spec
ific
Decr
ease
0
Total 1 34 16
• In43ofthe51states,thenation-basedandjurisdiction-specific approaches were consistent regarding change in inclusiveness.
• Intheeightcasesforwhichtheapproacheswereinconsistent with each other, the nation-based approach found a change in inclusiveness and the jurisdiction-specific approach did not. In one of the eight cases the nation-based
approach found a decrease. In the remaining seven of the eight cases the
nation-based approach found increases.
NOTE: See the appendix for starting point, nation-based, and jurisdiction-specific results. Increases and decreases are changes that are statistically different from zero (p < .05). Changes that are not statistically different from zero are designated as “no change.” The note applies to all figures on this page.SOURCE: U.S. Department of Education, Institute of Education Sciences, National Center for Education Statistics, National Assessment of Educational Progress (NAEP) 2005, 2007, and 2009 Mathematics Assessments.
NATIONAL ASSESSMENT OF EDUCATIONAL PROGRESS14
Reading Grade 4—Results 2007-09
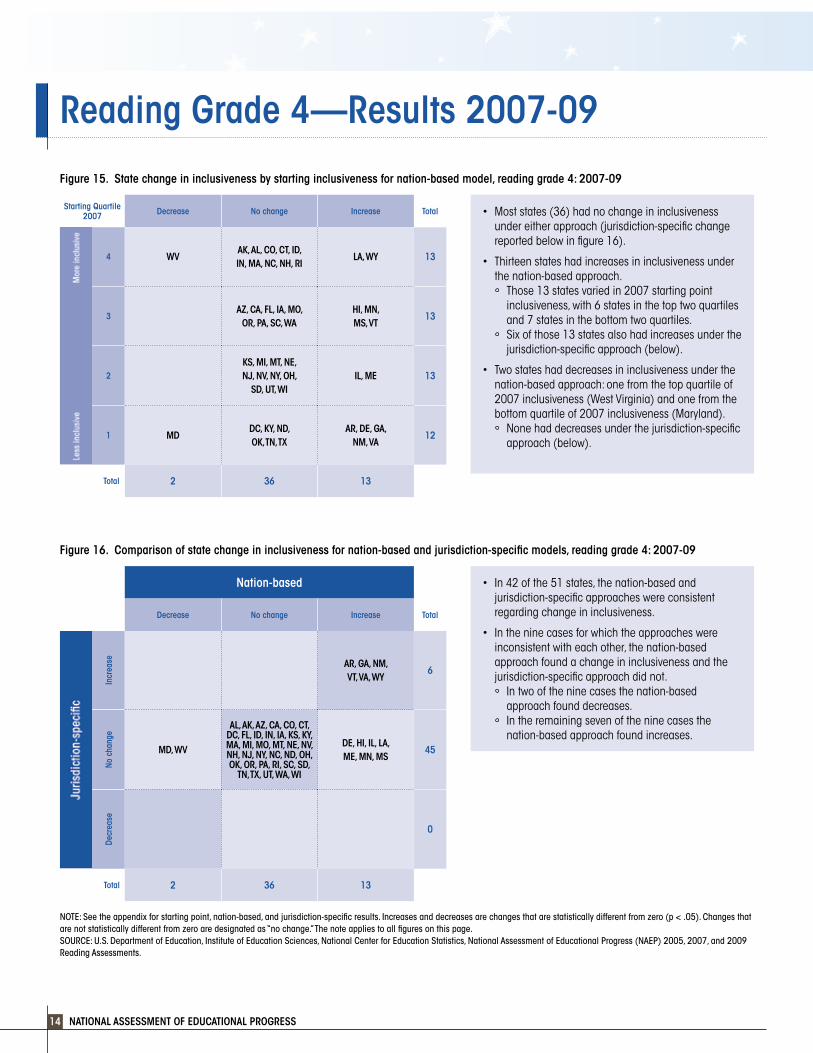
Figure 15. State change in inclusiveness by starting inclusiveness for nation-based model, reading grade 4: 2007-09
• Moststates(36)hadnochangeininclusivenessunder either approach (jurisdiction-specific change reported below in figure 16).
• Thirteenstateshadincreasesininclusivenessunderthe nation-based approach. Those 13 states varied in 2007 starting point
Starting Quartile 2007 Decrease No change Increase Total
More inclusive
4 WVAK, AL, CO, CT, ID, IN, MA, NC, NH, RI
LA, WY 13
3 AZ, CA, FL, IA, MO,
OR, PA, SC, WAHI, MN, MS, VT
13
2 KS, MI, MT, NE, NJ, NV, NY, OH,
SD, UT, WIIL, ME 13
Less
inclusive 1 MD
DC, KY, ND, OK, TN, TX
AR, DE, GA, NM, VA
12
Total 2 36 13
inclusiveness, with 6 states in the top two quartiles and 7 states in the bottom two quartiles.
Sixofthose13statesalsohadincreasesunderthejurisdiction-specific approach (below).
• Twostateshaddecreasesininclusivenessunderthenation-basedapproach:onefromthetopquartileof2007 inclusiveness (West Virginia) and one from the bottomquartileof2007inclusiveness(Maryland). None had decreases under the jurisdiction-specific
approach (below).
Figure 16. Comparison of state change in inclusiveness for nation-based and jurisdiction-specific models, reading grade 4: 2007-09
Nation-based
Decrease No change Increase Total
Juris
dict
ion-
spec
ific
Incr
ease
AR, GA, NM, VT, VA, WY
6
Juris
dict
ion-
spec
ific
No c
hang
e
MD, WV
AL, AK, AZ, CA, CO, CT, DC, FL, ID, IN, IA, KS, KY, MA, MI, MO, MT, NE, NV, NH, NJ, NY, NC, ND, OH, OK, OR, PA, RI, SC, SD,
TN, TX, UT, WA, WI
DE, HI, IL, LA, ME, MN, MS
45
Juris
dict
ion-
spec
ific
Decr
ease
0
Total 2 36 13
• In42ofthe51states,thenation-basedandjurisdiction-specific approaches were consistent regarding change in inclusiveness.
• Intheninecasesforwhichtheapproacheswereinconsistent with each other, the nation-based approach found a change in inclusiveness and the jurisdiction-specific approach did not. In two of the nine cases the nation-based
approach found decreases. In the remaining seven of the nine cases the
nation-based approach found increases.
NOTE: See the appendix for starting point, nation-based, and jurisdiction-specific results. Increases and decreases are changes that are statistically different from zero (p < .05). Changes that are not statistically different from zero are designated as “no change.” The note applies to all figures on this page.SOURCE: U.S. Department of Education, Institute of Education Sciences, National Center for Education Statistics, National Assessment of Educational Progress (NAEP) 2005, 2007, and 2009 Reading Assessments.

INCLUSION HIGHLIGHTS 15
Reading Grade 8—Results 2007-09
Figure 17. State change in inclusiveness by starting inclusiveness for nation-based model, reading grade 8: 2007-09
• Moststates(35)hadnochangeininclusivenessunder either approach (jurisdiction-specific change reported below in figure 18).
• Sixteenstateshadincreasesininclusivenessunderthe nation-based approach. While those states were mostly concentrated in the
lower two quartiles of 2007 inclusiveness, 6 of the 16 states were in the top two quartiles.
Nine of those 16 states also had increases under the jurisdiction-specific approach (below).
• Nostateshaddecreasesininclusivenessundereither approach (jurisdiction-specific change reported below).
Starting Quartile 2007 Decrease No change Increase Total
More
inclusive 4
AK, CA, CO, CT, FL, HI, LA, NC,
NH, OR, WV, WYRI 13
3 IL, IA, IN, MN,
MO, MA, NE, NVAL, DE, ID,
PA, VT13
2 KS, MI, MT, NJ, NY, OH, UT, WI
AR, AZ, ME, MS, WA
13
Less
inclusive 1
DC, KY, MD, ND, OK, SC, TN
GA, NM, SD, TX, VA
12
Total 0 35 16
Figure 18. Comparison of state change in inclusiveness for nation-based and jurisdiction-specific models, reading grade 8: 2007-09
Nation-based
Decrease No change Increase Total
Juris
dict
ion-
spec
ific
Incr
ease
AL, AR, DE, GA, ME,
MS, SD, VT, VA 9
Juris
dict
ion-
spec
ific
No c
hang
e
AK, CA, CO, CT, DC, FL, HI, IL, IN, IA, KS, KY, LA, MD, MA, MI, MN, MO,
MT, NE, NV, NH, NJ, NY, NC, ND, OH, OK, OR,
SC, TN, UT, WV, WI, WY
AZ, ID, NM, PA, RI, TX, WA
42
Juris
dict
ion-
spec
ific
Decr
ease
0
Total 0 35 16
• In44ofthe51states,thenation-basedandjurisdiction-specific approaches were consistent regarding change in inclusiveness.
• Inthesevencasesforwhichtheapproacheswereinconsistent with each other, the nation-based approach found increases in inclusiveness and the jurisdiction-specific approach did not.
NOTE: See the appendix for starting point, nation-based, and jurisdiction-specific results. Increases and decreases are changes that are statistically different from zero (p < .05). Changes that are not statistically different from zero are designated as “no change.” The note applies to all figures on this page.SOURCE: U.S. Department of Education, Institute of Education Sciences, National Center for Education Statistics, National Assessment of Educational Progress (NAEP) 2005, 2007, and 2009 Reading Assessments.
NATIONAL ASSESSMENT OF EDUCATIONAL PROGRESS16
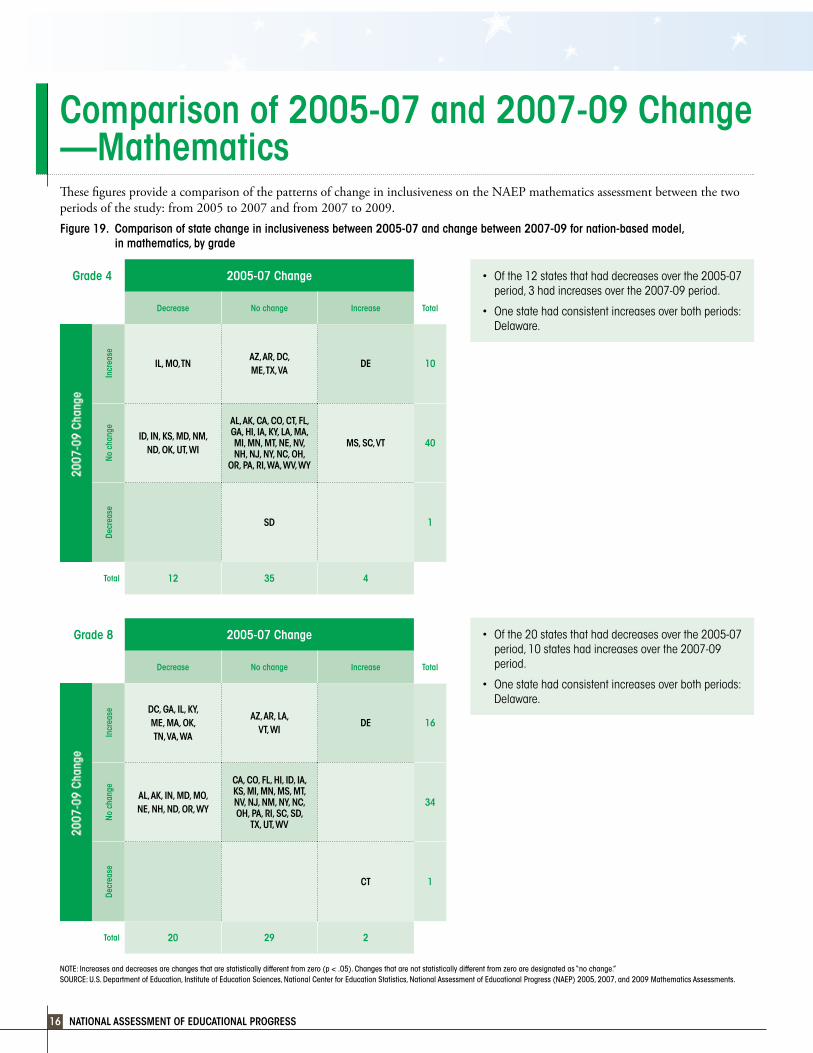
Comparison of 2005-07 and 2007-09 Change —MathematicsThesefiguresprovideacomparisonofthepatternsofchangeininclusivenessontheNAEPmathematicsassessmentbetweenthetwoperiods of the study: from 2005 to 2007 and from 2007 to 2009.Figure 19. Comparison of state change in inclusiveness between 2005-07 and change between 2007-09 for nation-based model,
in mathematics, by grade
• Ofthe12statesthathaddecreasesoverthe2005-07period, 3 had increases over the 2007-09 period.
• Onestatehadconsistentincreasesoverbothperiods:Delaware.
Grade 4 2005-07 Change
Decrease No change Increase Total
2007
-09
Chan
ge
Incr
ease
IL, MO, TNAZ, AR, DC, ME, TX, VA
DE 10
2007
-09
Chan
ge
No c
hang
e
ID, IN, KS, MD, NM, ND, OK, UT, WI
AL, AK, CA, CO, CT, FL, GA, HI, IA, KY, LA, MA, MI, MN, MT, NE, NV, NH, NJ, NY, NC, OH,
OR, PA, RI, WA, WV, WY
MS, SC, VT 40
2007
-09
Chan
ge
Decr
ease
SD 1
Total 12 35 4
Grade 8 2005-07 Change
Decrease No change Increase Total
2007
-09
Chan
ge
Incr
ease DC, GA, IL, KY,
ME, MA, OK, TN, VA, WA
AZ, AR, LA, VT, WI
DE 16
2007
-09
Chan
ge
No c
hang
e
AL, AK, IN, MD, MO, NE, NH, ND, OR, WY
CA, CO, FL, HI, ID, IA, KS, MI, MN, MS, MT, NV, NJ, NM, NY, NC, OH, PA, RI, SC, SD,
TX, UT, WV
34
2007
-09
Chan
ge
Decr
ease
CT 1
Total 20 29 2
• Ofthe20statesthathaddecreasesoverthe2005-07period, 10 states had increases over the 2007-09 period.
• Onestatehadconsistentincreasesoverbothperiods:Delaware.
NOTE: Increases and decreases are changes that are statistically different from zero (p < .05). Changes that are not statistically different from zero are designated as “no change.”SOURCE: U.S. Department of Education, Institute of Education Sciences, National Center for Education Statistics, National Assessment of Educational Progress (NAEP) 2005, 2007, and 2009 Mathematics Assessments.
INCLUSION HIGHLIGHTS 17
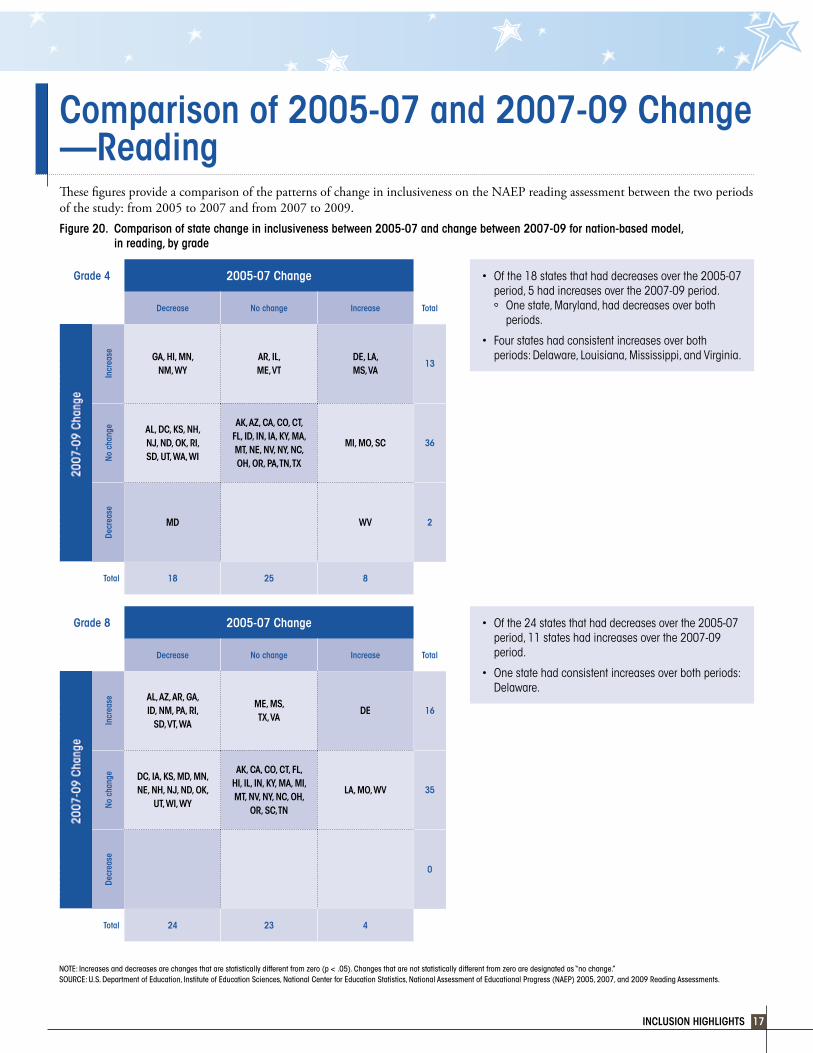
Comparison of 2005-07 and 2007-09 Change —ReadingThesefiguresprovideacomparisonofthepatternsofchangeininclusivenessontheNAEPreadingassessmentbetweenthetwoperiodsof the study: from 2005 to 2007 and from 2007 to 2009.Figure 20. Comparison of state change in inclusiveness between 2005-07 and change between 2007-09 for nation-based model,
in reading, by grade
Grade 4 2005-07 Change
Decrease No change Increase Total
2007
-09
Chan
ge
Incr
ease GA, HI, MN,
NM, WYAR, IL, ME, VT
DE, LA, MS, VA
13
2007
-09
Chan
ge
No c
hang
e AL, DC, KS, NH, NJ, ND, OK, RI, SD, UT, WA, WI
AK, AZ, CA, CO, CT, FL, ID, IN, IA, KY, MA, MT, NE, NV, NY, NC, OH, OR, PA, TN, TX
MI, MO, SC 36
2007
-09
Chan
ge
Decr
ease
MD WV 2
Total 18 25 8
• Ofthe18statesthathaddecreasesoverthe2005-07period, 5 had increases over the 2007-09 period. Onestate,Maryland,haddecreasesoverboth
periods.
• Fourstateshadconsistentincreasesoverbothperiods:Delaware,Louisiana,Mississippi,andVirginia.
Grade 8 2005-07 Change
Decrease No change Increase Total
2007
-09
Chan
ge
Incr
ease AL, AZ, AR, GA,
ID, NM, PA, RI, SD, VT, WA
ME, MS, TX, VA
DE 16
2007
-09
Chan
ge
No c
hang
e DC, IA, KS, MD, MN, NE, NH, NJ, ND, OK,
UT, WI, WY
AK, CA, CO, CT, FL, HI, IL, IN, KY, MA, MI, MT, NV, NY, NC, OH,
OR, SC, TN
LA, MO, WV 35
2007
-09
Chan
ge
Decr
ease
0
Total 24 23 4
• Ofthe24statesthathaddecreasesoverthe2005-07period, 11 states had increases over the 2007-09 period.
• Onestatehadconsistentincreasesoverbothperiods:Delaware.
NOTE: Increases and decreases are changes that are statistically different from zero (p < .05). Changes that are not statistically different from zero are designated as “no change.”SOURCE: U.S. Department of Education, Institute of Education Sciences, National Center for Education Statistics, National Assessment of Educational Progress (NAEP) 2005, 2007, and 2009 Reading Assessments.
NATIONAL ASSESSMENT OF EDUCATIONAL PROGRESS18
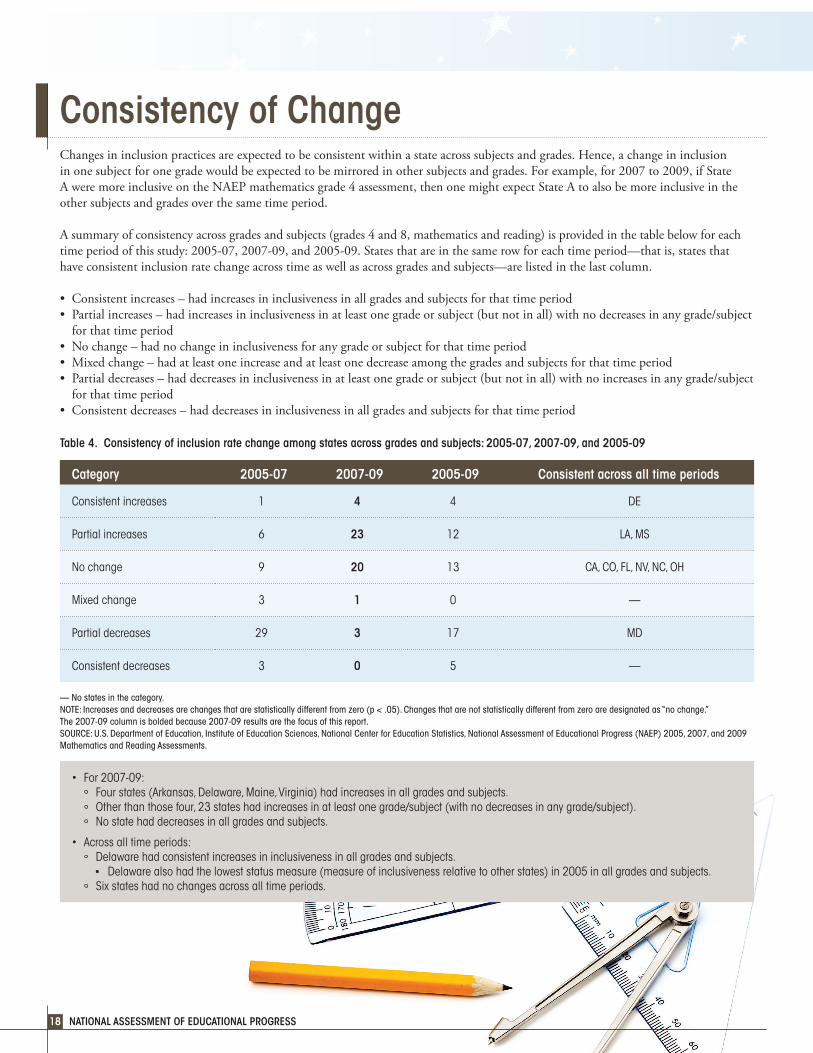
Changes in inclusion practices are expected to be consistent within a state across subjects and grades. Hence, a change in inclusion in one subject for one grade would be expected to be mirrored in other subjects and grades. For example, for 2007 to 2009, if State A were more inclusive on the NAEP mathematics grade 4 assessment, then one might expect State A to also be more inclusive in the other subjects and grades over the same time period.
A summary of consistency across grades and subjects (grades 4 and 8, mathematics and reading) is provided in the table below for each time period of this study: 2005-07, 2007-09, and 2005-09. States that are in the same row for each time period—that is, states that have consistent inclusion rate change across time as well as across grades and subjects—are listed in the last column.
• Consistentincreases–hadincreasesininclusivenessinallgradesandsubjectsforthattimeperiod• Partialincreases–hadincreasesininclusivenessinatleastonegradeorsubject(butnotinall)withnodecreasesinanygrade/subject
for that time period• Nochange–hadnochangeininclusivenessforanygradeorsubjectforthattimeperiod• Mixedchange–hadatleastoneincreaseandatleastonedecreaseamongthegradesandsubjectsforthattimeperiod• Partialdecreases–haddecreasesininclusivenessinatleastonegradeorsubject(butnotinall)withnoincreasesinanygrade/subject
for that time period• Consistentdecreases–haddecreasesininclusivenessinallgradesandsubjectsforthattimeperiod
Consistency of Change
• For2007-09: Fourstates(Arkansas,Delaware,Maine,Virginia)hadincreasesinallgradesandsubjects. Otherthanthosefour,23stateshadincreasesinatleastonegrade/subject(withnodecreasesinanygrade/subject). Nostatehaddecreasesinallgradesandsubjects.
• Acrossalltimeperiods: Delawarehadconsistentincreasesininclusivenessinallgradesandsubjects.
■ Delawarealsohadtheloweststatusmeasure(measureofinclusivenessrelativetootherstates)in2005inallgradesandsubjects. Sixstateshadnochangesacrossalltimeperiods.
Table 4. Consistency of inclusion rate change among states across grades and subjects: 2005-07, 2007-09, and 2005-09
— No states in the category. NOTE: Increases and decreases are changes that are statistically different from zero (p < .05). Changes that are not statistically different from zero are designated as “no change.” The 2007-09 column is bolded because 2007-09 results are the focus of this report.SOURCE: U.S. Department of Education, Institute of Education Sciences, National Center for Education Statistics, National Assessment of Educational Progress (NAEP) 2005, 2007, and 2009 Mathematics and Reading Assessments.
Category 2005-07 2007-09 2005-09 Consistent across all time periods
Consistentincreases 1 4 4 DE
Partialincreases 6 23 12 LA,MS
Nochange 9 20 13 CA,CO,FL,NV,NC,OH
Mixedchange 3 1 0 —
Partialdecreases 29 3 17 MD
Consistentdecreases 3 0 5 —

INCLUSION HIGHLIGHTS 19
Table 5. Change in inclusiveness using the nation-based approach by grade, subject, and time period, by state: 2005-07, 2007-09, and 2005-09
NOTE: M = mathematics, R = reading, 4 = grade 4, 8 = grade 8; + = significant increase, – = significant decrease, blank cell = no significant change.SOURCE: U.S. Department of Education, Institute of Education Sciences, National Center for Education Statistics, National Assessment of Educational Progress (NAEP) 2005, 2007, and 2009 Mathematics and Reading Assessments.
2005-07 2007-09 2005-09
State M4 M8 R4 R8 M4 M8 R4 R8 M4 M8 R4 R8Alabama – – – + – – Alaska – – Arizona – + + + + + Arkansas – + + + + + +California Colorado Connecticut + – Delaware + + + + + + + + + + + +District of Columbia – – – + + – –Florida Georgia – – – + + + – Hawaii – + Idaho – – + – Illinois – – + + + + Indiana – – – – – –Iowa – –Kansas – – – – – –Kentucky – + – Louisiana + + + + + + + +Maine – + + + + + + + +Maryland – – – – – – – – –Massachusetts – + Michigan + + Minnesota – – + –Mississippi + + + + + + + +Missouri – – + + + + +Montana – Nebraska – – – – –Nevada New Hampshire – – – – –New Jersey – – – –New Mexico – – – + + – – New York + North Carolina North Dakota – – – – – – – –Ohio Oklahoma – – – – + – – – –Oregon – + Pennsylvania – + Rhode Island – – + – South Carolina + + + South Dakota – – – + – – –Tennessee – – + + Texas + + + Utah – – – – – – –Vermont + – + + + + + + Virginia – + + + + + + + +Washington – – – + + West Virginia + + – + + +Wisconsin – – – + Wyoming – – – + –
NATIONAL ASSESSMENT OF EDUCATIONAL PROGRESS20
Endnotes and References
Endnotes1 StudentswithdisabilitieswhoarecoveredbythefederalIndividualswithDisabilitiesEducationAct(IDEA)arerequiredtohaveanIEP.TheIEPisdevelopedbyacommitteetoprovideguidanceconcerningthestudent’sinstruction.TheIEPisalegaldocument.SomestudentswithdisabilitiesarenotcoveredbyIDEAbutarecoveredunderSection504oftheRehabilitationAct.Thislegislationprovides individuals with disabilities such as a physical or mental impairment with protection against discrimination in all federally assisted programs and activities.
ReferencesForgioneJr.,P.D.(1999).Issues Surrounding the Release of the 1998 NAEP Reading Report Card. Testimony to the Committee
onEducationandtheWorkforce,U.S.HouseofRepresentatives,onMay27,1999.RetrievedonMarch16,2006from:http://www.house.gov/ed_workforce/hearings/106th/oi/naep52799/forgione.htm.
Kitmitto, S., and Bandeira de Mello, V. (2009). Measuring the Status and Change of NAEP State Inclusion Rates for Students with Disabilities(NCES2009-453).NationalCenterforEducationStatistics,InstituteofEducationSciences,U.S.Department ofEducation.Washington,DC.
McLaughlin,D.H.(2000).Protecting State NAEP Trends from Changes in SD/LEP Inclusion Rates(ReporttotheNationalInstitute ofStatisticalSciences).PaloAlto,CA:AmericanInstitutesforResearch.
McLaughlin,D.H.(2001).Exclusions and Accommodations Affect State NAEP Gain Statistics: Mathematics, 1996 to 2000 (appendix to chapter4intheNAEPValidityStudiesReportonResearchPriorities).PaloAlto,CA:AmericanInstitutesforResearch.
McLaughlin,D.H.(2003).Full-Population Estimates of Reading Gains Between 1998 and 2002(ReporttoNCESsupportinginclusionof full population estimates in the report of the 2002 NAEP reading assessment). Palo Alto, CA: American Institutes for Research.
U.S. General Accounting Office. (2005). No Child Left Behind Act: Most Students With Disabilities Participated in Statewide Assessments, but Inclusion Options Could Be Improved,NSIAD-95-42.Washington,DC:GeneralAccountingOffice.RetrievedonJuly5,2011 from: http://www.gao.gov/products/GAO-05-618.

Appendices

NATIONAL ASSESSMENT OF EDUCATIONAL PROGRESSA-1
Appendix A. Mathematics Results—2007-09Table A-1. State starting point inclusiveness and change in inclusiveness for the nation-based and jurisdiction-specific approaches, mathematics:
2007-09
Mathematics Grade 4
StateStarting
point quartile
Starting point
Nation-based
Jurisdiction-specific
Alaska 4 8.6 -0.6 -0.8SouthDakota 4 6.8 -5.2* -5.9*Wyoming 4 6.6 0.4 1.6Rhode Island 4 6.3 -0.9 1.1Hawaii 4 6.2 -0.6 -1.5Mississippi 4 6.0 -0.2 1.6Iowa 4 5.9 -0.8 -4.4Colorado 4 5.9 0.8 -0.1New York 4 5.5 2.8 3.0Vermont 4 5.2 1.7 2.9Connecticut 4 5.1 -3.7 0.3NewHampshire 4 5.1 1.3 0.7West Virginia 4 4.4 1.4 -1.8Oregon 3 4.3 -2.1 -0.2Alabama 3 4.3 2.8 1.6North Carolina 3 3.9 -3.0 -3.4New Jersey 3 3.6 -1.3 -2.8Pennsylvania 3 3.3 -1.6 -1.5Florida 3 3.3 0.4 2.1Idaho 3 3.2 1.4 3.1Minnesota 3 2.9 1.5 1.3SouthCarolina 3 2.5 -1.3 -1.4Louisiana 3 2.4 2.3 -1.3Kentucky 3 1.7 -3.3 -3.7Wisconsin 3 1.7 2.8 3.2Washington 3 1.6 2.6 2.6Nevada 2 1.3 -2.4 0.9Montana 2 1.1 1.5 2.6Maine 2 1.0 7.7* 8.1*Indiana 2 0.7 -1.6 -1.4NewMexico 2 0.5 -1.4 -3.3Utah 2 0.2 -0.4 -2.2California 2 0.1 -1.1 -1.1Arkansas 2 -0.1 7.1* 8.4*Nebraska 2 -0.4 -0.9 -0.4Arizona 2 -0.6 7.6* 9.1Georgia 2 -0.7 2.9 1.7Kansas 2 -1.7 -0.8 -2.6Massachusetts 2 -4.7 2.5 2.6North Dakota 1 -5.4 -0.3 -2.7Missouri 1 -5.6 6.2* 5.6Illinois 1 -5.7 9.1* 11.2*Delaware 1 -6.3 8.9* 8.0Michigan 1 -6.5 3.5 2.0Ohio 1 -6.9 7.2 5.4Virginia 1 -7.8 10.6* 7.2Maryland 1 -9.0 -2.8 -3.9District of Columbia 1 -12.9 7.7* 9.9*Oklahoma 1 -15.6 4.7 3.5Tennessee 1 -16.8 12.5* 15.2*Texas 1 -21.0 12.6* 12.1*
Mathematics Grade 8
StateStarting
point quartile
Starting point
Nation-based
Jurisdiction-specific
Connecticut 4 10.2 -5.5* -7.6Colorado 4 9.1 -4.9 -3.9Hawaii 4 8.0 0.3 -0.8Idaho 4 7.6 -1.5 -1.8West Virginia 4 7.5 0.3 0.2NewMexico 4 6.3 -4.8 -3.7North Carolina 4 5.6 0.8 0.1Wyoming 4 4.9 1.4 3.5Minnesota 4 4.9 -2.1 -2.2NewHampshire 4 4.0 1.2 1.5Rhode Island 4 3.9 2.2 1.2Arkansas 4 3.5 6.3* 8.1Florida 4 3.2 1.9 2.6SouthDakota 3 2.8 0.1 1.2Oregon 3 2.4 0.2 3.8Vermont 3 2.3 6.4* 6.6*New Jersey 3 2.3 1.6 3.1Iowa 3 2.2 -1.0 -0.1Nebraska 3 0.6 -5.0 -5.3Utah 3 0.5 -6.4 -3.8Alabama 3 0.1 5.2 9.2California 3 0.1 3.5 5.7Montana 3 0.0 -1.5 -0.3Pennsylvania 3 -0.8 2.0 0.6New York 3 -1.2 4.8 5.4Wisconsin 3 -2.2 7.9* 7.6Louisiana 2 -2.5 12.7* 12.4Kansas 2 -2.5 1.1 2.4Mississippi 2 -4.1 4.6 5.4Nevada 2 -4.2 1.7 5.8Arizona 2 -4.7 10.7* 8.5Maine 2 -6.1 15.0* 14.6*Washington 2 -6.2 9.4* 9.0Michigan 2 -7.7 3.7 5.2Missouri 2 -8.0 3.5 1.5Illinois 2 -9.0 10.7* 12.7*Alaska 2 -11.1 6.5 3.1Indiana 2 -12.8 0.0 -1.4Ohio 2 -14.4 5.4 8.8Delaware 1 -14.7 25.9* 24.7*North Dakota 1 -15.4 2.7 5.4Virginia 1 -16.8 15.2* 13.6*Kentucky 1 -17.0 9.9* 10.5SouthCarolina 1 -18.9 7.2 5.1Texas 1 -20.2 4.9 4.2Massachusetts 1 -22.0 18.2* 16.4*Tennessee 1 -25.1 16.5* 16.5*Georgia 1 -27.1 21.7* 20.1*District of Columbia 1 -29.1 21.4* 25.5*Oklahoma 1 -30.7 9.2* 11.5Maryland 1 -33.7 1.1 -0.9
* Statistically different from zero (p < .05).NOTE: Significance tests were performed only for the change measures.SOURCE: U.S. Department of Education, Institute of Education Sciences, National Center for Education Statistics, National Assessment of Educational Progress (NAEP) 2005, 2007, and 2009 Mathematics Assessments.

INCLUSION HIGHLIGHTS B-1
Appendix B. Reading Results—2007-09Table B-1. State starting point inclusiveness and change in inclusiveness for the nation-based and jurisdiction-specific approaches, reading:
2007-09
Reading Grade 4
StateStarting
point quartile
Starting point
Nation-based
Jurisdiction-specific
West Virginia 4 17.4 -4.0* -5.5North Carolina 4 12.5 -0.8 1.0Connecticut 4 9.9 -4.5 -2.7Alaska 4 9.8 6.3 6.8Rhode Island 4 9.0 1.0 -0.4Wyoming 4 8.7 7.2* 8.9*Colorado 4 8.1 -2.3 -2.5Louisiana 4 7.2 8.2* 10.1NewHampshire 4 6.8 4.3 4.5Alabama 4 6.4 5.5 7.2Indiana 4 5.5 -7.5 -3.8Idaho 4 5.5 -2.1 1.2Massachusetts 4 5.4 2.6 1.6Hawaii 3 4.3 12.2* 7.8Oregon 3 4.3 3.4 3.4Missouri 3 4.2 1.7 3.7Florida 3 3.3 3.8 5.9California 3 2.7 -1.2 -0.5Minnesota 3 2.4 8.8* 8.0Iowa 3 2.3 -1.1 -3.2Mississippi 3 1.9 7.3* 9.5Pennsylvania 3 1.9 7.2 7.5SouthCarolina 3 1.6 -5.3 -6.6Washington 3 1.4 4.4 6.0Arizona 3 1.4 5.2 6.9Vermont 3 1.2 11.5* 11.2*New York 2 0.5 6.2 6.2Wisconsin 2 0.4 5.3 5.5Nevada 2 0.0 2.4 4.0Nebraska 2 -0.9 3.1 3.4Maine 2 -1.0 10.0* 8.6Montana 2 -1.7 3.8 2.9Michigan 2 -2.0 2.5 0.3Illinois 2 -3.3 10.9* 11.0New Jersey 2 -5.1 -7.3 -8.1SouthDakota 2 -5.8 -3.6 -2.0Kansas 2 -7.9 6.6 4.1Utah 2 -8.2 -1.5 -2.4Ohio 2 -10.6 2.1 4.0Oklahoma 1 -11.3 -3.9 -1.3Delaware 1 -12.3 6.4* 5.1Virginia 1 -12.8 17.8* 12.9*Kentucky 1 -12.9 -0.4 0.4Arkansas 1 -14.7 34.0* 34.1*Maryland 1 -16.2 -7.1* -5.0NewMexico 1 -16.5 13.3* 15.0*North Dakota 1 -18.3 2.6 -2.0Texas 1 -19.5 7.4 3.2Georgia 1 -22.6 16.6* 14.1*Tennessee 1 -22.8 -0.3 -3.3District of Columbia 1 -31.5 0.6 -0.1
Reading Grade 8
StateStarting
point quartile
Starting point
Nation-based
Jurisdiction-specific
West Virginia 4 14.1 -0.7 2.1Alaska 4 12.0 2.9 1.9Connecticut 4 11.9 -4.8 -2.2Oregon 4 11.0 -1.1 -2.3Hawaii 4 9.5 3.0 2.4North Carolina 4 7.7 2.4 3.3Rhode Island 4 6.1 4.2* 3.1Wyoming 4 5.9 1.3 2.5Florida 4 5.8 -0.5 0.8Louisiana 4 5.1 8.9 10.8NewHampshire 4 4.9 2.2 2.9Colorado 4 3.3 1.9 1.2California 4 2.9 2.4 3.8Missouri 3 2.8 -0.4 -1.4Illinois 3 1.2 2.1 0.6Alabama 3 1.0 11.2* 11.8*Minnesota 3 -0.1 4.3 5.1Indiana 3 -0.2 -8.7 -8.2Pennsylvania 3 -0.8 8.6* 7.4Idaho 3 -0.8 7.9* 8.0Vermont 3 -1.1 12.2* 12.3*Massachusetts 3 -1.2 6.9 7.5Nevada 3 -2.0 7.3 7.6Delaware 3 -2.1 9.3* 10.8*Nebraska 3 -2.1 -6.6 -6.3Iowa 3 -2.8 -1.2 -0.1Maine 2 -3.9 11.9* 11.0*Montana 2 -4.0 2.1 0.1Wisconsin 2 -4.2 6.0 4.0Kansas 2 -4.5 0.3 -0.3New York 2 -6.5 -1.2 -3.2Washington 2 -6.9 12.8* 10.4Arizona 2 -7.2 14.8* 12.8Utah 2 -7.8 -2.8 -3.8New Jersey 2 -8.4 2.8 4.4Michigan 2 -9.5 5.1 4.5Arkansas 2 -10.2 24.9* 26.8*Ohio 2 -11.9 -0.3 -2.6Mississippi 2 -11.9 19.4* 20.2*NewMexico 1 -12.3 9.2* 6.0Oklahoma 1 -12.7 7.0 6.9SouthCarolina 1 -14.0 -1.0 -0.1Virginia 1 -15.4 20.2* 18.5*Texas 1 -16.4 8.0* 5.5Kentucky 1 -18.0 0.6 0.5Maryland 1 -18.7 -7.2 -6.0SouthDakota 1 -20.3 15.1* 13.9*Tennessee 1 -22.0 -2.0 -3.9Georgia 1 -23.1 18.9* 15.6*North Dakota 1 -26.2 1.9 1.3District of Columbia 1 -30.1 -6.1 -1.3
* Statistically different from zero (p < .05).NOTE: Significance tests were performed only for the change measures.SOURCE: U.S. Department of Education, Institute of Education Sciences, National Center for Education Statistics, National Assessment of Educational Progress (NAEP) 2005, 2007, and 2009 Reading Assessments.

NATIONAL ASSESSMENT OF EDUCATIONAL PROGRESSC-1
Appendix C. Supporting TablesTable C-1. Actual inclusion rate, nation-based benchmark inclusion rate, and difference for students with disabilities who are not English language
learners by state, mathematics grade 4: 2007 and 2009
2007 2009
State Actual Benchmark Difference Actual Benchmark DifferenceAlabama 88.3 84.0 4.3 90.4 83.3 7.1Alaska 91.3 82.7 8.6 93.3 85.3 8.0Arizona 83.4 84.0 -0.6 89.8 82.8 7.0Arkansas 79.8 79.9 -0.1 89.3 82.3 7.0California 83.9 83.9 0.1 85.1 86.2 -1.1Colorado 88.2 82.3 5.9 87.1 80.3 6.8Connecticut 89.7 84.5 5.1 87.3 85.9 1.4Delaware 73.1 79.4 -6.3 79.7 77.1 2.7District of Columbia 66.3 79.2 -12.9 74.1 79.3 -5.2Florida 88.3 85.0 3.3 90.1 86.5 3.7Georgia 83.5 84.2 -0.7 88.8 86.7 2.2Hawaii 90.5 84.3 6.2 88.7 83.1 5.6Idaho 86.3 83.1 3.2 89.9 85.2 4.6Illinois 77.6 83.3 -5.7 89.0 85.6 3.4Indiana 85.7 85.0 0.7 85.5 86.4 -1.0Iowa 90.0 84.0 5.9 87.9 82.7 5.2Kansas 78.9 80.7 -1.7 79.9 82.4 -2.5Kentucky 84.2 82.5 1.7 81.1 82.7 -1.6Louisiana 87.8 85.4 2.4 91.1 86.4 4.7Maine 83.7 82.7 1.0 92.4 83.6 8.8Maryland 72.7 81.7 -9.0 70.3 82.1 -11.8Massachusetts 74.3 79.0 -4.7 77.1 79.2 -2.2Michigan 76.1 82.6 -6.5 82.2 85.2 -3.0Minnesota 85.9 83.1 2.9 88.8 84.5 4.3Mississippi 92.3 86.3 6.0 92.1 86.3 5.8Missouri 76.6 82.2 -5.6 82.6 82.0 0.6Montana 81.7 80.6 1.1 86.5 83.9 2.6Nebraska 85.7 86.1 -0.4 86.7 88.0 -1.2Nevada 84.5 83.1 1.3 83.4 84.5 -1.0NewHampshire 88.7 83.7 5.1 89.2 82.8 6.4New Jersey 88.0 84.4 3.6 87.0 84.8 2.2NewMexico 83.2 82.7 0.5 83.1 84.0 -0.9New York 91.2 85.7 5.5 94.3 86.1 8.3North Carolina 89.7 85.7 3.9 86.6 85.7 0.9North Dakota 76.3 81.8 -5.4 77.3 83.0 -5.7Ohio 71.5 78.5 -6.9 81.3 81.0 0.3Oklahoma 67.8 83.4 -15.6 74.7 85.6 -10.8Oregon 85.8 81.5 4.3 85.3 83.0 2.3Pennsylvania 86.1 82.8 3.3 85.2 83.5 1.7Rhode Island 91.0 84.6 6.3 91.0 85.6 5.4SouthCarolina 88.1 85.7 2.5 87.8 86.6 1.1SouthDakota 92.2 85.4 6.8 87.0 85.4 1.6Tennessee 59.4 76.2 -16.8 75.8 80.1 -4.3Texas 62.8 83.9 -21.0 73.0 81.4 -8.4Utah 84.4 84.2 0.2 83.5 83.7 -0.2Vermont 86.4 81.1 5.2 89.2 82.3 6.9Virginia 74.1 81.9 -7.8 86.3 83.4 2.8Washington 85.7 84.1 1.6 87.3 83.1 4.2West Virginia 91.6 87.2 4.4 91.0 85.3 5.8Wisconsin 85.5 83.8 1.7 87.8 83.4 4.5Wyoming 89.6 83.1 6.6 93.4 86.4 7.0
NOTE: The difference in this table (the actual inclusion rate minus the nation-based benchmark inclusion rate) is also used in the report as the status measure.SOURCE: U.S. Department of Education, Institute of Education Sciences, National Center for Education Statistics, National Assessment of Educational Progress (NAEP) 2005, 2007, and 2009 Mathematics Assessments.
INCLUSION HIGHLIGHTS C-2
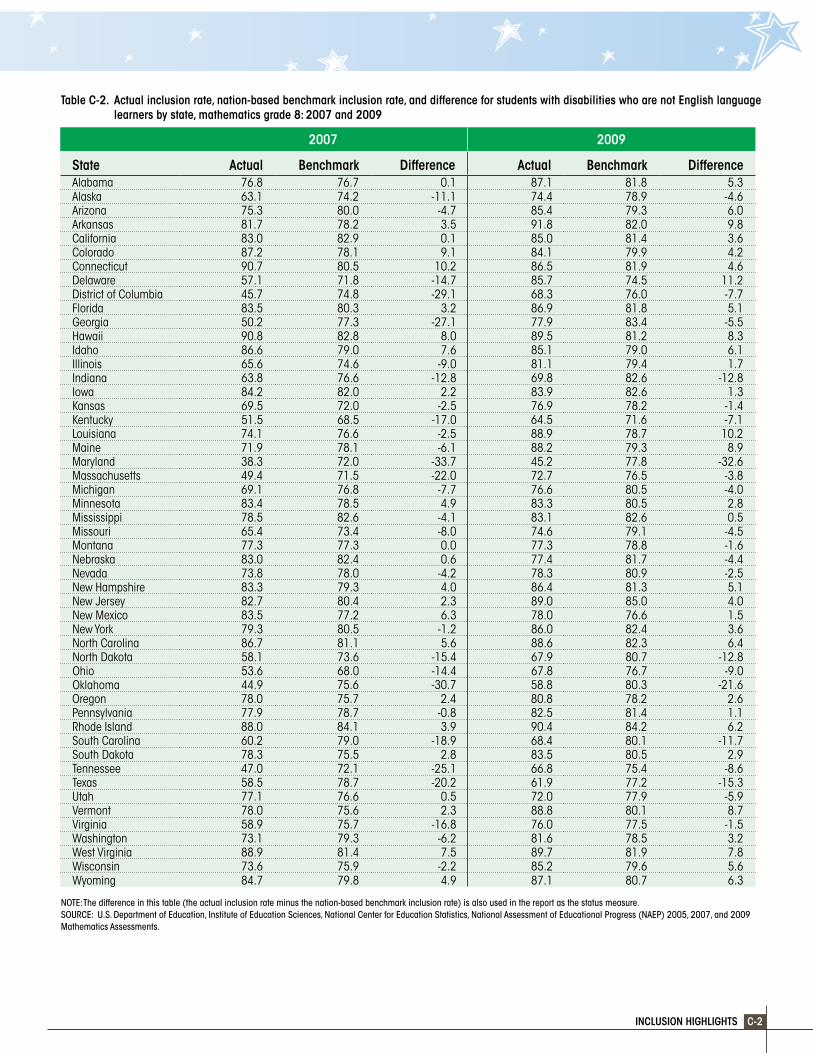
Table C-2. Actual inclusion rate, nation-based benchmark inclusion rate, and difference for students with disabilities who are not English language learners by state, mathematics grade 8: 2007 and 2009
2007 2009
State Actual Benchmark Difference Actual Benchmark DifferenceAlabama 76.8 76.7 0.1 87.1 81.8 5.3Alaska 63.1 74.2 -11.1 74.4 78.9 -4.6Arizona 75.3 80.0 -4.7 85.4 79.3 6.0Arkansas 81.7 78.2 3.5 91.8 82.0 9.8California 83.0 82.9 0.1 85.0 81.4 3.6Colorado 87.2 78.1 9.1 84.1 79.9 4.2Connecticut 90.7 80.5 10.2 86.5 81.9 4.6Delaware 57.1 71.8 -14.7 85.7 74.5 11.2District of Columbia 45.7 74.8 -29.1 68.3 76.0 -7.7Florida 83.5 80.3 3.2 86.9 81.8 5.1Georgia 50.2 77.3 -27.1 77.9 83.4 -5.5Hawaii 90.8 82.8 8.0 89.5 81.2 8.3Idaho 86.6 79.0 7.6 85.1 79.0 6.1Illinois 65.6 74.6 -9.0 81.1 79.4 1.7Indiana 63.8 76.6 -12.8 69.8 82.6 -12.8Iowa 84.2 82.0 2.2 83.9 82.6 1.3Kansas 69.5 72.0 -2.5 76.9 78.2 -1.4Kentucky 51.5 68.5 -17.0 64.5 71.6 -7.1Louisiana 74.1 76.6 -2.5 88.9 78.7 10.2Maine 71.9 78.1 -6.1 88.2 79.3 8.9Maryland 38.3 72.0 -33.7 45.2 77.8 -32.6Massachusetts 49.4 71.5 -22.0 72.7 76.5 -3.8Michigan 69.1 76.8 -7.7 76.6 80.5 -4.0Minnesota 83.4 78.5 4.9 83.3 80.5 2.8Mississippi 78.5 82.6 -4.1 83.1 82.6 0.5Missouri 65.4 73.4 -8.0 74.6 79.1 -4.5Montana 77.3 77.3 0.0 77.3 78.8 -1.6Nebraska 83.0 82.4 0.6 77.4 81.7 -4.4Nevada 73.8 78.0 -4.2 78.3 80.9 -2.5NewHampshire 83.3 79.3 4.0 86.4 81.3 5.1New Jersey 82.7 80.4 2.3 89.0 85.0 4.0NewMexico 83.5 77.2 6.3 78.0 76.6 1.5New York 79.3 80.5 -1.2 86.0 82.4 3.6North Carolina 86.7 81.1 5.6 88.6 82.3 6.4North Dakota 58.1 73.6 -15.4 67.9 80.7 -12.8Ohio 53.6 68.0 -14.4 67.8 76.7 -9.0Oklahoma 44.9 75.6 -30.7 58.8 80.3 -21.6Oregon 78.0 75.7 2.4 80.8 78.2 2.6Pennsylvania 77.9 78.7 -0.8 82.5 81.4 1.1Rhode Island 88.0 84.1 3.9 90.4 84.2 6.2SouthCarolina 60.2 79.0 -18.9 68.4 80.1 -11.7SouthDakota 78.3 75.5 2.8 83.5 80.5 2.9Tennessee 47.0 72.1 -25.1 66.8 75.4 -8.6Texas 58.5 78.7 -20.2 61.9 77.2 -15.3Utah 77.1 76.6 0.5 72.0 77.9 -5.9Vermont 78.0 75.6 2.3 88.8 80.1 8.7Virginia 58.9 75.7 -16.8 76.0 77.5 -1.5Washington 73.1 79.3 -6.2 81.6 78.5 3.2West Virginia 88.9 81.4 7.5 89.7 81.9 7.8Wisconsin 73.6 75.9 -2.2 85.2 79.6 5.6Wyoming 84.7 79.8 4.9 87.1 80.7 6.3
NOTE: The difference in this table (the actual inclusion rate minus the nation-based benchmark inclusion rate) is also used in the report as the status measure.SOURCE: U.S. Department of Education, Institute of Education Sciences, National Center for Education Statistics, National Assessment of Educational Progress (NAEP) 2005, 2007, and 2009 Mathematics Assessments.
NATIONAL ASSESSMENT OF EDUCATIONAL PROGRESSC-3
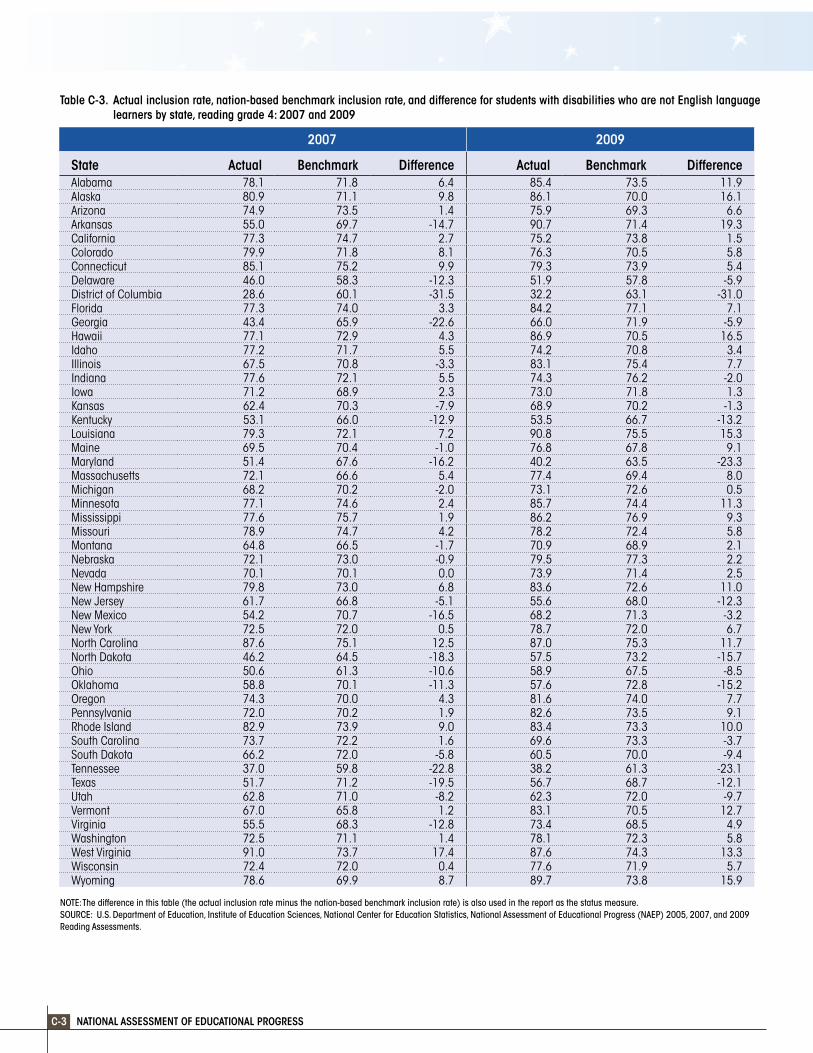
Table C-3. Actual inclusion rate, nation-based benchmark inclusion rate, and difference for students with disabilities who are not English language learners by state, reading grade 4: 2007 and 2009
2007 2009
State Actual Benchmark Difference Actual Benchmark DifferenceAlabama 78.1 71.8 6.4 85.4 73.5 11.9Alaska 80.9 71.1 9.8 86.1 70.0 16.1Arizona 74.9 73.5 1.4 75.9 69.3 6.6Arkansas 55.0 69.7 -14.7 90.7 71.4 19.3California 77.3 74.7 2.7 75.2 73.8 1.5Colorado 79.9 71.8 8.1 76.3 70.5 5.8Connecticut 85.1 75.2 9.9 79.3 73.9 5.4Delaware 46.0 58.3 -12.3 51.9 57.8 -5.9District of Columbia 28.6 60.1 -31.5 32.2 63.1 -31.0Florida 77.3 74.0 3.3 84.2 77.1 7.1Georgia 43.4 65.9 -22.6 66.0 71.9 -5.9Hawaii 77.1 72.9 4.3 86.9 70.5 16.5Idaho 77.2 71.7 5.5 74.2 70.8 3.4Illinois 67.5 70.8 -3.3 83.1 75.4 7.7Indiana 77.6 72.1 5.5 74.3 76.2 -2.0Iowa 71.2 68.9 2.3 73.0 71.8 1.3Kansas 62.4 70.3 -7.9 68.9 70.2 -1.3Kentucky 53.1 66.0 -12.9 53.5 66.7 -13.2Louisiana 79.3 72.1 7.2 90.8 75.5 15.3Maine 69.5 70.4 -1.0 76.8 67.8 9.1Maryland 51.4 67.6 -16.2 40.2 63.5 -23.3Massachusetts 72.1 66.6 5.4 77.4 69.4 8.0Michigan 68.2 70.2 -2.0 73.1 72.6 0.5Minnesota 77.1 74.6 2.4 85.7 74.4 11.3Mississippi 77.6 75.7 1.9 86.2 76.9 9.3Missouri 78.9 74.7 4.2 78.2 72.4 5.8Montana 64.8 66.5 -1.7 70.9 68.9 2.1Nebraska 72.1 73.0 -0.9 79.5 77.3 2.2Nevada 70.1 70.1 0.0 73.9 71.4 2.5NewHampshire 79.8 73.0 6.8 83.6 72.6 11.0New Jersey 61.7 66.8 -5.1 55.6 68.0 -12.3NewMexico 54.2 70.7 -16.5 68.2 71.3 -3.2New York 72.5 72.0 0.5 78.7 72.0 6.7North Carolina 87.6 75.1 12.5 87.0 75.3 11.7North Dakota 46.2 64.5 -18.3 57.5 73.2 -15.7Ohio 50.6 61.3 -10.6 58.9 67.5 -8.5Oklahoma 58.8 70.1 -11.3 57.6 72.8 -15.2Oregon 74.3 70.0 4.3 81.6 74.0 7.7Pennsylvania 72.0 70.2 1.9 82.6 73.5 9.1Rhode Island 82.9 73.9 9.0 83.4 73.3 10.0SouthCarolina 73.7 72.2 1.6 69.6 73.3 -3.7SouthDakota 66.2 72.0 -5.8 60.5 70.0 -9.4Tennessee 37.0 59.8 -22.8 38.2 61.3 -23.1Texas 51.7 71.2 -19.5 56.7 68.7 -12.1Utah 62.8 71.0 -8.2 62.3 72.0 -9.7Vermont 67.0 65.8 1.2 83.1 70.5 12.7Virginia 55.5 68.3 -12.8 73.4 68.5 4.9Washington 72.5 71.1 1.4 78.1 72.3 5.8West Virginia 91.0 73.7 17.4 87.6 74.3 13.3Wisconsin 72.4 72.0 0.4 77.6 71.9 5.7Wyoming 78.6 69.9 8.7 89.7 73.8 15.9
NOTE: The difference in this table (the actual inclusion rate minus the nation-based benchmark inclusion rate) is also used in the report as the status measure.SOURCE: U.S. Department of Education, Institute of Education Sciences, National Center for Education Statistics, National Assessment of Educational Progress (NAEP) 2005, 2007, and 2009 Reading Assessments.
INCLUSION HIGHLIGHTS C-4
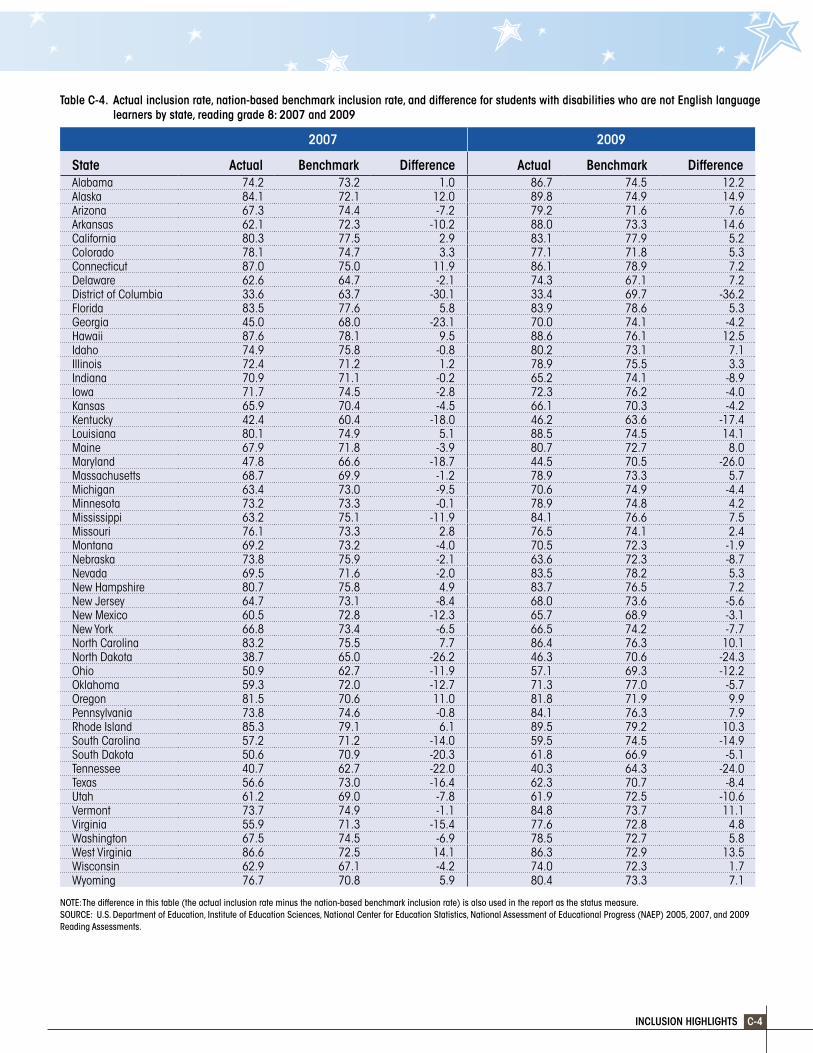
Table C-4. Actual inclusion rate, nation-based benchmark inclusion rate, and difference for students with disabilities who are not English language learners by state, reading grade 8: 2007 and 2009
2007 2009
State Actual Benchmark Difference Actual Benchmark DifferenceAlabama 74.2 73.2 1.0 86.7 74.5 12.2Alaska 84.1 72.1 12.0 89.8 74.9 14.9Arizona 67.3 74.4 -7.2 79.2 71.6 7.6Arkansas 62.1 72.3 -10.2 88.0 73.3 14.6California 80.3 77.5 2.9 83.1 77.9 5.2Colorado 78.1 74.7 3.3 77.1 71.8 5.3Connecticut 87.0 75.0 11.9 86.1 78.9 7.2Delaware 62.6 64.7 -2.1 74.3 67.1 7.2District of Columbia 33.6 63.7 -30.1 33.4 69.7 -36.2Florida 83.5 77.6 5.8 83.9 78.6 5.3Georgia 45.0 68.0 -23.1 70.0 74.1 -4.2Hawaii 87.6 78.1 9.5 88.6 76.1 12.5Idaho 74.9 75.8 -0.8 80.2 73.1 7.1Illinois 72.4 71.2 1.2 78.9 75.5 3.3Indiana 70.9 71.1 -0.2 65.2 74.1 -8.9Iowa 71.7 74.5 -2.8 72.3 76.2 -4.0Kansas 65.9 70.4 -4.5 66.1 70.3 -4.2Kentucky 42.4 60.4 -18.0 46.2 63.6 -17.4Louisiana 80.1 74.9 5.1 88.5 74.5 14.1Maine 67.9 71.8 -3.9 80.7 72.7 8.0Maryland 47.8 66.6 -18.7 44.5 70.5 -26.0Massachusetts 68.7 69.9 -1.2 78.9 73.3 5.7Michigan 63.4 73.0 -9.5 70.6 74.9 -4.4Minnesota 73.2 73.3 -0.1 78.9 74.8 4.2Mississippi 63.2 75.1 -11.9 84.1 76.6 7.5Missouri 76.1 73.3 2.8 76.5 74.1 2.4Montana 69.2 73.2 -4.0 70.5 72.3 -1.9Nebraska 73.8 75.9 -2.1 63.6 72.3 -8.7Nevada 69.5 71.6 -2.0 83.5 78.2 5.3NewHampshire 80.7 75.8 4.9 83.7 76.5 7.2New Jersey 64.7 73.1 -8.4 68.0 73.6 -5.6NewMexico 60.5 72.8 -12.3 65.7 68.9 -3.1New York 66.8 73.4 -6.5 66.5 74.2 -7.7North Carolina 83.2 75.5 7.7 86.4 76.3 10.1North Dakota 38.7 65.0 -26.2 46.3 70.6 -24.3Ohio 50.9 62.7 -11.9 57.1 69.3 -12.2Oklahoma 59.3 72.0 -12.7 71.3 77.0 -5.7Oregon 81.5 70.6 11.0 81.8 71.9 9.9Pennsylvania 73.8 74.6 -0.8 84.1 76.3 7.9Rhode Island 85.3 79.1 6.1 89.5 79.2 10.3SouthCarolina 57.2 71.2 -14.0 59.5 74.5 -14.9SouthDakota 50.6 70.9 -20.3 61.8 66.9 -5.1Tennessee 40.7 62.7 -22.0 40.3 64.3 -24.0Texas 56.6 73.0 -16.4 62.3 70.7 -8.4Utah 61.2 69.0 -7.8 61.9 72.5 -10.6Vermont 73.7 74.9 -1.1 84.8 73.7 11.1Virginia 55.9 71.3 -15.4 77.6 72.8 4.8Washington 67.5 74.5 -6.9 78.5 72.7 5.8West Virginia 86.6 72.5 14.1 86.3 72.9 13.5Wisconsin 62.9 67.1 -4.2 74.0 72.3 1.7Wyoming 76.7 70.8 5.9 80.4 73.3 7.1
NOTE: The difference in this table (the actual inclusion rate minus the nation-based benchmark inclusion rate) is also used in the report as the status measure.SOURCE: U.S. Department of Education, Institute of Education Sciences, National Center for Education Statistics, National Assessment of Educational Progress (NAEP) 2005, 2007, and 2009 Reading Assessments.
NATIONAL ASSESSMENT OF EDUCATIONAL PROGRESSC-5
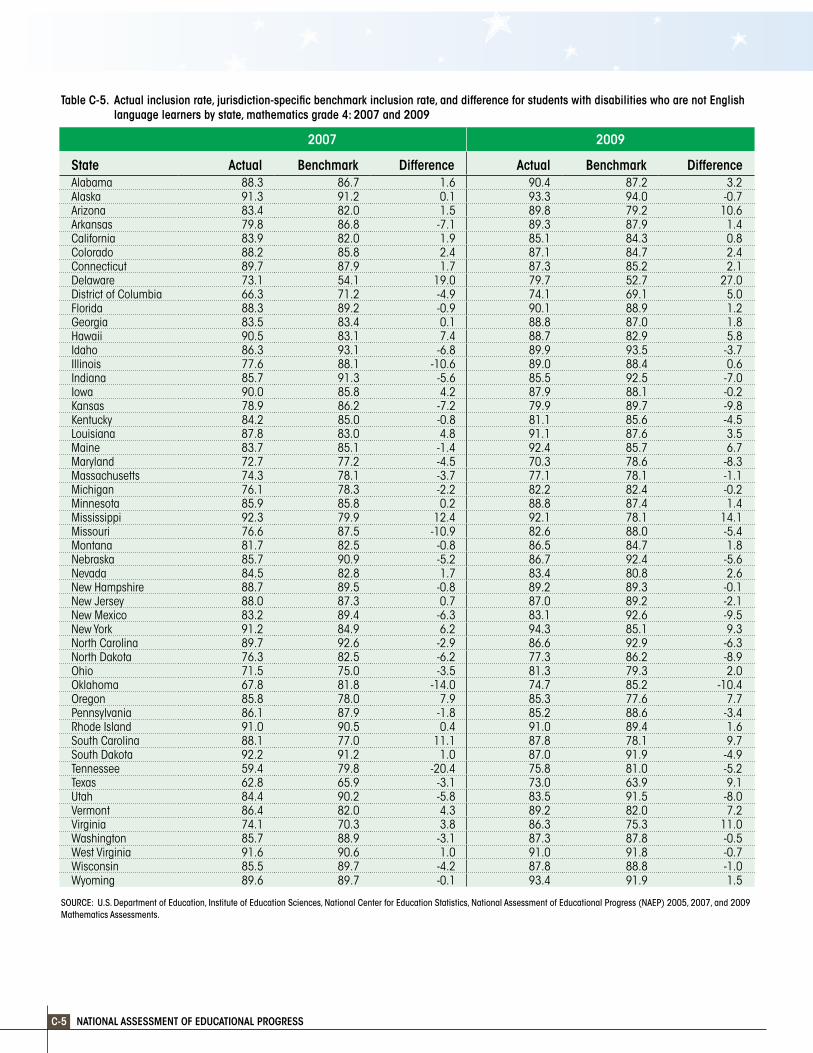
Table C-5. Actual inclusion rate, jurisdiction-specific benchmark inclusion rate, and difference for students with disabilities who are not English language learners by state, mathematics grade 4: 2007 and 2009
2007 2009
State Actual Benchmark Difference Actual Benchmark DifferenceAlabama 88.3 86.7 1.6 90.4 87.2 3.2Alaska 91.3 91.2 0.1 93.3 94.0 -0.7Arizona 83.4 82.0 1.5 89.8 79.2 10.6Arkansas 79.8 86.8 -7.1 89.3 87.9 1.4California 83.9 82.0 1.9 85.1 84.3 0.8Colorado 88.2 85.8 2.4 87.1 84.7 2.4Connecticut 89.7 87.9 1.7 87.3 85.2 2.1Delaware 73.1 54.1 19.0 79.7 52.7 27.0District of Columbia 66.3 71.2 -4.9 74.1 69.1 5.0Florida 88.3 89.2 -0.9 90.1 88.9 1.2Georgia 83.5 83.4 0.1 88.8 87.0 1.8Hawaii 90.5 83.1 7.4 88.7 82.9 5.8Idaho 86.3 93.1 -6.8 89.9 93.5 -3.7Illinois 77.6 88.1 -10.6 89.0 88.4 0.6Indiana 85.7 91.3 -5.6 85.5 92.5 -7.0Iowa 90.0 85.8 4.2 87.9 88.1 -0.2Kansas 78.9 86.2 -7.2 79.9 89.7 -9.8Kentucky 84.2 85.0 -0.8 81.1 85.6 -4.5Louisiana 87.8 83.0 4.8 91.1 87.6 3.5Maine 83.7 85.1 -1.4 92.4 85.7 6.7Maryland 72.7 77.2 -4.5 70.3 78.6 -8.3Massachusetts 74.3 78.1 -3.7 77.1 78.1 -1.1Michigan 76.1 78.3 -2.2 82.2 82.4 -0.2Minnesota 85.9 85.8 0.2 88.8 87.4 1.4Mississippi 92.3 79.9 12.4 92.1 78.1 14.1Missouri 76.6 87.5 -10.9 82.6 88.0 -5.4Montana 81.7 82.5 -0.8 86.5 84.7 1.8Nebraska 85.7 90.9 -5.2 86.7 92.4 -5.6Nevada 84.5 82.8 1.7 83.4 80.8 2.6NewHampshire 88.7 89.5 -0.8 89.2 89.3 -0.1New Jersey 88.0 87.3 0.7 87.0 89.2 -2.1NewMexico 83.2 89.4 -6.3 83.1 92.6 -9.5New York 91.2 84.9 6.2 94.3 85.1 9.3North Carolina 89.7 92.6 -2.9 86.6 92.9 -6.3North Dakota 76.3 82.5 -6.2 77.3 86.2 -8.9Ohio 71.5 75.0 -3.5 81.3 79.3 2.0Oklahoma 67.8 81.8 -14.0 74.7 85.2 -10.4Oregon 85.8 78.0 7.9 85.3 77.6 7.7Pennsylvania 86.1 87.9 -1.8 85.2 88.6 -3.4Rhode Island 91.0 90.5 0.4 91.0 89.4 1.6SouthCarolina 88.1 77.0 11.1 87.8 78.1 9.7SouthDakota 92.2 91.2 1.0 87.0 91.9 -4.9Tennessee 59.4 79.8 -20.4 75.8 81.0 -5.2Texas 62.8 65.9 -3.1 73.0 63.9 9.1Utah 84.4 90.2 -5.8 83.5 91.5 -8.0Vermont 86.4 82.0 4.3 89.2 82.0 7.2Virginia 74.1 70.3 3.8 86.3 75.3 11.0Washington 85.7 88.9 -3.1 87.3 87.8 -0.5West Virginia 91.6 90.6 1.0 91.0 91.8 -0.7Wisconsin 85.5 89.7 -4.2 87.8 88.8 -1.0Wyoming 89.6 89.7 -0.1 93.4 91.9 1.5
SOURCE: U.S. Department of Education, Institute of Education Sciences, National Center for Education Statistics, National Assessment of Educational Progress (NAEP) 2005, 2007, and 2009 Mathematics Assessments.
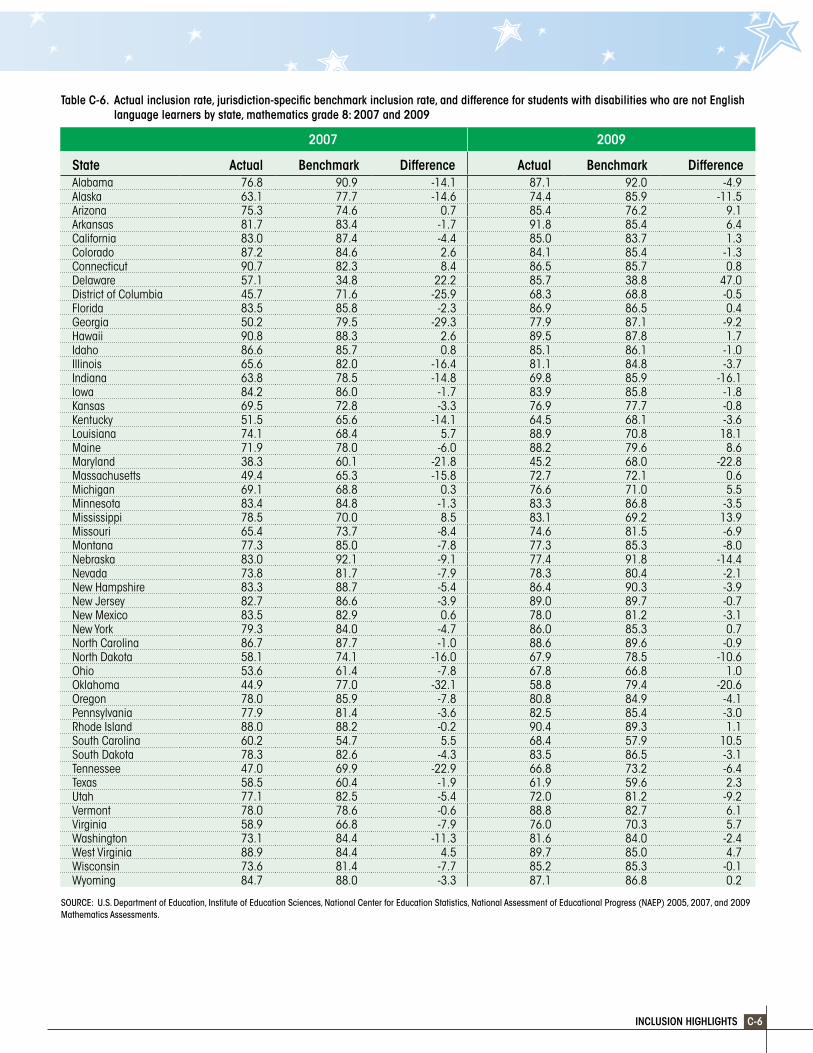
INCLUSION HIGHLIGHTS C-6
Table C-6. Actual inclusion rate, jurisdiction-specific benchmark inclusion rate, and difference for students with disabilities who are not English language learners by state, mathematics grade 8: 2007 and 2009
2007 2009
State Actual Benchmark Difference Actual Benchmark DifferenceAlabama 76.8 90.9 -14.1 87.1 92.0 -4.9Alaska 63.1 77.7 -14.6 74.4 85.9 -11.5Arizona 75.3 74.6 0.7 85.4 76.2 9.1Arkansas 81.7 83.4 -1.7 91.8 85.4 6.4California 83.0 87.4 -4.4 85.0 83.7 1.3Colorado 87.2 84.6 2.6 84.1 85.4 -1.3Connecticut 90.7 82.3 8.4 86.5 85.7 0.8Delaware 57.1 34.8 22.2 85.7 38.8 47.0District of Columbia 45.7 71.6 -25.9 68.3 68.8 -0.5Florida 83.5 85.8 -2.3 86.9 86.5 0.4Georgia 50.2 79.5 -29.3 77.9 87.1 -9.2Hawaii 90.8 88.3 2.6 89.5 87.8 1.7Idaho 86.6 85.7 0.8 85.1 86.1 -1.0Illinois 65.6 82.0 -16.4 81.1 84.8 -3.7Indiana 63.8 78.5 -14.8 69.8 85.9 -16.1Iowa 84.2 86.0 -1.7 83.9 85.8 -1.8Kansas 69.5 72.8 -3.3 76.9 77.7 -0.8Kentucky 51.5 65.6 -14.1 64.5 68.1 -3.6Louisiana 74.1 68.4 5.7 88.9 70.8 18.1Maine 71.9 78.0 -6.0 88.2 79.6 8.6Maryland 38.3 60.1 -21.8 45.2 68.0 -22.8Massachusetts 49.4 65.3 -15.8 72.7 72.1 0.6Michigan 69.1 68.8 0.3 76.6 71.0 5.5Minnesota 83.4 84.8 -1.3 83.3 86.8 -3.5Mississippi 78.5 70.0 8.5 83.1 69.2 13.9Missouri 65.4 73.7 -8.4 74.6 81.5 -6.9Montana 77.3 85.0 -7.8 77.3 85.3 -8.0Nebraska 83.0 92.1 -9.1 77.4 91.8 -14.4Nevada 73.8 81.7 -7.9 78.3 80.4 -2.1NewHampshire 83.3 88.7 -5.4 86.4 90.3 -3.9New Jersey 82.7 86.6 -3.9 89.0 89.7 -0.7NewMexico 83.5 82.9 0.6 78.0 81.2 -3.1New York 79.3 84.0 -4.7 86.0 85.3 0.7North Carolina 86.7 87.7 -1.0 88.6 89.6 -0.9North Dakota 58.1 74.1 -16.0 67.9 78.5 -10.6Ohio 53.6 61.4 -7.8 67.8 66.8 1.0Oklahoma 44.9 77.0 -32.1 58.8 79.4 -20.6Oregon 78.0 85.9 -7.8 80.8 84.9 -4.1Pennsylvania 77.9 81.4 -3.6 82.5 85.4 -3.0Rhode Island 88.0 88.2 -0.2 90.4 89.3 1.1SouthCarolina 60.2 54.7 5.5 68.4 57.9 10.5SouthDakota 78.3 82.6 -4.3 83.5 86.5 -3.1Tennessee 47.0 69.9 -22.9 66.8 73.2 -6.4Texas 58.5 60.4 -1.9 61.9 59.6 2.3Utah 77.1 82.5 -5.4 72.0 81.2 -9.2Vermont 78.0 78.6 -0.6 88.8 82.7 6.1Virginia 58.9 66.8 -7.9 76.0 70.3 5.7Washington 73.1 84.4 -11.3 81.6 84.0 -2.4West Virginia 88.9 84.4 4.5 89.7 85.0 4.7Wisconsin 73.6 81.4 -7.7 85.2 85.3 -0.1Wyoming 84.7 88.0 -3.3 87.1 86.8 0.2
SOURCE: U.S. Department of Education, Institute of Education Sciences, National Center for Education Statistics, National Assessment of Educational Progress (NAEP) 2005, 2007, and 2009 Mathematics Assessments.

NATIONAL ASSESSMENT OF EDUCATIONAL PROGRESSC-7
Table C-7. Actual inclusion rate, jurisdiction-specific benchmark inclusion rate, and difference for students with disabilities who are not English language learners by state, reading grade 4: 2007 and 2009
2007 2009
State Actual Benchmark Difference Actual Benchmark DifferenceAlabama 78.1 86.4 -8.3 85.4 86.4 -1.1Alaska 80.9 88.5 -7.6 86.1 86.9 -0.8Arizona 74.9 73.7 1.2 75.9 67.8 8.1Arkansas 55.0 57.0 -2.0 90.7 58.6 32.1California 77.3 78.7 -1.3 75.2 77.1 -1.8Colorado 79.9 80.6 -0.7 76.3 79.5 -3.2Connecticut 85.1 84.0 1.1 79.3 80.9 -1.6Delaware 46.0 25.8 20.2 51.9 26.6 25.2District of Columbia 28.6 60.3 -31.7 32.2 64.0 -31.9Florida 77.3 77.7 -0.3 84.2 78.6 5.6Georgia 43.4 59.5 -16.2 66.0 68.1 -2.1Hawaii 77.1 82.0 -4.8 86.9 83.9 3.0Idaho 77.2 75.8 1.3 74.2 71.7 2.5Illinois 67.5 71.8 -4.2 83.1 76.3 6.8Indiana 77.6 79.5 -1.9 74.3 80.0 -5.7Iowa 71.2 74.4 -3.2 73.0 79.4 -6.3Kansas 62.4 81.2 -18.8 68.9 83.6 -14.6Kentucky 53.1 55.8 -2.6 53.5 55.7 -2.3Louisiana 79.3 51.0 28.3 90.8 52.4 38.4Maine 69.5 65.7 3.8 76.8 64.5 12.3Maryland 51.4 63.7 -12.2 40.2 57.4 -17.2Massachusetts 72.1 68.5 3.6 77.4 72.3 5.2Michigan 68.2 53.9 14.3 73.1 58.4 14.7Minnesota 77.1 88.9 -11.8 85.7 89.5 -3.8Mississippi 77.6 64.4 13.3 86.2 63.4 22.8Missouri 78.9 69.1 9.8 78.2 64.7 13.5Montana 64.8 65.6 -0.8 70.9 68.9 2.1Nebraska 72.1 74.5 -2.3 79.5 78.4 1.0Nevada 70.1 69.1 1.1 73.9 68.8 5.1NewHampshire 79.8 85.1 -5.3 83.6 84.4 -0.8New Jersey 61.7 77.1 -15.4 55.6 79.1 -23.4NewMexico 54.2 70.3 -16.0 68.2 69.2 -1.0New York 72.5 76.8 -4.3 78.7 76.8 1.9North Carolina 87.6 87.4 0.3 87.0 85.7 1.3North Dakota 46.2 66.7 -20.5 57.5 80.0 -22.5Ohio 50.6 51.1 -0.5 58.9 55.4 3.6Oklahoma 58.8 75.8 -17.1 57.6 76.0 -18.4Oregon 74.3 69.0 5.2 81.6 73.0 8.6Pennsylvania 72.0 75.2 -3.1 82.6 78.2 4.4Rhode Island 82.9 91.6 -8.8 83.4 92.5 -9.1SouthCarolina 73.7 66.0 7.7 69.6 68.5 1.1SouthDakota 66.2 77.1 -10.9 60.5 73.4 -12.9Tennessee 37.0 43.1 -6.1 38.2 47.5 -9.4Texas 51.7 58.8 -7.1 56.7 60.5 -3.9Utah 62.8 74.8 -11.9 62.3 76.7 -14.3Vermont 67.0 70.4 -3.4 83.1 75.3 7.8Virginia 55.5 50.4 5.1 73.4 55.5 18.0Washington 72.5 79.1 -6.6 78.1 78.7 -0.6West Virginia 91.0 73.6 17.5 87.6 75.7 12.0Wisconsin 72.4 78.1 -5.7 77.6 77.8 -0.2Wyoming 78.6 88.7 -10.1 89.7 91.0 -1.2
SOURCE: U.S. Department of Education, Institute of Education Sciences, National Center for Education Statistics, National Assessment of Educational Progress (NAEP) 2005, 2007, and 2009 Reading Assessments.
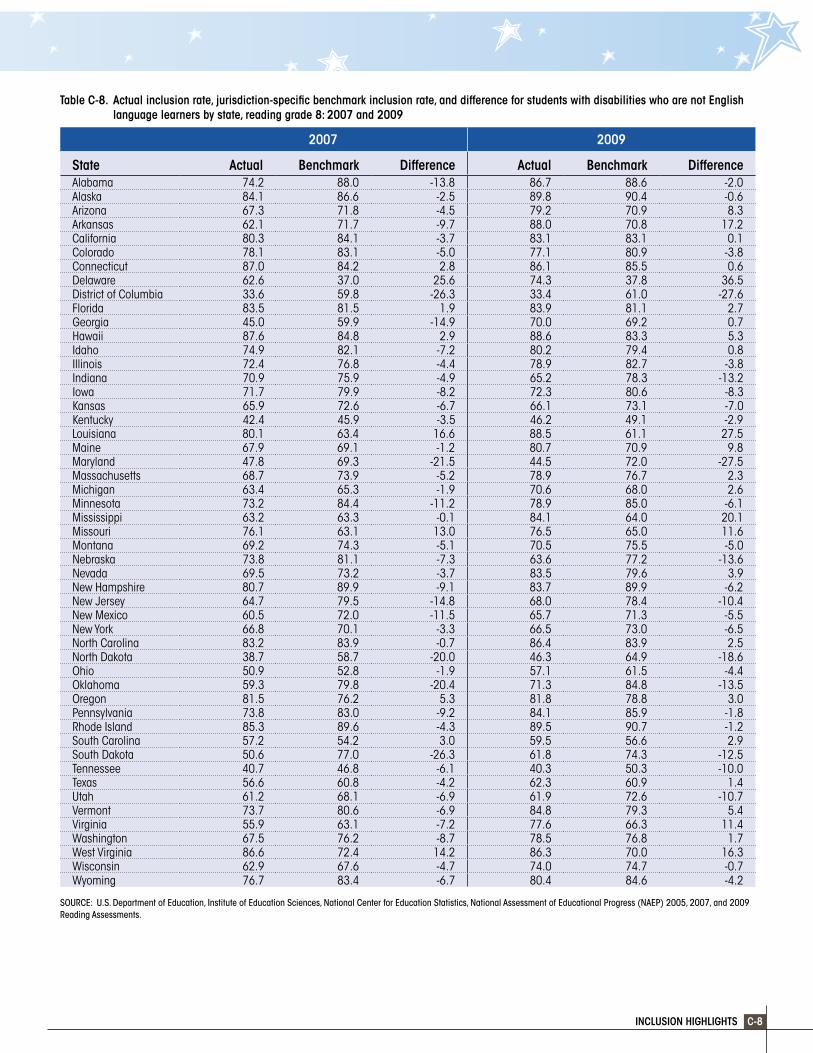
INCLUSION HIGHLIGHTS C-8
Table C-8. Actual inclusion rate, jurisdiction-specific benchmark inclusion rate, and difference for students with disabilities who are not English language learners by state, reading grade 8: 2007 and 2009
2007 2009
State Actual Benchmark Difference Actual Benchmark DifferenceAlabama 74.2 88.0 -13.8 86.7 88.6 -2.0Alaska 84.1 86.6 -2.5 89.8 90.4 -0.6Arizona 67.3 71.8 -4.5 79.2 70.9 8.3Arkansas 62.1 71.7 -9.7 88.0 70.8 17.2California 80.3 84.1 -3.7 83.1 83.1 0.1Colorado 78.1 83.1 -5.0 77.1 80.9 -3.8Connecticut 87.0 84.2 2.8 86.1 85.5 0.6Delaware 62.6 37.0 25.6 74.3 37.8 36.5District of Columbia 33.6 59.8 -26.3 33.4 61.0 -27.6Florida 83.5 81.5 1.9 83.9 81.1 2.7Georgia 45.0 59.9 -14.9 70.0 69.2 0.7Hawaii 87.6 84.8 2.9 88.6 83.3 5.3Idaho 74.9 82.1 -7.2 80.2 79.4 0.8Illinois 72.4 76.8 -4.4 78.9 82.7 -3.8Indiana 70.9 75.9 -4.9 65.2 78.3 -13.2Iowa 71.7 79.9 -8.2 72.3 80.6 -8.3Kansas 65.9 72.6 -6.7 66.1 73.1 -7.0Kentucky 42.4 45.9 -3.5 46.2 49.1 -2.9Louisiana 80.1 63.4 16.6 88.5 61.1 27.5Maine 67.9 69.1 -1.2 80.7 70.9 9.8Maryland 47.8 69.3 -21.5 44.5 72.0 -27.5Massachusetts 68.7 73.9 -5.2 78.9 76.7 2.3Michigan 63.4 65.3 -1.9 70.6 68.0 2.6Minnesota 73.2 84.4 -11.2 78.9 85.0 -6.1Mississippi 63.2 63.3 -0.1 84.1 64.0 20.1Missouri 76.1 63.1 13.0 76.5 65.0 11.6Montana 69.2 74.3 -5.1 70.5 75.5 -5.0Nebraska 73.8 81.1 -7.3 63.6 77.2 -13.6Nevada 69.5 73.2 -3.7 83.5 79.6 3.9NewHampshire 80.7 89.9 -9.1 83.7 89.9 -6.2New Jersey 64.7 79.5 -14.8 68.0 78.4 -10.4NewMexico 60.5 72.0 -11.5 65.7 71.3 -5.5New York 66.8 70.1 -3.3 66.5 73.0 -6.5North Carolina 83.2 83.9 -0.7 86.4 83.9 2.5North Dakota 38.7 58.7 -20.0 46.3 64.9 -18.6Ohio 50.9 52.8 -1.9 57.1 61.5 -4.4Oklahoma 59.3 79.8 -20.4 71.3 84.8 -13.5Oregon 81.5 76.2 5.3 81.8 78.8 3.0Pennsylvania 73.8 83.0 -9.2 84.1 85.9 -1.8Rhode Island 85.3 89.6 -4.3 89.5 90.7 -1.2SouthCarolina 57.2 54.2 3.0 59.5 56.6 2.9SouthDakota 50.6 77.0 -26.3 61.8 74.3 -12.5Tennessee 40.7 46.8 -6.1 40.3 50.3 -10.0Texas 56.6 60.8 -4.2 62.3 60.9 1.4Utah 61.2 68.1 -6.9 61.9 72.6 -10.7Vermont 73.7 80.6 -6.9 84.8 79.3 5.4Virginia 55.9 63.1 -7.2 77.6 66.3 11.4Washington 67.5 76.2 -8.7 78.5 76.8 1.7West Virginia 86.6 72.4 14.2 86.3 70.0 16.3Wisconsin 62.9 67.6 -4.7 74.0 74.7 -0.7Wyoming 76.7 83.4 -6.7 80.4 84.6 -4.2
SOURCE: U.S. Department of Education, Institute of Education Sciences, National Center for Education Statistics, National Assessment of Educational Progress (NAEP) 2005, 2007, and 2009 Reading Assessments.

NATIONAL ASSESSMENT OF EDUCATIONAL PROGRESSD-1
Appendix D. CaveatsSubjectivity and Measurement ErrorSome degree of subjectivity may exist in the variables providing information on a student’s disability characteristics. For example, thevariousrespondentswhoclassifythestudentsfortheSDBackgroundQuestionnairemayhavedifferentinterpretationsofthedisabilityclassificationsorofhowtocodetheseveritylevelofastudent’sdisability.Reschly(1996)analyzesthesubjectivenatureofthesewidelyusedsystemsofclassifyingSDs.Ifthesubjective interpretation of a control variable is random across all observations, it is akin to measurement error.
In our analysis, we cannot know how much our variables are measured with error. To the extent that a control variable is measuredwitherror,itsabilitytoexplaindifferencesininclusionrates is reduced. Because the measure of change captures the portion of change that is not explained by the control variables, astheabilityofthecontrolvariablestoexplaindifferencesininclusion rates is reduced, the magnitude of the measure of change will rise.
If the subjective interpretation of a control variable is not completelyrandombut,tosomeextent,differssystematicallyandiscorrelatedwithsomeobservableornon-observablecharacteristic, bias will occur in the estimated coefficients. In our analysis, the potentially subjective variables, type of disability
and severity level, are control variables and are not variables ofinterest.Whatisofinterestarethestate-levelpredictionsweobtainfromapplyingthemodeltodata.Thesubjectivity,therefore, will be of concern if it is correlated somehow with statesorastate-levelcharacteristic.Forexample,wewouldbeconcernedifwesawsystematicdifferencesinthedefinitionofautismacrossstates.Suchasystematicdifferencewillcausebiasin our estimates of change.
Thebiasfromsystematicsubjectivityisnotaconcerninthejurisdiction-specificapproachformeasuringchangebecausehere the regression model is estimated separately for each state. Subjectivity within the state will still cause measurement error,asdiscussedabove,butthebiasincalculatingstate-levelstatisticswillberemoved.Forthestate-specificapproach’schange measure, however, it will be a concern if the subjective interpretation of a variable is thought to change over time within a state.
A full discussion is provided in the 2009 report, Kitmitto and Bandeira de Mello (2009).
Reschly,D.J.(1996,Spring).IdentificationandAssessment ofStudentsWithDisabilities.The Future of Children, 6: pp.40-53.
INCLUSION HIGHLIGHTS
U.S. DEPARTMENT OF EDUCATION
ArneDuncanSecretaryU.S.DepartmentofEducation
JohnQ.EastonDirectorInstitute of Education Sciences
Jack BuckleyCommissionerNational Center for Education Statistics
TheNationalCenterforEducationStatistics(NCES),locatedwithintheU.S.DepartmentofEducationandtheInstituteofEducationSciences,istheprimaryfederalentityforcollectingandanalyzingdatarelatedtoeducation.
TheNationalAssessmentofEducationalProgress(NAEP)isacongressionallymandatedprojectsponsoredbytheU.S.DepartmentofEducationandadministeredbyNCES.TheCommissionerofEducationStatisticsisresponsibleforcarryingouttheNAEPproject.
TheNationalAssessmentGoverningBoardisresponsibleforsettingpolicyforNAEP,includingtheNAEPachievementlevels.
National Center for Education StatisticsInstitute of Education SciencesU.S.DepartmentofEducation1990KStreet,NWWashington,DC20006-5651
ThisreportwaspreparedfortheNationalCenterforEducationStatisticsunderContractNo.ED-04-CO-0025/0019withtheAmericanInstitutesforResearch.Mentionoftradenames,commercialproducts,ororganizationsdoesnotimplyendorsementbytheU.S. Government.
To download full results and supporting materials, please visit: http://nces.ed.gov/nationsreportcard/studies/inclusion/.
September 2011
Suggested Citation
Kitmitto, S. (2011). Measuring Status and Change in NAEP Inclusion Rates of Students With Disabilities: Results 2007-09(NCES2011-457).U.S.DepartmentofEducation.Washington,DC:NationalCenterforEducationStatistics.
Content Contact
TaslimaRahman(202)[email protected]
“The Department of Education’s mission is to promote student achievement and preparation for
global competitiveness by fostering education excellence and ensuring equal access.”
www.ed.gov