measuring r&d performance from an innovation …
TRANSCRIPT

MEASURING RampD PERFORMANCE FROM AN INNOVATION SYSTEMS PERSPECTIVE An Illustration from the Nigeria and Ghana Agricultural Research Systems
Catherine R Ragasa Aliyu Sabi Abdullahi and George Owusu Essegbey
Conference Working Paper 14
i
Table of Contents
1 Introduction 6
2 Framework Measurements and Data 8
3 Results and Discussion 12
Indicators of Observed Research Productivity 12
Low Number of Technologies Produced Based on Budget and Staffing Levels 12
Limited Adoption and Impact Based on Researchersrsquo Perceptions and Field Visits 13
Lower Publication Rate in Ghana than in Nigeria 14
More Dissemination in Nigeria But Limited Knowledge of Impact of Publications in Both Countries 15
Variability across Organizations within a Country Context 15
Limited Correlation among Conventional Performance Measures 15
Connectivity and Linkages with Other Innovation Actors 16
Linkages with Other Researchers 16
Limited Linkages with Farmers and Extension Services 16
Limited Linkages with Other Innovation Actors 18
The Gap Between the Actual and Perceived Importance of Interactions 19
Strong Correlations with Other Performance Measures 19
Staff Morale 20
Capacity and Incentive System 23
Motivation among Researchers 23
Motivation among Heads of Organizations 24
Mission Orientation and Organization Management System 25
Organizational Capacity and Resources 26
4 Conclusion and policy implications 27
Limited Farmer or Impact Orientation 27
Policy and Perspectives are Reflected in Observed Performance 28
Inconsistencies in Performance Indicators 28
Variability within Countries 29
Infrastructure Acts As a Binding Constraint 29
Constraints in Greater Linkages 29
Appendix 31
References 35
ii
List of Tables
1 Socioeconomic indicators for Nigeria and Ghana 8
2 Productivity indicators employed in the study 13
Appendix Table A1 Performance indicators employed in the study 31
Appendix Table A2 Capacity and incentive indicators employed in the study 32
Appendix Table A3 Correlation of performance measures for Nigeria and Ghana 33
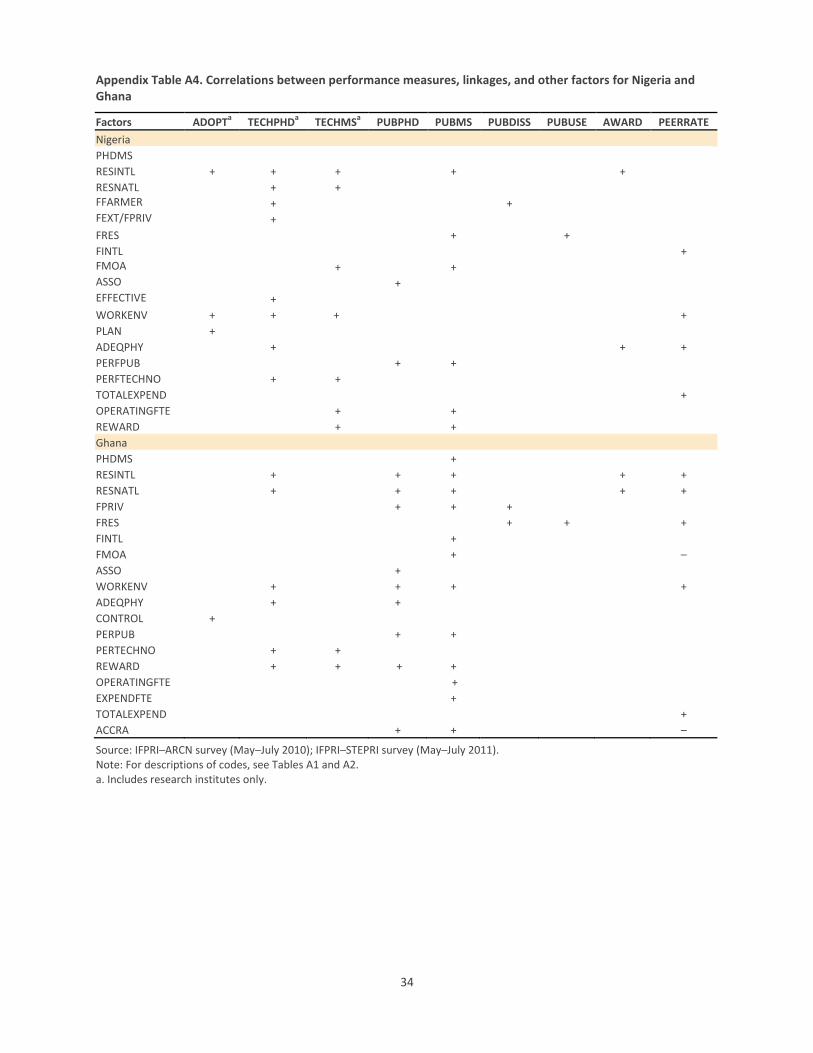
Appendix Table A4 Correlations between performance measures linkages and other factors for Nigeria and Ghana 34
List of Figures
1 A conceptual framework Analyzing an agricultural research systemrsquos performance and impact pathway within an innovation systems perspective 10
2 Distribution of researchers based on their knowledge of the adoption of technologies they produced 14
3 Distribution of researchers based on frequency of interaction with innovation actors 17 4 Distribution of researchers based on satisfaction with their output 21 5 Distribution of researchers based on their perceived satisfaction with their job their output
the effectiveness of organization and the work environment 21 6 Distribution of organizations based on the top five motivations reported by the heads of
organizations and individual scientists Nigeria and Ghana 24
List of Boxes
1 Background on Nigeria and Ghana 7
2 Data and methodology 11
iii
About the Authors
Catherine R Ragasa (cragasacgiarorg) is a postdoctoral fellow within the Development Strategy and Governance Division of the International Food Policy Research Institute Aliyu Sabi Abdullahi (aliyuabdullahiarcnigeriaorg) is the special assistant to the executive secretary and program manager of Planning and Institutional Development at the Agricultural Research Council of Nigeria and George Owusu Essegbey (goessegbeystepricsirorggh) is the director of the Science and Technology Policy Research Institute
Acknowledgments
The authors gratefully acknowledge the valuable comments provided on a draft of this paper by Nienke Beintema Shashidhara Kolavalli Gert-Jan Stads Jock Anderson and two anonymous reviewers The authors also thank Regina Birner and Suresh Babu for their feedback on the survey questionnaires used and Mary Jane Banks for editing the paper
iv
Acronyms and Abbreviations
agGDP agricultural gross domestic product ARCN Agricultural Research Council of Nigeria CAADP Comprehensive Africa Agriculture Development Program CORMA Client-Oriented Research Management Approach CRIG Cocoa Research Institute of Ghana CSIR Council for Scientific and Industrial Research (Ghana) FTE(s) full-time equivalent(s) GDP gross domestic product GIMPA Ghana Institute of Management and Public Administration IAD institutional analysis and development IFPRI International Food Policy Research Institute MampE monitoring and evaluation MDGs Millennium Development Goals MOA Ministry of Agriculture NARO(s) national agricultural research organization(s) NARS(s) national agricultural research system(s) NGO(s) nongovernmental organization(s) OPAS Organizational Performance Assessment System REFILS(s) ResearchndashExtensionndashFarmersndashInput-Supplier Linkage System Committees RELC(s) ResearchndashExtension Linkage Committee(s) RampD research and development STEPRI Science and Technology Policy Research Institute WAAPP West Africa Agricultural Productivity Program
v
Abstract
This paper combines elements of organizational design institutional analysis and innovation systems literature to empirically measure organizational performance of agricultural research agencies in Nigeria and Ghana Results presented in this paper are limited to researchersrsquo perceptions and measures at the national agricultural research organization (NARO) level and are part of a larger ongoing research program that assesses the effectiveness of RampD investment in these countries
Findings suggest a very weak to nonexistent farmer or impact orientation in NAROs in these countries given that large shares of researchers in the samples interviewed had not interacted with farmers or extension agents in the previous year nor had they any knowledge of the adoption or impact of the technologies they had contributed to generating Results suggest that NAROs in Nigeria are more productive than those in Ghana based on the number of publications produced their dissemination and the perceived adoption and impact of technologies and publications produced These factors are correlated with reports of greater emphasis on the part of their organizations on the number of publications produced and greater research linkages in most organizations in Nigeria compared with those in Ghana
Researchers in Ghana however reported more interaction with other innovation actors (other than researchers) which may be a reflection of a reported greater emphasis on internally generated (nongovernment) funding which in turn requires greater collaboration with the private sector nongovernmental organizations and other innovation actors Researchers in Ghana reportedly have higher staff morale which translates into higher job satisfaction satisfaction with the effectiveness of their organizations and satisfaction with their own work environment compared with researchers in Nigeria Interestingly this does not seem to be correlated with most performance measures other than linkages with other innovation actors
Within Nigeria and Ghana there seems to be variability across organizations suggesting that there are both well- and poorly performing organizations within not just across countries Consistent indicators that are all correlated with increased research productivity include the ratio of PhD- to MSc-qualified researchers the ratio of the operating budget to FTE researcher researchersrsquo satisfaction with their work environment and with the physical resources available in their organizations and the presence of international research collaboration and linkages with other innovation actors Since this is an ongoing pilot study continuous revision of the definitions and measures used is necessary but the information gained can be applied to other countries for benchmarking purposes to extract lessons from past implementation experiences and to identify realistic indicators of well-performing researchers and organizations that can be usefully measured across a variety of countries and contexts
6
1 INTRODUCTION
Numerous research and policy documents highlight the importance of agricultural productivity to food security and poverty reduction (World Bank 2007) Many studies also emphasize that increasing agricultural productivity requires investment in research and development (RampD) and extension usually coupled with infrastructure (Gabre-Madhin and Haggblade 2003 Diao et al 2006 World Bank 2007) Various studies have illustrated the high (although widely differing) rates of return to investment in agricultural research in developed and developing countries measured in tangible outputs often in the form of varietal improvement (Alston et al 2000 Fan Fang and Zhang 2001 Fan 2002 Thirtle Lin and Piesse 2003 Byerlee 2004 Heisey and Fuglie 2007 Walker et al 2008 Hazell 2010 Maredia Bernsten and Ragasa 2010) These findings are the primary justification underlying the advocation of increased investment in RampD and extension
Another set of the literature however points to the limited effectiveness of RampD and extension attributing continually high yield gaps to the inability of these systems to respond to producer demands and new sectoral challenges (Eicher 2001 2004 Byerlee 2004 IAC 2004 Clark 2005) Funding for agricultural RampD in developing countries increased in the 1980s and 1990s but issues of financial sustainability and over-reliance on donor funding ultimately emerged as major problems (Pardey Roseboom and Beintema 1997 Eicher 2001 2003 2004 Beintema and Stads 2011) Much of the literature on agricultural research capacity has focused on Africa mainly because of a general perception of weak and heavily fragmented research capacity there compared with other regions (Lynam and Blackie 1994 Pardey Roseboom and Beintema 1997 Eicher 2001 2003 2004 Beintema and Stads 2004 Daane 2008 Jones 2009 Beintema and Stads 2011)
While the need for increased funding and investment in RampD has been emphasized understanding is limited when it comes to the effectiveness and functioning of the RampD organizations and systems that will receive the intended investment Several attempts at reform and reorganization have been implemented and new arrangements have been adopted over the years (Echeverriacutea Trigo and Byerlee 1996 Byerlee and Alex 1998 FAO 2002 Byerlee and Echeverriacutea 2002 Raina 2003) but these developments are rarely analyzed in terms of implementation experiences outcomes and impacts No single study could be found that focuses on the perceptions values attitudes and motivations of agricultural scientists and how these relate to their activities and the outputs and outcomes generated With increasing scarcity of resources it is vital to understand how RampD organizations and scientists can be more effective and efficient
A major knowledge gap in understanding and strengthening RampD systems stems from the lack of empirical application of framework metrics and benchmarks to measure organizational performance and institutional impact in the context of agricultural research (Goldsmith 1993 Horton et al 2000 IAEG 2001 Mackay and Horton 2003a 2003b Henry and Mark 2003 Walker et al 2008 Yawson and Sutherland 2010) Frameworks for organizational performance assessment have been articulated by Smith and Sutherland (2002)Yawson et al (2006) and Yawson and Sutherland (2010) on the use of balanced scorecards for institutional capacity diagnosis by Peterson Gijsbers and Wilks (2003) on Organizational Performance Assessment System (OPAS)which uses a select group to rate the organizationrsquos research output such as technologies publications and organizational management systems and more recently on the Client-Oriented Research Management Approach (CORMA) which also diagnoses internal management practices and procedures but broadens the coverage of stakeholders providing the ratings (Heemskerk et al 2003)Still no single study shares experiences of the implementation process or compares and contrasts the experiences of various organizations or countries Moreover while these tools and metrics exist their use has been limited or unsustained which boils down to looking at incentives for or bottlenecks in institutionalizing impact orientation and organizational performance assessment For example while OPAS has been implemented within the institutes of Ghanarsquos Council for Scientific and Industrial Research (CSIR) very few organizations have
7
done any organizational performance assessment in recent years or used performance indicators beyond quantifying numbers of publications and trainings provided
This paper combines elements of existing frameworks metrics and benchmarks for organizational performance assessment having pilot-tested them in Nigeria and Ghana to compare and contrast levels of organizational performance and identify possible elements that explain variations in these measures The paper neither invents nor reinvents frameworks perspectives and approaches for analysis Rather it combines existing measures of organizational performance evaluation to illustrate that amore comprehensive look at organizational issues can yield useful insights and add value to current data collection and analysis by the Agricultural Science and Technology Indicators (ASTI) initiative which focuses on trends in research expenditure and human capacity More specifically this paper answers the following research questions
1 Are agricultural research organizations within Nigeria and Ghana performing differently and what are the factors that account for these differences
2 Are there patterns of differences between the agricultural research performance measures in Ghana and Nigeria that are explained by differences in their policies emphasis and practices
Comparing countries in terms of their organizationsrsquo structure and operations allows for possible explanations of why weaker or stronger indicators of organizational and individual researcher performance are observed (Box 1 Table 1)1
Box 1 Background on Nigeria and Ghana
In terms of policy environment both Nigeria and Ghana have had similar significant periods of agricultural policy change and structural adjustment over the years and yet they still have issues with low productivity and high yield gaps in their major crops Ghana however is performing better than Nigeria on many fronts In 2008 Ghana was close to achieving the 6-percent target growth rate for agriculture set by the Comprehensive Africa Agriculture Development Program (CAADP) whereas Nigeriarsquos growth rate was ndash03 percent Both countries have a low ratio of agricultural spending to agricultural GDP(less than 5 percent) which is much lower for example than Asian countries which average 10 percent (Fan Omilola and Lambert 2009) Ghana also reached the CAADP target of investing 10 percent of total public expenditures in agriculture as of 2009 whereas Nigeria only achieved a share of 45 percent that year In terms of economywide growth the 2009 GDP growth rate was 45 percent in Ghana and only 29 percent in Nigeria The same year malnutrition rates were 139 percent in Ghana (on track with Target 1 of the Millennium Development Goals [MDGs]) and 287 percent in Nigeria (well short of the target) and the poverty rate was 355 percent in Ghana (on track with Target 1 of MDGs) and 644 percent in Nigeria (once again considerably outside Target 1 of the MDGs Omilola and Lambert 2010)On a positive note after decades of decline agricultural research spending in Nigeria began to rise from 1998 and continued to climb until 2008 the last year for which data are available(in constant prices)
In terms of their national agricultural research systems (NARSs) Nigeria has the largest and most complex system in Sub-Saharan Africa operating against a historical backdrop of unstable governance institutions and funding Ghana has a relatively small system operating within a more stable environment yet it is hampered by financial human resource and infrastructural constraints In absolute terms Nigeriarsquos system is much larger and has higher agricultural research expenditures and staffing It also has a higher ratio of research expenditures to full-time equivalent (FTE) researchers as well as more researchers per million farmers than Ghana However Ghanarsquos percentage of agricultural research spending to agricultural GDP is higher (094 percent compared with 042 percent for Nigeria (Flaherty Essegbey and Asare 2010 Flaherty et al 2010) Both countries have instituted a series of NARS reforms but they have limited documentation and evidence of their effectiveness or the responsiveness of their research institutions to the needs of poor farmers
Source Authors
1 Note that this paper is part of a larger ongoing research initiative that looks at the cost-effectiveness and impact of
technologies in Nigeria and Ghana the paper should be taken as a work in progress given that continuous revision is needed to refine measurements and definitions
8
Table 1 Socioeconomic indicators for Nigeria and Ghana
Socioeconomic indicator Nigeria Ghana
Population 2010 (millions) 158 24
Poverty headcount ratio at national poverty line 2009(share of population []) 644 355
Gross national income per capita2008ndash10(US dollars) 1180 1173
Life expectancy 2007ndash09 (years) 51 64
Literacy rate 2009(share of population []) 61 67
Growth rate of gross domestic product 2009 () 29 45
Malnutrition rates 2009() 287 139
Agriculturersquos a share of gross domestic product ()a 33 31
Agricultural investment as a share of total public expenditure 2009() 45 10
Ratio of agricultural investments to agricultural gross domestic product 2009() lt5 lt2
Growth rate of agricultural gross domestic product 2009 () ndash03 45
Agricultural research expenditure 2008 (million PPP dollars) 392 95
Number of agricultural researchers 2008 (FTEs) 2062 537
Ratio of agricultural spending to FTE 2008 (millions) 020 018
Researchers per million farmers 2008 (FTEs) 168 90
Agricultural research expenditure 2008(share of AgGDP []) 040 094
Source Compiled by authors from World Bank Omilola and Lambert 2010 and ASTI database Notes PPP indicates purchasing power parity FTE full-time equivalent a Data for Nigeria are a two-year average for 2006ndash07 data for Ghana are a four year average for 2006ndash09
2 FRAMEWORK MEASUREMENTS AND DATA
This paper combines elements of institutional theory organizational design public-sector motivation literature and an innovation systems perspective to measure and explain variations in performance Institutional analysis and development (IAD) highlights the importance of institutional structures and governance in influencing behavior and performance Structures looked at are formal monitoring and evaluation (MampE) systems an organizationrsquos mission orientation and culture and financial incentives potentially affecting performance2 Organizational design theory emphasizes management systems and procedures for coordination and communication which can affect performance Systems and procedures looked at include the existence and implementation of an MampE system for performance staffrsquos satisfaction with the MampE system staff recruitment policy the performance appraisal system strategic and operational planning intellectual property rights planning and staff training and development planning Public-sector motivation literature emphasizes staff morale as an important link in the effectiveness efficiency and sustainability of public-sector organizations Staff morale is measured as a staff rating of their satisfaction with their job and work environment The innovation systems perspective focuses on (1) recognition of a wider differentiated set of innovation suppliers (2) demand responsiveness and better connectivity of agricultural research with a wider range of innovation actors beyond extension agents and farmers and (3) an expanded definition of the innovations being developed to include both economic and social applications (World Bank 2007 2011) These elements are captured by looking at the other innovation actors with whom researchers are
2Raina (2003) stresses the need to distinguish between organizational management systems and institutional reform
which is critical for the effectiveness of both policy and of innovation processes Organizational management often includes formal structures such as recruitment policies staff appraisal systems and other plans whereas institutional reform emphasizes organizational values culture motivations and staff accountability In addition to organizational management constraints Raina (2003) emphasizes the need to look at institutional constraints that can block the innovation process as well as sources of motivation that can improve performance
9
interacting and the level of those interactions Higher education institutes are included as innovation suppliers and some indicators are used to assess the use and impact of research outputs
In bringing these elements together a clear distinction is made between performance on the one hand and factors that potentially affect performance on the other Figure 1 presents a pathway from influencing factors to organizational performance to the outcomes and impacts of NARSs within a wider innovation system and broader policy and institutional context Associated factors explaining variations in performance are grouped as either capacity-or incentive-based Capacity is defined both in terms of the individual (skills knowledge education training and social capital) and the organization (physical and financial resources and human resource and management systems) Incentives are inherent to an individualrsquos preferences values and needs and are influenced by the nature of institutions and both formal and informal structuresnorms These can manifest themselves as formal incentives(salaries position classifications security and tenure)checks and balances the availability of timely information on performance or progress in achieving specific objectives the quality of reward systems the degree of mission-orientation and informal structures (such as organizational culture) (Hall et al 2000 2001 2003 Raina 2003) Organizational culture represents ldquothe collection of traditions values policies beliefs and attitudes that constitute a pervasive context for everything we do and think in an organizationrdquo (Marshall and McLean 1988 32) several studies have concluded that organizational culture affects an individualrsquos incentive to perform in various contexts Quinn and Rohrbaugh 1983 Quinn 1988Quinn and Spreitzer 1991Yeung et al 1991Ramanujam and Rousseau (2006) and Gregory et al 2009 have done empirical work on organizational culture using a ldquocompeting values modelrdquo that incorporates two sets of competing values within the organizations (1) the control versus flexibility dilemma which refers to preferences about structure stability and change and (2) the people versus organization dilemma which refers to differences in organizational focus The combination of two sets of competing values gives rise to four different dominant types of culture (1) group culture (2) development culture (3) rational culture and (4) hierarchical culture (Henri 2006 Gregory et al 2009) A balanced culture occurs when no one type of culture dominates Specific measures and survey questions on organizational culture as used in the aforementioned studies were adopted in this paper
10
Figure 1A conceptual framework Analyzing an agricultural research systemrsquos performance and impact pathway within an innovation systems perspective
CAPACITY AND INCENTIVE CONDITIONS PERFORMANCE IMPACTS
Agricultural research system
Source Devised by authors Notes Solid (thick) arrows represent the direction of impact solid (thinner) arrows represent important linkages and connectivity and broken arrows represent the feedback process
In terms of organizational performance three sets of indicators were drawn from the literature (1) conventional measures of productivity including quantification of technology developed and publications (such as Peterson Gijsbers and Wilks 2003 and Bantilan et al 2004) (2) public-sector motivation and performance emphasizing staff morale (for example Manning Mukherjee and Gokcekus 2000 World Bank 2001 and Yawson and Sutherland 2010) and (3) agricultural innovation systems indicators emphasizing connectivity and linkages among various innovation actors and measures of use and impact of innovations generated by the system (based on Hall et al 2001 2002 Hall Mytleka and Oyeyinka 2006 Spielman and Birner 2008 Spielman and Kelemework 2009 and CTA 2009)
Technology involves all technologies developed including biological chemical and mechanical technologies and improved production management conservation and marketing practices
Organizational culture
Mission orientation
Systems of accountability
Leadership style
Control versus flexibility
Enforcement of incentive systems
Culture
Institutional structure
Structure of ministries and departments
Decentralization
Institutional linkages
Systems of checks and balances
Organizational capacity
Availability and adequacy of human infrastructural and financial resources
Resource management
Procedures for coordination and linkages
Information systems and monitoring and evaluation
Performance monitoring and evaluation systems
Impacts
Increased agricultural GDP and GDP growth rate
Increased food security and nutrition
Reduced poverty
Environmental protection
Organizational performance
Research productivity
Cost-effectiveness and efficiency
Quality of linkages
Staff morale
Useful outcomes
Farmers and firms are adopting new technologies and practices
Influence in policy and regulatory processes
Increased yields
Reduced production costs
Increased incomes
Individual incentives
Beliefs and values
Personal goals and aspirations
Motivations
Compensation
Individual capacity
Education and training
Skills and knowledge
Social capital
Agricultural extension and education systems
Farmers and other value chain actors
Broader enabling environment
Agricultural policies and investments science and technology policy national development polices and linkages to political system and international actors
11
Publications include books book chapters and peer-reviewed publications (particularly articles in international and national scientific journals) published as first author or coauthor Additional measures are included such as patents and professional awards received by the organization or any of its staff Staff morale is measured as the respondentsrsquo ratings on their job satisfaction their satisfaction regarding the effectiveness of their organization given its budget their satisfaction of their own output in comparison to the input of other staff of similar qualifications in similar positions and their satisfaction in terms of their work environment The third set of innovation system indicators used includes the frequency of interactions with other innovation actors and end-users the quality of these linkages research collaboration dissemination of research outputs and the perceived rate of adoption of technologies generated and the perceived use of publications produced by research organizations Perceptions of scientists were triangulated with information from the heads of organizations as a proxy for adoption because actual adoption rates are currently being collected and validated Data collection at the farm level is ongoing The specific indicators for both individuals and organizations are detailed in Appendix Tables A1 and A2 the profile and characterization of responding researchers and organizations based on these indicators are presented in the next section of this paper See Box 2 for more information on the methodology employed
Box 2 Data and methodology
The data and information used in this paper were collected through multiple sources A face-to-face survey using computer-assisted and mobile-based personal interviews was jointly conducted by the International Food Policy Research Institute (IFPRI) and the Agricultural Research Council of Nigeria (ARCN) in Nigeria between May and July 2010 and a similar survey was jointly conducted by IFPRI and the Science and Technology Policy Research Institute (STEPRI) in Ghana between May and July 2011 Two sets of questionnaires were used The first targeted organizations to be answered by the head or designated representative the second targeted individual researchers The survey was complemented by interviews with key informants and relevant literature reviews
In Nigeria a total of 47 relevant public-sector organizations involved in agricultural research were interviewed including all 15 of ARCNrsquos agricultural research institutes all 11 federal colleges of agriculture(FCA) and 21 of 48 faculties of agriculture and veterinary medicine in federal universities (based on the willingness of organizations to participate and respond to the survey) In Ghana a total of 16 public-sector organizations involved in agricultural research were interviewed including all 9 agriculture-related research institutes under CSIR 1 of 3 relevant nonndashCSIR research centers the Cocoa Research Institute of Ghana (CRIG) based on the willingness of organizations to participate in and respond to the survey and 6 of 15 faculties of agriculture in public universities identified by STEPRI and ASTI (Flaherty et al 2010)
Face-to-face surveys of 3ndash20 randomly selected staff per organization were then conducted by the IFPRIndashARCNndashSTEPRI teams Actual sample sizes depended on the total number of research staff at each organization in Nigeria sample sizes ranged from 26 to 140 research staff in research institutes and from 5 to 214 staff conducting research in universities and in Ghana sample sizes ranged from 10 to 77 research staff in research institutes and from 5 to 29 staff working on research in universities In Nigeria of a total of 3920 researchers (individuals not FTEs) a random sample of 344 were interviewed (9 percent) in Ghana of a total of 706 researchers a random sample of 237 were interviewed (33 percent)
Source Authors
12
3 RESULTS AND DISCUSSION
The discussion that follows focuses on the differences between average observed and perceived performance measures in Nigeria and Ghana and how they relate to the different policies or priorities of organizations in these countries3 Specific indicators reflecting capacity peer effects and incentive systems are examined to determine which of them explain the variations in performance measures
Indicators of Observed Research Productivity
Low Number of Technologies Produced Based on Budget and Staffing Levels
In 2009 ARCN in Nigeria began collecting and taking inventory of all the technologies developed by its research institutes since 1997Between1997and2008 205 technologies were reported in total including 58 biological technologies (new breeds and varieties) 56 mechanical technologies 19 chemical technologies and 72 improved production and management practices (Table 2) The resulting ratio of available researchers to the number of technologies produced is 21 suggesting that it took four to six researchers (the common number of researchers in a team to develop a technology) to develop two to three technologies in 12 years4 The ratio of the research expenditures to the number of technologies produced is 351 suggesting that total research expenditure is about $35 million in 2005 purchasing power parity (PPP)5 prices per technology produced6 While no international standards or estimates for optimal research expenditure per technology exists (mainly due to differences in the nature and production of technologies and in cost structures and local contexts) revisiting some of the costndashbenefit analyses in existing literature indicates that the total research expenditure per new variety on common beans developed by Michigan State University was around $028 million (Maredia Bernsten and Ragasa 2010) This suggests that research expenditure per technology in Nigeria is higher than indicated by Maredia Bernsten and Ragasa (2010)
In Ghana Obirih-Opareh Essegbey and Frempong (2008) compiled 38 technologies cutting across crops livestock fisheries and others released in 2008 IFPRI and STEPRI are currently compiling data on the wider range of agricultural technologies produced but a preliminary estimate indicates that CSIR and other research organizations had developed 109 improved technologies since their establishment (38 biological technologies or new varieties 2 chemical technologies 7 mechanical technologies and 52 improved management practices from CSIR agricultural-based research institutes and 10 improved management practices from universities) Nevertheless these preliminary estimates have yet to be validated and hence cannot be used for comparison purposes at this stage
That being the case a survey of individual researchers is currently more informative About 75 percent of MSc- and PhD-qualified scientists in Nigeria and 52 percent of MSc- and PhD-qualified researchers in Ghana indicated that they had not contributed to the production of any technologies in the past five years Almost 20 percent of both MSc- and PhD-qualified researchers in Nigeria produced neither a technology in the previous five years nor a publication in the previous three years Twelve percent of PhD-qualified researchers and 37 percent of MSc-qualified researchers in Ghana reported not being involved in producing any technology (in the previous five years) or any publication (in the previous three years)
3More in-depth discussions can be found on Nigeria in Ragasa et al 2010 on Ghana in Ragasa and Essegbey 2011 and
on factors affecting research productivity at the scientist level in Ragasa 2011a 4Based on ASTI data the average number of researchers employed at ARCN during 1990ndash2001 was roughly 500 FTEs
which would correspond to the researcher capacity contributing to producing new breeds released between 1997 and 2008 5PPP indexes are the preferred method for converting relative economic data because they measure the purchasing
power of currencies across countries by eliminating national differences in pricing levels in a wide range of goods and services and are relatively stable over time compared with traditional exchange rates (Beintema and Stads 2011)
6Based on ASTI data the average research expenditure at ARCN during 1990ndash2001 was roughly $60 million per year
or $720 million in total for 12-year period)
13
Table 2 Productivity indicators employed in the study
Indicators Nigeria Ghana
Total technologies produced 1997ndash2008 207a 109
b
New breedsvarieties 58 38
Improved production and management practices 72 68
Mechanicalprocessing technologies 56 7
Chemical technologies 19 2
Ratio of total FTE researchers to total technologies generated 2 4
Ratio of total FTE researchers to total new varietiesbreeds generated 9 11 Distribution of researchers reporting not having contributed to technologies generated ( of respondents) 75 52 Distribution of researchers reporting having produced at least one publication ( of respondents)disaggregated by
BSc qualification 79 25
MSc qualification 82 63
PhD qualification 88 88
Total number of publications producedc (mean) disaggregated by 628 337
BSc qualification 479 033
MSc qualification 647 219
PhD qualification 647 540 Distribution of researchers reporting having disseminated their publications ( of respondents) disaggregated by
BSc qualification 67 100
MSc qualification 77 62
PhD qualification 79 61
Number of dissemination events (mean) disaggregated by 413 173
BSc qualification 316 033
MSc qualification 450 114
PhD qualification 405 273
Distribution of researchers reporting having no knowledge of the use or impact of their publications ( of respondents) 70 85
Number of organizations reporting having registered patents 4 0
Number of organizations reporting having received awards 15 4
Source IFPRIndashARCN survey (MayndashJuly 2010) IFPRIndashSTEPRI survey (MayndashJuly 2011) a These data are for the period 1997ndash2008 b These are preliminary estimates of technologies produced and released since the establishment of the organizations they have yet to be validated c Publications are defined as books book chapters and peer-reviewed publications (particularly articles in international and national scientific journals) authored or coauthored in the previous three years d Dissemination events are defined as presentations by any of the authors at conferences workshops trainings or organized or informal meetings in which research results were shared and presented to other researchers policymakers farmers or extension agents
Limited Adoption and Impact Based on Researchersrsquo Perceptions and Field Visits
The picture is even more discouraging when looking at the reported adoption of technologies generated in Nigeria and Ghana More than 90 percent of the heads of the organization sand scientists interviewed reported that they were not aware of any evaluation or impact assessment studies of the technologies they produced Of the 87 scientists interviewed in Nigeria who reported having contributed to the development of at least one technology 63 percent were aware of the adoption level of technologies produced due to interactions with and feedback from farmers or extension agents (conversely 37 percent were not aware of adoption levels Figure 2) When the researchers were asked about their awareness of the extent of adoption 20 percent reported either no adoption or limited adoption of
14
their technologies 29 percent reported some adoption 13 percent reported moderate adoption and 1 percent reported wide adoption7
Figure 2 Distribution of researchers based on their knowledge of the adoption of technologies they produced
Source IFPRIndashARCN survey (MayndashJuly 2010) IFPRIndashSTEPRI survey (MayndashJuly 2011) Note Units in parenthesis on the x axis indicate the number of researchers who reported having contributed to at least one technology produced and released by their organization in the previous five years
The situation in Ghana is even more alarming in terms of the reported adoption of technologies Of the 114 researchers who reported having contributed to the development of a technology only 24 percent were aware of their adoption rates (conversely a huge 76 percent were unaware of adoption rates) These high percentages of researchers without knowledge or feedback on the adoption or impact of their technologies is consistent across research institutes CRIG and the faculties of agriculture Of those that reported being aware of the adoption of technologies produced 5 percent reported limited adoption of their technologies 4 percent reported some adoption and 15 percent reported wide adoption In early 2011 CSIR and IFPRI also began to look at the adoption rate of a few technologies (using a sample of 10 technologies reported by scientists and the heads of organizations as having high adoption rates) Preliminary results suggest that based on focus group interviews and field visits only 4 of the 10 technologies had been well adopted 1 technology had been adopted at a medium level and the remaining 5 technologies had been adopted at low levels or not at all (van Rheenen et al 2011) This indicates that adoption may in fact be lower than reported by scientists
In terms of technology commercialization and patent registration four research institutes reported having patents for their technologies (patents per organization ranged from 1 to 5) while there were no reported patents developed by any organization in Ghana This is another indication of low transfer and uptake of technologies developed in research institutes to farmers and other end-users in both countries
Lower Publication Rate in Ghana than in Nigeria
Researchers in Nigeria reported producing more publications8than those in Ghana across all qualification levels In terms of the average number of publications BSc-qualified researchers in Nigeria had published four to five publications in the previous three years or one to two publications per year MSc-
7 Scientists were given the choice of 1 = no adoption in areas where it is expected to benefit 2 = limited adoption (less
than 10 percent) 3 = some adoption (21ndash40 percent) 4 = moderate adoption (41ndash60 percent) and 5 = wide adoption (more than 61 percent)
8Publications include peer-reviewed publications particularly articles in national and international scientific journals
books and book chapters published as first author or coauthor
0
20
40
60
80
100
Nigeria (87) Ghana (114)
Shar
e o
f re
sear
che
rs (
)
No knowledge Zero adoption
Limited adoption (lt20) Some adoption (21-40)
Moderate adoption (41-60) Wide adoption (gt60)
15
and PhD-qualified researchers had published six to seven publicationson average in the previousthree years or two to three publications per year In contrast BSc-qualified researchers in Ghana had hardly published anything in the previous three years MSc-qualified researchers had published about two publications in the past three years while PhD-qualified researchers had published five to six publications in the previous three years
More Dissemination in Nigeria But Limited Knowledge of Impact of Publications in Both Countries
A large proportion of researchers reported never having disseminated their publications9 (21ndash23 percent in Nigeria and 38ndash39 percent in Ghana) and a higher percentage of researchers in Nigeria than in Ghana reported having disseminated their publications Researchers employed at research institutes in Nigeria tend to disseminate more publications than their colleagues at federal colleges of agriculture or at universities (which makes sense given that the primary teaching mandate in the higher education sector) PhD-qualified researchers employed at CRIG tend to disseminate more of their publications than do their colleagues at research institutes or universities in Ghana
In terms of the average number of events where publications were disseminated the averages were four events in Nigeria and one to two events in Ghana To capture the effectiveness of publications researchers were asked about any feedback they received or their knowledge of the use of their publications and by whom The vast majority had received no feedback (70 percent in Nigeria and 85 percent in Ghana) of those who said they received feedback most reported that their books and papers were used by students or as textbooks in schools while others mentioned that readers had contacted them to ask for more information on their research There seems to be no feedback mechanism in the organizations and lack of interest among researchers to know who uses their publications and to what extent
Variability across Organizations within a Country Context
Results of analyses of variance indicate wide variation across organizations in terms of measures of research output and perceptions on adoption suggesting scope for differentiating well- and poorly performing organizations and identifying possible explanations Building on this the survey questionnaire asked heads of organizations to list their recommendations of the top three well-performing organizations (1) in terms of technologies generated and publications produced and (2)in terms of impact on farmers and the community they could also choose their own criteria and name the top three well-performing organizations that fit them Among the criteria chosen were fundingrevenues generated and level and advancement of facilitiesphysical infrastructure Results suggest that the organizations chosen for the first and third sets of rankings tended to be the same indicating a strong correlation between fundingphysical resources and research output The majority of respondents indicated no awareness of the impact of their own organization or others hence they were unable to answer the question about impact on farmers and the community For those that did answer that question responses were consistent with organizationsrankings given for the other questions
Limited Correlation among Conventional Performance Measures
The consistency of performance measures was explored through correlation analyses the results of which indicate that only a few of the measures were positively correlated whereas many were either not statistically correlated or were negatively linked (Appendix Table A3) The perceived adoption of technologies produced was positively correlated with peer rating in Nigeria but the opposite was the case in Ghana In Nigeria perceived adoption was also positively correlated with the number of awards received and the total number of technologies generated and publications produced but in both Nigeria
9Dissemination events are defined as presentations by any of the authors at conferences workshops trainings or
organized or informal meetings in which research results were shared and presented to other researchers policymakers farmers or extension agents
16
and Ghana it was negatively correlated with research productivitymdashthat is the number of technologies generated and publications produced per staff member Seemingly the total output produced and the size of organizations are seen as measures of performance but not necessarily of effectiveness and productivity The total number of technologies generated per staff member was positively correlated with the number of publications produced per staff member
The number of awards received was negatively correlated with research productivity in both Nigeria and Ghana but positively correlated with perceived adoption of technologies in Nigeria In Ghana the number of publications per PhD- and MSc-qualified staff member the number of dissemination events held and the perceived use of publications and technologies were positively correlated with peer rating
There seems to be limited complementarity and consistency across the different measures of performance used suggesting multiple objectives and perceptions both of performance and of performance measures In addition observed research outputs may not provide researchers or organizations with better awareness of adoption or impact This diversity of perceptions and objectives suggests the need for some tradeoffs in choosing and prioritizing realistic sets of indicators and targets based on the various mandates of the organizations in question With this in mind instead of creating an index of performance measures in this paper each was correlated with capacity and incentive measures
Connectivity and Linkages with Other Innovation Actors
Linkages with other innovation actors are analyzed at the individual researcher level by directly asking them about the frequency of their interactions with other innovation actors The responses were then averaged out at the organization level
Linkages with Other Researchers
Higher shares of MSc- and PhD-qualified researchers in both Nigeria and Ghana reported interacting with national and international researchers as coauthors of publications About 63 and 76 percent of PhD-qualified researchers in Ghana reported international collaboration and coauthorship respectively compared with only24 and 23 percent respectively in Nigeria Of the MSc-qualified researchers 78 percent of those in Ghana and 48 percent of those in Nigeria reported national collaboration
For those researchers who reported having generated technologies the majority in both countries reported not having collaborated either nationally or internationally For those that had collaborated national collaboration was more common for both MSc- and PhD-qualified researchers in Nigeria than it was for those in Ghana International collaboration was more prevalent among MSc-qualified researchers in Ghana than MSc-qualified researchers in Nigeria but it was more common among PhD-qualified researchers in Nigeria than PhD-qualified researchers in Ghana It is also interesting to note that BSc-qualified researchers in Ghana were collaborating both nationally and internationally
Researchers in Nigeria reported higher levels of interaction with researchers in other organizations 6 percent of those in Nigeria reported not having interacted with other researchers in the previous year compared with 12 percent in Ghana (Figure 3) Researchers employed at CRIG appear to have been less connected 39 percent reported not having interacted with researchers outside their organizations in the previous year
Limited Linkages with Farmers and Extension Services
Many researchers in both Ghana and Nigeria had not interacted with farmers or extension agents in the previous year but there was no statistical significance between the two countries in terms of the reported frequency of interactions About 25 and 27percent of researchers in Nigeria and Ghana respectively reported not having interacted with farmers in the previous year (Figure 3) 51 and
17
43percent of researchers in Nigeria and Ghana respectively had also not interacted with extension agents in the previous year
Figure 3 Distribution of researchers based on frequency of interaction with innovation actors
Panel A Nigeria Panel B Nigeria
Panel A Ghana Panel B Ghana
Source IFPRIndashARCN survey (MayndashJuly 2010) IFPRIndashSTEPRI survey (MayndashJuly 2011)
One institutional arrangement promoted mainly through World Bankndashfunded projects to foster greater interaction among innovation actors is researchndashextension linkage committees (RELCs) in Ghana and researchndashextensionndashfarmerndashinput-supplier linkage system committees (REFILS) in Nigeria These committees were established as platforms for joint priority-setting information sharing and demand articulation but with only limited success In Ghana RELCs operate at the regional and district level each RELC has 15 members including two representatives of farmer organizations one representative from a nongovernmental organization (NGO) one representative from agribusiness and representatives from research and extension services Several reports have concluded that the approach is useful in demand-driven priority-setting (Bekure and Annor-Frempong 1998 FAOndashDFIDndashODI 2002) but a number of studies have highlighted some limitations in fostering sustained interaction and linkages among innovation actors (Doamekpor 2005 Spielman Ragasa and Rajalahti 2011 Ragasa 2011b)
Survey data suggest that in Ghana half of the faculties of agriculture and 40 percent of agricultural research institutes had never participated in RELCs Moreover less than 30 percent of researchers in these institutes and faculties reported being involved in RELC activities Half of these organizations said that less than 10 percent of their researchers were involved in RELCs A survey of 237 agricultural researchers suggests that 87 percent were not involved in RELCs About 70 percent of researchers reported producing at least one new technology in the previous five years or producing at least one publication in the previous three years but they had never used RELCs as a platform for identifying problems and disseminating their new innovations This is alarmingly low participation
0
20
40
60
80
100
Farmers Extensionagents
Privatesector
NGO Other researchers
Intl org MoA
Sh
are
of
rese
arc
he
rs (
)
Never A few times a year
About once a month Several times a month
0
20
40
60
80
100
Farmers Extensionagents
Privatesector
NGO Other researchers
Intl org MoA
Sha
re o
f re
sea
rch
ers
(
)
Never A few times a year
About once a month Several times a month
0
20
40
60
80
100
Farmers Extension agents
Private NGO Research institutes
Intl org MoFA
Sh
are
of
rese
arc
he
rs (
)
Never A few times a year
About once a month Several times a month
0
20
40
60
80
100
Farmers Extension agents
Private NGO Research institutes
Intl org MoFA
Sh
are
of
rese
arc
he
rs (
)
Never A few times a year
About once a month Several times a month
18
Of the 70 extension agents interviewed in an IFPRI and World Bank survey in 2008 51 percent were not aware of RELCs (Ragasa 2011b) and 70 percent had not sourced any information improved management practices or technology in any RELCndashrelated activities Across all 600 technologies or management practicespackages promoted by the 70 extension agents in 2007 agents reported that only 6 percent had been derived from RELCndashrelated activities Nevertheless the majority of topics and technologies promoted by extension agents (82 percent) had been sourced from or learned through colleges and training centers or through in-service training
In Nigeria REFILS operate at the zonal level All 13 of the countryrsquos agricultural research institutes were involved in REFILS activities because the institutes coordinate those activities in each zone However the number of staff within each organization who reported being involved in REFILS activities ranged from 2 to 100 percent of all research staff About half of organizations reported that the majority of their researchers were involved but the other half reported that less than 10 percent of their researchers were involved This suggests that a majority of researchers is not tapping into REFILS as a platform for obtaining feedback from farmers and disseminating their research and new technologies A number of the heads of organizations interviewed noted that REFILS was unable to promote collaboration between researchers and other innovation system actors Among colleges and universities engagement in REFILS was even weaker No faculties of agriculture in major universities were involved in REFILS despite their roles in agricultural research and innovation Only 55 percent of federal colleges of agriculture were involved in REFILS and for those colleges that were involved the percentage of staff involved was less than 10 percent
Beyond problems of participation the responses of heads of organizations suggest the presence of greater institutional and systemwide issues Lack of follow-up in response to the identified needs and problems of farmers is a major problem identified in both Ghana and Nigeria Heads of organizations attributed this to the lack of resources and funding available for innovation processes especially extension service provision Multistakeholder platforms only make sense when they are linked to research and innovation processes
Limited Linkages with Other Innovation Actors
Interactions with the private sector NGOs ministries of agriculture international organizations political authorities and policymakers are limited for researchers in both countries Despite REFILS and RELCs having an explicit focus on the private sector and other stakeholders private participation is limited About 35 percent of researchers in Ghana and 45 percent of those in Nigeria reported not having met with a private firm in the previous year In Ghana partnerships with private firms and NGOs were being promoted but only in a limited way In 1996 the Government of Ghana passed new policies and changed CSIRrsquos mandate to address private-sector concerns One of the new policies makes commercializing technologies a key function of CSIR to date however according to the survey no patented technologies exist
About 34 percent of researchers in Ghana and 58 percent of those in Nigeria reported having never met with international organizations About 36 and 46 percent of researchers in Ghana and Nigeria respectively reported not having met with Ministry of Agriculture (MOA) staff either at local or national levels (excluding MOA extension agents) About 50 and 69 percent of researchers in Ghana and Nigeria respectively said they had not met with an NGO in the previous year
There were no differences in the frequency of interactions across qualification levels but some distinct variations were reported across types of organizations For example the frequency of interactions of researchers from the research and higher education institutes were similar in Ghana but researchers at CRIG reported having more frequent interactions with the private sector and much less interaction with NGOs In Nigeria fewer researchers employed at research institutes reported lack ofinteractions with innovation actors compared with those at the universities and federal colleges of agriculture The federal colleges of agriculture reported the highest share of researchers who had not
19
interacted with innovation actors In Ghana fewer researchers employed at CRIG reported lack of interaction with farmers or private sector in the previous year however more researchers reported not having interacted with other innovation actors (especially NGOs researchers at other organizations and international organizations) Fewer researchers at universities than at research institutes reported not having interacted with all types of innovation actors Researches within the research institutes in Nigeria reported more linkages with innovation actors than those at Nigerian universities but the opposite was the case in Ghana Federal colleges of agriculture were the least connected of the three groups across all types of innovation actors including farmers and extension agents
The Gap between the Actual and Perceived Importance of Interactions
When researchers were asked what they thought the frequency of interactions should be in order for them to perform their work well and to increase their productivity the majority indicated that more frequent interactions were needed than were currently practiced Results suggest differences between the actual and perceived importance of the various frequency levels of interaction with various actors Overall 22ndash24 percent of researchers reported less frequent actual interactions with farmers than was perceived necessarysimilarly32ndash34 percent of researchers reported less frequent actual interactions with extension agents 34ndash37 percent reported less frequent interaction with the private sector and 40ndash44 percent reported less frequent interaction with NGOs than was perceived necessary Hence an examination of the factors hindering greater interaction would appear necessary Among the factors cited as hindering interaction with farmers in both Nigeria and Ghana were lack of vehicles or transportation remoteness of farmers lack of interest among farmers and researchers lack of funding to organized meetings with farmers time constraints and lack of existing contacts with farmers Heads of organizations in Nigeria and Ghana cited inadequate funding to facilitate interaction lack of project vehicles lack of a forum for interaction poor leadership structures weak implementation of some part of the memorandum of understanding (of a project) lack of interest on the part of the farmers weak farmer organizations lack of group formationfarmer mobilization lack of sustainability of collaborative efforts and farmer illiteracy in some cases For those who did report interacting with farmers or extension agents interactions were rated as either ldquousefulrdquo or ldquovery usefulrdquo to the researchersrsquo work and the majority said that they were able to share ideas learn about farmersrsquo problems and disseminate information technology and research findings to farmers or extension agents This indicates the presence of fundamental and structural constraints to greater interaction that need to be minimized
In contrast however about 10 and 15 percent of researchers in Nigeria and Ghana respectively did not believe that interactions with farmers were required in order for them to perform their work well Similarly 10 and 19 percent in Nigeria and Ghana respectively did not believe that interactions with extension agents were required and a further 10 percent of researchers in both countries approximately did not believe that interacting with other innovation actors was important for their work This indicates the need to raise awareness among researchers of the importance of these kinds of collaborations in order to shift the mindset of researchers regarding the importance of being connected to the wider innovation system
Two strategies would be useful for fostering greater connectivity among researchers (1) addressing the obvious lack of information on the importance and relevance of collaboration and linkages across the innovation system and (2) addressing the constraints to more frequent interaction as described by researchers and heads of organizations particularly in terms of the funding needed Many studies focus on the vital need for greater linkages and collaboration but few look at the constraints and disincentives that prevent this from happening
Strong Correlations with Other Performance Measures
Positive correlations exist between the frequency of interactions between researchers and various types of innovation actors In Nigeria for example more frequent interaction with farmers is correlated with
20
more frequent interaction with MOA staff NGOs and researchers at other organizations interaction with the private sector is positively correlated with interactions with NGOs researchers at other organizations and MOA staff and more frequent interaction with extension agents is positively correlated with more frequent interaction with NGOs international organizations and MOA staff In Ghana greater interaction between researchers and international organizations is positively correlated with all other sets of innovation actors with the exception of farmers More frequent interaction with MOA staff is positively correlated with all other types of innovation actors with the exception of researchers at other organizations The frequencies of interactions with farmers and extension agents are positively correlated Interaction with NGOs is positively correlated with frequency of interaction with the private sector and extension agents The analysis reveals two common themes in terms of the factors that hinder interaction among various innovation actors First there is general lack of interest in and motivation toward interacting particularly because it does not effect promotional advancement salary increases or recognition Second lack of funding is often the major constraint to collaboration and interaction between researchers and other innovation system actors
In Ghana interaction with farmers is negatively associated with technology generated and publications produced per PhD-qualified researcher at both the organizational and individual levels (Appendix Table A4) Interaction with extension agents is positively correlated with average publications per MSc-qualified researcher and negatively associated with perceptions of adoption Interaction with NGOs is negatively correlated with the average number of technologies generated per PhD-qualified researcher Interaction with the private sector is positively corelated with publications produced and the intensity with which they are disseminated by both MSc- and PhD-qualified researchers Interaction with international organizations and MOA staff is positively correlated with the average number of publications produced per MSc-qualified researcher International collaboration in producing publications is correlated with the average number of technologies generated and publications produced by PhD-qualified researchers
In Nigeria interaction with farmers extension agents NGOs and international organizations are all correlated with the average number of technologies generated per PhD-qualfied researcher Interaction with researchers at other organizations is correlated with the average number of publications produced per MSc-qualified researcher Interaction with MOA staff is correlated with the average number of technologies generated and publications produced by MSc-qualified researchers Average membership in associations is correlated with the average number of publications produced by PhD-qualified researchers Finally international and national collaboration are strongly and positively correlated with the number of publications produced per PhD- and MSc-qualified researcher
Staff Morale
Researchers were asked to rate their satisfaction with their level of research output compared with other staff in a similar position or with the same qualifications within their own or in other organizations Overall more researchers in Nigeria reported being satisfied with their outputs than those in Ghana Ten percent of researchers in Ghana and 25 percent in Nigeria were very satisfied but 20 percent of researchers in each country reported having little or no satisfaction with their output levels (Figure 4) These researchers said they would like to produce more which may be a valuable first step toward their achieving greater productivity under existing conditions
21
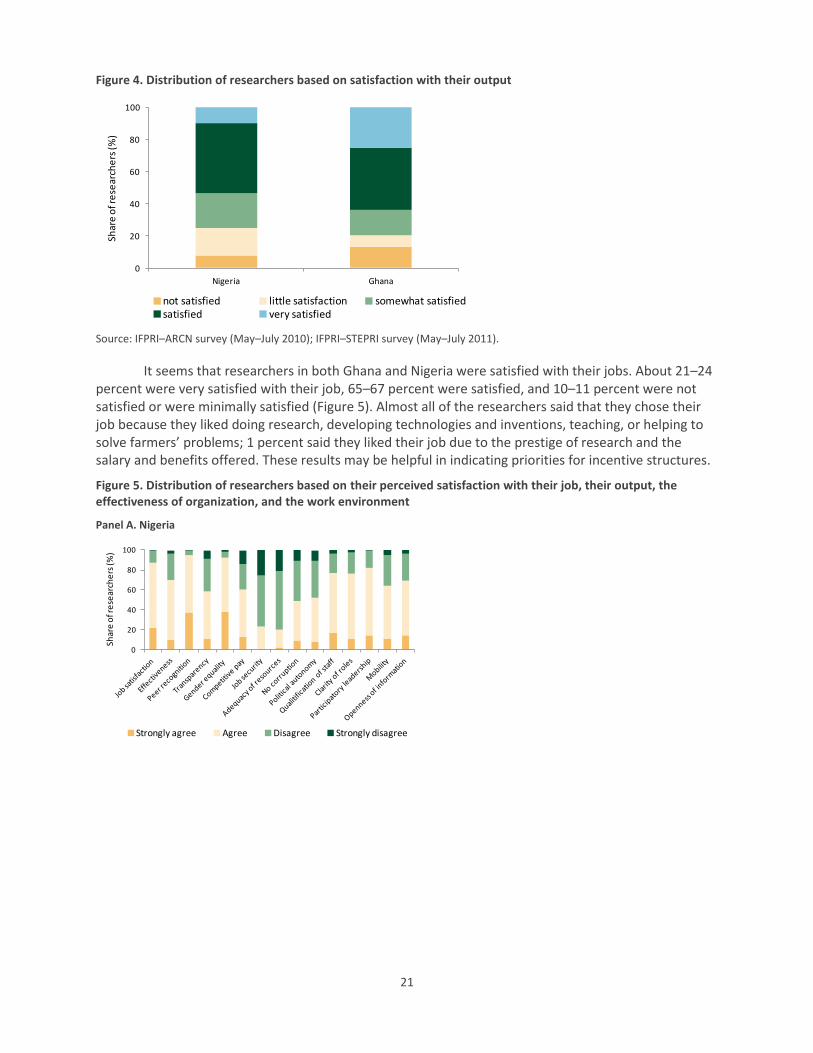
Figure 4 Distribution of researchers based on satisfaction with their output
Source IFPRIndashARCN survey (MayndashJuly 2010) IFPRIndashSTEPRI survey (MayndashJuly 2011)
It seems that researchers in both Ghana and Nigeria were satisfied with their jobs About 21ndash24 percent were very satisfied with their job 65ndash67 percent were satisfied and 10ndash11 percent were not satisfied or were minimally satisfied (Figure 5) Almost all of the researchers said that they chose their job because they liked doing research developing technologies and inventions teaching or helping to solve farmersrsquo problems 1 percent said they liked their job due to the prestige of research and the salary and benefits offered These results may be helpful in indicating priorities for incentive structures
Figure 5 Distribution of researchers based on their perceived satisfaction with their job their output the effectiveness of organization and the work environment
Panel A Nigeria
0
20
40
60
80
100
Nigeria Ghana
Shar
e o
f re
sear
che
rs (
)
not satisfied little satisfaction somewhat satisfiedsatisfied very satisfied
0
20
40
60
80
100
Shar
e o
f re
sear
che
rs (
)
Strongly agree Agree Disagree Strongly disagree
22
Figure 5 Continued
Panel B Ghana
Source IFPRIndashARCN survey (MayndashJuly 2010) IFPRIndashSTEPRI survey (MayndashJuly 2011)
In terms of effectiveness more researchers in Ghana than in Nigeria perceived that their organizations were effective based on their budgets and resources Fifteen percent of researchers in Ghana and 10 percent of those in Nigeria strongly agreed that their organization was effective (Figure 5) A further 63 and 60 percent of researchers in Ghana and Nigeria respectively merely agreed that their organization was effective This perception of effectiveness was not statistically correlated with actual productivity measures or performance indicators
These results coincide with researchersrsquo perceptions that their working environment and organizational practices reflected transparency accountability gender equality political autonomy fair and competitive compensation openness of information regarding output and performance of organization and satisfaction regarding available resources within organization among other factors Researchers in Ghana reported greater satisfaction based on the majority of aforementioned organizational practices Of these practices respondents in both Nigeria and Ghana reported low satisfaction withthe adequacy of physical resources and research funding themajority of respondents (78ndash80 percent) disagreed that resources wereadequate (Figure 5) Other factors that engenderedmuch dissatisfaction among respondents werefair and competitive compensation which is rated low by most staff in Ghana andjob security in Nigeria Lack of a competitive salary and benefits seems to be a bigger problem for researchers in Ghana whereas job security was a much bigger issuein Nigeria Corruption or misuse of fundingin organizations was the next factorthat wasrated low inboth countries Consistently high ratings were given for peer recognition and gender equality in opportunities (less than 20 percent of researchers weresatisfied with different aspects of their organizationrsquos climate)
The big differences between Ghana and Nigeria wereasfollows
1 A higher proportion of respondents reportedjob security as being an issue in Nigeria than in Ghanawhereasa higher proportion of respondents reported fair and competitive compensation as an issue in Ghana than in Nigeria The ratings forjob security in Nigeria weresurprisingbecause researchers employed at both the research instituteand higher education agencies were under tenureand key informants could not recall any instance of a staff member beingfired This anomoly requires further research
2 A higher proportion of respondents in Nigeria than in Ghana reported that corruption was an issue in research organizations
3 Proportionally more respondents in Nigeria than in Ghanareportedthat transparency in recruitment and promotion was an issue
0
20
40
60
80
100
Shar
e o
f re
sear
che
rs (
)
Strongly agree Agree Disagree Strongly disagree
23
4 Proportionally more respondents in Ghana than in Nigeria reported satisfaction withthe qualifications of research staff in their position and in their organization
5 Proportionally more researchers in Ghana than in Nigeriareported that there wasclarity of roles and responsibilties in theirresearch organizations
6 Proportionally fewer researchers in Ghana than in Nigeria reported thatpolitical interference was an issue
7 Proportionally more researchers in Ghana than in Nigeria reportedopenness of information about their organizationrsquos performance
8 Slightly more researchers in Ghana than in Nigeria reportedhaving greater mobility within their operational areas
Compared with other performance measures a composite index for the working environment isstrongly and positively correlated with other performance measures in both countries In Ghana peer ratings and the average number of publications produced per MSc- and PhD-qualified researcher were positively correlated with reported satisfaction with the working environment Perceptions of their organizationrsquos transparency were correlated with the average number of technologies generated per PhD- and MSc-qualified researcher
In Nigeria satisfaction with the work environment (based on almost all indicators as well as their average) was positively and strongly correlated with peer ratings and the average number of technologies generated per MSc- and PhD-qualified researcher Among the important aspects of the working environment that are correlated with performance measures the perception of participatory leadership the quality of human resources and peers within the organization and the organizationrsquos responsiveness to clientsrsquo complaints general effectiveness and openness of information were associated with technologies generated per MSc- and PhD-qualified researcher
In both Nigeria and Ghana more frequent interaction with extension agents was positively correlated with higher operating funding per FTE researcher Linkages with almost all actors were positively associated with satisfaction with the working environment Perceptions of transparency in the organizationrsquos methods of promotion recruitment decisionmaking political interference and corruption were positively correlated with the frequency of interaction with all actors Perceptions of mobility within the operating area were positively correlated with the frequency of interaction with researchers at other organizations In Nigeria access to the Internet was positively correlated with the frequency of interactions with researchers at other organizations In Ghana organizations located in Accra have more linkages with other actors with the exception of farmers and extension agents In Ghana more frequent interaction with researchers at other organizations was positively correlated with funding for capital investments per FTE researcher These results suggest that interaction and linkages largely depend on organizational issues and staff morale which either hinder or encourage them The survey indicated that important factors encouraging interaction include operating funds greater mobility improved transportation improved Internet access and other physical infrastructure
Capacity and Incentive System
The cornerstone of an effective performance-based reward system is an understanding of what motivates researchers and research managers Surprisingly the data indicate that the distinguishing line between capacity and motivation is thin When researchers and heads of organizations were asked about their motivations (through open-ended questions) most indicated the availability of basic resources peer effects and financial incentives
Motivation among Researchers
A sample of researchers interviewed in both countries rated higher salary and promotion as the top motivating factor for increasing their productivity and performance (Figure 6) Skills development and
24
0
10
20
30
40
50
60
Nu
mb
er o
f org
aniz
atio
ns
training and more timely release of funding ranked2nd and 3rd in Nigeria and peer recognition and appreciation by farmers ranked 2nd and 3rd in Ghana Rounding out the list in Nigeria were more research funding followed by better laboratories and infrastructure The most commonly mentioned factor in Nigeria was power supply In Ghana skills development and training and more research funding completed the list of motivating factors This reveals that incentives are not only financial but are also based on the availability of advancement opportunities in terms of developing skills and on a conducive work environment within which researchers can conduct their research In Nigeria for example at many research institutes researchers couldnrsquot even stay in their offices because they were too hot and there was often no electricity for days at a time
Figure 6 Distribution of organizations based on the top five motivations reported by the heads of organizations and individual scientists Nigeria and Ghana
Panel A Nigeria heads of organizations Panel B Ghana heads of organizations
Panel C Nigeria staff Panel B Ghana staff
Source IFPRIndashARCN survey (MayndashJuly 2010) IFPRIndashSTEPRI survey (MayndashJuly 2011)
Motivation among Heads of Organizations
Responses by heads of organizations differed in some respects in terms of motivating factors for increasing their productivity and performance In Nigeria 60 percent of heads of organizations cited research funding andor the timely release of funds as the most important motivating factor This was closely followed by facilities and physical infrastructure (all heads of federal colleges of agriculture mentioned this as the most important factor) A conducive work environment peer recognition high
0
10
20
30
40
50
60
70
Nu
mb
er o
f org
aniz
atio
ns
0
10
20
30
40
50
Nu
mb
er o
f org
aniz
atio
ns
0
10
20
30
40
50
Nu
mb
er o
f org
aniz
atio
ns
25
salaries (andor timely payment of salaries) and the impactadoption of technologies generated were among the top motivating factors In Ghana high salaries (andor health insurance) were the top motivating factor reported by 53 percent of heads of organizations Closely following were recognitionstatus staff morale or staff discipline and support career development and a conducive work environment
Mission Orientation and Organizational Management System
Indicators of mission orientation included (1) satisfaction with the organizationrsquos management systems (2) satisfaction with indicators used for monitoring and evaluating the performance of researchers (3) the mission orientation of the head of the organization and (4) the degree of control or flexibility the organization exerts through its culture Measures of organizational management procedures and systems were not statistically correlated (and were even negatively associated in some cases) with measures of performance Nevertheless researchers rated the presence of and their satisfaction with implementation and management procedures as low Half of the heads of organizations in both Nigeria and Ghana reported that they did not have an MampE system for organizational performance half the heads of organizations in Nigeria and 25 percent of those in Ghana reported that they did not have a strategic plan 35 and 7 percent respectively reported not having a staff performance appraisal system 35 and 25 percent respectively reported not having a training and staff development plan and 80 and 75 percent respectively reported not having a policy on intellectual property rights
OPAS was implemented in Ghana in the early 1990s which might explain the higher levels of satisfaction in Ghana and the presence of these management systems Nevertheless many organizations in Ghana have not implemented these systems despite OPAS OPAS is currently being implemented in Nigeria where it seems the issue is not lack of awareness or capacity to implement but the commitment to sustained implementation The Ghana Institute of Management and Public Administration (GIMPA) has organized leadership training sessions for CSIR on organizational management including evaluation MampE however even though MampE elements exist at various levels of CSIR management training on the application of the information and knowledge through GIMPA may be extremely useful Key informants reported that the trainings vary in depth and quality were mostly of a general nature and required implementation by management The fact that the systems were often not implemented signals that the trainings are often supply- rather than demand-driven The other problem is that the reality of applying these organizational systems is often very different from the theory Hence the problem boils down to a combined lack of commitment to implementation on the part of management and lack of adequate practical knowledge on the implementation process
Another area looked at was whether rewards or sanctionsdisciplinary actions were used Correlation and regression analysis suggests that rewards (that is positive reinforcements) are positively associated with performance in both Ghana and Nigeria This further suggests that incentive systems need to be implemented to provide a tangible ldquocarrotrdquo that increases productivity in research organizations as opposed to simply paying lip-service to MampE and staff appraisal systems
Missionorientation manifests itself in the performance indicators used by anorganization All the heads of organizations interviewedsaid that they report to and feel accountable to the executive director of CSIR or theprovost or dean of their university They enumerated various factorswhen asked to name thefive performance indicators used by these people to judge both their performance and the performance of the organizations In Nigeria 20 different responses resulted ranging from publications produced totechnologies generated to punctuality comittment and trainings conducted Ghana returned 13 different responses from heads of organizations ranging from internally generated funding to staff morale In both countries when the heads oforganization cited technology generation as a performance indicator higher numbers of technologies were generated by the organizationrsquos researchers If heads of organizations cited producing publications as a performance indicator the average number of publications produced per researcher was higher When impact on farmers or the
26
community was cited by the heads of organizations as a performance indicator researchers tended to display greater knowledge of technologies and their adoption and more knowledge of these and impact of their publications This indicates that researchers respond to their organizationrsquos chosen performance indicators signifying a point of entry for leaders and managers
Organizational Capacity and Resources
Several indicators were used to capture differences in resources the quality of human resources and peer effects which may explain variations in performance measures For physical and financial resources the following indicators were used (1) expenditure on research during 1992ndash2003 (disaggregated as salaries operating costs and capital investments)which would roughly correspond to most technologies generated during 1997ndash2008 (2) the ratio of research expenditure to FTE researchers and (3) the heads of organizationsrsquo satisfaction regarding the adequacy of physical resources Total funding (in 2005 PPP dollars) is correlated with peer ratings The ratio of operating costs to FTE researchers is positively correlated with the number of publications produced per MSc-qualified researcher in Ghana and the frequency of interaction with innovation actors is strongly correlated with the operating budget per FTE researcher in both Nigeria and Ghana
Research facilities and physical infrastructure are statistically correlated with technologies generated per PhD-qualified researcher in both Ghana and Nigeria and with awards received and peer ratings in Nigeria In both countries more than 90 percent of organizations were not satisfied or had little satisfaction with computer and Internet facilities and their access to journals About 92ndash95 percent of heads of organizations in Nigeria and 69ndash73 percent of those in Ghana were not satisfied with their information and communications facilities and systems at their headquarters and substations In terms of research facilities and other physical infrastructure 55 and 12 percent of heads of organizations in Nigeria and Ghana respectively said that they were not satisfied with the adequacy of facilities at their headquarters The rating was even worse for substations 65 and 37 percent of heads of organizations in Nigeria and Ghana respectively said they were not satisfied with the adequacy of facilities at their substations In both Nigeria and Ghana satisfaction with facilities communications libraries and transportation were associated with the average numbers of technologies generated and publications produced by PhD- and MSc-qualified staff
One difference between the two countries is that more heads of organizations were dissatisfied with the adequacy of their facilities and systems in Nigeria than in Ghana A related issue is the lack of modern research equipment mentioned by 17 heads of organizations and power supply mentioned by 15 heads of organizations In Nigeria funding dropped sharply and became irregular from the 1960s to the mid-1990s which negatively affected infrastructure and resources and seriously weakened organizationsrsquo ability to conduct research Nigeria is however attempting to accelerate its infrastructure development Capital investments accounted for only 2 percent of the CSIR agenciesrsquo research expenditures in 2008 whereas they constituted 45 percent of ARCNrsquos total spending that year As part of the reform process Nigeria is undertaking a systematic assessment of optimal investments in their facilities and equipment It seems that in the past there was too much focus on short-term training observations from this study suggest that investment in human resources or training can only be effective with complementary investments to fill gaps in the physical resources
For human resource capacity and peer effects three indicators were used (1) salary costs per FTE researcher (2) researchersrsquo perception of whether other researchers were well-qualified for their positions (signifying the quality of the pool and building on the peer-effect assumption within organizations) (2) perceptions of heads of organizations as to the adequacy of human resources (3) the ratio of PhD- to MSc-qualified researchers in the organization and (4) the percentage of researchers that reported having received technical training In Nigeria the ratio of PhD- to MSc-qualified staff and the number of technologies generated per FTE researcher were positively correlated In Ghana the ratio of PhD- to MSc-qualified researchers was positively correlated with the number of publications
27
produced per MSc-qualified researcher In both countries the higher the ratio of PhD- to MSc-qualified researchers the more productive researchers wherein generating technologies and producing publications
In Nigeria on average researcher perceptions that staff within their organization were well-qualified were correlated with higher perceived technology adoption rates higher numbers of technologies generated per PhD-qualified researchers and higher peer ratings In Ghana average numbers of publications produced per PhD-qualified researcher were positively correlated with perceptions that staff were well-qualified for their positions In Nigeria training appeared to be positively correlated with higher average numbers of publications produced per PhD-qualified researcher
4 CONCLUSION AND POLICY IMPLICATIONS
The task and processes involved in designing and implementing this study were complex and challenging The paper should be taken as a work in progress requiring ongoing refinements of measurements and definitions especially in the event that they are scaled out to other countries Moreover the results described in this paper only cover national agricultural research organizations (NAROs) so more research is needed to expand coverage to a wider set of innovation actors and to capture adoption rates and impacts on farmers and other end-users in order to fully assess the effectiveness of RampD investments and innovation performance of NARSs Nonetheless a number of observations and insights are informative from this ongoing pilot study in terms of entry points for strengthening capacity and performance of agricultural research organizations both in Ghana and Nigeria Key observations and insights are summarized below
Limited Farmer or Impact Orientation
Across all organizations in both Ghana and Nigeria there is lack of farmer- or impact-orientation and the approach being used is still supply-driven The number of publications produced is heavily emphasized especially in Nigeria as is internally generated (nongovernmental) funding in Ghana Some organizations emphasize the generation of technologies but stop short of follow-up on what happens to these technologies in terms of their adoption and impact Many researchers in both Ghana and Nigeria do not interact with farmers or extension agents and a large share has no knowledge or awareness of the adoption of the technologies they contributed to developing Only a few researchers and heads of organizations cited that helping farmers or having an impact on community was a motivating factor in their work an implicit or explicit measure of their performance or a guiding value in their organizationrsquos culture Although several workshopstrainings have been conducted in Nigeria and Ghana on the innovation systems perspective international agricultural research for development and similar approaches no NARO has implemented or fully embraced these approaches The closest involvement is in RELCs and REFILS but sustained interaction with farmers and agribusiness and participation in extension activities remain very weak
On a more positive note the output and productivity of researchers in some organizations in Ghana and Nigeria appears to shift in response to explicit performance indicators suggesting some entry points for intervention If heads of organizations cited that the number of publications produced was used as a performance indicator more publications were likely to be produced by their organizationsrsquo researchers If heads of organizations cited that the number of technologies generated was used as a performance indicator researchers are likely to generate more technologies on average The explicit inclusion of publications technologies adoption impact and solving farmersrsquo problems could be tested and implemented as performance indicators but an appropriate reward system would also need to be in place As OPASndashbased capacity strengthening is ongoing an urgent action for ARCN is to ensure that measurable targets are included in terms of the productivity and efficiency of research
28
the quality of research linkages and the impacts on farmers and the community Capacity strengthening efforts under the West Africa Agricultural Productivity Program (WAAPP) can also instigate stricter design and implementation of performance targets in organizations
This process however would require stronger leadership and management commitment to increase researchersrsquo accountability to farmers and end-users and to ensure that MampE processes are sustainably integrated into organizations For example a more effective performance-based reward system with greater transparency would be necessary External accountability would also help as would openness of information about organizational performance Increased levels of international research collaboration seem to be associated with higher levels of research output and productivity greater awareness of adoption and improved peer ratings Innovations adopted in other countries to increase researcher accountability have potential in Ghana and Nigeria (1) strengthening producer organizations to provide a leadershipmanagement role in setting priorities selecting service providers and implementing competitive research and extension grants and (2) hosting producer organizations in research institutes to cultivate their full engagement in developing research and technologies
Policy and Perspectives Are Reflected in Observed Performance
Overall performance measures used in Nigeria and Ghana differ according to national and institutional contexts and the different perspectives of their research councils On average researchers in Nigeria were more productive in terms of numbers of peer-reviewed publication per researcher compared with researchers in Ghana Such differences can result from stronger organizational emphasis on publications as an explicit organizational performance indicator and an implicit measure of peer recognition This is also associated with increased emphasis on internally generated and other nongovernment funding in Ghana which are associated with increased consultancies rather than peer-reviewed publications The results of this study are inconclusive when it comes to correlating technology generation with data constraints
Researchers in Ghana are generally more satisfied with their working conditions than are researchers in Nigeria In Ghana a majority of heads of organizations cited staff morale as a top motivating factor whereas none of the heads of organizations in Nigeria included staff morale in their rankings Researchers in Ghana reported having better linkages with other innovation actors than in Nigeria but researchers in Nigeria reported having better linkages with researchers in other organizations This could stem from greater emphasis on research collaboration in CSIR policy explicit NARO performance indicators and implicit peer ratings on generating nongovernmental funding which would require interaction and collaboration with the private sector NGOs and international organizations These linkages among Nigerian researchers also seem to be correlated with a stronger emphasis on the number of publications produced as the performance indicator in NAROs and ARCN which are generally enhanced by interactions with other researchers It seems that stronger linkages with other researchers is also correlated with more tangible research outputs but staff morale and increased linkages with end-users and other actors are not necessarily correlated
Inconsistencies in Performance Indicators
Complementarity and consistency are limited across the different measures of performance used suggesting multiple organizational objectives and perceptions of performance or performance measures For example more researchers in Ghana seems to have more linkages with innovation actors and are more satisfied with human and physical resources available to them their organizationsrsquo management practices and their working environment but these do not seem to translate into higher productivity in terms of technologies generated or publications produced More researchers in Ghana than in Nigeria perceived that their organizations were effective given their budget and resources In Nigeria more researchers perceived that adoption awards and peer ratings were all positively
29
correlated but in reality they were seemingly negatively correlated with productivity in terms of the number of technologies generated and publications produced and per PhD- and MSc-qualified researcher In Ghana productivity and peer ratings were positively correlated but all were negatively correlated with perceived adoption levels From a policy and operational perspective these multiple and inconsistentuncorrelated objectives suggest the need to rationalize and prioritize the indicatorstargets used in order to achieve a realistic and balanced set that organizations can implement and commit to based on their mandates Nevertheless regardless of the methods employed refocusing NAROs on their mission to have an impact on poor farmers and end-users would be beneficial This scope of this study needs to be expanded to include an examination of actual technologies adopted and their impact although this would depend on the availability of relevant data
Variability within Countries
Differences were also found in performance and linkage measures among organizations within each country There were pockets of organizations that perform well or poorly despite national and institutional continuity One does not even have to go out of their own countries to find examples of good practices It is important to draw lessons from well-performing organizations which implies identifying scalable elements across similar organizations in a given country Similarly larger well-performing organizations could offer insights and assistance to their smaller and less well-resourced counterparts
Infrastructure Acts As a Binding Constraint
Satisfaction with physical infrastructure and the work environment were statistically significant in explaining variations in several performance measures analyzed Among the indicators of work environment those most often significant were the perception of participatory leadership the absence of corruption and political interference and the presence of well-qualified staff transparency and open information Satisfaction with the adequacy of research facilities physical infrastructure and the Internet and communications systems were also statistically significant Salary and benefit levels were consistently mentioned by researchers and heads of organizations especially in Ghana but variations in the perceived competitiveness of salaries adequacy of salaries relative to living expenses and salary costs per FTE researcher did not appear to be statistically correlated with variations in any of the performance indicators Although further research is needed to investigate optimal salary levels in recommending priority investments for increasing their productivity and output the majority of researchers suggested improvements in basic facilities which contrasts the much heavier emphasis on low salaries highlighted as the binding constraint in other studies such as Byerlee 2004 Increasing capital investments and building physical resources will be important factors in both Nigeria and Ghana
Constraints To Greater Linkages
A large majority of researchers was aware of the crucial importance of linkages with other innovation actors but it seems that achieving them is hindered by structural barriers Currently researchers have limited linkages with innovations actors in both Ghana and Nigeria (although the situation is slightly better in Ghana) Improvement could be achieved first by shifting researchersrsquo mindset and strengthening their capacity to link with other innovation actors and end-users and second by addressing the constraints to greater linkages which include lack of funding and transportation and lack of interest or motivation by both parties In Nigeria while there is relatively stronger collaboration between research institutes and higher education agencies linkages with other stakeholders including private-sector actors service providers and end-users are highly limited New institutional and organizational frameworks are emerging from ongoing collaboration between ARCN and IFPRI to incorporate the promotion of industry funding and greater collaboration among stakeholders which
30
were suggested in initial presentations of the results of this study to ARCN It will be interesting to see how the Nigerian NARS develops in the next three to five years in light of the reform process
Many of these actions require substantial investment from the government and partners Infrastructure is a binding constraint especially in Nigeria and this requires investment Linkages are crucial but results indicate that they do not occur automatically but rather need to be encouraged through the use of incentives and supported financially through explicit inclusion in research and extension budgets Salary and benefit levels seem to be a greater issue in Ghana (although further study is needed to determine whether this is a binding constraint) and once again these require sustained investment Strengthening human resourcesmdashincluding technical scientific management innovation system and value-chain capacitymdashwhich seems to be needed in both Ghana and Nigeria also requires investment While Ghana is close to reaching an agricultural budget allocation of 6 percent of GDP its investment is still very low based the size and importance of its agricultural sector The ratio of agricultural expenditure to agricultural GDP is less than 2 percent in Ghana and only about 5 percent in Nigeria compared with the average of 8ndash10 percent achieved in agriculture-based Asian countries since 2000 (Fan Omilola and Lambert 2009 Omilola and Lambert2010) Ghana and Nigeria need to invest much more in agriculture in general and in agricultural RampD in particular
31
APPENDIX
Appendix Table A1 Performance indicators employed in the study
Performance measure Variable code Definition
1 Conventional indicators
Publications PUBPHD PUBMS Number of peer-reviewed publications as first author or coauthor (international journals national journals books) disaggregated by MSc- and PhD-qualified staff
Technology TECHFTE TECHPHD TECHMS
Biological or new breedsvarieties mechanical and processing technologies chemical technologies and improved production processing management conservation and marketing practices and systems at the organization-level this variable is the total number of technologies completed and released during 1997ndash2008 and expressed as a ratio of FTE researchers at the individual-level this variable is the total number of technologies completed and released in the past five years to which the respondentresearcher has contributed disaggregated by MSc- and PhD-qualified staff
Patents Number of patents registered
2 Organizational theory and public-sector motivation
Staff morale JOBSATIS Rating of the statement ldquoI am satisfied with my jobrdquo (LIkert scale 1ndash4)
EFFECTIVE Rating of the statement ldquoMy organization is effective given its budget and available resourcesrdquo (Likert scale 1ndash4)
Peer rating PEERRATE The number of times the organization is listed among the top five performing organizations rated by heads of other organizations (categorized by organization type) performance was determined based on productivity in publications and technologies and then by impact on the community organizations were also given the chance to list additional performance measures and name organizations that met them
Award AWARD Number of professional awards received by the organization or a researcher in the organization
Satisfaction with own performance
OUTPUTSATIS Rating of the statement ldquoI am satisfied with my output compared with similar positionsqualifications in the organizations or other organizationsrdquo (Likert scale 1ndash4)
3 Innovation systems perspective
Linkages FFARMER FEXT FNGO FPRIV FRES FINTL FMOA RESINTL RESNATL ASSO
Frequency of interactionsmeetings of researchers with farmers the private sector extension agents other researchers universitiescolleges international organizations ministries of agriculture policymakers and political actors in the past year (Likert scale 1ndash4) international or national research collaboration (dummy) Number of professional association memberships (dummy)
Adoption of joint priority-setting participatory approaches or innovation platforms
PARTICI Whether the organization adopts joint priority-setting participatory approaches or is engaged in innovation platforms (dummy)
Level of dissemination PUBDISS Number of dissemination events where publications produced have been disseminated or communicated in the past three years
Perceived adoption rate of technologies
ADOPT Whether respondents are aware of the adoption of their technologies produced (dummy)if they are aware to provide an assessment of the adoption rate (from 1=no adoption to 5=wide adoption)
Perceived use and impact of publications
PUBUSE Whether respondents are aware of the use or impact of publications produced (dummy)if they are aware to provide details of how it is being used or making an impact
Source Devised by authors Notes The Likert scale is a rating based on whether respondents strongly agree (= 1) agree (= 2) disagree (= 3) or strongly disagree (= 4)
32
Appendix Table A2 Capacity and incentive indicators employed in the study
Indicatorsvariable codes Definitionsmeasuressources of data
1 Organizational capacity Perceptions of head of organization and staff (ASTI data)
Human financial and physical resources (TOTALEXPEND OPERATINGFTE CAPITALFTE EXPENDFTE ADEQFUND ADEQPHY ADEQHUM PHDMS)
Total expenditures Ratio operating funds to FTEs (2000ndash02 average) ratio of capital funds to FTEs (2000ndash02 average) rating of the adequacy of research funds by head of organization and staff (Likert scale 1ndash4) rating of the adequacy of physical resources by head of organization and staff (Likert scale 1ndash4) rating of adequacy of human resources by head of organization and staff (Likert scale 1ndash4) ratio of PhD- to MSc-qualified staff
2 Organizational management systems Perceptions of head of organization and staff
Staff satisfaction on work environment (WORKENV EFFECTIVE JOBSATIS)
Response to 15 statements about the transparency of staff hiring and promotion fair and competitive pay gender equity in opportunities within the organization political autonomy coherence mobility responsiveness to clientsrsquo complaints and demands job security flexibility and participatory leadershipmdashfor example ldquoMy organization maintains a transparent process of hiring and promotionrdquo(Likert scale 1ndash4)
Availability of organizational management systems (PLAN)
Rating by head of organization of the adequacy of various organizational management systems such as the systems of performance monitoring and evaluation staff appraisals strategic planning operational planning and staff development and training planning (Likert scale 1ndash4) a composite index was also generated through factor analysis
Training (TRAIN) Whether respondents were receiving technical and management training (dummy)
3 Organizational culture type Perceptions of heads of organizations
Type of organizational culture (CONTROL) Rating of head of organization on 12 statements pertaining to the organizationrsquos values culture strategic focus and leadership style (percentage 1ndash100)
4Incentive systems and sources of external accountability
Perceptions of organization head and staff
Presence of reward (REWARD) Responses of head of organization on whether rewards were given in the previous year (dummy)
Presence of sanction (SANCTION) Responses of heads of organizations on whether disciplinary action was taken in the previous year (dummy)
Emphasis on technology as performance indicator (PERTECHNO)
Whether heads of organizations cite technology as a response to an open-ended question about the performance indicators used by the organization (dummy)
Emphasis on publication as performance indicator (PERPUB)
Whether heads of organizations cite ldquopublicationrdquo as a response to and open-ended question about the performance indicators used by organization (dummy)
Emphasis of impact as performance indicator (PERIMPACT)
Whether heads of organizations cite ldquoimpact on communityfarmers or adoption of technologiesrdquo as a response to an open-ended question about the performance indicators used by organization (dummy)
Salary (SALARYFTE SALARYOTHER SALARYLIVING)
Salaries per FTE perception of staff on the fairness and competitiveness of salaries in relation to same positionqualifications in other organizations (Likert scale 1ndash4) perception of staff on sufficiency of salary in relation to living expenses
Information shared to clientsstakeholders (INFO) Responses to statements about sharing information on the organization and its performances with clients stakeholders and the media (Likert scale)
Presence of donor funding (DONOR) Whether the organization has received donor funding (dummy)
Other controls Type of organization and location
Research institute higher education agency federal college nonndashCSIR research institute and zones or regions where the headquarters are located
Source Devised by authors Note The Likert scale is a rating based on whether respondents strongly agree (= 1) agree (= 2) disagree (= 3) or strongly disagree (= 4)
33
Appendix Table A3 Correlation of performance measures for Nigeria and Ghana
Variables ADOPTa TECHPHD
a TECHMS
a PUBLIPHD PUBLIMS PUBUSE PUBDISS AWARD PEERRATE
Nigeria
ADOPTa
TECHPHDa ndash (RI)
TECHMSa
PUBLIPHD ndash (RI) + (RI)
PUBLIMS ndash (RI) + (RI)
PUBUSE
PUBDISS
+ (UNI)
AWARD + (RI) ndash (All) ndash (All)
ndash(UNI) PEERRATE
ndash (RI)
+ (RI)
+ (All)
Ghana
ADOPTa
TECHPHDa ndash (RI)
TECHMSa
PUBLIPHD ndash(RI) + (RI)
PUBLIMS + (RI)
PUBUSE
PUBDISS
+ (All)
+ (UNI) AWARD ndash(FCA) PEERRATE ndash (RI)
+ (RI) + (All)
+ (FCA) + (All)
+ (FCA) + (All) + (FCA)
Source Compiled by authors from IFPRIndashARCN survey (MayndashJuly 2010) and IFPRIndashSTEPRI survey (MayndashJuly 2011) Note RI indicates research institutes UNI universities and FCA federal colleges of agriculture For descriptions of codes see Tables A1 and A2 a Includes research institutes only
34
Appendix Table A4 Correlations between performance measures linkages and other factors for Nigeria and Ghana
Factors ADOPTa TECHPHD
a TECHMS
a PUBPHD PUBMS PUBDISS PUBUSE AWARD PEERRATE
Nigeria
PHDMS
RESINTL + + + + +
RESNATL + + FFARMER + + FEXTFPRIV +
FRES + +
FINTL + FMOA + + ASSO + EFFECTIVE +
WORKENV + + + +
PLAN +
ADEQPHY + + +
PERFPUB + +
PERFTECHNO + +
TOTALEXPEND +
OPERATINGFTE + +
REWARD + +
Ghana
PHDMS +
RESINTL + + + + +
RESNATL + + + + +
FPRIV + + +
FRES + + +
FINTL +
FMOA + ndash
ASSO +
WORKENV +
+ + +
ADEQPHY +
+
CONTROL +
PERPUB + +
PERTECHNO + +
REWARD
+ + + +
OPERATINGFTE
+
EXPENDFTE +
TOTALEXPEND +
ACCRA
+ + ndash
Source IFPRIndashARCN survey (MayndashJuly 2010) IFPRIndashSTEPRI survey (MayndashJuly 2011) Note For descriptions of codes see Tables A1 and A2 a Includes research institutes only
35
REFERENCES
Alston J M C Chan-Kang M C Marra P G Pardey and TJ Wyatt2000 A Meta Analysis of Rates of Return to Agricultural RampD Ex Pede Herculem IFPRI Research Report No 113 Washington DC International Food Policy Research Institute
Bantilan M C S S Chandra P K Mehta and J D H Keatinge 2004 Dealing with Diversity in Scientific Outputs Implications for International Research EvaluationResearch Evaluation 13 (2) 87ndash93
Beintema N M and G-J Stads 2004 Sub-Saharan African Agricultural Research Recent Investment Trends Outlook on Agriculture 33 (4) 239ndash246
________ 2011 African Agricultural RampD in the New Millennium Progress for Some Challenges for Many IFPRI Food Policy Report Washington DC International Food Policy Research Institute
Bekure S and C Annor-Frempong 1998 Evolution of ResearchExtension Linkages in Ghana Accra Ghana World Bank
Byerlee D 2004 Enhancing Accountability and Impacts of Agricultural Research Systems in Developing Countries InNew Directions for a Diverse Planet Proceedings of the 4th International Crop Science Congress Brisbane Australia September 26‒October 1
Byerlee D and G Alex 1998 Strengthening National Agricultural Research Systems Policy Issues and Good Practice Agriculture and Rural Development Discussion Paper Series Washington DC World Bank
Byerlee D and R G Echeverriacutea eds 2002 Agricultural Research Policy in an Era of Privatization New York CABI International
Clark N 2005 Science Policy and Agricultural Research in Africa A Capacity Building Needs Assessment Paper commissioned by the New Partnership for Africarsquos Development lthttpwwwnepadstorg doclibrarypdfsdoc25_022005pdfgt
CTA (Technical Centre for Agricultural and Rural Cooperation) 2009 Performance Indicators for Agricultural Innovation Systems in the ACP regionSynthesis report of the International Expert Consultation Workshop July 15ndash17 2008 Wageningen The Netherlands
Daane J 2008 New Pathways to Build Capacity for Development Oriented Agricultural Research and InnovationWageningen The Netherlands International Centre for Development Oriented Research in Agriculture (ICRA)
Diao X P Hazell D Resnick and J Thurlow 2006 The Role of Agriculture in Development Implications for Sub-Saharan Africa DSGD Discussion Paper No 29 Washington DC International Food Policy Research Institute
Doamekpor P K 2005 Effectiveness of ExtensionndashResearch Linkages in Volta Region of Ghana In AIAEE 2005 Proceedings of the 21st Annual Conference San Antonio Texas
Echeverriacutea R G E J Trigo and D Byerlee 1996 Institutional Change and Effective Financing of Agricultural Research in Latin America World Bank Technical PapersWashington DC World Bank
Eicher C 2001 Africarsquos Unfinished Business Building Sustainable Agricultural Research Systems Department of Agricultural Economics Staff Paper Series 2001-10 East Lansing Michigan State University
________ 2003 Flashback Fifty Years of Donor Aid to African Agriculture Paper presented at the InWEnt IFPRI NEPAD and CTA Conference ldquoSuccesses in African Agriculturerdquo Pretoria South Africa December 1ndash3
________ 2004 Rebuilding Africarsquos Scientific Capacity in Food and Agriculture Department of Agricultural Economics Staff Paper 2004-12 East Lansing Michigan State University
Fan S 2002 Agricultural Research and Urban Poverty in India Environment and Production Technology Division Discussion Paper No 94 Washington DC International Food Policy Research Institute
Fan S C Fang and X Zhang 2001 How Agricultural Research Affects Urban Poverty in Developing Countries The Case of China Environment and Production Technology Division Discussion Paper No 83 Washington DC International Food Policy Research Institute
36
Fan S B Omilola and M Lambert 2009 Public Spending for Agriculture in Africa Trends and Composition ReSAKSS Working Paper No 28 Washington DC Regional Strategic Analysis and Knowledge Support System (ReSAKSS) International Food Policy Research Institute
FAO (Food and Agriculture Organization of the United Nations) 2002 Impact of Foreign Assistance on Institutional Development of National agricuLtural Systems in Sub-Saharan Africa FAO Research and Technology Paper 10 Rome
FAOndashDFIDndashODI (Food and Agriculture Organization of the United Nations Department for International Development and Overseas Development Institute) 2002 The Strategic Role of Information in Support of Sustainable Livelihoods Country Report ndash Ghana lthttpwwwodiorgukrapidProjectsR0093 Final_ReportsGhanapdfgt accessed September 30 2011
Flaherty K G O Essegbey and R Asare 2010 Ghana Recent Developments in Agricultural Research ASTI Country Note Washington DC International Food Policy Research Institute
Flaherty K G Ayoola J Ogbodo and N Beintema 2010 Nigeria Recent Developments in Agricultural Research ASTI Country Note Washington DC International Food Policy Research Institute
Gabre-Madhin E and S Haggblade 2003 Successes in African Agriculture Results of an Expert SurveyMarkets and Structural Studies Division Discussion Paper No 53 Washington DC International Food Policy Research Institute
Goldsmith A A 1993 Institutional Development in National Agricultural Research Issues for Impact Assessment Public Administration and Development 13 (3) 195ndash204
Gregory B T S G Harris A A Armenakis and C L Shook 2009 Organizational Culture and Effectiveness A Studyof Values Attitudes and Organizational Outcomes Journal of Business Research 62 (7) 673ndash679
Hall A L Mytleka and B Oyeyinka 2006 Concepts and Guidelines for Diagnostic Assessments of Agricultural Innovation Capacity UNU-MERIT Working Paper Series Maastricht The Netherlands United Nations University
Hall A V R Sulaiman N Clark and B Yoganand 2003 From Measuring Impact to Learning Institutional Lessons An Innovations Systems Perspective on Improving the Management of International Agricultural Research Agricultural Systems 78 (2) 213ndash242
Hall A N Clark R Sulaiman M V K Sivamohan and B Yoganand 2000 New Agenda for Agricultural Research in Developing Countries Policy Analysis and Institutional Implications Knowledge Technology and Policy (spring) 69ndash91
Hall A G Bockett S Taylor M V K Sivamohan and N Clark 2001 Why Research Partnerships Really Matter Innovation Theory Institutional Arrangements and Implications for Developing New Technology for the Poor World Development 29 (5) 783ndash797
Hazell P 2010 An Assessment of the Impact of Agricultural Research in South Asia since the Green Revolution Chapter 68 in Handbook of Agricultural Economics 4 Amsterdam North Holland
Heemskerk W N Lema D Guindo C Shouten Z Semgalawe H Verkuijl B de Steenhuijsen Piters and P Penninkhoff 2003 A Guide to Demand-Driven Agricultural Research The Client-Oriented Research Management Approach Rural Service Delivery for Agricultural Development Amsterdam Royal Tropical Institute
Heisey P and K Fuglie 2007 Economic Returns to Public Agricultural Research USDA-ERS Economic Brief No 10 Washington DC United States Department of Agriculture Economic Research Service
Henri J 2006 Organizational Culture and Performance Measurement Systems Accounting Organizations and Society 31 77ndash103
Henry G T and M M Mark 2003 Beyond Use Understanding Evaluationrsquos Influence on Attitudes and Actions American Journal of Evaluation 24 (3) 293ndash314
37
Horton D and R Mackay 2003a Special Issue Learning for the Future Innovative Approaches for Evaluating Agricultural Research and Development Agricultural Systems 78 119ndash336
________ 2003b Using Evaluation to Enhance Institutional Learning and Change Recent Experiences with Agricultural Research and Development Agricultural Systems 78 127ndash142
Horton D R Mackay A Andersen and L Dupleich 2000 Evaluating Capacity Development in Planning Monitoring and Evaluation A Case from Agricultural Research ISNAR Research Report 17 The Hague International Service for National Agricultural Research
IAC (InterAcademy Council) 2004 Realizing the Promise and Potential of African Agriculture Amsterdam InterAcademy Council
IAEG (Impact Assessment and Evaluation Group) 2001 Impact Assessment of Agricultural Research Context and State of the Art In The Future of Impact Assessment in the CGIAR Needs Constraints and Options Technical Advisory Committee Secretariat ed Proceedings of a workshop organized by the Standing Panel on Impact Assessment of the Technical Advisory Committee May 3ndash5 2000 Rome Technical Advisory Committee of the Consultative Group on International Agricultural Research
Jones M 2009 Key Challenges for Technology Development and Agricultural Research in Africa Institute of Development Studies Bulletin 36 (2) 46ndash51
Lynam JK and M J Blackie 1994 Building Effective Agricultural Research Capacity The African Challenge In Agricultural Technology Policy Issues or the International Community J R Anderson ed Wallingford UK CAB International
Manning N R Mukherjee and O Gokcekus2000 Public Officials and Their Institutional Environment An Analytical Model for Assessing the Impact of Institutional Change on Public Sector Performance World Bank Policy Research Working Paper 2427 Washington DC World Bank
Maredia M R Bernsten and C Ragasa 2010 Returns to Public Sector Plant Breeding in the Presence of Spill-Ins and Private Goods The Case of Bean Research in Michigan Agricultural Economics 41 425ndash442
Marshall J and A McLean 1988 Reflection in Action Exploring Organizational Culture In Human Inquiry in Action P Reason edLondon Sage Publications
Obirih-Opareh N GO Essegbey and G Frempong 2008 Agricultural Innovations Technological Inputs for Enhancing Agricultural Productions in Ghana STEPRI Accra
Omilola B and M Lambert 2010 Weathering the Storm Agricultural Development Investment and Poverty in Africa Following the Recent Food Price Crisis IFPRI Discussion Paper No 965 Washington DC International Food Policy Research Institute
Pardey P G J Roseboom J and N M Beintema 1997 Investments in African Agricultural Research World Development 25 (3) 409ndash423
Peterson W G Gijsbers and M Wilks 2003 An Organizational Performance Assessment System for Agricultural Research Organizations Concepts Methods and ProceduresISNAR Research Management Guidelines No 7 The Hague International Service for National Agricultural Research
Ragasa C 2011a Factors Affecting Researchersrsquo Productivity Multilevel and Comparative Analysis of Nigeria and Ghana Agricultural Research Organizations Paper presented at the IFPRI conference ldquoIncreasing Agricultural Productivity and Enhancing Food Security in Africa New Challenges and Opportunitiesrdquo November 1ndash4 Addis Ababa Ethiopia
Ragasa C 2011b Are ResearchndashExtensionndashLinkage Committees Effective and Inclusive Perspectives of Agricultural Researchers and Extension Agents in Ghana and Nigeria Paper presented at the International Conference ldquoInnovations in Extension and Advisory Servicesrdquo November 15ndash18 Nairobi Kenya
Ragasa C and G Essegbey 2011 Assessment of Capacity Incentives and Performance of Agricultural Research Organizations in Ghana Draft paper International Food Policy Research Institute Washington DC
38
Ragasa C S C Babu A S Adbullahi and B Y Abubakar 2010 Strengthening Innovation Capacity of Nigerian Agricultural Research Organizations IFPRI Discussion Paper No 1050 Washington DC International Food Policy Research Institute
Raina R 2003 Institutions and Organizations Enabling Reforms in Indian Agricultural Research and Policy International Journal of Technology Management and Sustainable Development 2 (2) 97ndash116
Ramanujam R and D M Rousseau 2006 Editorial Organizational Behavior in Healthcare The Challenges Are Organizational Not Just Clinical Journal of Organizational Behavior 27 (7) 809
Quinn R E 1988 Beyond Rational Management Mastering the Paradoxes and Competing Demands of High Performance San Francisco Jossey-Bass
Quinn R E and J Rohrbaugh 1983 A Spatial Model of Effectiveness Criteria Towards a Competing Values Approach to Organizational Analysis Management Science 29 363ndash377
Quinn R E and G M Spreitzer 1991 The Psychometrics of the Competing Values Culture Instrument and an Analysis of the Impact of Organizational Culture on Quality of Life Research in Organizational Change and Development 5 115ndash142 Greenwich CT JAI Press
Smith D R and A J Sutherland 2002 Institutionalizing Impact Orientation Building a Performance Management Approach that Enhances the Impact Orientation of Research Organizations Chatham UK Natural Resources Institute
Spielman D and R Birner 2008 How Innovative Is Your Agriculture Using Innovation Indicators and Benchmarks To Strengthen National Agricultural Innovation Systems World Bank Agriculture and Rural Development Discussion Paper 41 Washington DC World Bank
Spielman D and D Kelemework 2009 Measuring Agricultural Innovation System Properties and Performance Illustrations from Ethiopia and Vietnam IFPRI Discussion Paper No 851 Washington DC International Food Policy Research Institute
Spielman D C Ragasa and R Rajalahti 2012 Designing Agricultural Research Linkages within an Agricultural Innovation Systems FrameworkIn Agricultural Innovation Systems Sourcebook Washington DC World Bank (forthcoming)
Thirtle C L Lin and J Piesse 2003 The Impact of Research-Led Agricultural Productivity Growth on Poverty Reduction in Africa Asia and Latin America World Development 31 (12) 1959ndash1975
Walker T M Maredia T Kelley R La Rovere D Templeton G Thiele and B Douthwaite 2008 Strategic Guidance for Ex Post Impact Assessment of Agricultural Research Report prepared for the Standing Panel on Impact Assessment Consultative Group on International Agricultural ResearchScience Council Rome CGIAR Science Council Secretariat
World Bank 2001 Performance Audit Reports and Sectoral Overview Ghana National Agricultural Research Project (Credit 2247 - GH) National Agricultural Extension Project (Credit 2346 - GH) National Livestock Services Project (CREDIT 2441 - GH) Agricultural Diversification Project (Credit 2180 - GH) Agricultural Sector Investment Project (Credit 2555 - GH) World Bank Washington DC
________ 2007 Enhancing Agricultural Innovation How To Go Beyond the Strengthening of Research Systems Washington DC
________ 2011 Agricultural Innovation Systems Sourcebook Washington DC
Yawson R and A Sutherland 2010 Institutionalising Performance Management in RampD Organisations Key Concepts and Aspects Journal of Social Science 22 (3) 163ndash172
Yawson R W Amoa-Awua A Sutherland D Smith and S Noamesi 2006 Developing a Performance Measurement Framework to Enhance the Impact Orientation of the Food Research Institute Ghana RampD Management 36 (2) 161ndash172

i
Table of Contents
1 Introduction 6
2 Framework Measurements and Data 8
3 Results and Discussion 12
Indicators of Observed Research Productivity 12
Low Number of Technologies Produced Based on Budget and Staffing Levels 12
Limited Adoption and Impact Based on Researchersrsquo Perceptions and Field Visits 13
Lower Publication Rate in Ghana than in Nigeria 14
More Dissemination in Nigeria But Limited Knowledge of Impact of Publications in Both Countries 15
Variability across Organizations within a Country Context 15
Limited Correlation among Conventional Performance Measures 15
Connectivity and Linkages with Other Innovation Actors 16
Linkages with Other Researchers 16
Limited Linkages with Farmers and Extension Services 16
Limited Linkages with Other Innovation Actors 18
The Gap Between the Actual and Perceived Importance of Interactions 19
Strong Correlations with Other Performance Measures 19
Staff Morale 20
Capacity and Incentive System 23
Motivation among Researchers 23
Motivation among Heads of Organizations 24
Mission Orientation and Organization Management System 25
Organizational Capacity and Resources 26
4 Conclusion and policy implications 27
Limited Farmer or Impact Orientation 27
Policy and Perspectives are Reflected in Observed Performance 28
Inconsistencies in Performance Indicators 28
Variability within Countries 29
Infrastructure Acts As a Binding Constraint 29
Constraints in Greater Linkages 29
Appendix 31
References 35
ii
List of Tables
1 Socioeconomic indicators for Nigeria and Ghana 8
2 Productivity indicators employed in the study 13
Appendix Table A1 Performance indicators employed in the study 31
Appendix Table A2 Capacity and incentive indicators employed in the study 32
Appendix Table A3 Correlation of performance measures for Nigeria and Ghana 33
Appendix Table A4 Correlations between performance measures linkages and other factors for Nigeria and Ghana 34
List of Figures
1 A conceptual framework Analyzing an agricultural research systemrsquos performance and impact pathway within an innovation systems perspective 10
2 Distribution of researchers based on their knowledge of the adoption of technologies they produced 14
3 Distribution of researchers based on frequency of interaction with innovation actors 17 4 Distribution of researchers based on satisfaction with their output 21 5 Distribution of researchers based on their perceived satisfaction with their job their output
the effectiveness of organization and the work environment 21 6 Distribution of organizations based on the top five motivations reported by the heads of
organizations and individual scientists Nigeria and Ghana 24
List of Boxes
1 Background on Nigeria and Ghana 7
2 Data and methodology 11
iii
About the Authors
Catherine R Ragasa (cragasacgiarorg) is a postdoctoral fellow within the Development Strategy and Governance Division of the International Food Policy Research Institute Aliyu Sabi Abdullahi (aliyuabdullahiarcnigeriaorg) is the special assistant to the executive secretary and program manager of Planning and Institutional Development at the Agricultural Research Council of Nigeria and George Owusu Essegbey (goessegbeystepricsirorggh) is the director of the Science and Technology Policy Research Institute
Acknowledgments
The authors gratefully acknowledge the valuable comments provided on a draft of this paper by Nienke Beintema Shashidhara Kolavalli Gert-Jan Stads Jock Anderson and two anonymous reviewers The authors also thank Regina Birner and Suresh Babu for their feedback on the survey questionnaires used and Mary Jane Banks for editing the paper
iv
Acronyms and Abbreviations
agGDP agricultural gross domestic product ARCN Agricultural Research Council of Nigeria CAADP Comprehensive Africa Agriculture Development Program CORMA Client-Oriented Research Management Approach CRIG Cocoa Research Institute of Ghana CSIR Council for Scientific and Industrial Research (Ghana) FTE(s) full-time equivalent(s) GDP gross domestic product GIMPA Ghana Institute of Management and Public Administration IAD institutional analysis and development IFPRI International Food Policy Research Institute MampE monitoring and evaluation MDGs Millennium Development Goals MOA Ministry of Agriculture NARO(s) national agricultural research organization(s) NARS(s) national agricultural research system(s) NGO(s) nongovernmental organization(s) OPAS Organizational Performance Assessment System REFILS(s) ResearchndashExtensionndashFarmersndashInput-Supplier Linkage System Committees RELC(s) ResearchndashExtension Linkage Committee(s) RampD research and development STEPRI Science and Technology Policy Research Institute WAAPP West Africa Agricultural Productivity Program
v
Abstract
This paper combines elements of organizational design institutional analysis and innovation systems literature to empirically measure organizational performance of agricultural research agencies in Nigeria and Ghana Results presented in this paper are limited to researchersrsquo perceptions and measures at the national agricultural research organization (NARO) level and are part of a larger ongoing research program that assesses the effectiveness of RampD investment in these countries
Findings suggest a very weak to nonexistent farmer or impact orientation in NAROs in these countries given that large shares of researchers in the samples interviewed had not interacted with farmers or extension agents in the previous year nor had they any knowledge of the adoption or impact of the technologies they had contributed to generating Results suggest that NAROs in Nigeria are more productive than those in Ghana based on the number of publications produced their dissemination and the perceived adoption and impact of technologies and publications produced These factors are correlated with reports of greater emphasis on the part of their organizations on the number of publications produced and greater research linkages in most organizations in Nigeria compared with those in Ghana
Researchers in Ghana however reported more interaction with other innovation actors (other than researchers) which may be a reflection of a reported greater emphasis on internally generated (nongovernment) funding which in turn requires greater collaboration with the private sector nongovernmental organizations and other innovation actors Researchers in Ghana reportedly have higher staff morale which translates into higher job satisfaction satisfaction with the effectiveness of their organizations and satisfaction with their own work environment compared with researchers in Nigeria Interestingly this does not seem to be correlated with most performance measures other than linkages with other innovation actors
Within Nigeria and Ghana there seems to be variability across organizations suggesting that there are both well- and poorly performing organizations within not just across countries Consistent indicators that are all correlated with increased research productivity include the ratio of PhD- to MSc-qualified researchers the ratio of the operating budget to FTE researcher researchersrsquo satisfaction with their work environment and with the physical resources available in their organizations and the presence of international research collaboration and linkages with other innovation actors Since this is an ongoing pilot study continuous revision of the definitions and measures used is necessary but the information gained can be applied to other countries for benchmarking purposes to extract lessons from past implementation experiences and to identify realistic indicators of well-performing researchers and organizations that can be usefully measured across a variety of countries and contexts
6
1 INTRODUCTION
Numerous research and policy documents highlight the importance of agricultural productivity to food security and poverty reduction (World Bank 2007) Many studies also emphasize that increasing agricultural productivity requires investment in research and development (RampD) and extension usually coupled with infrastructure (Gabre-Madhin and Haggblade 2003 Diao et al 2006 World Bank 2007) Various studies have illustrated the high (although widely differing) rates of return to investment in agricultural research in developed and developing countries measured in tangible outputs often in the form of varietal improvement (Alston et al 2000 Fan Fang and Zhang 2001 Fan 2002 Thirtle Lin and Piesse 2003 Byerlee 2004 Heisey and Fuglie 2007 Walker et al 2008 Hazell 2010 Maredia Bernsten and Ragasa 2010) These findings are the primary justification underlying the advocation of increased investment in RampD and extension
Another set of the literature however points to the limited effectiveness of RampD and extension attributing continually high yield gaps to the inability of these systems to respond to producer demands and new sectoral challenges (Eicher 2001 2004 Byerlee 2004 IAC 2004 Clark 2005) Funding for agricultural RampD in developing countries increased in the 1980s and 1990s but issues of financial sustainability and over-reliance on donor funding ultimately emerged as major problems (Pardey Roseboom and Beintema 1997 Eicher 2001 2003 2004 Beintema and Stads 2011) Much of the literature on agricultural research capacity has focused on Africa mainly because of a general perception of weak and heavily fragmented research capacity there compared with other regions (Lynam and Blackie 1994 Pardey Roseboom and Beintema 1997 Eicher 2001 2003 2004 Beintema and Stads 2004 Daane 2008 Jones 2009 Beintema and Stads 2011)
While the need for increased funding and investment in RampD has been emphasized understanding is limited when it comes to the effectiveness and functioning of the RampD organizations and systems that will receive the intended investment Several attempts at reform and reorganization have been implemented and new arrangements have been adopted over the years (Echeverriacutea Trigo and Byerlee 1996 Byerlee and Alex 1998 FAO 2002 Byerlee and Echeverriacutea 2002 Raina 2003) but these developments are rarely analyzed in terms of implementation experiences outcomes and impacts No single study could be found that focuses on the perceptions values attitudes and motivations of agricultural scientists and how these relate to their activities and the outputs and outcomes generated With increasing scarcity of resources it is vital to understand how RampD organizations and scientists can be more effective and efficient
A major knowledge gap in understanding and strengthening RampD systems stems from the lack of empirical application of framework metrics and benchmarks to measure organizational performance and institutional impact in the context of agricultural research (Goldsmith 1993 Horton et al 2000 IAEG 2001 Mackay and Horton 2003a 2003b Henry and Mark 2003 Walker et al 2008 Yawson and Sutherland 2010) Frameworks for organizational performance assessment have been articulated by Smith and Sutherland (2002)Yawson et al (2006) and Yawson and Sutherland (2010) on the use of balanced scorecards for institutional capacity diagnosis by Peterson Gijsbers and Wilks (2003) on Organizational Performance Assessment System (OPAS)which uses a select group to rate the organizationrsquos research output such as technologies publications and organizational management systems and more recently on the Client-Oriented Research Management Approach (CORMA) which also diagnoses internal management practices and procedures but broadens the coverage of stakeholders providing the ratings (Heemskerk et al 2003)Still no single study shares experiences of the implementation process or compares and contrasts the experiences of various organizations or countries Moreover while these tools and metrics exist their use has been limited or unsustained which boils down to looking at incentives for or bottlenecks in institutionalizing impact orientation and organizational performance assessment For example while OPAS has been implemented within the institutes of Ghanarsquos Council for Scientific and Industrial Research (CSIR) very few organizations have
7
done any organizational performance assessment in recent years or used performance indicators beyond quantifying numbers of publications and trainings provided
This paper combines elements of existing frameworks metrics and benchmarks for organizational performance assessment having pilot-tested them in Nigeria and Ghana to compare and contrast levels of organizational performance and identify possible elements that explain variations in these measures The paper neither invents nor reinvents frameworks perspectives and approaches for analysis Rather it combines existing measures of organizational performance evaluation to illustrate that amore comprehensive look at organizational issues can yield useful insights and add value to current data collection and analysis by the Agricultural Science and Technology Indicators (ASTI) initiative which focuses on trends in research expenditure and human capacity More specifically this paper answers the following research questions
1 Are agricultural research organizations within Nigeria and Ghana performing differently and what are the factors that account for these differences
2 Are there patterns of differences between the agricultural research performance measures in Ghana and Nigeria that are explained by differences in their policies emphasis and practices
Comparing countries in terms of their organizationsrsquo structure and operations allows for possible explanations of why weaker or stronger indicators of organizational and individual researcher performance are observed (Box 1 Table 1)1
Box 1 Background on Nigeria and Ghana
In terms of policy environment both Nigeria and Ghana have had similar significant periods of agricultural policy change and structural adjustment over the years and yet they still have issues with low productivity and high yield gaps in their major crops Ghana however is performing better than Nigeria on many fronts In 2008 Ghana was close to achieving the 6-percent target growth rate for agriculture set by the Comprehensive Africa Agriculture Development Program (CAADP) whereas Nigeriarsquos growth rate was ndash03 percent Both countries have a low ratio of agricultural spending to agricultural GDP(less than 5 percent) which is much lower for example than Asian countries which average 10 percent (Fan Omilola and Lambert 2009) Ghana also reached the CAADP target of investing 10 percent of total public expenditures in agriculture as of 2009 whereas Nigeria only achieved a share of 45 percent that year In terms of economywide growth the 2009 GDP growth rate was 45 percent in Ghana and only 29 percent in Nigeria The same year malnutrition rates were 139 percent in Ghana (on track with Target 1 of the Millennium Development Goals [MDGs]) and 287 percent in Nigeria (well short of the target) and the poverty rate was 355 percent in Ghana (on track with Target 1 of MDGs) and 644 percent in Nigeria (once again considerably outside Target 1 of the MDGs Omilola and Lambert 2010)On a positive note after decades of decline agricultural research spending in Nigeria began to rise from 1998 and continued to climb until 2008 the last year for which data are available(in constant prices)
In terms of their national agricultural research systems (NARSs) Nigeria has the largest and most complex system in Sub-Saharan Africa operating against a historical backdrop of unstable governance institutions and funding Ghana has a relatively small system operating within a more stable environment yet it is hampered by financial human resource and infrastructural constraints In absolute terms Nigeriarsquos system is much larger and has higher agricultural research expenditures and staffing It also has a higher ratio of research expenditures to full-time equivalent (FTE) researchers as well as more researchers per million farmers than Ghana However Ghanarsquos percentage of agricultural research spending to agricultural GDP is higher (094 percent compared with 042 percent for Nigeria (Flaherty Essegbey and Asare 2010 Flaherty et al 2010) Both countries have instituted a series of NARS reforms but they have limited documentation and evidence of their effectiveness or the responsiveness of their research institutions to the needs of poor farmers
Source Authors
1 Note that this paper is part of a larger ongoing research initiative that looks at the cost-effectiveness and impact of
technologies in Nigeria and Ghana the paper should be taken as a work in progress given that continuous revision is needed to refine measurements and definitions
8
Table 1 Socioeconomic indicators for Nigeria and Ghana
Socioeconomic indicator Nigeria Ghana
Population 2010 (millions) 158 24
Poverty headcount ratio at national poverty line 2009(share of population []) 644 355
Gross national income per capita2008ndash10(US dollars) 1180 1173
Life expectancy 2007ndash09 (years) 51 64
Literacy rate 2009(share of population []) 61 67
Growth rate of gross domestic product 2009 () 29 45
Malnutrition rates 2009() 287 139
Agriculturersquos a share of gross domestic product ()a 33 31
Agricultural investment as a share of total public expenditure 2009() 45 10
Ratio of agricultural investments to agricultural gross domestic product 2009() lt5 lt2
Growth rate of agricultural gross domestic product 2009 () ndash03 45
Agricultural research expenditure 2008 (million PPP dollars) 392 95
Number of agricultural researchers 2008 (FTEs) 2062 537
Ratio of agricultural spending to FTE 2008 (millions) 020 018
Researchers per million farmers 2008 (FTEs) 168 90
Agricultural research expenditure 2008(share of AgGDP []) 040 094
Source Compiled by authors from World Bank Omilola and Lambert 2010 and ASTI database Notes PPP indicates purchasing power parity FTE full-time equivalent a Data for Nigeria are a two-year average for 2006ndash07 data for Ghana are a four year average for 2006ndash09
2 FRAMEWORK MEASUREMENTS AND DATA
This paper combines elements of institutional theory organizational design public-sector motivation literature and an innovation systems perspective to measure and explain variations in performance Institutional analysis and development (IAD) highlights the importance of institutional structures and governance in influencing behavior and performance Structures looked at are formal monitoring and evaluation (MampE) systems an organizationrsquos mission orientation and culture and financial incentives potentially affecting performance2 Organizational design theory emphasizes management systems and procedures for coordination and communication which can affect performance Systems and procedures looked at include the existence and implementation of an MampE system for performance staffrsquos satisfaction with the MampE system staff recruitment policy the performance appraisal system strategic and operational planning intellectual property rights planning and staff training and development planning Public-sector motivation literature emphasizes staff morale as an important link in the effectiveness efficiency and sustainability of public-sector organizations Staff morale is measured as a staff rating of their satisfaction with their job and work environment The innovation systems perspective focuses on (1) recognition of a wider differentiated set of innovation suppliers (2) demand responsiveness and better connectivity of agricultural research with a wider range of innovation actors beyond extension agents and farmers and (3) an expanded definition of the innovations being developed to include both economic and social applications (World Bank 2007 2011) These elements are captured by looking at the other innovation actors with whom researchers are
2Raina (2003) stresses the need to distinguish between organizational management systems and institutional reform
which is critical for the effectiveness of both policy and of innovation processes Organizational management often includes formal structures such as recruitment policies staff appraisal systems and other plans whereas institutional reform emphasizes organizational values culture motivations and staff accountability In addition to organizational management constraints Raina (2003) emphasizes the need to look at institutional constraints that can block the innovation process as well as sources of motivation that can improve performance
9
interacting and the level of those interactions Higher education institutes are included as innovation suppliers and some indicators are used to assess the use and impact of research outputs
In bringing these elements together a clear distinction is made between performance on the one hand and factors that potentially affect performance on the other Figure 1 presents a pathway from influencing factors to organizational performance to the outcomes and impacts of NARSs within a wider innovation system and broader policy and institutional context Associated factors explaining variations in performance are grouped as either capacity-or incentive-based Capacity is defined both in terms of the individual (skills knowledge education training and social capital) and the organization (physical and financial resources and human resource and management systems) Incentives are inherent to an individualrsquos preferences values and needs and are influenced by the nature of institutions and both formal and informal structuresnorms These can manifest themselves as formal incentives(salaries position classifications security and tenure)checks and balances the availability of timely information on performance or progress in achieving specific objectives the quality of reward systems the degree of mission-orientation and informal structures (such as organizational culture) (Hall et al 2000 2001 2003 Raina 2003) Organizational culture represents ldquothe collection of traditions values policies beliefs and attitudes that constitute a pervasive context for everything we do and think in an organizationrdquo (Marshall and McLean 1988 32) several studies have concluded that organizational culture affects an individualrsquos incentive to perform in various contexts Quinn and Rohrbaugh 1983 Quinn 1988Quinn and Spreitzer 1991Yeung et al 1991Ramanujam and Rousseau (2006) and Gregory et al 2009 have done empirical work on organizational culture using a ldquocompeting values modelrdquo that incorporates two sets of competing values within the organizations (1) the control versus flexibility dilemma which refers to preferences about structure stability and change and (2) the people versus organization dilemma which refers to differences in organizational focus The combination of two sets of competing values gives rise to four different dominant types of culture (1) group culture (2) development culture (3) rational culture and (4) hierarchical culture (Henri 2006 Gregory et al 2009) A balanced culture occurs when no one type of culture dominates Specific measures and survey questions on organizational culture as used in the aforementioned studies were adopted in this paper
10
Figure 1A conceptual framework Analyzing an agricultural research systemrsquos performance and impact pathway within an innovation systems perspective
CAPACITY AND INCENTIVE CONDITIONS PERFORMANCE IMPACTS
Agricultural research system
Source Devised by authors Notes Solid (thick) arrows represent the direction of impact solid (thinner) arrows represent important linkages and connectivity and broken arrows represent the feedback process
In terms of organizational performance three sets of indicators were drawn from the literature (1) conventional measures of productivity including quantification of technology developed and publications (such as Peterson Gijsbers and Wilks 2003 and Bantilan et al 2004) (2) public-sector motivation and performance emphasizing staff morale (for example Manning Mukherjee and Gokcekus 2000 World Bank 2001 and Yawson and Sutherland 2010) and (3) agricultural innovation systems indicators emphasizing connectivity and linkages among various innovation actors and measures of use and impact of innovations generated by the system (based on Hall et al 2001 2002 Hall Mytleka and Oyeyinka 2006 Spielman and Birner 2008 Spielman and Kelemework 2009 and CTA 2009)
Technology involves all technologies developed including biological chemical and mechanical technologies and improved production management conservation and marketing practices
Organizational culture
Mission orientation
Systems of accountability
Leadership style
Control versus flexibility
Enforcement of incentive systems
Culture
Institutional structure
Structure of ministries and departments
Decentralization
Institutional linkages
Systems of checks and balances
Organizational capacity
Availability and adequacy of human infrastructural and financial resources
Resource management
Procedures for coordination and linkages
Information systems and monitoring and evaluation
Performance monitoring and evaluation systems
Impacts
Increased agricultural GDP and GDP growth rate
Increased food security and nutrition
Reduced poverty
Environmental protection
Organizational performance
Research productivity
Cost-effectiveness and efficiency
Quality of linkages
Staff morale
Useful outcomes
Farmers and firms are adopting new technologies and practices
Influence in policy and regulatory processes
Increased yields
Reduced production costs
Increased incomes
Individual incentives
Beliefs and values
Personal goals and aspirations
Motivations
Compensation
Individual capacity
Education and training
Skills and knowledge
Social capital
Agricultural extension and education systems
Farmers and other value chain actors
Broader enabling environment
Agricultural policies and investments science and technology policy national development polices and linkages to political system and international actors
11
Publications include books book chapters and peer-reviewed publications (particularly articles in international and national scientific journals) published as first author or coauthor Additional measures are included such as patents and professional awards received by the organization or any of its staff Staff morale is measured as the respondentsrsquo ratings on their job satisfaction their satisfaction regarding the effectiveness of their organization given its budget their satisfaction of their own output in comparison to the input of other staff of similar qualifications in similar positions and their satisfaction in terms of their work environment The third set of innovation system indicators used includes the frequency of interactions with other innovation actors and end-users the quality of these linkages research collaboration dissemination of research outputs and the perceived rate of adoption of technologies generated and the perceived use of publications produced by research organizations Perceptions of scientists were triangulated with information from the heads of organizations as a proxy for adoption because actual adoption rates are currently being collected and validated Data collection at the farm level is ongoing The specific indicators for both individuals and organizations are detailed in Appendix Tables A1 and A2 the profile and characterization of responding researchers and organizations based on these indicators are presented in the next section of this paper See Box 2 for more information on the methodology employed
Box 2 Data and methodology
The data and information used in this paper were collected through multiple sources A face-to-face survey using computer-assisted and mobile-based personal interviews was jointly conducted by the International Food Policy Research Institute (IFPRI) and the Agricultural Research Council of Nigeria (ARCN) in Nigeria between May and July 2010 and a similar survey was jointly conducted by IFPRI and the Science and Technology Policy Research Institute (STEPRI) in Ghana between May and July 2011 Two sets of questionnaires were used The first targeted organizations to be answered by the head or designated representative the second targeted individual researchers The survey was complemented by interviews with key informants and relevant literature reviews
In Nigeria a total of 47 relevant public-sector organizations involved in agricultural research were interviewed including all 15 of ARCNrsquos agricultural research institutes all 11 federal colleges of agriculture(FCA) and 21 of 48 faculties of agriculture and veterinary medicine in federal universities (based on the willingness of organizations to participate and respond to the survey) In Ghana a total of 16 public-sector organizations involved in agricultural research were interviewed including all 9 agriculture-related research institutes under CSIR 1 of 3 relevant nonndashCSIR research centers the Cocoa Research Institute of Ghana (CRIG) based on the willingness of organizations to participate in and respond to the survey and 6 of 15 faculties of agriculture in public universities identified by STEPRI and ASTI (Flaherty et al 2010)
Face-to-face surveys of 3ndash20 randomly selected staff per organization were then conducted by the IFPRIndashARCNndashSTEPRI teams Actual sample sizes depended on the total number of research staff at each organization in Nigeria sample sizes ranged from 26 to 140 research staff in research institutes and from 5 to 214 staff conducting research in universities and in Ghana sample sizes ranged from 10 to 77 research staff in research institutes and from 5 to 29 staff working on research in universities In Nigeria of a total of 3920 researchers (individuals not FTEs) a random sample of 344 were interviewed (9 percent) in Ghana of a total of 706 researchers a random sample of 237 were interviewed (33 percent)
Source Authors
12
3 RESULTS AND DISCUSSION
The discussion that follows focuses on the differences between average observed and perceived performance measures in Nigeria and Ghana and how they relate to the different policies or priorities of organizations in these countries3 Specific indicators reflecting capacity peer effects and incentive systems are examined to determine which of them explain the variations in performance measures
Indicators of Observed Research Productivity
Low Number of Technologies Produced Based on Budget and Staffing Levels
In 2009 ARCN in Nigeria began collecting and taking inventory of all the technologies developed by its research institutes since 1997Between1997and2008 205 technologies were reported in total including 58 biological technologies (new breeds and varieties) 56 mechanical technologies 19 chemical technologies and 72 improved production and management practices (Table 2) The resulting ratio of available researchers to the number of technologies produced is 21 suggesting that it took four to six researchers (the common number of researchers in a team to develop a technology) to develop two to three technologies in 12 years4 The ratio of the research expenditures to the number of technologies produced is 351 suggesting that total research expenditure is about $35 million in 2005 purchasing power parity (PPP)5 prices per technology produced6 While no international standards or estimates for optimal research expenditure per technology exists (mainly due to differences in the nature and production of technologies and in cost structures and local contexts) revisiting some of the costndashbenefit analyses in existing literature indicates that the total research expenditure per new variety on common beans developed by Michigan State University was around $028 million (Maredia Bernsten and Ragasa 2010) This suggests that research expenditure per technology in Nigeria is higher than indicated by Maredia Bernsten and Ragasa (2010)
In Ghana Obirih-Opareh Essegbey and Frempong (2008) compiled 38 technologies cutting across crops livestock fisheries and others released in 2008 IFPRI and STEPRI are currently compiling data on the wider range of agricultural technologies produced but a preliminary estimate indicates that CSIR and other research organizations had developed 109 improved technologies since their establishment (38 biological technologies or new varieties 2 chemical technologies 7 mechanical technologies and 52 improved management practices from CSIR agricultural-based research institutes and 10 improved management practices from universities) Nevertheless these preliminary estimates have yet to be validated and hence cannot be used for comparison purposes at this stage
That being the case a survey of individual researchers is currently more informative About 75 percent of MSc- and PhD-qualified scientists in Nigeria and 52 percent of MSc- and PhD-qualified researchers in Ghana indicated that they had not contributed to the production of any technologies in the past five years Almost 20 percent of both MSc- and PhD-qualified researchers in Nigeria produced neither a technology in the previous five years nor a publication in the previous three years Twelve percent of PhD-qualified researchers and 37 percent of MSc-qualified researchers in Ghana reported not being involved in producing any technology (in the previous five years) or any publication (in the previous three years)
3More in-depth discussions can be found on Nigeria in Ragasa et al 2010 on Ghana in Ragasa and Essegbey 2011 and
on factors affecting research productivity at the scientist level in Ragasa 2011a 4Based on ASTI data the average number of researchers employed at ARCN during 1990ndash2001 was roughly 500 FTEs
which would correspond to the researcher capacity contributing to producing new breeds released between 1997 and 2008 5PPP indexes are the preferred method for converting relative economic data because they measure the purchasing
power of currencies across countries by eliminating national differences in pricing levels in a wide range of goods and services and are relatively stable over time compared with traditional exchange rates (Beintema and Stads 2011)
6Based on ASTI data the average research expenditure at ARCN during 1990ndash2001 was roughly $60 million per year
or $720 million in total for 12-year period)
13
Table 2 Productivity indicators employed in the study
Indicators Nigeria Ghana
Total technologies produced 1997ndash2008 207a 109
b
New breedsvarieties 58 38
Improved production and management practices 72 68
Mechanicalprocessing technologies 56 7
Chemical technologies 19 2
Ratio of total FTE researchers to total technologies generated 2 4
Ratio of total FTE researchers to total new varietiesbreeds generated 9 11 Distribution of researchers reporting not having contributed to technologies generated ( of respondents) 75 52 Distribution of researchers reporting having produced at least one publication ( of respondents)disaggregated by
BSc qualification 79 25
MSc qualification 82 63
PhD qualification 88 88
Total number of publications producedc (mean) disaggregated by 628 337
BSc qualification 479 033
MSc qualification 647 219
PhD qualification 647 540 Distribution of researchers reporting having disseminated their publications ( of respondents) disaggregated by
BSc qualification 67 100
MSc qualification 77 62
PhD qualification 79 61
Number of dissemination events (mean) disaggregated by 413 173
BSc qualification 316 033
MSc qualification 450 114
PhD qualification 405 273
Distribution of researchers reporting having no knowledge of the use or impact of their publications ( of respondents) 70 85
Number of organizations reporting having registered patents 4 0
Number of organizations reporting having received awards 15 4
Source IFPRIndashARCN survey (MayndashJuly 2010) IFPRIndashSTEPRI survey (MayndashJuly 2011) a These data are for the period 1997ndash2008 b These are preliminary estimates of technologies produced and released since the establishment of the organizations they have yet to be validated c Publications are defined as books book chapters and peer-reviewed publications (particularly articles in international and national scientific journals) authored or coauthored in the previous three years d Dissemination events are defined as presentations by any of the authors at conferences workshops trainings or organized or informal meetings in which research results were shared and presented to other researchers policymakers farmers or extension agents
Limited Adoption and Impact Based on Researchersrsquo Perceptions and Field Visits
The picture is even more discouraging when looking at the reported adoption of technologies generated in Nigeria and Ghana More than 90 percent of the heads of the organization sand scientists interviewed reported that they were not aware of any evaluation or impact assessment studies of the technologies they produced Of the 87 scientists interviewed in Nigeria who reported having contributed to the development of at least one technology 63 percent were aware of the adoption level of technologies produced due to interactions with and feedback from farmers or extension agents (conversely 37 percent were not aware of adoption levels Figure 2) When the researchers were asked about their awareness of the extent of adoption 20 percent reported either no adoption or limited adoption of
14
their technologies 29 percent reported some adoption 13 percent reported moderate adoption and 1 percent reported wide adoption7
Figure 2 Distribution of researchers based on their knowledge of the adoption of technologies they produced
Source IFPRIndashARCN survey (MayndashJuly 2010) IFPRIndashSTEPRI survey (MayndashJuly 2011) Note Units in parenthesis on the x axis indicate the number of researchers who reported having contributed to at least one technology produced and released by their organization in the previous five years
The situation in Ghana is even more alarming in terms of the reported adoption of technologies Of the 114 researchers who reported having contributed to the development of a technology only 24 percent were aware of their adoption rates (conversely a huge 76 percent were unaware of adoption rates) These high percentages of researchers without knowledge or feedback on the adoption or impact of their technologies is consistent across research institutes CRIG and the faculties of agriculture Of those that reported being aware of the adoption of technologies produced 5 percent reported limited adoption of their technologies 4 percent reported some adoption and 15 percent reported wide adoption In early 2011 CSIR and IFPRI also began to look at the adoption rate of a few technologies (using a sample of 10 technologies reported by scientists and the heads of organizations as having high adoption rates) Preliminary results suggest that based on focus group interviews and field visits only 4 of the 10 technologies had been well adopted 1 technology had been adopted at a medium level and the remaining 5 technologies had been adopted at low levels or not at all (van Rheenen et al 2011) This indicates that adoption may in fact be lower than reported by scientists
In terms of technology commercialization and patent registration four research institutes reported having patents for their technologies (patents per organization ranged from 1 to 5) while there were no reported patents developed by any organization in Ghana This is another indication of low transfer and uptake of technologies developed in research institutes to farmers and other end-users in both countries
Lower Publication Rate in Ghana than in Nigeria
Researchers in Nigeria reported producing more publications8than those in Ghana across all qualification levels In terms of the average number of publications BSc-qualified researchers in Nigeria had published four to five publications in the previous three years or one to two publications per year MSc-
7 Scientists were given the choice of 1 = no adoption in areas where it is expected to benefit 2 = limited adoption (less
than 10 percent) 3 = some adoption (21ndash40 percent) 4 = moderate adoption (41ndash60 percent) and 5 = wide adoption (more than 61 percent)
8Publications include peer-reviewed publications particularly articles in national and international scientific journals
books and book chapters published as first author or coauthor
0
20
40
60
80
100
Nigeria (87) Ghana (114)
Shar
e o
f re
sear
che
rs (
)
No knowledge Zero adoption
Limited adoption (lt20) Some adoption (21-40)
Moderate adoption (41-60) Wide adoption (gt60)
15
and PhD-qualified researchers had published six to seven publicationson average in the previousthree years or two to three publications per year In contrast BSc-qualified researchers in Ghana had hardly published anything in the previous three years MSc-qualified researchers had published about two publications in the past three years while PhD-qualified researchers had published five to six publications in the previous three years
More Dissemination in Nigeria But Limited Knowledge of Impact of Publications in Both Countries
A large proportion of researchers reported never having disseminated their publications9 (21ndash23 percent in Nigeria and 38ndash39 percent in Ghana) and a higher percentage of researchers in Nigeria than in Ghana reported having disseminated their publications Researchers employed at research institutes in Nigeria tend to disseminate more publications than their colleagues at federal colleges of agriculture or at universities (which makes sense given that the primary teaching mandate in the higher education sector) PhD-qualified researchers employed at CRIG tend to disseminate more of their publications than do their colleagues at research institutes or universities in Ghana
In terms of the average number of events where publications were disseminated the averages were four events in Nigeria and one to two events in Ghana To capture the effectiveness of publications researchers were asked about any feedback they received or their knowledge of the use of their publications and by whom The vast majority had received no feedback (70 percent in Nigeria and 85 percent in Ghana) of those who said they received feedback most reported that their books and papers were used by students or as textbooks in schools while others mentioned that readers had contacted them to ask for more information on their research There seems to be no feedback mechanism in the organizations and lack of interest among researchers to know who uses their publications and to what extent
Variability across Organizations within a Country Context
Results of analyses of variance indicate wide variation across organizations in terms of measures of research output and perceptions on adoption suggesting scope for differentiating well- and poorly performing organizations and identifying possible explanations Building on this the survey questionnaire asked heads of organizations to list their recommendations of the top three well-performing organizations (1) in terms of technologies generated and publications produced and (2)in terms of impact on farmers and the community they could also choose their own criteria and name the top three well-performing organizations that fit them Among the criteria chosen were fundingrevenues generated and level and advancement of facilitiesphysical infrastructure Results suggest that the organizations chosen for the first and third sets of rankings tended to be the same indicating a strong correlation between fundingphysical resources and research output The majority of respondents indicated no awareness of the impact of their own organization or others hence they were unable to answer the question about impact on farmers and the community For those that did answer that question responses were consistent with organizationsrankings given for the other questions
Limited Correlation among Conventional Performance Measures
The consistency of performance measures was explored through correlation analyses the results of which indicate that only a few of the measures were positively correlated whereas many were either not statistically correlated or were negatively linked (Appendix Table A3) The perceived adoption of technologies produced was positively correlated with peer rating in Nigeria but the opposite was the case in Ghana In Nigeria perceived adoption was also positively correlated with the number of awards received and the total number of technologies generated and publications produced but in both Nigeria
9Dissemination events are defined as presentations by any of the authors at conferences workshops trainings or
organized or informal meetings in which research results were shared and presented to other researchers policymakers farmers or extension agents
16
and Ghana it was negatively correlated with research productivitymdashthat is the number of technologies generated and publications produced per staff member Seemingly the total output produced and the size of organizations are seen as measures of performance but not necessarily of effectiveness and productivity The total number of technologies generated per staff member was positively correlated with the number of publications produced per staff member
The number of awards received was negatively correlated with research productivity in both Nigeria and Ghana but positively correlated with perceived adoption of technologies in Nigeria In Ghana the number of publications per PhD- and MSc-qualified staff member the number of dissemination events held and the perceived use of publications and technologies were positively correlated with peer rating
There seems to be limited complementarity and consistency across the different measures of performance used suggesting multiple objectives and perceptions both of performance and of performance measures In addition observed research outputs may not provide researchers or organizations with better awareness of adoption or impact This diversity of perceptions and objectives suggests the need for some tradeoffs in choosing and prioritizing realistic sets of indicators and targets based on the various mandates of the organizations in question With this in mind instead of creating an index of performance measures in this paper each was correlated with capacity and incentive measures
Connectivity and Linkages with Other Innovation Actors
Linkages with other innovation actors are analyzed at the individual researcher level by directly asking them about the frequency of their interactions with other innovation actors The responses were then averaged out at the organization level
Linkages with Other Researchers
Higher shares of MSc- and PhD-qualified researchers in both Nigeria and Ghana reported interacting with national and international researchers as coauthors of publications About 63 and 76 percent of PhD-qualified researchers in Ghana reported international collaboration and coauthorship respectively compared with only24 and 23 percent respectively in Nigeria Of the MSc-qualified researchers 78 percent of those in Ghana and 48 percent of those in Nigeria reported national collaboration
For those researchers who reported having generated technologies the majority in both countries reported not having collaborated either nationally or internationally For those that had collaborated national collaboration was more common for both MSc- and PhD-qualified researchers in Nigeria than it was for those in Ghana International collaboration was more prevalent among MSc-qualified researchers in Ghana than MSc-qualified researchers in Nigeria but it was more common among PhD-qualified researchers in Nigeria than PhD-qualified researchers in Ghana It is also interesting to note that BSc-qualified researchers in Ghana were collaborating both nationally and internationally
Researchers in Nigeria reported higher levels of interaction with researchers in other organizations 6 percent of those in Nigeria reported not having interacted with other researchers in the previous year compared with 12 percent in Ghana (Figure 3) Researchers employed at CRIG appear to have been less connected 39 percent reported not having interacted with researchers outside their organizations in the previous year
Limited Linkages with Farmers and Extension Services
Many researchers in both Ghana and Nigeria had not interacted with farmers or extension agents in the previous year but there was no statistical significance between the two countries in terms of the reported frequency of interactions About 25 and 27percent of researchers in Nigeria and Ghana respectively reported not having interacted with farmers in the previous year (Figure 3) 51 and
17
43percent of researchers in Nigeria and Ghana respectively had also not interacted with extension agents in the previous year
Figure 3 Distribution of researchers based on frequency of interaction with innovation actors
Panel A Nigeria Panel B Nigeria
Panel A Ghana Panel B Ghana
Source IFPRIndashARCN survey (MayndashJuly 2010) IFPRIndashSTEPRI survey (MayndashJuly 2011)
One institutional arrangement promoted mainly through World Bankndashfunded projects to foster greater interaction among innovation actors is researchndashextension linkage committees (RELCs) in Ghana and researchndashextensionndashfarmerndashinput-supplier linkage system committees (REFILS) in Nigeria These committees were established as platforms for joint priority-setting information sharing and demand articulation but with only limited success In Ghana RELCs operate at the regional and district level each RELC has 15 members including two representatives of farmer organizations one representative from a nongovernmental organization (NGO) one representative from agribusiness and representatives from research and extension services Several reports have concluded that the approach is useful in demand-driven priority-setting (Bekure and Annor-Frempong 1998 FAOndashDFIDndashODI 2002) but a number of studies have highlighted some limitations in fostering sustained interaction and linkages among innovation actors (Doamekpor 2005 Spielman Ragasa and Rajalahti 2011 Ragasa 2011b)
Survey data suggest that in Ghana half of the faculties of agriculture and 40 percent of agricultural research institutes had never participated in RELCs Moreover less than 30 percent of researchers in these institutes and faculties reported being involved in RELC activities Half of these organizations said that less than 10 percent of their researchers were involved in RELCs A survey of 237 agricultural researchers suggests that 87 percent were not involved in RELCs About 70 percent of researchers reported producing at least one new technology in the previous five years or producing at least one publication in the previous three years but they had never used RELCs as a platform for identifying problems and disseminating their new innovations This is alarmingly low participation
0
20
40
60
80
100
Farmers Extensionagents
Privatesector
NGO Other researchers
Intl org MoA
Sh
are
of
rese
arc
he
rs (
)
Never A few times a year
About once a month Several times a month
0
20
40
60
80
100
Farmers Extensionagents
Privatesector
NGO Other researchers
Intl org MoA
Sha
re o
f re
sea
rch
ers
(
)
Never A few times a year
About once a month Several times a month
0
20
40
60
80
100
Farmers Extension agents
Private NGO Research institutes
Intl org MoFA
Sh
are
of
rese
arc
he
rs (
)
Never A few times a year
About once a month Several times a month
0
20
40
60
80
100
Farmers Extension agents
Private NGO Research institutes
Intl org MoFA
Sh
are
of
rese
arc
he
rs (
)
Never A few times a year
About once a month Several times a month
18
Of the 70 extension agents interviewed in an IFPRI and World Bank survey in 2008 51 percent were not aware of RELCs (Ragasa 2011b) and 70 percent had not sourced any information improved management practices or technology in any RELCndashrelated activities Across all 600 technologies or management practicespackages promoted by the 70 extension agents in 2007 agents reported that only 6 percent had been derived from RELCndashrelated activities Nevertheless the majority of topics and technologies promoted by extension agents (82 percent) had been sourced from or learned through colleges and training centers or through in-service training
In Nigeria REFILS operate at the zonal level All 13 of the countryrsquos agricultural research institutes were involved in REFILS activities because the institutes coordinate those activities in each zone However the number of staff within each organization who reported being involved in REFILS activities ranged from 2 to 100 percent of all research staff About half of organizations reported that the majority of their researchers were involved but the other half reported that less than 10 percent of their researchers were involved This suggests that a majority of researchers is not tapping into REFILS as a platform for obtaining feedback from farmers and disseminating their research and new technologies A number of the heads of organizations interviewed noted that REFILS was unable to promote collaboration between researchers and other innovation system actors Among colleges and universities engagement in REFILS was even weaker No faculties of agriculture in major universities were involved in REFILS despite their roles in agricultural research and innovation Only 55 percent of federal colleges of agriculture were involved in REFILS and for those colleges that were involved the percentage of staff involved was less than 10 percent
Beyond problems of participation the responses of heads of organizations suggest the presence of greater institutional and systemwide issues Lack of follow-up in response to the identified needs and problems of farmers is a major problem identified in both Ghana and Nigeria Heads of organizations attributed this to the lack of resources and funding available for innovation processes especially extension service provision Multistakeholder platforms only make sense when they are linked to research and innovation processes
Limited Linkages with Other Innovation Actors
Interactions with the private sector NGOs ministries of agriculture international organizations political authorities and policymakers are limited for researchers in both countries Despite REFILS and RELCs having an explicit focus on the private sector and other stakeholders private participation is limited About 35 percent of researchers in Ghana and 45 percent of those in Nigeria reported not having met with a private firm in the previous year In Ghana partnerships with private firms and NGOs were being promoted but only in a limited way In 1996 the Government of Ghana passed new policies and changed CSIRrsquos mandate to address private-sector concerns One of the new policies makes commercializing technologies a key function of CSIR to date however according to the survey no patented technologies exist
About 34 percent of researchers in Ghana and 58 percent of those in Nigeria reported having never met with international organizations About 36 and 46 percent of researchers in Ghana and Nigeria respectively reported not having met with Ministry of Agriculture (MOA) staff either at local or national levels (excluding MOA extension agents) About 50 and 69 percent of researchers in Ghana and Nigeria respectively said they had not met with an NGO in the previous year
There were no differences in the frequency of interactions across qualification levels but some distinct variations were reported across types of organizations For example the frequency of interactions of researchers from the research and higher education institutes were similar in Ghana but researchers at CRIG reported having more frequent interactions with the private sector and much less interaction with NGOs In Nigeria fewer researchers employed at research institutes reported lack ofinteractions with innovation actors compared with those at the universities and federal colleges of agriculture The federal colleges of agriculture reported the highest share of researchers who had not
19
interacted with innovation actors In Ghana fewer researchers employed at CRIG reported lack of interaction with farmers or private sector in the previous year however more researchers reported not having interacted with other innovation actors (especially NGOs researchers at other organizations and international organizations) Fewer researchers at universities than at research institutes reported not having interacted with all types of innovation actors Researches within the research institutes in Nigeria reported more linkages with innovation actors than those at Nigerian universities but the opposite was the case in Ghana Federal colleges of agriculture were the least connected of the three groups across all types of innovation actors including farmers and extension agents
The Gap between the Actual and Perceived Importance of Interactions
When researchers were asked what they thought the frequency of interactions should be in order for them to perform their work well and to increase their productivity the majority indicated that more frequent interactions were needed than were currently practiced Results suggest differences between the actual and perceived importance of the various frequency levels of interaction with various actors Overall 22ndash24 percent of researchers reported less frequent actual interactions with farmers than was perceived necessarysimilarly32ndash34 percent of researchers reported less frequent actual interactions with extension agents 34ndash37 percent reported less frequent interaction with the private sector and 40ndash44 percent reported less frequent interaction with NGOs than was perceived necessary Hence an examination of the factors hindering greater interaction would appear necessary Among the factors cited as hindering interaction with farmers in both Nigeria and Ghana were lack of vehicles or transportation remoteness of farmers lack of interest among farmers and researchers lack of funding to organized meetings with farmers time constraints and lack of existing contacts with farmers Heads of organizations in Nigeria and Ghana cited inadequate funding to facilitate interaction lack of project vehicles lack of a forum for interaction poor leadership structures weak implementation of some part of the memorandum of understanding (of a project) lack of interest on the part of the farmers weak farmer organizations lack of group formationfarmer mobilization lack of sustainability of collaborative efforts and farmer illiteracy in some cases For those who did report interacting with farmers or extension agents interactions were rated as either ldquousefulrdquo or ldquovery usefulrdquo to the researchersrsquo work and the majority said that they were able to share ideas learn about farmersrsquo problems and disseminate information technology and research findings to farmers or extension agents This indicates the presence of fundamental and structural constraints to greater interaction that need to be minimized
In contrast however about 10 and 15 percent of researchers in Nigeria and Ghana respectively did not believe that interactions with farmers were required in order for them to perform their work well Similarly 10 and 19 percent in Nigeria and Ghana respectively did not believe that interactions with extension agents were required and a further 10 percent of researchers in both countries approximately did not believe that interacting with other innovation actors was important for their work This indicates the need to raise awareness among researchers of the importance of these kinds of collaborations in order to shift the mindset of researchers regarding the importance of being connected to the wider innovation system
Two strategies would be useful for fostering greater connectivity among researchers (1) addressing the obvious lack of information on the importance and relevance of collaboration and linkages across the innovation system and (2) addressing the constraints to more frequent interaction as described by researchers and heads of organizations particularly in terms of the funding needed Many studies focus on the vital need for greater linkages and collaboration but few look at the constraints and disincentives that prevent this from happening
Strong Correlations with Other Performance Measures
Positive correlations exist between the frequency of interactions between researchers and various types of innovation actors In Nigeria for example more frequent interaction with farmers is correlated with
20
more frequent interaction with MOA staff NGOs and researchers at other organizations interaction with the private sector is positively correlated with interactions with NGOs researchers at other organizations and MOA staff and more frequent interaction with extension agents is positively correlated with more frequent interaction with NGOs international organizations and MOA staff In Ghana greater interaction between researchers and international organizations is positively correlated with all other sets of innovation actors with the exception of farmers More frequent interaction with MOA staff is positively correlated with all other types of innovation actors with the exception of researchers at other organizations The frequencies of interactions with farmers and extension agents are positively correlated Interaction with NGOs is positively correlated with frequency of interaction with the private sector and extension agents The analysis reveals two common themes in terms of the factors that hinder interaction among various innovation actors First there is general lack of interest in and motivation toward interacting particularly because it does not effect promotional advancement salary increases or recognition Second lack of funding is often the major constraint to collaboration and interaction between researchers and other innovation system actors
In Ghana interaction with farmers is negatively associated with technology generated and publications produced per PhD-qualified researcher at both the organizational and individual levels (Appendix Table A4) Interaction with extension agents is positively correlated with average publications per MSc-qualified researcher and negatively associated with perceptions of adoption Interaction with NGOs is negatively correlated with the average number of technologies generated per PhD-qualified researcher Interaction with the private sector is positively corelated with publications produced and the intensity with which they are disseminated by both MSc- and PhD-qualified researchers Interaction with international organizations and MOA staff is positively correlated with the average number of publications produced per MSc-qualified researcher International collaboration in producing publications is correlated with the average number of technologies generated and publications produced by PhD-qualified researchers
In Nigeria interaction with farmers extension agents NGOs and international organizations are all correlated with the average number of technologies generated per PhD-qualfied researcher Interaction with researchers at other organizations is correlated with the average number of publications produced per MSc-qualified researcher Interaction with MOA staff is correlated with the average number of technologies generated and publications produced by MSc-qualified researchers Average membership in associations is correlated with the average number of publications produced by PhD-qualified researchers Finally international and national collaboration are strongly and positively correlated with the number of publications produced per PhD- and MSc-qualified researcher
Staff Morale
Researchers were asked to rate their satisfaction with their level of research output compared with other staff in a similar position or with the same qualifications within their own or in other organizations Overall more researchers in Nigeria reported being satisfied with their outputs than those in Ghana Ten percent of researchers in Ghana and 25 percent in Nigeria were very satisfied but 20 percent of researchers in each country reported having little or no satisfaction with their output levels (Figure 4) These researchers said they would like to produce more which may be a valuable first step toward their achieving greater productivity under existing conditions
21
Figure 4 Distribution of researchers based on satisfaction with their output
Source IFPRIndashARCN survey (MayndashJuly 2010) IFPRIndashSTEPRI survey (MayndashJuly 2011)
It seems that researchers in both Ghana and Nigeria were satisfied with their jobs About 21ndash24 percent were very satisfied with their job 65ndash67 percent were satisfied and 10ndash11 percent were not satisfied or were minimally satisfied (Figure 5) Almost all of the researchers said that they chose their job because they liked doing research developing technologies and inventions teaching or helping to solve farmersrsquo problems 1 percent said they liked their job due to the prestige of research and the salary and benefits offered These results may be helpful in indicating priorities for incentive structures
Figure 5 Distribution of researchers based on their perceived satisfaction with their job their output the effectiveness of organization and the work environment
Panel A Nigeria
0
20
40
60
80
100
Nigeria Ghana
Shar
e o
f re
sear
che
rs (
)
not satisfied little satisfaction somewhat satisfiedsatisfied very satisfied
0
20
40
60
80
100
Shar
e o
f re
sear
che
rs (
)
Strongly agree Agree Disagree Strongly disagree
22
Figure 5 Continued
Panel B Ghana
Source IFPRIndashARCN survey (MayndashJuly 2010) IFPRIndashSTEPRI survey (MayndashJuly 2011)
In terms of effectiveness more researchers in Ghana than in Nigeria perceived that their organizations were effective based on their budgets and resources Fifteen percent of researchers in Ghana and 10 percent of those in Nigeria strongly agreed that their organization was effective (Figure 5) A further 63 and 60 percent of researchers in Ghana and Nigeria respectively merely agreed that their organization was effective This perception of effectiveness was not statistically correlated with actual productivity measures or performance indicators
These results coincide with researchersrsquo perceptions that their working environment and organizational practices reflected transparency accountability gender equality political autonomy fair and competitive compensation openness of information regarding output and performance of organization and satisfaction regarding available resources within organization among other factors Researchers in Ghana reported greater satisfaction based on the majority of aforementioned organizational practices Of these practices respondents in both Nigeria and Ghana reported low satisfaction withthe adequacy of physical resources and research funding themajority of respondents (78ndash80 percent) disagreed that resources wereadequate (Figure 5) Other factors that engenderedmuch dissatisfaction among respondents werefair and competitive compensation which is rated low by most staff in Ghana andjob security in Nigeria Lack of a competitive salary and benefits seems to be a bigger problem for researchers in Ghana whereas job security was a much bigger issuein Nigeria Corruption or misuse of fundingin organizations was the next factorthat wasrated low inboth countries Consistently high ratings were given for peer recognition and gender equality in opportunities (less than 20 percent of researchers weresatisfied with different aspects of their organizationrsquos climate)
The big differences between Ghana and Nigeria wereasfollows
1 A higher proportion of respondents reportedjob security as being an issue in Nigeria than in Ghanawhereasa higher proportion of respondents reported fair and competitive compensation as an issue in Ghana than in Nigeria The ratings forjob security in Nigeria weresurprisingbecause researchers employed at both the research instituteand higher education agencies were under tenureand key informants could not recall any instance of a staff member beingfired This anomoly requires further research
2 A higher proportion of respondents in Nigeria than in Ghana reported that corruption was an issue in research organizations
3 Proportionally more respondents in Nigeria than in Ghanareportedthat transparency in recruitment and promotion was an issue
0
20
40
60
80
100
Shar
e o
f re
sear
che
rs (
)
Strongly agree Agree Disagree Strongly disagree
23
4 Proportionally more respondents in Ghana than in Nigeria reported satisfaction withthe qualifications of research staff in their position and in their organization
5 Proportionally more researchers in Ghana than in Nigeriareported that there wasclarity of roles and responsibilties in theirresearch organizations
6 Proportionally fewer researchers in Ghana than in Nigeria reported thatpolitical interference was an issue
7 Proportionally more researchers in Ghana than in Nigeria reportedopenness of information about their organizationrsquos performance
8 Slightly more researchers in Ghana than in Nigeria reportedhaving greater mobility within their operational areas
Compared with other performance measures a composite index for the working environment isstrongly and positively correlated with other performance measures in both countries In Ghana peer ratings and the average number of publications produced per MSc- and PhD-qualified researcher were positively correlated with reported satisfaction with the working environment Perceptions of their organizationrsquos transparency were correlated with the average number of technologies generated per PhD- and MSc-qualified researcher
In Nigeria satisfaction with the work environment (based on almost all indicators as well as their average) was positively and strongly correlated with peer ratings and the average number of technologies generated per MSc- and PhD-qualified researcher Among the important aspects of the working environment that are correlated with performance measures the perception of participatory leadership the quality of human resources and peers within the organization and the organizationrsquos responsiveness to clientsrsquo complaints general effectiveness and openness of information were associated with technologies generated per MSc- and PhD-qualified researcher
In both Nigeria and Ghana more frequent interaction with extension agents was positively correlated with higher operating funding per FTE researcher Linkages with almost all actors were positively associated with satisfaction with the working environment Perceptions of transparency in the organizationrsquos methods of promotion recruitment decisionmaking political interference and corruption were positively correlated with the frequency of interaction with all actors Perceptions of mobility within the operating area were positively correlated with the frequency of interaction with researchers at other organizations In Nigeria access to the Internet was positively correlated with the frequency of interactions with researchers at other organizations In Ghana organizations located in Accra have more linkages with other actors with the exception of farmers and extension agents In Ghana more frequent interaction with researchers at other organizations was positively correlated with funding for capital investments per FTE researcher These results suggest that interaction and linkages largely depend on organizational issues and staff morale which either hinder or encourage them The survey indicated that important factors encouraging interaction include operating funds greater mobility improved transportation improved Internet access and other physical infrastructure
Capacity and Incentive System
The cornerstone of an effective performance-based reward system is an understanding of what motivates researchers and research managers Surprisingly the data indicate that the distinguishing line between capacity and motivation is thin When researchers and heads of organizations were asked about their motivations (through open-ended questions) most indicated the availability of basic resources peer effects and financial incentives
Motivation among Researchers
A sample of researchers interviewed in both countries rated higher salary and promotion as the top motivating factor for increasing their productivity and performance (Figure 6) Skills development and
24
0
10
20
30
40
50
60
Nu
mb
er o
f org
aniz
atio
ns
training and more timely release of funding ranked2nd and 3rd in Nigeria and peer recognition and appreciation by farmers ranked 2nd and 3rd in Ghana Rounding out the list in Nigeria were more research funding followed by better laboratories and infrastructure The most commonly mentioned factor in Nigeria was power supply In Ghana skills development and training and more research funding completed the list of motivating factors This reveals that incentives are not only financial but are also based on the availability of advancement opportunities in terms of developing skills and on a conducive work environment within which researchers can conduct their research In Nigeria for example at many research institutes researchers couldnrsquot even stay in their offices because they were too hot and there was often no electricity for days at a time
Figure 6 Distribution of organizations based on the top five motivations reported by the heads of organizations and individual scientists Nigeria and Ghana
Panel A Nigeria heads of organizations Panel B Ghana heads of organizations
Panel C Nigeria staff Panel B Ghana staff
Source IFPRIndashARCN survey (MayndashJuly 2010) IFPRIndashSTEPRI survey (MayndashJuly 2011)
Motivation among Heads of Organizations
Responses by heads of organizations differed in some respects in terms of motivating factors for increasing their productivity and performance In Nigeria 60 percent of heads of organizations cited research funding andor the timely release of funds as the most important motivating factor This was closely followed by facilities and physical infrastructure (all heads of federal colleges of agriculture mentioned this as the most important factor) A conducive work environment peer recognition high
0
10
20
30
40
50
60
70
Nu
mb
er o
f org
aniz
atio
ns
0
10
20
30
40
50
Nu
mb
er o
f org
aniz
atio
ns
0
10
20
30
40
50
Nu
mb
er o
f org
aniz
atio
ns
25
salaries (andor timely payment of salaries) and the impactadoption of technologies generated were among the top motivating factors In Ghana high salaries (andor health insurance) were the top motivating factor reported by 53 percent of heads of organizations Closely following were recognitionstatus staff morale or staff discipline and support career development and a conducive work environment
Mission Orientation and Organizational Management System
Indicators of mission orientation included (1) satisfaction with the organizationrsquos management systems (2) satisfaction with indicators used for monitoring and evaluating the performance of researchers (3) the mission orientation of the head of the organization and (4) the degree of control or flexibility the organization exerts through its culture Measures of organizational management procedures and systems were not statistically correlated (and were even negatively associated in some cases) with measures of performance Nevertheless researchers rated the presence of and their satisfaction with implementation and management procedures as low Half of the heads of organizations in both Nigeria and Ghana reported that they did not have an MampE system for organizational performance half the heads of organizations in Nigeria and 25 percent of those in Ghana reported that they did not have a strategic plan 35 and 7 percent respectively reported not having a staff performance appraisal system 35 and 25 percent respectively reported not having a training and staff development plan and 80 and 75 percent respectively reported not having a policy on intellectual property rights
OPAS was implemented in Ghana in the early 1990s which might explain the higher levels of satisfaction in Ghana and the presence of these management systems Nevertheless many organizations in Ghana have not implemented these systems despite OPAS OPAS is currently being implemented in Nigeria where it seems the issue is not lack of awareness or capacity to implement but the commitment to sustained implementation The Ghana Institute of Management and Public Administration (GIMPA) has organized leadership training sessions for CSIR on organizational management including evaluation MampE however even though MampE elements exist at various levels of CSIR management training on the application of the information and knowledge through GIMPA may be extremely useful Key informants reported that the trainings vary in depth and quality were mostly of a general nature and required implementation by management The fact that the systems were often not implemented signals that the trainings are often supply- rather than demand-driven The other problem is that the reality of applying these organizational systems is often very different from the theory Hence the problem boils down to a combined lack of commitment to implementation on the part of management and lack of adequate practical knowledge on the implementation process
Another area looked at was whether rewards or sanctionsdisciplinary actions were used Correlation and regression analysis suggests that rewards (that is positive reinforcements) are positively associated with performance in both Ghana and Nigeria This further suggests that incentive systems need to be implemented to provide a tangible ldquocarrotrdquo that increases productivity in research organizations as opposed to simply paying lip-service to MampE and staff appraisal systems
Missionorientation manifests itself in the performance indicators used by anorganization All the heads of organizations interviewedsaid that they report to and feel accountable to the executive director of CSIR or theprovost or dean of their university They enumerated various factorswhen asked to name thefive performance indicators used by these people to judge both their performance and the performance of the organizations In Nigeria 20 different responses resulted ranging from publications produced totechnologies generated to punctuality comittment and trainings conducted Ghana returned 13 different responses from heads of organizations ranging from internally generated funding to staff morale In both countries when the heads oforganization cited technology generation as a performance indicator higher numbers of technologies were generated by the organizationrsquos researchers If heads of organizations cited producing publications as a performance indicator the average number of publications produced per researcher was higher When impact on farmers or the
26
community was cited by the heads of organizations as a performance indicator researchers tended to display greater knowledge of technologies and their adoption and more knowledge of these and impact of their publications This indicates that researchers respond to their organizationrsquos chosen performance indicators signifying a point of entry for leaders and managers
Organizational Capacity and Resources
Several indicators were used to capture differences in resources the quality of human resources and peer effects which may explain variations in performance measures For physical and financial resources the following indicators were used (1) expenditure on research during 1992ndash2003 (disaggregated as salaries operating costs and capital investments)which would roughly correspond to most technologies generated during 1997ndash2008 (2) the ratio of research expenditure to FTE researchers and (3) the heads of organizationsrsquo satisfaction regarding the adequacy of physical resources Total funding (in 2005 PPP dollars) is correlated with peer ratings The ratio of operating costs to FTE researchers is positively correlated with the number of publications produced per MSc-qualified researcher in Ghana and the frequency of interaction with innovation actors is strongly correlated with the operating budget per FTE researcher in both Nigeria and Ghana
Research facilities and physical infrastructure are statistically correlated with technologies generated per PhD-qualified researcher in both Ghana and Nigeria and with awards received and peer ratings in Nigeria In both countries more than 90 percent of organizations were not satisfied or had little satisfaction with computer and Internet facilities and their access to journals About 92ndash95 percent of heads of organizations in Nigeria and 69ndash73 percent of those in Ghana were not satisfied with their information and communications facilities and systems at their headquarters and substations In terms of research facilities and other physical infrastructure 55 and 12 percent of heads of organizations in Nigeria and Ghana respectively said that they were not satisfied with the adequacy of facilities at their headquarters The rating was even worse for substations 65 and 37 percent of heads of organizations in Nigeria and Ghana respectively said they were not satisfied with the adequacy of facilities at their substations In both Nigeria and Ghana satisfaction with facilities communications libraries and transportation were associated with the average numbers of technologies generated and publications produced by PhD- and MSc-qualified staff
One difference between the two countries is that more heads of organizations were dissatisfied with the adequacy of their facilities and systems in Nigeria than in Ghana A related issue is the lack of modern research equipment mentioned by 17 heads of organizations and power supply mentioned by 15 heads of organizations In Nigeria funding dropped sharply and became irregular from the 1960s to the mid-1990s which negatively affected infrastructure and resources and seriously weakened organizationsrsquo ability to conduct research Nigeria is however attempting to accelerate its infrastructure development Capital investments accounted for only 2 percent of the CSIR agenciesrsquo research expenditures in 2008 whereas they constituted 45 percent of ARCNrsquos total spending that year As part of the reform process Nigeria is undertaking a systematic assessment of optimal investments in their facilities and equipment It seems that in the past there was too much focus on short-term training observations from this study suggest that investment in human resources or training can only be effective with complementary investments to fill gaps in the physical resources
For human resource capacity and peer effects three indicators were used (1) salary costs per FTE researcher (2) researchersrsquo perception of whether other researchers were well-qualified for their positions (signifying the quality of the pool and building on the peer-effect assumption within organizations) (2) perceptions of heads of organizations as to the adequacy of human resources (3) the ratio of PhD- to MSc-qualified researchers in the organization and (4) the percentage of researchers that reported having received technical training In Nigeria the ratio of PhD- to MSc-qualified staff and the number of technologies generated per FTE researcher were positively correlated In Ghana the ratio of PhD- to MSc-qualified researchers was positively correlated with the number of publications
27
produced per MSc-qualified researcher In both countries the higher the ratio of PhD- to MSc-qualified researchers the more productive researchers wherein generating technologies and producing publications
In Nigeria on average researcher perceptions that staff within their organization were well-qualified were correlated with higher perceived technology adoption rates higher numbers of technologies generated per PhD-qualified researchers and higher peer ratings In Ghana average numbers of publications produced per PhD-qualified researcher were positively correlated with perceptions that staff were well-qualified for their positions In Nigeria training appeared to be positively correlated with higher average numbers of publications produced per PhD-qualified researcher
4 CONCLUSION AND POLICY IMPLICATIONS
The task and processes involved in designing and implementing this study were complex and challenging The paper should be taken as a work in progress requiring ongoing refinements of measurements and definitions especially in the event that they are scaled out to other countries Moreover the results described in this paper only cover national agricultural research organizations (NAROs) so more research is needed to expand coverage to a wider set of innovation actors and to capture adoption rates and impacts on farmers and other end-users in order to fully assess the effectiveness of RampD investments and innovation performance of NARSs Nonetheless a number of observations and insights are informative from this ongoing pilot study in terms of entry points for strengthening capacity and performance of agricultural research organizations both in Ghana and Nigeria Key observations and insights are summarized below
Limited Farmer or Impact Orientation
Across all organizations in both Ghana and Nigeria there is lack of farmer- or impact-orientation and the approach being used is still supply-driven The number of publications produced is heavily emphasized especially in Nigeria as is internally generated (nongovernmental) funding in Ghana Some organizations emphasize the generation of technologies but stop short of follow-up on what happens to these technologies in terms of their adoption and impact Many researchers in both Ghana and Nigeria do not interact with farmers or extension agents and a large share has no knowledge or awareness of the adoption of the technologies they contributed to developing Only a few researchers and heads of organizations cited that helping farmers or having an impact on community was a motivating factor in their work an implicit or explicit measure of their performance or a guiding value in their organizationrsquos culture Although several workshopstrainings have been conducted in Nigeria and Ghana on the innovation systems perspective international agricultural research for development and similar approaches no NARO has implemented or fully embraced these approaches The closest involvement is in RELCs and REFILS but sustained interaction with farmers and agribusiness and participation in extension activities remain very weak
On a more positive note the output and productivity of researchers in some organizations in Ghana and Nigeria appears to shift in response to explicit performance indicators suggesting some entry points for intervention If heads of organizations cited that the number of publications produced was used as a performance indicator more publications were likely to be produced by their organizationsrsquo researchers If heads of organizations cited that the number of technologies generated was used as a performance indicator researchers are likely to generate more technologies on average The explicit inclusion of publications technologies adoption impact and solving farmersrsquo problems could be tested and implemented as performance indicators but an appropriate reward system would also need to be in place As OPASndashbased capacity strengthening is ongoing an urgent action for ARCN is to ensure that measurable targets are included in terms of the productivity and efficiency of research
28
the quality of research linkages and the impacts on farmers and the community Capacity strengthening efforts under the West Africa Agricultural Productivity Program (WAAPP) can also instigate stricter design and implementation of performance targets in organizations
This process however would require stronger leadership and management commitment to increase researchersrsquo accountability to farmers and end-users and to ensure that MampE processes are sustainably integrated into organizations For example a more effective performance-based reward system with greater transparency would be necessary External accountability would also help as would openness of information about organizational performance Increased levels of international research collaboration seem to be associated with higher levels of research output and productivity greater awareness of adoption and improved peer ratings Innovations adopted in other countries to increase researcher accountability have potential in Ghana and Nigeria (1) strengthening producer organizations to provide a leadershipmanagement role in setting priorities selecting service providers and implementing competitive research and extension grants and (2) hosting producer organizations in research institutes to cultivate their full engagement in developing research and technologies
Policy and Perspectives Are Reflected in Observed Performance
Overall performance measures used in Nigeria and Ghana differ according to national and institutional contexts and the different perspectives of their research councils On average researchers in Nigeria were more productive in terms of numbers of peer-reviewed publication per researcher compared with researchers in Ghana Such differences can result from stronger organizational emphasis on publications as an explicit organizational performance indicator and an implicit measure of peer recognition This is also associated with increased emphasis on internally generated and other nongovernment funding in Ghana which are associated with increased consultancies rather than peer-reviewed publications The results of this study are inconclusive when it comes to correlating technology generation with data constraints
Researchers in Ghana are generally more satisfied with their working conditions than are researchers in Nigeria In Ghana a majority of heads of organizations cited staff morale as a top motivating factor whereas none of the heads of organizations in Nigeria included staff morale in their rankings Researchers in Ghana reported having better linkages with other innovation actors than in Nigeria but researchers in Nigeria reported having better linkages with researchers in other organizations This could stem from greater emphasis on research collaboration in CSIR policy explicit NARO performance indicators and implicit peer ratings on generating nongovernmental funding which would require interaction and collaboration with the private sector NGOs and international organizations These linkages among Nigerian researchers also seem to be correlated with a stronger emphasis on the number of publications produced as the performance indicator in NAROs and ARCN which are generally enhanced by interactions with other researchers It seems that stronger linkages with other researchers is also correlated with more tangible research outputs but staff morale and increased linkages with end-users and other actors are not necessarily correlated
Inconsistencies in Performance Indicators
Complementarity and consistency are limited across the different measures of performance used suggesting multiple organizational objectives and perceptions of performance or performance measures For example more researchers in Ghana seems to have more linkages with innovation actors and are more satisfied with human and physical resources available to them their organizationsrsquo management practices and their working environment but these do not seem to translate into higher productivity in terms of technologies generated or publications produced More researchers in Ghana than in Nigeria perceived that their organizations were effective given their budget and resources In Nigeria more researchers perceived that adoption awards and peer ratings were all positively
29
correlated but in reality they were seemingly negatively correlated with productivity in terms of the number of technologies generated and publications produced and per PhD- and MSc-qualified researcher In Ghana productivity and peer ratings were positively correlated but all were negatively correlated with perceived adoption levels From a policy and operational perspective these multiple and inconsistentuncorrelated objectives suggest the need to rationalize and prioritize the indicatorstargets used in order to achieve a realistic and balanced set that organizations can implement and commit to based on their mandates Nevertheless regardless of the methods employed refocusing NAROs on their mission to have an impact on poor farmers and end-users would be beneficial This scope of this study needs to be expanded to include an examination of actual technologies adopted and their impact although this would depend on the availability of relevant data
Variability within Countries
Differences were also found in performance and linkage measures among organizations within each country There were pockets of organizations that perform well or poorly despite national and institutional continuity One does not even have to go out of their own countries to find examples of good practices It is important to draw lessons from well-performing organizations which implies identifying scalable elements across similar organizations in a given country Similarly larger well-performing organizations could offer insights and assistance to their smaller and less well-resourced counterparts
Infrastructure Acts As a Binding Constraint
Satisfaction with physical infrastructure and the work environment were statistically significant in explaining variations in several performance measures analyzed Among the indicators of work environment those most often significant were the perception of participatory leadership the absence of corruption and political interference and the presence of well-qualified staff transparency and open information Satisfaction with the adequacy of research facilities physical infrastructure and the Internet and communications systems were also statistically significant Salary and benefit levels were consistently mentioned by researchers and heads of organizations especially in Ghana but variations in the perceived competitiveness of salaries adequacy of salaries relative to living expenses and salary costs per FTE researcher did not appear to be statistically correlated with variations in any of the performance indicators Although further research is needed to investigate optimal salary levels in recommending priority investments for increasing their productivity and output the majority of researchers suggested improvements in basic facilities which contrasts the much heavier emphasis on low salaries highlighted as the binding constraint in other studies such as Byerlee 2004 Increasing capital investments and building physical resources will be important factors in both Nigeria and Ghana
Constraints To Greater Linkages
A large majority of researchers was aware of the crucial importance of linkages with other innovation actors but it seems that achieving them is hindered by structural barriers Currently researchers have limited linkages with innovations actors in both Ghana and Nigeria (although the situation is slightly better in Ghana) Improvement could be achieved first by shifting researchersrsquo mindset and strengthening their capacity to link with other innovation actors and end-users and second by addressing the constraints to greater linkages which include lack of funding and transportation and lack of interest or motivation by both parties In Nigeria while there is relatively stronger collaboration between research institutes and higher education agencies linkages with other stakeholders including private-sector actors service providers and end-users are highly limited New institutional and organizational frameworks are emerging from ongoing collaboration between ARCN and IFPRI to incorporate the promotion of industry funding and greater collaboration among stakeholders which
30
were suggested in initial presentations of the results of this study to ARCN It will be interesting to see how the Nigerian NARS develops in the next three to five years in light of the reform process
Many of these actions require substantial investment from the government and partners Infrastructure is a binding constraint especially in Nigeria and this requires investment Linkages are crucial but results indicate that they do not occur automatically but rather need to be encouraged through the use of incentives and supported financially through explicit inclusion in research and extension budgets Salary and benefit levels seem to be a greater issue in Ghana (although further study is needed to determine whether this is a binding constraint) and once again these require sustained investment Strengthening human resourcesmdashincluding technical scientific management innovation system and value-chain capacitymdashwhich seems to be needed in both Ghana and Nigeria also requires investment While Ghana is close to reaching an agricultural budget allocation of 6 percent of GDP its investment is still very low based the size and importance of its agricultural sector The ratio of agricultural expenditure to agricultural GDP is less than 2 percent in Ghana and only about 5 percent in Nigeria compared with the average of 8ndash10 percent achieved in agriculture-based Asian countries since 2000 (Fan Omilola and Lambert 2009 Omilola and Lambert2010) Ghana and Nigeria need to invest much more in agriculture in general and in agricultural RampD in particular
31
APPENDIX
Appendix Table A1 Performance indicators employed in the study
Performance measure Variable code Definition
1 Conventional indicators
Publications PUBPHD PUBMS Number of peer-reviewed publications as first author or coauthor (international journals national journals books) disaggregated by MSc- and PhD-qualified staff
Technology TECHFTE TECHPHD TECHMS
Biological or new breedsvarieties mechanical and processing technologies chemical technologies and improved production processing management conservation and marketing practices and systems at the organization-level this variable is the total number of technologies completed and released during 1997ndash2008 and expressed as a ratio of FTE researchers at the individual-level this variable is the total number of technologies completed and released in the past five years to which the respondentresearcher has contributed disaggregated by MSc- and PhD-qualified staff
Patents Number of patents registered
2 Organizational theory and public-sector motivation
Staff morale JOBSATIS Rating of the statement ldquoI am satisfied with my jobrdquo (LIkert scale 1ndash4)
EFFECTIVE Rating of the statement ldquoMy organization is effective given its budget and available resourcesrdquo (Likert scale 1ndash4)
Peer rating PEERRATE The number of times the organization is listed among the top five performing organizations rated by heads of other organizations (categorized by organization type) performance was determined based on productivity in publications and technologies and then by impact on the community organizations were also given the chance to list additional performance measures and name organizations that met them
Award AWARD Number of professional awards received by the organization or a researcher in the organization
Satisfaction with own performance
OUTPUTSATIS Rating of the statement ldquoI am satisfied with my output compared with similar positionsqualifications in the organizations or other organizationsrdquo (Likert scale 1ndash4)
3 Innovation systems perspective
Linkages FFARMER FEXT FNGO FPRIV FRES FINTL FMOA RESINTL RESNATL ASSO
Frequency of interactionsmeetings of researchers with farmers the private sector extension agents other researchers universitiescolleges international organizations ministries of agriculture policymakers and political actors in the past year (Likert scale 1ndash4) international or national research collaboration (dummy) Number of professional association memberships (dummy)
Adoption of joint priority-setting participatory approaches or innovation platforms
PARTICI Whether the organization adopts joint priority-setting participatory approaches or is engaged in innovation platforms (dummy)
Level of dissemination PUBDISS Number of dissemination events where publications produced have been disseminated or communicated in the past three years
Perceived adoption rate of technologies
ADOPT Whether respondents are aware of the adoption of their technologies produced (dummy)if they are aware to provide an assessment of the adoption rate (from 1=no adoption to 5=wide adoption)
Perceived use and impact of publications
PUBUSE Whether respondents are aware of the use or impact of publications produced (dummy)if they are aware to provide details of how it is being used or making an impact
Source Devised by authors Notes The Likert scale is a rating based on whether respondents strongly agree (= 1) agree (= 2) disagree (= 3) or strongly disagree (= 4)
32
Appendix Table A2 Capacity and incentive indicators employed in the study
Indicatorsvariable codes Definitionsmeasuressources of data
1 Organizational capacity Perceptions of head of organization and staff (ASTI data)
Human financial and physical resources (TOTALEXPEND OPERATINGFTE CAPITALFTE EXPENDFTE ADEQFUND ADEQPHY ADEQHUM PHDMS)
Total expenditures Ratio operating funds to FTEs (2000ndash02 average) ratio of capital funds to FTEs (2000ndash02 average) rating of the adequacy of research funds by head of organization and staff (Likert scale 1ndash4) rating of the adequacy of physical resources by head of organization and staff (Likert scale 1ndash4) rating of adequacy of human resources by head of organization and staff (Likert scale 1ndash4) ratio of PhD- to MSc-qualified staff
2 Organizational management systems Perceptions of head of organization and staff
Staff satisfaction on work environment (WORKENV EFFECTIVE JOBSATIS)
Response to 15 statements about the transparency of staff hiring and promotion fair and competitive pay gender equity in opportunities within the organization political autonomy coherence mobility responsiveness to clientsrsquo complaints and demands job security flexibility and participatory leadershipmdashfor example ldquoMy organization maintains a transparent process of hiring and promotionrdquo(Likert scale 1ndash4)
Availability of organizational management systems (PLAN)
Rating by head of organization of the adequacy of various organizational management systems such as the systems of performance monitoring and evaluation staff appraisals strategic planning operational planning and staff development and training planning (Likert scale 1ndash4) a composite index was also generated through factor analysis
Training (TRAIN) Whether respondents were receiving technical and management training (dummy)
3 Organizational culture type Perceptions of heads of organizations
Type of organizational culture (CONTROL) Rating of head of organization on 12 statements pertaining to the organizationrsquos values culture strategic focus and leadership style (percentage 1ndash100)
4Incentive systems and sources of external accountability
Perceptions of organization head and staff
Presence of reward (REWARD) Responses of head of organization on whether rewards were given in the previous year (dummy)
Presence of sanction (SANCTION) Responses of heads of organizations on whether disciplinary action was taken in the previous year (dummy)
Emphasis on technology as performance indicator (PERTECHNO)
Whether heads of organizations cite technology as a response to an open-ended question about the performance indicators used by the organization (dummy)
Emphasis on publication as performance indicator (PERPUB)
Whether heads of organizations cite ldquopublicationrdquo as a response to and open-ended question about the performance indicators used by organization (dummy)
Emphasis of impact as performance indicator (PERIMPACT)
Whether heads of organizations cite ldquoimpact on communityfarmers or adoption of technologiesrdquo as a response to an open-ended question about the performance indicators used by organization (dummy)
Salary (SALARYFTE SALARYOTHER SALARYLIVING)
Salaries per FTE perception of staff on the fairness and competitiveness of salaries in relation to same positionqualifications in other organizations (Likert scale 1ndash4) perception of staff on sufficiency of salary in relation to living expenses
Information shared to clientsstakeholders (INFO) Responses to statements about sharing information on the organization and its performances with clients stakeholders and the media (Likert scale)
Presence of donor funding (DONOR) Whether the organization has received donor funding (dummy)
Other controls Type of organization and location
Research institute higher education agency federal college nonndashCSIR research institute and zones or regions where the headquarters are located
Source Devised by authors Note The Likert scale is a rating based on whether respondents strongly agree (= 1) agree (= 2) disagree (= 3) or strongly disagree (= 4)
33
Appendix Table A3 Correlation of performance measures for Nigeria and Ghana
Variables ADOPTa TECHPHD
a TECHMS
a PUBLIPHD PUBLIMS PUBUSE PUBDISS AWARD PEERRATE
Nigeria
ADOPTa
TECHPHDa ndash (RI)
TECHMSa
PUBLIPHD ndash (RI) + (RI)
PUBLIMS ndash (RI) + (RI)
PUBUSE
PUBDISS
+ (UNI)
AWARD + (RI) ndash (All) ndash (All)
ndash(UNI) PEERRATE
ndash (RI)
+ (RI)
+ (All)
Ghana
ADOPTa
TECHPHDa ndash (RI)
TECHMSa
PUBLIPHD ndash(RI) + (RI)
PUBLIMS + (RI)
PUBUSE
PUBDISS
+ (All)
+ (UNI) AWARD ndash(FCA) PEERRATE ndash (RI)
+ (RI) + (All)
+ (FCA) + (All)
+ (FCA) + (All) + (FCA)
Source Compiled by authors from IFPRIndashARCN survey (MayndashJuly 2010) and IFPRIndashSTEPRI survey (MayndashJuly 2011) Note RI indicates research institutes UNI universities and FCA federal colleges of agriculture For descriptions of codes see Tables A1 and A2 a Includes research institutes only
34
Appendix Table A4 Correlations between performance measures linkages and other factors for Nigeria and Ghana
Factors ADOPTa TECHPHD
a TECHMS
a PUBPHD PUBMS PUBDISS PUBUSE AWARD PEERRATE
Nigeria
PHDMS
RESINTL + + + + +
RESNATL + + FFARMER + + FEXTFPRIV +
FRES + +
FINTL + FMOA + + ASSO + EFFECTIVE +
WORKENV + + + +
PLAN +
ADEQPHY + + +
PERFPUB + +
PERFTECHNO + +
TOTALEXPEND +
OPERATINGFTE + +
REWARD + +
Ghana
PHDMS +
RESINTL + + + + +
RESNATL + + + + +
FPRIV + + +
FRES + + +
FINTL +
FMOA + ndash
ASSO +
WORKENV +
+ + +
ADEQPHY +
+
CONTROL +
PERPUB + +
PERTECHNO + +
REWARD
+ + + +
OPERATINGFTE
+
EXPENDFTE +
TOTALEXPEND +
ACCRA
+ + ndash
Source IFPRIndashARCN survey (MayndashJuly 2010) IFPRIndashSTEPRI survey (MayndashJuly 2011) Note For descriptions of codes see Tables A1 and A2 a Includes research institutes only
35
REFERENCES
Alston J M C Chan-Kang M C Marra P G Pardey and TJ Wyatt2000 A Meta Analysis of Rates of Return to Agricultural RampD Ex Pede Herculem IFPRI Research Report No 113 Washington DC International Food Policy Research Institute
Bantilan M C S S Chandra P K Mehta and J D H Keatinge 2004 Dealing with Diversity in Scientific Outputs Implications for International Research EvaluationResearch Evaluation 13 (2) 87ndash93
Beintema N M and G-J Stads 2004 Sub-Saharan African Agricultural Research Recent Investment Trends Outlook on Agriculture 33 (4) 239ndash246
________ 2011 African Agricultural RampD in the New Millennium Progress for Some Challenges for Many IFPRI Food Policy Report Washington DC International Food Policy Research Institute
Bekure S and C Annor-Frempong 1998 Evolution of ResearchExtension Linkages in Ghana Accra Ghana World Bank
Byerlee D 2004 Enhancing Accountability and Impacts of Agricultural Research Systems in Developing Countries InNew Directions for a Diverse Planet Proceedings of the 4th International Crop Science Congress Brisbane Australia September 26‒October 1
Byerlee D and G Alex 1998 Strengthening National Agricultural Research Systems Policy Issues and Good Practice Agriculture and Rural Development Discussion Paper Series Washington DC World Bank
Byerlee D and R G Echeverriacutea eds 2002 Agricultural Research Policy in an Era of Privatization New York CABI International
Clark N 2005 Science Policy and Agricultural Research in Africa A Capacity Building Needs Assessment Paper commissioned by the New Partnership for Africarsquos Development lthttpwwwnepadstorg doclibrarypdfsdoc25_022005pdfgt
CTA (Technical Centre for Agricultural and Rural Cooperation) 2009 Performance Indicators for Agricultural Innovation Systems in the ACP regionSynthesis report of the International Expert Consultation Workshop July 15ndash17 2008 Wageningen The Netherlands
Daane J 2008 New Pathways to Build Capacity for Development Oriented Agricultural Research and InnovationWageningen The Netherlands International Centre for Development Oriented Research in Agriculture (ICRA)
Diao X P Hazell D Resnick and J Thurlow 2006 The Role of Agriculture in Development Implications for Sub-Saharan Africa DSGD Discussion Paper No 29 Washington DC International Food Policy Research Institute
Doamekpor P K 2005 Effectiveness of ExtensionndashResearch Linkages in Volta Region of Ghana In AIAEE 2005 Proceedings of the 21st Annual Conference San Antonio Texas
Echeverriacutea R G E J Trigo and D Byerlee 1996 Institutional Change and Effective Financing of Agricultural Research in Latin America World Bank Technical PapersWashington DC World Bank
Eicher C 2001 Africarsquos Unfinished Business Building Sustainable Agricultural Research Systems Department of Agricultural Economics Staff Paper Series 2001-10 East Lansing Michigan State University
________ 2003 Flashback Fifty Years of Donor Aid to African Agriculture Paper presented at the InWEnt IFPRI NEPAD and CTA Conference ldquoSuccesses in African Agriculturerdquo Pretoria South Africa December 1ndash3
________ 2004 Rebuilding Africarsquos Scientific Capacity in Food and Agriculture Department of Agricultural Economics Staff Paper 2004-12 East Lansing Michigan State University
Fan S 2002 Agricultural Research and Urban Poverty in India Environment and Production Technology Division Discussion Paper No 94 Washington DC International Food Policy Research Institute
Fan S C Fang and X Zhang 2001 How Agricultural Research Affects Urban Poverty in Developing Countries The Case of China Environment and Production Technology Division Discussion Paper No 83 Washington DC International Food Policy Research Institute
36
Fan S B Omilola and M Lambert 2009 Public Spending for Agriculture in Africa Trends and Composition ReSAKSS Working Paper No 28 Washington DC Regional Strategic Analysis and Knowledge Support System (ReSAKSS) International Food Policy Research Institute
FAO (Food and Agriculture Organization of the United Nations) 2002 Impact of Foreign Assistance on Institutional Development of National agricuLtural Systems in Sub-Saharan Africa FAO Research and Technology Paper 10 Rome
FAOndashDFIDndashODI (Food and Agriculture Organization of the United Nations Department for International Development and Overseas Development Institute) 2002 The Strategic Role of Information in Support of Sustainable Livelihoods Country Report ndash Ghana lthttpwwwodiorgukrapidProjectsR0093 Final_ReportsGhanapdfgt accessed September 30 2011
Flaherty K G O Essegbey and R Asare 2010 Ghana Recent Developments in Agricultural Research ASTI Country Note Washington DC International Food Policy Research Institute
Flaherty K G Ayoola J Ogbodo and N Beintema 2010 Nigeria Recent Developments in Agricultural Research ASTI Country Note Washington DC International Food Policy Research Institute
Gabre-Madhin E and S Haggblade 2003 Successes in African Agriculture Results of an Expert SurveyMarkets and Structural Studies Division Discussion Paper No 53 Washington DC International Food Policy Research Institute
Goldsmith A A 1993 Institutional Development in National Agricultural Research Issues for Impact Assessment Public Administration and Development 13 (3) 195ndash204
Gregory B T S G Harris A A Armenakis and C L Shook 2009 Organizational Culture and Effectiveness A Studyof Values Attitudes and Organizational Outcomes Journal of Business Research 62 (7) 673ndash679
Hall A L Mytleka and B Oyeyinka 2006 Concepts and Guidelines for Diagnostic Assessments of Agricultural Innovation Capacity UNU-MERIT Working Paper Series Maastricht The Netherlands United Nations University
Hall A V R Sulaiman N Clark and B Yoganand 2003 From Measuring Impact to Learning Institutional Lessons An Innovations Systems Perspective on Improving the Management of International Agricultural Research Agricultural Systems 78 (2) 213ndash242
Hall A N Clark R Sulaiman M V K Sivamohan and B Yoganand 2000 New Agenda for Agricultural Research in Developing Countries Policy Analysis and Institutional Implications Knowledge Technology and Policy (spring) 69ndash91
Hall A G Bockett S Taylor M V K Sivamohan and N Clark 2001 Why Research Partnerships Really Matter Innovation Theory Institutional Arrangements and Implications for Developing New Technology for the Poor World Development 29 (5) 783ndash797
Hazell P 2010 An Assessment of the Impact of Agricultural Research in South Asia since the Green Revolution Chapter 68 in Handbook of Agricultural Economics 4 Amsterdam North Holland
Heemskerk W N Lema D Guindo C Shouten Z Semgalawe H Verkuijl B de Steenhuijsen Piters and P Penninkhoff 2003 A Guide to Demand-Driven Agricultural Research The Client-Oriented Research Management Approach Rural Service Delivery for Agricultural Development Amsterdam Royal Tropical Institute
Heisey P and K Fuglie 2007 Economic Returns to Public Agricultural Research USDA-ERS Economic Brief No 10 Washington DC United States Department of Agriculture Economic Research Service
Henri J 2006 Organizational Culture and Performance Measurement Systems Accounting Organizations and Society 31 77ndash103
Henry G T and M M Mark 2003 Beyond Use Understanding Evaluationrsquos Influence on Attitudes and Actions American Journal of Evaluation 24 (3) 293ndash314
37
Horton D and R Mackay 2003a Special Issue Learning for the Future Innovative Approaches for Evaluating Agricultural Research and Development Agricultural Systems 78 119ndash336
________ 2003b Using Evaluation to Enhance Institutional Learning and Change Recent Experiences with Agricultural Research and Development Agricultural Systems 78 127ndash142
Horton D R Mackay A Andersen and L Dupleich 2000 Evaluating Capacity Development in Planning Monitoring and Evaluation A Case from Agricultural Research ISNAR Research Report 17 The Hague International Service for National Agricultural Research
IAC (InterAcademy Council) 2004 Realizing the Promise and Potential of African Agriculture Amsterdam InterAcademy Council
IAEG (Impact Assessment and Evaluation Group) 2001 Impact Assessment of Agricultural Research Context and State of the Art In The Future of Impact Assessment in the CGIAR Needs Constraints and Options Technical Advisory Committee Secretariat ed Proceedings of a workshop organized by the Standing Panel on Impact Assessment of the Technical Advisory Committee May 3ndash5 2000 Rome Technical Advisory Committee of the Consultative Group on International Agricultural Research
Jones M 2009 Key Challenges for Technology Development and Agricultural Research in Africa Institute of Development Studies Bulletin 36 (2) 46ndash51
Lynam JK and M J Blackie 1994 Building Effective Agricultural Research Capacity The African Challenge In Agricultural Technology Policy Issues or the International Community J R Anderson ed Wallingford UK CAB International
Manning N R Mukherjee and O Gokcekus2000 Public Officials and Their Institutional Environment An Analytical Model for Assessing the Impact of Institutional Change on Public Sector Performance World Bank Policy Research Working Paper 2427 Washington DC World Bank
Maredia M R Bernsten and C Ragasa 2010 Returns to Public Sector Plant Breeding in the Presence of Spill-Ins and Private Goods The Case of Bean Research in Michigan Agricultural Economics 41 425ndash442
Marshall J and A McLean 1988 Reflection in Action Exploring Organizational Culture In Human Inquiry in Action P Reason edLondon Sage Publications
Obirih-Opareh N GO Essegbey and G Frempong 2008 Agricultural Innovations Technological Inputs for Enhancing Agricultural Productions in Ghana STEPRI Accra
Omilola B and M Lambert 2010 Weathering the Storm Agricultural Development Investment and Poverty in Africa Following the Recent Food Price Crisis IFPRI Discussion Paper No 965 Washington DC International Food Policy Research Institute
Pardey P G J Roseboom J and N M Beintema 1997 Investments in African Agricultural Research World Development 25 (3) 409ndash423
Peterson W G Gijsbers and M Wilks 2003 An Organizational Performance Assessment System for Agricultural Research Organizations Concepts Methods and ProceduresISNAR Research Management Guidelines No 7 The Hague International Service for National Agricultural Research
Ragasa C 2011a Factors Affecting Researchersrsquo Productivity Multilevel and Comparative Analysis of Nigeria and Ghana Agricultural Research Organizations Paper presented at the IFPRI conference ldquoIncreasing Agricultural Productivity and Enhancing Food Security in Africa New Challenges and Opportunitiesrdquo November 1ndash4 Addis Ababa Ethiopia
Ragasa C 2011b Are ResearchndashExtensionndashLinkage Committees Effective and Inclusive Perspectives of Agricultural Researchers and Extension Agents in Ghana and Nigeria Paper presented at the International Conference ldquoInnovations in Extension and Advisory Servicesrdquo November 15ndash18 Nairobi Kenya
Ragasa C and G Essegbey 2011 Assessment of Capacity Incentives and Performance of Agricultural Research Organizations in Ghana Draft paper International Food Policy Research Institute Washington DC
38
Ragasa C S C Babu A S Adbullahi and B Y Abubakar 2010 Strengthening Innovation Capacity of Nigerian Agricultural Research Organizations IFPRI Discussion Paper No 1050 Washington DC International Food Policy Research Institute
Raina R 2003 Institutions and Organizations Enabling Reforms in Indian Agricultural Research and Policy International Journal of Technology Management and Sustainable Development 2 (2) 97ndash116
Ramanujam R and D M Rousseau 2006 Editorial Organizational Behavior in Healthcare The Challenges Are Organizational Not Just Clinical Journal of Organizational Behavior 27 (7) 809
Quinn R E 1988 Beyond Rational Management Mastering the Paradoxes and Competing Demands of High Performance San Francisco Jossey-Bass
Quinn R E and J Rohrbaugh 1983 A Spatial Model of Effectiveness Criteria Towards a Competing Values Approach to Organizational Analysis Management Science 29 363ndash377
Quinn R E and G M Spreitzer 1991 The Psychometrics of the Competing Values Culture Instrument and an Analysis of the Impact of Organizational Culture on Quality of Life Research in Organizational Change and Development 5 115ndash142 Greenwich CT JAI Press
Smith D R and A J Sutherland 2002 Institutionalizing Impact Orientation Building a Performance Management Approach that Enhances the Impact Orientation of Research Organizations Chatham UK Natural Resources Institute
Spielman D and R Birner 2008 How Innovative Is Your Agriculture Using Innovation Indicators and Benchmarks To Strengthen National Agricultural Innovation Systems World Bank Agriculture and Rural Development Discussion Paper 41 Washington DC World Bank
Spielman D and D Kelemework 2009 Measuring Agricultural Innovation System Properties and Performance Illustrations from Ethiopia and Vietnam IFPRI Discussion Paper No 851 Washington DC International Food Policy Research Institute
Spielman D C Ragasa and R Rajalahti 2012 Designing Agricultural Research Linkages within an Agricultural Innovation Systems FrameworkIn Agricultural Innovation Systems Sourcebook Washington DC World Bank (forthcoming)
Thirtle C L Lin and J Piesse 2003 The Impact of Research-Led Agricultural Productivity Growth on Poverty Reduction in Africa Asia and Latin America World Development 31 (12) 1959ndash1975
Walker T M Maredia T Kelley R La Rovere D Templeton G Thiele and B Douthwaite 2008 Strategic Guidance for Ex Post Impact Assessment of Agricultural Research Report prepared for the Standing Panel on Impact Assessment Consultative Group on International Agricultural ResearchScience Council Rome CGIAR Science Council Secretariat
World Bank 2001 Performance Audit Reports and Sectoral Overview Ghana National Agricultural Research Project (Credit 2247 - GH) National Agricultural Extension Project (Credit 2346 - GH) National Livestock Services Project (CREDIT 2441 - GH) Agricultural Diversification Project (Credit 2180 - GH) Agricultural Sector Investment Project (Credit 2555 - GH) World Bank Washington DC
________ 2007 Enhancing Agricultural Innovation How To Go Beyond the Strengthening of Research Systems Washington DC
________ 2011 Agricultural Innovation Systems Sourcebook Washington DC
Yawson R and A Sutherland 2010 Institutionalising Performance Management in RampD Organisations Key Concepts and Aspects Journal of Social Science 22 (3) 163ndash172
Yawson R W Amoa-Awua A Sutherland D Smith and S Noamesi 2006 Developing a Performance Measurement Framework to Enhance the Impact Orientation of the Food Research Institute Ghana RampD Management 36 (2) 161ndash172
10
Figure 1A conceptual framework Analyzing an agricultural research systemrsquos performance and impact pathway within an innovation systems perspective
CAPACITY AND INCENTIVE CONDITIONS PERFORMANCE IMPACTS
Agricultural research system
Source Devised by authors Notes Solid (thick) arrows represent the direction of impact solid (thinner) arrows represent important linkages and connectivity and broken arrows represent the feedback process
In terms of organizational performance three sets of indicators were drawn from the literature (1) conventional measures of productivity including quantification of technology developed and publications (such as Peterson Gijsbers and Wilks 2003 and Bantilan et al 2004) (2) public-sector motivation and performance emphasizing staff morale (for example Manning Mukherjee and Gokcekus 2000 World Bank 2001 and Yawson and Sutherland 2010) and (3) agricultural innovation systems indicators emphasizing connectivity and linkages among various innovation actors and measures of use and impact of innovations generated by the system (based on Hall et al 2001 2002 Hall Mytleka and Oyeyinka 2006 Spielman and Birner 2008 Spielman and Kelemework 2009 and CTA 2009)
Technology involves all technologies developed including biological chemical and mechanical technologies and improved production management conservation and marketing practices
Organizational culture
Mission orientation
Systems of accountability
Leadership style
Control versus flexibility
Enforcement of incentive systems
Culture
Institutional structure
Structure of ministries and departments
Decentralization
Institutional linkages
Systems of checks and balances
Organizational capacity
Availability and adequacy of human infrastructural and financial resources
Resource management
Procedures for coordination and linkages
Information systems and monitoring and evaluation
Performance monitoring and evaluation systems
Impacts
Increased agricultural GDP and GDP growth rate
Increased food security and nutrition
Reduced poverty
Environmental protection
Organizational performance
Research productivity
Cost-effectiveness and efficiency
Quality of linkages
Staff morale
Useful outcomes
Farmers and firms are adopting new technologies and practices
Influence in policy and regulatory processes
Increased yields
Reduced production costs
Increased incomes
Individual incentives
Beliefs and values
Personal goals and aspirations
Motivations
Compensation
Individual capacity
Education and training
Skills and knowledge
Social capital
Agricultural extension and education systems
Farmers and other value chain actors
Broader enabling environment
Agricultural policies and investments science and technology policy national development polices and linkages to political system and international actors
11
Publications include books book chapters and peer-reviewed publications (particularly articles in international and national scientific journals) published as first author or coauthor Additional measures are included such as patents and professional awards received by the organization or any of its staff Staff morale is measured as the respondentsrsquo ratings on their job satisfaction their satisfaction regarding the effectiveness of their organization given its budget their satisfaction of their own output in comparison to the input of other staff of similar qualifications in similar positions and their satisfaction in terms of their work environment The third set of innovation system indicators used includes the frequency of interactions with other innovation actors and end-users the quality of these linkages research collaboration dissemination of research outputs and the perceived rate of adoption of technologies generated and the perceived use of publications produced by research organizations Perceptions of scientists were triangulated with information from the heads of organizations as a proxy for adoption because actual adoption rates are currently being collected and validated Data collection at the farm level is ongoing The specific indicators for both individuals and organizations are detailed in Appendix Tables A1 and A2 the profile and characterization of responding researchers and organizations based on these indicators are presented in the next section of this paper See Box 2 for more information on the methodology employed
Box 2 Data and methodology
The data and information used in this paper were collected through multiple sources A face-to-face survey using computer-assisted and mobile-based personal interviews was jointly conducted by the International Food Policy Research Institute (IFPRI) and the Agricultural Research Council of Nigeria (ARCN) in Nigeria between May and July 2010 and a similar survey was jointly conducted by IFPRI and the Science and Technology Policy Research Institute (STEPRI) in Ghana between May and July 2011 Two sets of questionnaires were used The first targeted organizations to be answered by the head or designated representative the second targeted individual researchers The survey was complemented by interviews with key informants and relevant literature reviews
In Nigeria a total of 47 relevant public-sector organizations involved in agricultural research were interviewed including all 15 of ARCNrsquos agricultural research institutes all 11 federal colleges of agriculture(FCA) and 21 of 48 faculties of agriculture and veterinary medicine in federal universities (based on the willingness of organizations to participate and respond to the survey) In Ghana a total of 16 public-sector organizations involved in agricultural research were interviewed including all 9 agriculture-related research institutes under CSIR 1 of 3 relevant nonndashCSIR research centers the Cocoa Research Institute of Ghana (CRIG) based on the willingness of organizations to participate in and respond to the survey and 6 of 15 faculties of agriculture in public universities identified by STEPRI and ASTI (Flaherty et al 2010)
Face-to-face surveys of 3ndash20 randomly selected staff per organization were then conducted by the IFPRIndashARCNndashSTEPRI teams Actual sample sizes depended on the total number of research staff at each organization in Nigeria sample sizes ranged from 26 to 140 research staff in research institutes and from 5 to 214 staff conducting research in universities and in Ghana sample sizes ranged from 10 to 77 research staff in research institutes and from 5 to 29 staff working on research in universities In Nigeria of a total of 3920 researchers (individuals not FTEs) a random sample of 344 were interviewed (9 percent) in Ghana of a total of 706 researchers a random sample of 237 were interviewed (33 percent)
Source Authors
12
3 RESULTS AND DISCUSSION
The discussion that follows focuses on the differences between average observed and perceived performance measures in Nigeria and Ghana and how they relate to the different policies or priorities of organizations in these countries3 Specific indicators reflecting capacity peer effects and incentive systems are examined to determine which of them explain the variations in performance measures
Indicators of Observed Research Productivity
Low Number of Technologies Produced Based on Budget and Staffing Levels
In 2009 ARCN in Nigeria began collecting and taking inventory of all the technologies developed by its research institutes since 1997Between1997and2008 205 technologies were reported in total including 58 biological technologies (new breeds and varieties) 56 mechanical technologies 19 chemical technologies and 72 improved production and management practices (Table 2) The resulting ratio of available researchers to the number of technologies produced is 21 suggesting that it took four to six researchers (the common number of researchers in a team to develop a technology) to develop two to three technologies in 12 years4 The ratio of the research expenditures to the number of technologies produced is 351 suggesting that total research expenditure is about $35 million in 2005 purchasing power parity (PPP)5 prices per technology produced6 While no international standards or estimates for optimal research expenditure per technology exists (mainly due to differences in the nature and production of technologies and in cost structures and local contexts) revisiting some of the costndashbenefit analyses in existing literature indicates that the total research expenditure per new variety on common beans developed by Michigan State University was around $028 million (Maredia Bernsten and Ragasa 2010) This suggests that research expenditure per technology in Nigeria is higher than indicated by Maredia Bernsten and Ragasa (2010)
In Ghana Obirih-Opareh Essegbey and Frempong (2008) compiled 38 technologies cutting across crops livestock fisheries and others released in 2008 IFPRI and STEPRI are currently compiling data on the wider range of agricultural technologies produced but a preliminary estimate indicates that CSIR and other research organizations had developed 109 improved technologies since their establishment (38 biological technologies or new varieties 2 chemical technologies 7 mechanical technologies and 52 improved management practices from CSIR agricultural-based research institutes and 10 improved management practices from universities) Nevertheless these preliminary estimates have yet to be validated and hence cannot be used for comparison purposes at this stage
That being the case a survey of individual researchers is currently more informative About 75 percent of MSc- and PhD-qualified scientists in Nigeria and 52 percent of MSc- and PhD-qualified researchers in Ghana indicated that they had not contributed to the production of any technologies in the past five years Almost 20 percent of both MSc- and PhD-qualified researchers in Nigeria produced neither a technology in the previous five years nor a publication in the previous three years Twelve percent of PhD-qualified researchers and 37 percent of MSc-qualified researchers in Ghana reported not being involved in producing any technology (in the previous five years) or any publication (in the previous three years)
3More in-depth discussions can be found on Nigeria in Ragasa et al 2010 on Ghana in Ragasa and Essegbey 2011 and
on factors affecting research productivity at the scientist level in Ragasa 2011a 4Based on ASTI data the average number of researchers employed at ARCN during 1990ndash2001 was roughly 500 FTEs
which would correspond to the researcher capacity contributing to producing new breeds released between 1997 and 2008 5PPP indexes are the preferred method for converting relative economic data because they measure the purchasing
power of currencies across countries by eliminating national differences in pricing levels in a wide range of goods and services and are relatively stable over time compared with traditional exchange rates (Beintema and Stads 2011)
6Based on ASTI data the average research expenditure at ARCN during 1990ndash2001 was roughly $60 million per year
or $720 million in total for 12-year period)
13
Table 2 Productivity indicators employed in the study
Indicators Nigeria Ghana
Total technologies produced 1997ndash2008 207a 109
b
New breedsvarieties 58 38
Improved production and management practices 72 68
Mechanicalprocessing technologies 56 7
Chemical technologies 19 2
Ratio of total FTE researchers to total technologies generated 2 4
Ratio of total FTE researchers to total new varietiesbreeds generated 9 11 Distribution of researchers reporting not having contributed to technologies generated ( of respondents) 75 52 Distribution of researchers reporting having produced at least one publication ( of respondents)disaggregated by
BSc qualification 79 25
MSc qualification 82 63
PhD qualification 88 88
Total number of publications producedc (mean) disaggregated by 628 337
BSc qualification 479 033
MSc qualification 647 219
PhD qualification 647 540 Distribution of researchers reporting having disseminated their publications ( of respondents) disaggregated by
BSc qualification 67 100
MSc qualification 77 62
PhD qualification 79 61
Number of dissemination events (mean) disaggregated by 413 173
BSc qualification 316 033
MSc qualification 450 114
PhD qualification 405 273
Distribution of researchers reporting having no knowledge of the use or impact of their publications ( of respondents) 70 85
Number of organizations reporting having registered patents 4 0
Number of organizations reporting having received awards 15 4
Source IFPRIndashARCN survey (MayndashJuly 2010) IFPRIndashSTEPRI survey (MayndashJuly 2011) a These data are for the period 1997ndash2008 b These are preliminary estimates of technologies produced and released since the establishment of the organizations they have yet to be validated c Publications are defined as books book chapters and peer-reviewed publications (particularly articles in international and national scientific journals) authored or coauthored in the previous three years d Dissemination events are defined as presentations by any of the authors at conferences workshops trainings or organized or informal meetings in which research results were shared and presented to other researchers policymakers farmers or extension agents
Limited Adoption and Impact Based on Researchersrsquo Perceptions and Field Visits
The picture is even more discouraging when looking at the reported adoption of technologies generated in Nigeria and Ghana More than 90 percent of the heads of the organization sand scientists interviewed reported that they were not aware of any evaluation or impact assessment studies of the technologies they produced Of the 87 scientists interviewed in Nigeria who reported having contributed to the development of at least one technology 63 percent were aware of the adoption level of technologies produced due to interactions with and feedback from farmers or extension agents (conversely 37 percent were not aware of adoption levels Figure 2) When the researchers were asked about their awareness of the extent of adoption 20 percent reported either no adoption or limited adoption of
14
their technologies 29 percent reported some adoption 13 percent reported moderate adoption and 1 percent reported wide adoption7
Figure 2 Distribution of researchers based on their knowledge of the adoption of technologies they produced
Source IFPRIndashARCN survey (MayndashJuly 2010) IFPRIndashSTEPRI survey (MayndashJuly 2011) Note Units in parenthesis on the x axis indicate the number of researchers who reported having contributed to at least one technology produced and released by their organization in the previous five years
The situation in Ghana is even more alarming in terms of the reported adoption of technologies Of the 114 researchers who reported having contributed to the development of a technology only 24 percent were aware of their adoption rates (conversely a huge 76 percent were unaware of adoption rates) These high percentages of researchers without knowledge or feedback on the adoption or impact of their technologies is consistent across research institutes CRIG and the faculties of agriculture Of those that reported being aware of the adoption of technologies produced 5 percent reported limited adoption of their technologies 4 percent reported some adoption and 15 percent reported wide adoption In early 2011 CSIR and IFPRI also began to look at the adoption rate of a few technologies (using a sample of 10 technologies reported by scientists and the heads of organizations as having high adoption rates) Preliminary results suggest that based on focus group interviews and field visits only 4 of the 10 technologies had been well adopted 1 technology had been adopted at a medium level and the remaining 5 technologies had been adopted at low levels or not at all (van Rheenen et al 2011) This indicates that adoption may in fact be lower than reported by scientists
In terms of technology commercialization and patent registration four research institutes reported having patents for their technologies (patents per organization ranged from 1 to 5) while there were no reported patents developed by any organization in Ghana This is another indication of low transfer and uptake of technologies developed in research institutes to farmers and other end-users in both countries
Lower Publication Rate in Ghana than in Nigeria
Researchers in Nigeria reported producing more publications8than those in Ghana across all qualification levels In terms of the average number of publications BSc-qualified researchers in Nigeria had published four to five publications in the previous three years or one to two publications per year MSc-
7 Scientists were given the choice of 1 = no adoption in areas where it is expected to benefit 2 = limited adoption (less
than 10 percent) 3 = some adoption (21ndash40 percent) 4 = moderate adoption (41ndash60 percent) and 5 = wide adoption (more than 61 percent)
8Publications include peer-reviewed publications particularly articles in national and international scientific journals
books and book chapters published as first author or coauthor
0
20
40
60
80
100
Nigeria (87) Ghana (114)
Shar
e o
f re
sear
che
rs (
)
No knowledge Zero adoption
Limited adoption (lt20) Some adoption (21-40)
Moderate adoption (41-60) Wide adoption (gt60)
15
and PhD-qualified researchers had published six to seven publicationson average in the previousthree years or two to three publications per year In contrast BSc-qualified researchers in Ghana had hardly published anything in the previous three years MSc-qualified researchers had published about two publications in the past three years while PhD-qualified researchers had published five to six publications in the previous three years
More Dissemination in Nigeria But Limited Knowledge of Impact of Publications in Both Countries
A large proportion of researchers reported never having disseminated their publications9 (21ndash23 percent in Nigeria and 38ndash39 percent in Ghana) and a higher percentage of researchers in Nigeria than in Ghana reported having disseminated their publications Researchers employed at research institutes in Nigeria tend to disseminate more publications than their colleagues at federal colleges of agriculture or at universities (which makes sense given that the primary teaching mandate in the higher education sector) PhD-qualified researchers employed at CRIG tend to disseminate more of their publications than do their colleagues at research institutes or universities in Ghana
In terms of the average number of events where publications were disseminated the averages were four events in Nigeria and one to two events in Ghana To capture the effectiveness of publications researchers were asked about any feedback they received or their knowledge of the use of their publications and by whom The vast majority had received no feedback (70 percent in Nigeria and 85 percent in Ghana) of those who said they received feedback most reported that their books and papers were used by students or as textbooks in schools while others mentioned that readers had contacted them to ask for more information on their research There seems to be no feedback mechanism in the organizations and lack of interest among researchers to know who uses their publications and to what extent
Variability across Organizations within a Country Context
Results of analyses of variance indicate wide variation across organizations in terms of measures of research output and perceptions on adoption suggesting scope for differentiating well- and poorly performing organizations and identifying possible explanations Building on this the survey questionnaire asked heads of organizations to list their recommendations of the top three well-performing organizations (1) in terms of technologies generated and publications produced and (2)in terms of impact on farmers and the community they could also choose their own criteria and name the top three well-performing organizations that fit them Among the criteria chosen were fundingrevenues generated and level and advancement of facilitiesphysical infrastructure Results suggest that the organizations chosen for the first and third sets of rankings tended to be the same indicating a strong correlation between fundingphysical resources and research output The majority of respondents indicated no awareness of the impact of their own organization or others hence they were unable to answer the question about impact on farmers and the community For those that did answer that question responses were consistent with organizationsrankings given for the other questions
Limited Correlation among Conventional Performance Measures
The consistency of performance measures was explored through correlation analyses the results of which indicate that only a few of the measures were positively correlated whereas many were either not statistically correlated or were negatively linked (Appendix Table A3) The perceived adoption of technologies produced was positively correlated with peer rating in Nigeria but the opposite was the case in Ghana In Nigeria perceived adoption was also positively correlated with the number of awards received and the total number of technologies generated and publications produced but in both Nigeria
9Dissemination events are defined as presentations by any of the authors at conferences workshops trainings or
organized or informal meetings in which research results were shared and presented to other researchers policymakers farmers or extension agents
16
and Ghana it was negatively correlated with research productivitymdashthat is the number of technologies generated and publications produced per staff member Seemingly the total output produced and the size of organizations are seen as measures of performance but not necessarily of effectiveness and productivity The total number of technologies generated per staff member was positively correlated with the number of publications produced per staff member
The number of awards received was negatively correlated with research productivity in both Nigeria and Ghana but positively correlated with perceived adoption of technologies in Nigeria In Ghana the number of publications per PhD- and MSc-qualified staff member the number of dissemination events held and the perceived use of publications and technologies were positively correlated with peer rating
There seems to be limited complementarity and consistency across the different measures of performance used suggesting multiple objectives and perceptions both of performance and of performance measures In addition observed research outputs may not provide researchers or organizations with better awareness of adoption or impact This diversity of perceptions and objectives suggests the need for some tradeoffs in choosing and prioritizing realistic sets of indicators and targets based on the various mandates of the organizations in question With this in mind instead of creating an index of performance measures in this paper each was correlated with capacity and incentive measures
Connectivity and Linkages with Other Innovation Actors
Linkages with other innovation actors are analyzed at the individual researcher level by directly asking them about the frequency of their interactions with other innovation actors The responses were then averaged out at the organization level
Linkages with Other Researchers
Higher shares of MSc- and PhD-qualified researchers in both Nigeria and Ghana reported interacting with national and international researchers as coauthors of publications About 63 and 76 percent of PhD-qualified researchers in Ghana reported international collaboration and coauthorship respectively compared with only24 and 23 percent respectively in Nigeria Of the MSc-qualified researchers 78 percent of those in Ghana and 48 percent of those in Nigeria reported national collaboration
For those researchers who reported having generated technologies the majority in both countries reported not having collaborated either nationally or internationally For those that had collaborated national collaboration was more common for both MSc- and PhD-qualified researchers in Nigeria than it was for those in Ghana International collaboration was more prevalent among MSc-qualified researchers in Ghana than MSc-qualified researchers in Nigeria but it was more common among PhD-qualified researchers in Nigeria than PhD-qualified researchers in Ghana It is also interesting to note that BSc-qualified researchers in Ghana were collaborating both nationally and internationally
Researchers in Nigeria reported higher levels of interaction with researchers in other organizations 6 percent of those in Nigeria reported not having interacted with other researchers in the previous year compared with 12 percent in Ghana (Figure 3) Researchers employed at CRIG appear to have been less connected 39 percent reported not having interacted with researchers outside their organizations in the previous year
Limited Linkages with Farmers and Extension Services
Many researchers in both Ghana and Nigeria had not interacted with farmers or extension agents in the previous year but there was no statistical significance between the two countries in terms of the reported frequency of interactions About 25 and 27percent of researchers in Nigeria and Ghana respectively reported not having interacted with farmers in the previous year (Figure 3) 51 and
17
43percent of researchers in Nigeria and Ghana respectively had also not interacted with extension agents in the previous year
Figure 3 Distribution of researchers based on frequency of interaction with innovation actors
Panel A Nigeria Panel B Nigeria
Panel A Ghana Panel B Ghana
Source IFPRIndashARCN survey (MayndashJuly 2010) IFPRIndashSTEPRI survey (MayndashJuly 2011)
One institutional arrangement promoted mainly through World Bankndashfunded projects to foster greater interaction among innovation actors is researchndashextension linkage committees (RELCs) in Ghana and researchndashextensionndashfarmerndashinput-supplier linkage system committees (REFILS) in Nigeria These committees were established as platforms for joint priority-setting information sharing and demand articulation but with only limited success In Ghana RELCs operate at the regional and district level each RELC has 15 members including two representatives of farmer organizations one representative from a nongovernmental organization (NGO) one representative from agribusiness and representatives from research and extension services Several reports have concluded that the approach is useful in demand-driven priority-setting (Bekure and Annor-Frempong 1998 FAOndashDFIDndashODI 2002) but a number of studies have highlighted some limitations in fostering sustained interaction and linkages among innovation actors (Doamekpor 2005 Spielman Ragasa and Rajalahti 2011 Ragasa 2011b)
Survey data suggest that in Ghana half of the faculties of agriculture and 40 percent of agricultural research institutes had never participated in RELCs Moreover less than 30 percent of researchers in these institutes and faculties reported being involved in RELC activities Half of these organizations said that less than 10 percent of their researchers were involved in RELCs A survey of 237 agricultural researchers suggests that 87 percent were not involved in RELCs About 70 percent of researchers reported producing at least one new technology in the previous five years or producing at least one publication in the previous three years but they had never used RELCs as a platform for identifying problems and disseminating their new innovations This is alarmingly low participation
0
20
40
60
80
100
Farmers Extensionagents
Privatesector
NGO Other researchers
Intl org MoA
Sh
are
of
rese
arc
he
rs (
)
Never A few times a year
About once a month Several times a month
0
20
40
60
80
100
Farmers Extensionagents
Privatesector
NGO Other researchers
Intl org MoA
Sha
re o
f re
sea
rch
ers
(
)
Never A few times a year
About once a month Several times a month
0
20
40
60
80
100
Farmers Extension agents
Private NGO Research institutes
Intl org MoFA
Sh
are
of
rese
arc
he
rs (
)
Never A few times a year
About once a month Several times a month
0
20
40
60
80
100
Farmers Extension agents
Private NGO Research institutes
Intl org MoFA
Sh
are
of
rese
arc
he
rs (
)
Never A few times a year
About once a month Several times a month
18
Of the 70 extension agents interviewed in an IFPRI and World Bank survey in 2008 51 percent were not aware of RELCs (Ragasa 2011b) and 70 percent had not sourced any information improved management practices or technology in any RELCndashrelated activities Across all 600 technologies or management practicespackages promoted by the 70 extension agents in 2007 agents reported that only 6 percent had been derived from RELCndashrelated activities Nevertheless the majority of topics and technologies promoted by extension agents (82 percent) had been sourced from or learned through colleges and training centers or through in-service training
In Nigeria REFILS operate at the zonal level All 13 of the countryrsquos agricultural research institutes were involved in REFILS activities because the institutes coordinate those activities in each zone However the number of staff within each organization who reported being involved in REFILS activities ranged from 2 to 100 percent of all research staff About half of organizations reported that the majority of their researchers were involved but the other half reported that less than 10 percent of their researchers were involved This suggests that a majority of researchers is not tapping into REFILS as a platform for obtaining feedback from farmers and disseminating their research and new technologies A number of the heads of organizations interviewed noted that REFILS was unable to promote collaboration between researchers and other innovation system actors Among colleges and universities engagement in REFILS was even weaker No faculties of agriculture in major universities were involved in REFILS despite their roles in agricultural research and innovation Only 55 percent of federal colleges of agriculture were involved in REFILS and for those colleges that were involved the percentage of staff involved was less than 10 percent
Beyond problems of participation the responses of heads of organizations suggest the presence of greater institutional and systemwide issues Lack of follow-up in response to the identified needs and problems of farmers is a major problem identified in both Ghana and Nigeria Heads of organizations attributed this to the lack of resources and funding available for innovation processes especially extension service provision Multistakeholder platforms only make sense when they are linked to research and innovation processes
Limited Linkages with Other Innovation Actors
Interactions with the private sector NGOs ministries of agriculture international organizations political authorities and policymakers are limited for researchers in both countries Despite REFILS and RELCs having an explicit focus on the private sector and other stakeholders private participation is limited About 35 percent of researchers in Ghana and 45 percent of those in Nigeria reported not having met with a private firm in the previous year In Ghana partnerships with private firms and NGOs were being promoted but only in a limited way In 1996 the Government of Ghana passed new policies and changed CSIRrsquos mandate to address private-sector concerns One of the new policies makes commercializing technologies a key function of CSIR to date however according to the survey no patented technologies exist
About 34 percent of researchers in Ghana and 58 percent of those in Nigeria reported having never met with international organizations About 36 and 46 percent of researchers in Ghana and Nigeria respectively reported not having met with Ministry of Agriculture (MOA) staff either at local or national levels (excluding MOA extension agents) About 50 and 69 percent of researchers in Ghana and Nigeria respectively said they had not met with an NGO in the previous year
There were no differences in the frequency of interactions across qualification levels but some distinct variations were reported across types of organizations For example the frequency of interactions of researchers from the research and higher education institutes were similar in Ghana but researchers at CRIG reported having more frequent interactions with the private sector and much less interaction with NGOs In Nigeria fewer researchers employed at research institutes reported lack ofinteractions with innovation actors compared with those at the universities and federal colleges of agriculture The federal colleges of agriculture reported the highest share of researchers who had not
19
interacted with innovation actors In Ghana fewer researchers employed at CRIG reported lack of interaction with farmers or private sector in the previous year however more researchers reported not having interacted with other innovation actors (especially NGOs researchers at other organizations and international organizations) Fewer researchers at universities than at research institutes reported not having interacted with all types of innovation actors Researches within the research institutes in Nigeria reported more linkages with innovation actors than those at Nigerian universities but the opposite was the case in Ghana Federal colleges of agriculture were the least connected of the three groups across all types of innovation actors including farmers and extension agents
The Gap between the Actual and Perceived Importance of Interactions
When researchers were asked what they thought the frequency of interactions should be in order for them to perform their work well and to increase their productivity the majority indicated that more frequent interactions were needed than were currently practiced Results suggest differences between the actual and perceived importance of the various frequency levels of interaction with various actors Overall 22ndash24 percent of researchers reported less frequent actual interactions with farmers than was perceived necessarysimilarly32ndash34 percent of researchers reported less frequent actual interactions with extension agents 34ndash37 percent reported less frequent interaction with the private sector and 40ndash44 percent reported less frequent interaction with NGOs than was perceived necessary Hence an examination of the factors hindering greater interaction would appear necessary Among the factors cited as hindering interaction with farmers in both Nigeria and Ghana were lack of vehicles or transportation remoteness of farmers lack of interest among farmers and researchers lack of funding to organized meetings with farmers time constraints and lack of existing contacts with farmers Heads of organizations in Nigeria and Ghana cited inadequate funding to facilitate interaction lack of project vehicles lack of a forum for interaction poor leadership structures weak implementation of some part of the memorandum of understanding (of a project) lack of interest on the part of the farmers weak farmer organizations lack of group formationfarmer mobilization lack of sustainability of collaborative efforts and farmer illiteracy in some cases For those who did report interacting with farmers or extension agents interactions were rated as either ldquousefulrdquo or ldquovery usefulrdquo to the researchersrsquo work and the majority said that they were able to share ideas learn about farmersrsquo problems and disseminate information technology and research findings to farmers or extension agents This indicates the presence of fundamental and structural constraints to greater interaction that need to be minimized
In contrast however about 10 and 15 percent of researchers in Nigeria and Ghana respectively did not believe that interactions with farmers were required in order for them to perform their work well Similarly 10 and 19 percent in Nigeria and Ghana respectively did not believe that interactions with extension agents were required and a further 10 percent of researchers in both countries approximately did not believe that interacting with other innovation actors was important for their work This indicates the need to raise awareness among researchers of the importance of these kinds of collaborations in order to shift the mindset of researchers regarding the importance of being connected to the wider innovation system
Two strategies would be useful for fostering greater connectivity among researchers (1) addressing the obvious lack of information on the importance and relevance of collaboration and linkages across the innovation system and (2) addressing the constraints to more frequent interaction as described by researchers and heads of organizations particularly in terms of the funding needed Many studies focus on the vital need for greater linkages and collaboration but few look at the constraints and disincentives that prevent this from happening
Strong Correlations with Other Performance Measures
Positive correlations exist between the frequency of interactions between researchers and various types of innovation actors In Nigeria for example more frequent interaction with farmers is correlated with
20
more frequent interaction with MOA staff NGOs and researchers at other organizations interaction with the private sector is positively correlated with interactions with NGOs researchers at other organizations and MOA staff and more frequent interaction with extension agents is positively correlated with more frequent interaction with NGOs international organizations and MOA staff In Ghana greater interaction between researchers and international organizations is positively correlated with all other sets of innovation actors with the exception of farmers More frequent interaction with MOA staff is positively correlated with all other types of innovation actors with the exception of researchers at other organizations The frequencies of interactions with farmers and extension agents are positively correlated Interaction with NGOs is positively correlated with frequency of interaction with the private sector and extension agents The analysis reveals two common themes in terms of the factors that hinder interaction among various innovation actors First there is general lack of interest in and motivation toward interacting particularly because it does not effect promotional advancement salary increases or recognition Second lack of funding is often the major constraint to collaboration and interaction between researchers and other innovation system actors
In Ghana interaction with farmers is negatively associated with technology generated and publications produced per PhD-qualified researcher at both the organizational and individual levels (Appendix Table A4) Interaction with extension agents is positively correlated with average publications per MSc-qualified researcher and negatively associated with perceptions of adoption Interaction with NGOs is negatively correlated with the average number of technologies generated per PhD-qualified researcher Interaction with the private sector is positively corelated with publications produced and the intensity with which they are disseminated by both MSc- and PhD-qualified researchers Interaction with international organizations and MOA staff is positively correlated with the average number of publications produced per MSc-qualified researcher International collaboration in producing publications is correlated with the average number of technologies generated and publications produced by PhD-qualified researchers
In Nigeria interaction with farmers extension agents NGOs and international organizations are all correlated with the average number of technologies generated per PhD-qualfied researcher Interaction with researchers at other organizations is correlated with the average number of publications produced per MSc-qualified researcher Interaction with MOA staff is correlated with the average number of technologies generated and publications produced by MSc-qualified researchers Average membership in associations is correlated with the average number of publications produced by PhD-qualified researchers Finally international and national collaboration are strongly and positively correlated with the number of publications produced per PhD- and MSc-qualified researcher
Staff Morale
Researchers were asked to rate their satisfaction with their level of research output compared with other staff in a similar position or with the same qualifications within their own or in other organizations Overall more researchers in Nigeria reported being satisfied with their outputs than those in Ghana Ten percent of researchers in Ghana and 25 percent in Nigeria were very satisfied but 20 percent of researchers in each country reported having little or no satisfaction with their output levels (Figure 4) These researchers said they would like to produce more which may be a valuable first step toward their achieving greater productivity under existing conditions
21
Figure 4 Distribution of researchers based on satisfaction with their output
Source IFPRIndashARCN survey (MayndashJuly 2010) IFPRIndashSTEPRI survey (MayndashJuly 2011)
It seems that researchers in both Ghana and Nigeria were satisfied with their jobs About 21ndash24 percent were very satisfied with their job 65ndash67 percent were satisfied and 10ndash11 percent were not satisfied or were minimally satisfied (Figure 5) Almost all of the researchers said that they chose their job because they liked doing research developing technologies and inventions teaching or helping to solve farmersrsquo problems 1 percent said they liked their job due to the prestige of research and the salary and benefits offered These results may be helpful in indicating priorities for incentive structures
Figure 5 Distribution of researchers based on their perceived satisfaction with their job their output the effectiveness of organization and the work environment
Panel A Nigeria
0
20
40
60
80
100
Nigeria Ghana
Shar
e o
f re
sear
che
rs (
)
not satisfied little satisfaction somewhat satisfiedsatisfied very satisfied
0
20
40
60
80
100
Shar
e o
f re
sear
che
rs (
)
Strongly agree Agree Disagree Strongly disagree
22
Figure 5 Continued
Panel B Ghana
Source IFPRIndashARCN survey (MayndashJuly 2010) IFPRIndashSTEPRI survey (MayndashJuly 2011)
In terms of effectiveness more researchers in Ghana than in Nigeria perceived that their organizations were effective based on their budgets and resources Fifteen percent of researchers in Ghana and 10 percent of those in Nigeria strongly agreed that their organization was effective (Figure 5) A further 63 and 60 percent of researchers in Ghana and Nigeria respectively merely agreed that their organization was effective This perception of effectiveness was not statistically correlated with actual productivity measures or performance indicators
These results coincide with researchersrsquo perceptions that their working environment and organizational practices reflected transparency accountability gender equality political autonomy fair and competitive compensation openness of information regarding output and performance of organization and satisfaction regarding available resources within organization among other factors Researchers in Ghana reported greater satisfaction based on the majority of aforementioned organizational practices Of these practices respondents in both Nigeria and Ghana reported low satisfaction withthe adequacy of physical resources and research funding themajority of respondents (78ndash80 percent) disagreed that resources wereadequate (Figure 5) Other factors that engenderedmuch dissatisfaction among respondents werefair and competitive compensation which is rated low by most staff in Ghana andjob security in Nigeria Lack of a competitive salary and benefits seems to be a bigger problem for researchers in Ghana whereas job security was a much bigger issuein Nigeria Corruption or misuse of fundingin organizations was the next factorthat wasrated low inboth countries Consistently high ratings were given for peer recognition and gender equality in opportunities (less than 20 percent of researchers weresatisfied with different aspects of their organizationrsquos climate)
The big differences between Ghana and Nigeria wereasfollows
1 A higher proportion of respondents reportedjob security as being an issue in Nigeria than in Ghanawhereasa higher proportion of respondents reported fair and competitive compensation as an issue in Ghana than in Nigeria The ratings forjob security in Nigeria weresurprisingbecause researchers employed at both the research instituteand higher education agencies were under tenureand key informants could not recall any instance of a staff member beingfired This anomoly requires further research
2 A higher proportion of respondents in Nigeria than in Ghana reported that corruption was an issue in research organizations
3 Proportionally more respondents in Nigeria than in Ghanareportedthat transparency in recruitment and promotion was an issue
0
20
40
60
80
100
Shar
e o
f re
sear
che
rs (
)
Strongly agree Agree Disagree Strongly disagree
23
4 Proportionally more respondents in Ghana than in Nigeria reported satisfaction withthe qualifications of research staff in their position and in their organization
5 Proportionally more researchers in Ghana than in Nigeriareported that there wasclarity of roles and responsibilties in theirresearch organizations
6 Proportionally fewer researchers in Ghana than in Nigeria reported thatpolitical interference was an issue
7 Proportionally more researchers in Ghana than in Nigeria reportedopenness of information about their organizationrsquos performance
8 Slightly more researchers in Ghana than in Nigeria reportedhaving greater mobility within their operational areas
Compared with other performance measures a composite index for the working environment isstrongly and positively correlated with other performance measures in both countries In Ghana peer ratings and the average number of publications produced per MSc- and PhD-qualified researcher were positively correlated with reported satisfaction with the working environment Perceptions of their organizationrsquos transparency were correlated with the average number of technologies generated per PhD- and MSc-qualified researcher
In Nigeria satisfaction with the work environment (based on almost all indicators as well as their average) was positively and strongly correlated with peer ratings and the average number of technologies generated per MSc- and PhD-qualified researcher Among the important aspects of the working environment that are correlated with performance measures the perception of participatory leadership the quality of human resources and peers within the organization and the organizationrsquos responsiveness to clientsrsquo complaints general effectiveness and openness of information were associated with technologies generated per MSc- and PhD-qualified researcher
In both Nigeria and Ghana more frequent interaction with extension agents was positively correlated with higher operating funding per FTE researcher Linkages with almost all actors were positively associated with satisfaction with the working environment Perceptions of transparency in the organizationrsquos methods of promotion recruitment decisionmaking political interference and corruption were positively correlated with the frequency of interaction with all actors Perceptions of mobility within the operating area were positively correlated with the frequency of interaction with researchers at other organizations In Nigeria access to the Internet was positively correlated with the frequency of interactions with researchers at other organizations In Ghana organizations located in Accra have more linkages with other actors with the exception of farmers and extension agents In Ghana more frequent interaction with researchers at other organizations was positively correlated with funding for capital investments per FTE researcher These results suggest that interaction and linkages largely depend on organizational issues and staff morale which either hinder or encourage them The survey indicated that important factors encouraging interaction include operating funds greater mobility improved transportation improved Internet access and other physical infrastructure
Capacity and Incentive System
The cornerstone of an effective performance-based reward system is an understanding of what motivates researchers and research managers Surprisingly the data indicate that the distinguishing line between capacity and motivation is thin When researchers and heads of organizations were asked about their motivations (through open-ended questions) most indicated the availability of basic resources peer effects and financial incentives
Motivation among Researchers
A sample of researchers interviewed in both countries rated higher salary and promotion as the top motivating factor for increasing their productivity and performance (Figure 6) Skills development and
24
0
10
20
30
40
50
60
Nu
mb
er o
f org
aniz
atio
ns
training and more timely release of funding ranked2nd and 3rd in Nigeria and peer recognition and appreciation by farmers ranked 2nd and 3rd in Ghana Rounding out the list in Nigeria were more research funding followed by better laboratories and infrastructure The most commonly mentioned factor in Nigeria was power supply In Ghana skills development and training and more research funding completed the list of motivating factors This reveals that incentives are not only financial but are also based on the availability of advancement opportunities in terms of developing skills and on a conducive work environment within which researchers can conduct their research In Nigeria for example at many research institutes researchers couldnrsquot even stay in their offices because they were too hot and there was often no electricity for days at a time
Figure 6 Distribution of organizations based on the top five motivations reported by the heads of organizations and individual scientists Nigeria and Ghana
Panel A Nigeria heads of organizations Panel B Ghana heads of organizations
Panel C Nigeria staff Panel B Ghana staff
Source IFPRIndashARCN survey (MayndashJuly 2010) IFPRIndashSTEPRI survey (MayndashJuly 2011)
Motivation among Heads of Organizations
Responses by heads of organizations differed in some respects in terms of motivating factors for increasing their productivity and performance In Nigeria 60 percent of heads of organizations cited research funding andor the timely release of funds as the most important motivating factor This was closely followed by facilities and physical infrastructure (all heads of federal colleges of agriculture mentioned this as the most important factor) A conducive work environment peer recognition high
0
10
20
30
40
50
60
70
Nu
mb
er o
f org
aniz
atio
ns
0
10
20
30
40
50
Nu
mb
er o
f org
aniz
atio
ns
0
10
20
30
40
50
Nu
mb
er o
f org
aniz
atio
ns
25
salaries (andor timely payment of salaries) and the impactadoption of technologies generated were among the top motivating factors In Ghana high salaries (andor health insurance) were the top motivating factor reported by 53 percent of heads of organizations Closely following were recognitionstatus staff morale or staff discipline and support career development and a conducive work environment
Mission Orientation and Organizational Management System
Indicators of mission orientation included (1) satisfaction with the organizationrsquos management systems (2) satisfaction with indicators used for monitoring and evaluating the performance of researchers (3) the mission orientation of the head of the organization and (4) the degree of control or flexibility the organization exerts through its culture Measures of organizational management procedures and systems were not statistically correlated (and were even negatively associated in some cases) with measures of performance Nevertheless researchers rated the presence of and their satisfaction with implementation and management procedures as low Half of the heads of organizations in both Nigeria and Ghana reported that they did not have an MampE system for organizational performance half the heads of organizations in Nigeria and 25 percent of those in Ghana reported that they did not have a strategic plan 35 and 7 percent respectively reported not having a staff performance appraisal system 35 and 25 percent respectively reported not having a training and staff development plan and 80 and 75 percent respectively reported not having a policy on intellectual property rights
OPAS was implemented in Ghana in the early 1990s which might explain the higher levels of satisfaction in Ghana and the presence of these management systems Nevertheless many organizations in Ghana have not implemented these systems despite OPAS OPAS is currently being implemented in Nigeria where it seems the issue is not lack of awareness or capacity to implement but the commitment to sustained implementation The Ghana Institute of Management and Public Administration (GIMPA) has organized leadership training sessions for CSIR on organizational management including evaluation MampE however even though MampE elements exist at various levels of CSIR management training on the application of the information and knowledge through GIMPA may be extremely useful Key informants reported that the trainings vary in depth and quality were mostly of a general nature and required implementation by management The fact that the systems were often not implemented signals that the trainings are often supply- rather than demand-driven The other problem is that the reality of applying these organizational systems is often very different from the theory Hence the problem boils down to a combined lack of commitment to implementation on the part of management and lack of adequate practical knowledge on the implementation process
Another area looked at was whether rewards or sanctionsdisciplinary actions were used Correlation and regression analysis suggests that rewards (that is positive reinforcements) are positively associated with performance in both Ghana and Nigeria This further suggests that incentive systems need to be implemented to provide a tangible ldquocarrotrdquo that increases productivity in research organizations as opposed to simply paying lip-service to MampE and staff appraisal systems
Missionorientation manifests itself in the performance indicators used by anorganization All the heads of organizations interviewedsaid that they report to and feel accountable to the executive director of CSIR or theprovost or dean of their university They enumerated various factorswhen asked to name thefive performance indicators used by these people to judge both their performance and the performance of the organizations In Nigeria 20 different responses resulted ranging from publications produced totechnologies generated to punctuality comittment and trainings conducted Ghana returned 13 different responses from heads of organizations ranging from internally generated funding to staff morale In both countries when the heads oforganization cited technology generation as a performance indicator higher numbers of technologies were generated by the organizationrsquos researchers If heads of organizations cited producing publications as a performance indicator the average number of publications produced per researcher was higher When impact on farmers or the
26
community was cited by the heads of organizations as a performance indicator researchers tended to display greater knowledge of technologies and their adoption and more knowledge of these and impact of their publications This indicates that researchers respond to their organizationrsquos chosen performance indicators signifying a point of entry for leaders and managers
Organizational Capacity and Resources
Several indicators were used to capture differences in resources the quality of human resources and peer effects which may explain variations in performance measures For physical and financial resources the following indicators were used (1) expenditure on research during 1992ndash2003 (disaggregated as salaries operating costs and capital investments)which would roughly correspond to most technologies generated during 1997ndash2008 (2) the ratio of research expenditure to FTE researchers and (3) the heads of organizationsrsquo satisfaction regarding the adequacy of physical resources Total funding (in 2005 PPP dollars) is correlated with peer ratings The ratio of operating costs to FTE researchers is positively correlated with the number of publications produced per MSc-qualified researcher in Ghana and the frequency of interaction with innovation actors is strongly correlated with the operating budget per FTE researcher in both Nigeria and Ghana
Research facilities and physical infrastructure are statistically correlated with technologies generated per PhD-qualified researcher in both Ghana and Nigeria and with awards received and peer ratings in Nigeria In both countries more than 90 percent of organizations were not satisfied or had little satisfaction with computer and Internet facilities and their access to journals About 92ndash95 percent of heads of organizations in Nigeria and 69ndash73 percent of those in Ghana were not satisfied with their information and communications facilities and systems at their headquarters and substations In terms of research facilities and other physical infrastructure 55 and 12 percent of heads of organizations in Nigeria and Ghana respectively said that they were not satisfied with the adequacy of facilities at their headquarters The rating was even worse for substations 65 and 37 percent of heads of organizations in Nigeria and Ghana respectively said they were not satisfied with the adequacy of facilities at their substations In both Nigeria and Ghana satisfaction with facilities communications libraries and transportation were associated with the average numbers of technologies generated and publications produced by PhD- and MSc-qualified staff
One difference between the two countries is that more heads of organizations were dissatisfied with the adequacy of their facilities and systems in Nigeria than in Ghana A related issue is the lack of modern research equipment mentioned by 17 heads of organizations and power supply mentioned by 15 heads of organizations In Nigeria funding dropped sharply and became irregular from the 1960s to the mid-1990s which negatively affected infrastructure and resources and seriously weakened organizationsrsquo ability to conduct research Nigeria is however attempting to accelerate its infrastructure development Capital investments accounted for only 2 percent of the CSIR agenciesrsquo research expenditures in 2008 whereas they constituted 45 percent of ARCNrsquos total spending that year As part of the reform process Nigeria is undertaking a systematic assessment of optimal investments in their facilities and equipment It seems that in the past there was too much focus on short-term training observations from this study suggest that investment in human resources or training can only be effective with complementary investments to fill gaps in the physical resources
For human resource capacity and peer effects three indicators were used (1) salary costs per FTE researcher (2) researchersrsquo perception of whether other researchers were well-qualified for their positions (signifying the quality of the pool and building on the peer-effect assumption within organizations) (2) perceptions of heads of organizations as to the adequacy of human resources (3) the ratio of PhD- to MSc-qualified researchers in the organization and (4) the percentage of researchers that reported having received technical training In Nigeria the ratio of PhD- to MSc-qualified staff and the number of technologies generated per FTE researcher were positively correlated In Ghana the ratio of PhD- to MSc-qualified researchers was positively correlated with the number of publications
27
produced per MSc-qualified researcher In both countries the higher the ratio of PhD- to MSc-qualified researchers the more productive researchers wherein generating technologies and producing publications
In Nigeria on average researcher perceptions that staff within their organization were well-qualified were correlated with higher perceived technology adoption rates higher numbers of technologies generated per PhD-qualified researchers and higher peer ratings In Ghana average numbers of publications produced per PhD-qualified researcher were positively correlated with perceptions that staff were well-qualified for their positions In Nigeria training appeared to be positively correlated with higher average numbers of publications produced per PhD-qualified researcher
4 CONCLUSION AND POLICY IMPLICATIONS
The task and processes involved in designing and implementing this study were complex and challenging The paper should be taken as a work in progress requiring ongoing refinements of measurements and definitions especially in the event that they are scaled out to other countries Moreover the results described in this paper only cover national agricultural research organizations (NAROs) so more research is needed to expand coverage to a wider set of innovation actors and to capture adoption rates and impacts on farmers and other end-users in order to fully assess the effectiveness of RampD investments and innovation performance of NARSs Nonetheless a number of observations and insights are informative from this ongoing pilot study in terms of entry points for strengthening capacity and performance of agricultural research organizations both in Ghana and Nigeria Key observations and insights are summarized below
Limited Farmer or Impact Orientation
Across all organizations in both Ghana and Nigeria there is lack of farmer- or impact-orientation and the approach being used is still supply-driven The number of publications produced is heavily emphasized especially in Nigeria as is internally generated (nongovernmental) funding in Ghana Some organizations emphasize the generation of technologies but stop short of follow-up on what happens to these technologies in terms of their adoption and impact Many researchers in both Ghana and Nigeria do not interact with farmers or extension agents and a large share has no knowledge or awareness of the adoption of the technologies they contributed to developing Only a few researchers and heads of organizations cited that helping farmers or having an impact on community was a motivating factor in their work an implicit or explicit measure of their performance or a guiding value in their organizationrsquos culture Although several workshopstrainings have been conducted in Nigeria and Ghana on the innovation systems perspective international agricultural research for development and similar approaches no NARO has implemented or fully embraced these approaches The closest involvement is in RELCs and REFILS but sustained interaction with farmers and agribusiness and participation in extension activities remain very weak
On a more positive note the output and productivity of researchers in some organizations in Ghana and Nigeria appears to shift in response to explicit performance indicators suggesting some entry points for intervention If heads of organizations cited that the number of publications produced was used as a performance indicator more publications were likely to be produced by their organizationsrsquo researchers If heads of organizations cited that the number of technologies generated was used as a performance indicator researchers are likely to generate more technologies on average The explicit inclusion of publications technologies adoption impact and solving farmersrsquo problems could be tested and implemented as performance indicators but an appropriate reward system would also need to be in place As OPASndashbased capacity strengthening is ongoing an urgent action for ARCN is to ensure that measurable targets are included in terms of the productivity and efficiency of research
28
the quality of research linkages and the impacts on farmers and the community Capacity strengthening efforts under the West Africa Agricultural Productivity Program (WAAPP) can also instigate stricter design and implementation of performance targets in organizations
This process however would require stronger leadership and management commitment to increase researchersrsquo accountability to farmers and end-users and to ensure that MampE processes are sustainably integrated into organizations For example a more effective performance-based reward system with greater transparency would be necessary External accountability would also help as would openness of information about organizational performance Increased levels of international research collaboration seem to be associated with higher levels of research output and productivity greater awareness of adoption and improved peer ratings Innovations adopted in other countries to increase researcher accountability have potential in Ghana and Nigeria (1) strengthening producer organizations to provide a leadershipmanagement role in setting priorities selecting service providers and implementing competitive research and extension grants and (2) hosting producer organizations in research institutes to cultivate their full engagement in developing research and technologies
Policy and Perspectives Are Reflected in Observed Performance
Overall performance measures used in Nigeria and Ghana differ according to national and institutional contexts and the different perspectives of their research councils On average researchers in Nigeria were more productive in terms of numbers of peer-reviewed publication per researcher compared with researchers in Ghana Such differences can result from stronger organizational emphasis on publications as an explicit organizational performance indicator and an implicit measure of peer recognition This is also associated with increased emphasis on internally generated and other nongovernment funding in Ghana which are associated with increased consultancies rather than peer-reviewed publications The results of this study are inconclusive when it comes to correlating technology generation with data constraints
Researchers in Ghana are generally more satisfied with their working conditions than are researchers in Nigeria In Ghana a majority of heads of organizations cited staff morale as a top motivating factor whereas none of the heads of organizations in Nigeria included staff morale in their rankings Researchers in Ghana reported having better linkages with other innovation actors than in Nigeria but researchers in Nigeria reported having better linkages with researchers in other organizations This could stem from greater emphasis on research collaboration in CSIR policy explicit NARO performance indicators and implicit peer ratings on generating nongovernmental funding which would require interaction and collaboration with the private sector NGOs and international organizations These linkages among Nigerian researchers also seem to be correlated with a stronger emphasis on the number of publications produced as the performance indicator in NAROs and ARCN which are generally enhanced by interactions with other researchers It seems that stronger linkages with other researchers is also correlated with more tangible research outputs but staff morale and increased linkages with end-users and other actors are not necessarily correlated
Inconsistencies in Performance Indicators
Complementarity and consistency are limited across the different measures of performance used suggesting multiple organizational objectives and perceptions of performance or performance measures For example more researchers in Ghana seems to have more linkages with innovation actors and are more satisfied with human and physical resources available to them their organizationsrsquo management practices and their working environment but these do not seem to translate into higher productivity in terms of technologies generated or publications produced More researchers in Ghana than in Nigeria perceived that their organizations were effective given their budget and resources In Nigeria more researchers perceived that adoption awards and peer ratings were all positively
29
correlated but in reality they were seemingly negatively correlated with productivity in terms of the number of technologies generated and publications produced and per PhD- and MSc-qualified researcher In Ghana productivity and peer ratings were positively correlated but all were negatively correlated with perceived adoption levels From a policy and operational perspective these multiple and inconsistentuncorrelated objectives suggest the need to rationalize and prioritize the indicatorstargets used in order to achieve a realistic and balanced set that organizations can implement and commit to based on their mandates Nevertheless regardless of the methods employed refocusing NAROs on their mission to have an impact on poor farmers and end-users would be beneficial This scope of this study needs to be expanded to include an examination of actual technologies adopted and their impact although this would depend on the availability of relevant data
Variability within Countries
Differences were also found in performance and linkage measures among organizations within each country There were pockets of organizations that perform well or poorly despite national and institutional continuity One does not even have to go out of their own countries to find examples of good practices It is important to draw lessons from well-performing organizations which implies identifying scalable elements across similar organizations in a given country Similarly larger well-performing organizations could offer insights and assistance to their smaller and less well-resourced counterparts
Infrastructure Acts As a Binding Constraint
Satisfaction with physical infrastructure and the work environment were statistically significant in explaining variations in several performance measures analyzed Among the indicators of work environment those most often significant were the perception of participatory leadership the absence of corruption and political interference and the presence of well-qualified staff transparency and open information Satisfaction with the adequacy of research facilities physical infrastructure and the Internet and communications systems were also statistically significant Salary and benefit levels were consistently mentioned by researchers and heads of organizations especially in Ghana but variations in the perceived competitiveness of salaries adequacy of salaries relative to living expenses and salary costs per FTE researcher did not appear to be statistically correlated with variations in any of the performance indicators Although further research is needed to investigate optimal salary levels in recommending priority investments for increasing their productivity and output the majority of researchers suggested improvements in basic facilities which contrasts the much heavier emphasis on low salaries highlighted as the binding constraint in other studies such as Byerlee 2004 Increasing capital investments and building physical resources will be important factors in both Nigeria and Ghana
Constraints To Greater Linkages
A large majority of researchers was aware of the crucial importance of linkages with other innovation actors but it seems that achieving them is hindered by structural barriers Currently researchers have limited linkages with innovations actors in both Ghana and Nigeria (although the situation is slightly better in Ghana) Improvement could be achieved first by shifting researchersrsquo mindset and strengthening their capacity to link with other innovation actors and end-users and second by addressing the constraints to greater linkages which include lack of funding and transportation and lack of interest or motivation by both parties In Nigeria while there is relatively stronger collaboration between research institutes and higher education agencies linkages with other stakeholders including private-sector actors service providers and end-users are highly limited New institutional and organizational frameworks are emerging from ongoing collaboration between ARCN and IFPRI to incorporate the promotion of industry funding and greater collaboration among stakeholders which
30
were suggested in initial presentations of the results of this study to ARCN It will be interesting to see how the Nigerian NARS develops in the next three to five years in light of the reform process
Many of these actions require substantial investment from the government and partners Infrastructure is a binding constraint especially in Nigeria and this requires investment Linkages are crucial but results indicate that they do not occur automatically but rather need to be encouraged through the use of incentives and supported financially through explicit inclusion in research and extension budgets Salary and benefit levels seem to be a greater issue in Ghana (although further study is needed to determine whether this is a binding constraint) and once again these require sustained investment Strengthening human resourcesmdashincluding technical scientific management innovation system and value-chain capacitymdashwhich seems to be needed in both Ghana and Nigeria also requires investment While Ghana is close to reaching an agricultural budget allocation of 6 percent of GDP its investment is still very low based the size and importance of its agricultural sector The ratio of agricultural expenditure to agricultural GDP is less than 2 percent in Ghana and only about 5 percent in Nigeria compared with the average of 8ndash10 percent achieved in agriculture-based Asian countries since 2000 (Fan Omilola and Lambert 2009 Omilola and Lambert2010) Ghana and Nigeria need to invest much more in agriculture in general and in agricultural RampD in particular
31
APPENDIX
Appendix Table A1 Performance indicators employed in the study
Performance measure Variable code Definition
1 Conventional indicators
Publications PUBPHD PUBMS Number of peer-reviewed publications as first author or coauthor (international journals national journals books) disaggregated by MSc- and PhD-qualified staff
Technology TECHFTE TECHPHD TECHMS
Biological or new breedsvarieties mechanical and processing technologies chemical technologies and improved production processing management conservation and marketing practices and systems at the organization-level this variable is the total number of technologies completed and released during 1997ndash2008 and expressed as a ratio of FTE researchers at the individual-level this variable is the total number of technologies completed and released in the past five years to which the respondentresearcher has contributed disaggregated by MSc- and PhD-qualified staff
Patents Number of patents registered
2 Organizational theory and public-sector motivation
Staff morale JOBSATIS Rating of the statement ldquoI am satisfied with my jobrdquo (LIkert scale 1ndash4)
EFFECTIVE Rating of the statement ldquoMy organization is effective given its budget and available resourcesrdquo (Likert scale 1ndash4)
Peer rating PEERRATE The number of times the organization is listed among the top five performing organizations rated by heads of other organizations (categorized by organization type) performance was determined based on productivity in publications and technologies and then by impact on the community organizations were also given the chance to list additional performance measures and name organizations that met them
Award AWARD Number of professional awards received by the organization or a researcher in the organization
Satisfaction with own performance
OUTPUTSATIS Rating of the statement ldquoI am satisfied with my output compared with similar positionsqualifications in the organizations or other organizationsrdquo (Likert scale 1ndash4)
3 Innovation systems perspective
Linkages FFARMER FEXT FNGO FPRIV FRES FINTL FMOA RESINTL RESNATL ASSO
Frequency of interactionsmeetings of researchers with farmers the private sector extension agents other researchers universitiescolleges international organizations ministries of agriculture policymakers and political actors in the past year (Likert scale 1ndash4) international or national research collaboration (dummy) Number of professional association memberships (dummy)
Adoption of joint priority-setting participatory approaches or innovation platforms
PARTICI Whether the organization adopts joint priority-setting participatory approaches or is engaged in innovation platforms (dummy)
Level of dissemination PUBDISS Number of dissemination events where publications produced have been disseminated or communicated in the past three years
Perceived adoption rate of technologies
ADOPT Whether respondents are aware of the adoption of their technologies produced (dummy)if they are aware to provide an assessment of the adoption rate (from 1=no adoption to 5=wide adoption)
Perceived use and impact of publications
PUBUSE Whether respondents are aware of the use or impact of publications produced (dummy)if they are aware to provide details of how it is being used or making an impact
Source Devised by authors Notes The Likert scale is a rating based on whether respondents strongly agree (= 1) agree (= 2) disagree (= 3) or strongly disagree (= 4)
32
Appendix Table A2 Capacity and incentive indicators employed in the study
Indicatorsvariable codes Definitionsmeasuressources of data
1 Organizational capacity Perceptions of head of organization and staff (ASTI data)
Human financial and physical resources (TOTALEXPEND OPERATINGFTE CAPITALFTE EXPENDFTE ADEQFUND ADEQPHY ADEQHUM PHDMS)
Total expenditures Ratio operating funds to FTEs (2000ndash02 average) ratio of capital funds to FTEs (2000ndash02 average) rating of the adequacy of research funds by head of organization and staff (Likert scale 1ndash4) rating of the adequacy of physical resources by head of organization and staff (Likert scale 1ndash4) rating of adequacy of human resources by head of organization and staff (Likert scale 1ndash4) ratio of PhD- to MSc-qualified staff
2 Organizational management systems Perceptions of head of organization and staff
Staff satisfaction on work environment (WORKENV EFFECTIVE JOBSATIS)
Response to 15 statements about the transparency of staff hiring and promotion fair and competitive pay gender equity in opportunities within the organization political autonomy coherence mobility responsiveness to clientsrsquo complaints and demands job security flexibility and participatory leadershipmdashfor example ldquoMy organization maintains a transparent process of hiring and promotionrdquo(Likert scale 1ndash4)
Availability of organizational management systems (PLAN)
Rating by head of organization of the adequacy of various organizational management systems such as the systems of performance monitoring and evaluation staff appraisals strategic planning operational planning and staff development and training planning (Likert scale 1ndash4) a composite index was also generated through factor analysis
Training (TRAIN) Whether respondents were receiving technical and management training (dummy)
3 Organizational culture type Perceptions of heads of organizations
Type of organizational culture (CONTROL) Rating of head of organization on 12 statements pertaining to the organizationrsquos values culture strategic focus and leadership style (percentage 1ndash100)
4Incentive systems and sources of external accountability
Perceptions of organization head and staff
Presence of reward (REWARD) Responses of head of organization on whether rewards were given in the previous year (dummy)
Presence of sanction (SANCTION) Responses of heads of organizations on whether disciplinary action was taken in the previous year (dummy)
Emphasis on technology as performance indicator (PERTECHNO)
Whether heads of organizations cite technology as a response to an open-ended question about the performance indicators used by the organization (dummy)
Emphasis on publication as performance indicator (PERPUB)
Whether heads of organizations cite ldquopublicationrdquo as a response to and open-ended question about the performance indicators used by organization (dummy)
Emphasis of impact as performance indicator (PERIMPACT)
Whether heads of organizations cite ldquoimpact on communityfarmers or adoption of technologiesrdquo as a response to an open-ended question about the performance indicators used by organization (dummy)
Salary (SALARYFTE SALARYOTHER SALARYLIVING)
Salaries per FTE perception of staff on the fairness and competitiveness of salaries in relation to same positionqualifications in other organizations (Likert scale 1ndash4) perception of staff on sufficiency of salary in relation to living expenses
Information shared to clientsstakeholders (INFO) Responses to statements about sharing information on the organization and its performances with clients stakeholders and the media (Likert scale)
Presence of donor funding (DONOR) Whether the organization has received donor funding (dummy)
Other controls Type of organization and location
Research institute higher education agency federal college nonndashCSIR research institute and zones or regions where the headquarters are located
Source Devised by authors Note The Likert scale is a rating based on whether respondents strongly agree (= 1) agree (= 2) disagree (= 3) or strongly disagree (= 4)
33
Appendix Table A3 Correlation of performance measures for Nigeria and Ghana
Variables ADOPTa TECHPHD
a TECHMS
a PUBLIPHD PUBLIMS PUBUSE PUBDISS AWARD PEERRATE
Nigeria
ADOPTa
TECHPHDa ndash (RI)
TECHMSa
PUBLIPHD ndash (RI) + (RI)
PUBLIMS ndash (RI) + (RI)
PUBUSE
PUBDISS
+ (UNI)
AWARD + (RI) ndash (All) ndash (All)
ndash(UNI) PEERRATE
ndash (RI)
+ (RI)
+ (All)
Ghana
ADOPTa
TECHPHDa ndash (RI)
TECHMSa
PUBLIPHD ndash(RI) + (RI)
PUBLIMS + (RI)
PUBUSE
PUBDISS
+ (All)
+ (UNI) AWARD ndash(FCA) PEERRATE ndash (RI)
+ (RI) + (All)
+ (FCA) + (All)
+ (FCA) + (All) + (FCA)
Source Compiled by authors from IFPRIndashARCN survey (MayndashJuly 2010) and IFPRIndashSTEPRI survey (MayndashJuly 2011) Note RI indicates research institutes UNI universities and FCA federal colleges of agriculture For descriptions of codes see Tables A1 and A2 a Includes research institutes only
34
Appendix Table A4 Correlations between performance measures linkages and other factors for Nigeria and Ghana
Factors ADOPTa TECHPHD
a TECHMS
a PUBPHD PUBMS PUBDISS PUBUSE AWARD PEERRATE
Nigeria
PHDMS
RESINTL + + + + +
RESNATL + + FFARMER + + FEXTFPRIV +
FRES + +
FINTL + FMOA + + ASSO + EFFECTIVE +
WORKENV + + + +
PLAN +
ADEQPHY + + +
PERFPUB + +
PERFTECHNO + +
TOTALEXPEND +
OPERATINGFTE + +
REWARD + +
Ghana
PHDMS +
RESINTL + + + + +
RESNATL + + + + +
FPRIV + + +
FRES + + +
FINTL +
FMOA + ndash
ASSO +
WORKENV +
+ + +
ADEQPHY +
+
CONTROL +
PERPUB + +
PERTECHNO + +
REWARD
+ + + +
OPERATINGFTE
+
EXPENDFTE +
TOTALEXPEND +
ACCRA
+ + ndash
Source IFPRIndashARCN survey (MayndashJuly 2010) IFPRIndashSTEPRI survey (MayndashJuly 2011) Note For descriptions of codes see Tables A1 and A2 a Includes research institutes only
35
REFERENCES
Alston J M C Chan-Kang M C Marra P G Pardey and TJ Wyatt2000 A Meta Analysis of Rates of Return to Agricultural RampD Ex Pede Herculem IFPRI Research Report No 113 Washington DC International Food Policy Research Institute
Bantilan M C S S Chandra P K Mehta and J D H Keatinge 2004 Dealing with Diversity in Scientific Outputs Implications for International Research EvaluationResearch Evaluation 13 (2) 87ndash93
Beintema N M and G-J Stads 2004 Sub-Saharan African Agricultural Research Recent Investment Trends Outlook on Agriculture 33 (4) 239ndash246
________ 2011 African Agricultural RampD in the New Millennium Progress for Some Challenges for Many IFPRI Food Policy Report Washington DC International Food Policy Research Institute
Bekure S and C Annor-Frempong 1998 Evolution of ResearchExtension Linkages in Ghana Accra Ghana World Bank
Byerlee D 2004 Enhancing Accountability and Impacts of Agricultural Research Systems in Developing Countries InNew Directions for a Diverse Planet Proceedings of the 4th International Crop Science Congress Brisbane Australia September 26‒October 1
Byerlee D and G Alex 1998 Strengthening National Agricultural Research Systems Policy Issues and Good Practice Agriculture and Rural Development Discussion Paper Series Washington DC World Bank
Byerlee D and R G Echeverriacutea eds 2002 Agricultural Research Policy in an Era of Privatization New York CABI International
Clark N 2005 Science Policy and Agricultural Research in Africa A Capacity Building Needs Assessment Paper commissioned by the New Partnership for Africarsquos Development lthttpwwwnepadstorg doclibrarypdfsdoc25_022005pdfgt
CTA (Technical Centre for Agricultural and Rural Cooperation) 2009 Performance Indicators for Agricultural Innovation Systems in the ACP regionSynthesis report of the International Expert Consultation Workshop July 15ndash17 2008 Wageningen The Netherlands
Daane J 2008 New Pathways to Build Capacity for Development Oriented Agricultural Research and InnovationWageningen The Netherlands International Centre for Development Oriented Research in Agriculture (ICRA)
Diao X P Hazell D Resnick and J Thurlow 2006 The Role of Agriculture in Development Implications for Sub-Saharan Africa DSGD Discussion Paper No 29 Washington DC International Food Policy Research Institute
Doamekpor P K 2005 Effectiveness of ExtensionndashResearch Linkages in Volta Region of Ghana In AIAEE 2005 Proceedings of the 21st Annual Conference San Antonio Texas
Echeverriacutea R G E J Trigo and D Byerlee 1996 Institutional Change and Effective Financing of Agricultural Research in Latin America World Bank Technical PapersWashington DC World Bank
Eicher C 2001 Africarsquos Unfinished Business Building Sustainable Agricultural Research Systems Department of Agricultural Economics Staff Paper Series 2001-10 East Lansing Michigan State University
________ 2003 Flashback Fifty Years of Donor Aid to African Agriculture Paper presented at the InWEnt IFPRI NEPAD and CTA Conference ldquoSuccesses in African Agriculturerdquo Pretoria South Africa December 1ndash3
________ 2004 Rebuilding Africarsquos Scientific Capacity in Food and Agriculture Department of Agricultural Economics Staff Paper 2004-12 East Lansing Michigan State University
Fan S 2002 Agricultural Research and Urban Poverty in India Environment and Production Technology Division Discussion Paper No 94 Washington DC International Food Policy Research Institute
Fan S C Fang and X Zhang 2001 How Agricultural Research Affects Urban Poverty in Developing Countries The Case of China Environment and Production Technology Division Discussion Paper No 83 Washington DC International Food Policy Research Institute
36
Fan S B Omilola and M Lambert 2009 Public Spending for Agriculture in Africa Trends and Composition ReSAKSS Working Paper No 28 Washington DC Regional Strategic Analysis and Knowledge Support System (ReSAKSS) International Food Policy Research Institute
FAO (Food and Agriculture Organization of the United Nations) 2002 Impact of Foreign Assistance on Institutional Development of National agricuLtural Systems in Sub-Saharan Africa FAO Research and Technology Paper 10 Rome
FAOndashDFIDndashODI (Food and Agriculture Organization of the United Nations Department for International Development and Overseas Development Institute) 2002 The Strategic Role of Information in Support of Sustainable Livelihoods Country Report ndash Ghana lthttpwwwodiorgukrapidProjectsR0093 Final_ReportsGhanapdfgt accessed September 30 2011
Flaherty K G O Essegbey and R Asare 2010 Ghana Recent Developments in Agricultural Research ASTI Country Note Washington DC International Food Policy Research Institute
Flaherty K G Ayoola J Ogbodo and N Beintema 2010 Nigeria Recent Developments in Agricultural Research ASTI Country Note Washington DC International Food Policy Research Institute
Gabre-Madhin E and S Haggblade 2003 Successes in African Agriculture Results of an Expert SurveyMarkets and Structural Studies Division Discussion Paper No 53 Washington DC International Food Policy Research Institute
Goldsmith A A 1993 Institutional Development in National Agricultural Research Issues for Impact Assessment Public Administration and Development 13 (3) 195ndash204
Gregory B T S G Harris A A Armenakis and C L Shook 2009 Organizational Culture and Effectiveness A Studyof Values Attitudes and Organizational Outcomes Journal of Business Research 62 (7) 673ndash679
Hall A L Mytleka and B Oyeyinka 2006 Concepts and Guidelines for Diagnostic Assessments of Agricultural Innovation Capacity UNU-MERIT Working Paper Series Maastricht The Netherlands United Nations University
Hall A V R Sulaiman N Clark and B Yoganand 2003 From Measuring Impact to Learning Institutional Lessons An Innovations Systems Perspective on Improving the Management of International Agricultural Research Agricultural Systems 78 (2) 213ndash242
Hall A N Clark R Sulaiman M V K Sivamohan and B Yoganand 2000 New Agenda for Agricultural Research in Developing Countries Policy Analysis and Institutional Implications Knowledge Technology and Policy (spring) 69ndash91
Hall A G Bockett S Taylor M V K Sivamohan and N Clark 2001 Why Research Partnerships Really Matter Innovation Theory Institutional Arrangements and Implications for Developing New Technology for the Poor World Development 29 (5) 783ndash797
Hazell P 2010 An Assessment of the Impact of Agricultural Research in South Asia since the Green Revolution Chapter 68 in Handbook of Agricultural Economics 4 Amsterdam North Holland
Heemskerk W N Lema D Guindo C Shouten Z Semgalawe H Verkuijl B de Steenhuijsen Piters and P Penninkhoff 2003 A Guide to Demand-Driven Agricultural Research The Client-Oriented Research Management Approach Rural Service Delivery for Agricultural Development Amsterdam Royal Tropical Institute
Heisey P and K Fuglie 2007 Economic Returns to Public Agricultural Research USDA-ERS Economic Brief No 10 Washington DC United States Department of Agriculture Economic Research Service
Henri J 2006 Organizational Culture and Performance Measurement Systems Accounting Organizations and Society 31 77ndash103
Henry G T and M M Mark 2003 Beyond Use Understanding Evaluationrsquos Influence on Attitudes and Actions American Journal of Evaluation 24 (3) 293ndash314
37
Horton D and R Mackay 2003a Special Issue Learning for the Future Innovative Approaches for Evaluating Agricultural Research and Development Agricultural Systems 78 119ndash336
________ 2003b Using Evaluation to Enhance Institutional Learning and Change Recent Experiences with Agricultural Research and Development Agricultural Systems 78 127ndash142
Horton D R Mackay A Andersen and L Dupleich 2000 Evaluating Capacity Development in Planning Monitoring and Evaluation A Case from Agricultural Research ISNAR Research Report 17 The Hague International Service for National Agricultural Research
IAC (InterAcademy Council) 2004 Realizing the Promise and Potential of African Agriculture Amsterdam InterAcademy Council
IAEG (Impact Assessment and Evaluation Group) 2001 Impact Assessment of Agricultural Research Context and State of the Art In The Future of Impact Assessment in the CGIAR Needs Constraints and Options Technical Advisory Committee Secretariat ed Proceedings of a workshop organized by the Standing Panel on Impact Assessment of the Technical Advisory Committee May 3ndash5 2000 Rome Technical Advisory Committee of the Consultative Group on International Agricultural Research
Jones M 2009 Key Challenges for Technology Development and Agricultural Research in Africa Institute of Development Studies Bulletin 36 (2) 46ndash51
Lynam JK and M J Blackie 1994 Building Effective Agricultural Research Capacity The African Challenge In Agricultural Technology Policy Issues or the International Community J R Anderson ed Wallingford UK CAB International
Manning N R Mukherjee and O Gokcekus2000 Public Officials and Their Institutional Environment An Analytical Model for Assessing the Impact of Institutional Change on Public Sector Performance World Bank Policy Research Working Paper 2427 Washington DC World Bank
Maredia M R Bernsten and C Ragasa 2010 Returns to Public Sector Plant Breeding in the Presence of Spill-Ins and Private Goods The Case of Bean Research in Michigan Agricultural Economics 41 425ndash442
Marshall J and A McLean 1988 Reflection in Action Exploring Organizational Culture In Human Inquiry in Action P Reason edLondon Sage Publications
Obirih-Opareh N GO Essegbey and G Frempong 2008 Agricultural Innovations Technological Inputs for Enhancing Agricultural Productions in Ghana STEPRI Accra
Omilola B and M Lambert 2010 Weathering the Storm Agricultural Development Investment and Poverty in Africa Following the Recent Food Price Crisis IFPRI Discussion Paper No 965 Washington DC International Food Policy Research Institute
Pardey P G J Roseboom J and N M Beintema 1997 Investments in African Agricultural Research World Development 25 (3) 409ndash423
Peterson W G Gijsbers and M Wilks 2003 An Organizational Performance Assessment System for Agricultural Research Organizations Concepts Methods and ProceduresISNAR Research Management Guidelines No 7 The Hague International Service for National Agricultural Research
Ragasa C 2011a Factors Affecting Researchersrsquo Productivity Multilevel and Comparative Analysis of Nigeria and Ghana Agricultural Research Organizations Paper presented at the IFPRI conference ldquoIncreasing Agricultural Productivity and Enhancing Food Security in Africa New Challenges and Opportunitiesrdquo November 1ndash4 Addis Ababa Ethiopia
Ragasa C 2011b Are ResearchndashExtensionndashLinkage Committees Effective and Inclusive Perspectives of Agricultural Researchers and Extension Agents in Ghana and Nigeria Paper presented at the International Conference ldquoInnovations in Extension and Advisory Servicesrdquo November 15ndash18 Nairobi Kenya
Ragasa C and G Essegbey 2011 Assessment of Capacity Incentives and Performance of Agricultural Research Organizations in Ghana Draft paper International Food Policy Research Institute Washington DC
38
Ragasa C S C Babu A S Adbullahi and B Y Abubakar 2010 Strengthening Innovation Capacity of Nigerian Agricultural Research Organizations IFPRI Discussion Paper No 1050 Washington DC International Food Policy Research Institute
Raina R 2003 Institutions and Organizations Enabling Reforms in Indian Agricultural Research and Policy International Journal of Technology Management and Sustainable Development 2 (2) 97ndash116
Ramanujam R and D M Rousseau 2006 Editorial Organizational Behavior in Healthcare The Challenges Are Organizational Not Just Clinical Journal of Organizational Behavior 27 (7) 809
Quinn R E 1988 Beyond Rational Management Mastering the Paradoxes and Competing Demands of High Performance San Francisco Jossey-Bass
Quinn R E and J Rohrbaugh 1983 A Spatial Model of Effectiveness Criteria Towards a Competing Values Approach to Organizational Analysis Management Science 29 363ndash377
Quinn R E and G M Spreitzer 1991 The Psychometrics of the Competing Values Culture Instrument and an Analysis of the Impact of Organizational Culture on Quality of Life Research in Organizational Change and Development 5 115ndash142 Greenwich CT JAI Press
Smith D R and A J Sutherland 2002 Institutionalizing Impact Orientation Building a Performance Management Approach that Enhances the Impact Orientation of Research Organizations Chatham UK Natural Resources Institute
Spielman D and R Birner 2008 How Innovative Is Your Agriculture Using Innovation Indicators and Benchmarks To Strengthen National Agricultural Innovation Systems World Bank Agriculture and Rural Development Discussion Paper 41 Washington DC World Bank
Spielman D and D Kelemework 2009 Measuring Agricultural Innovation System Properties and Performance Illustrations from Ethiopia and Vietnam IFPRI Discussion Paper No 851 Washington DC International Food Policy Research Institute
Spielman D C Ragasa and R Rajalahti 2012 Designing Agricultural Research Linkages within an Agricultural Innovation Systems FrameworkIn Agricultural Innovation Systems Sourcebook Washington DC World Bank (forthcoming)
Thirtle C L Lin and J Piesse 2003 The Impact of Research-Led Agricultural Productivity Growth on Poverty Reduction in Africa Asia and Latin America World Development 31 (12) 1959ndash1975
Walker T M Maredia T Kelley R La Rovere D Templeton G Thiele and B Douthwaite 2008 Strategic Guidance for Ex Post Impact Assessment of Agricultural Research Report prepared for the Standing Panel on Impact Assessment Consultative Group on International Agricultural ResearchScience Council Rome CGIAR Science Council Secretariat
World Bank 2001 Performance Audit Reports and Sectoral Overview Ghana National Agricultural Research Project (Credit 2247 - GH) National Agricultural Extension Project (Credit 2346 - GH) National Livestock Services Project (CREDIT 2441 - GH) Agricultural Diversification Project (Credit 2180 - GH) Agricultural Sector Investment Project (Credit 2555 - GH) World Bank Washington DC
________ 2007 Enhancing Agricultural Innovation How To Go Beyond the Strengthening of Research Systems Washington DC
________ 2011 Agricultural Innovation Systems Sourcebook Washington DC
Yawson R and A Sutherland 2010 Institutionalising Performance Management in RampD Organisations Key Concepts and Aspects Journal of Social Science 22 (3) 163ndash172
Yawson R W Amoa-Awua A Sutherland D Smith and S Noamesi 2006 Developing a Performance Measurement Framework to Enhance the Impact Orientation of the Food Research Institute Ghana RampD Management 36 (2) 161ndash172
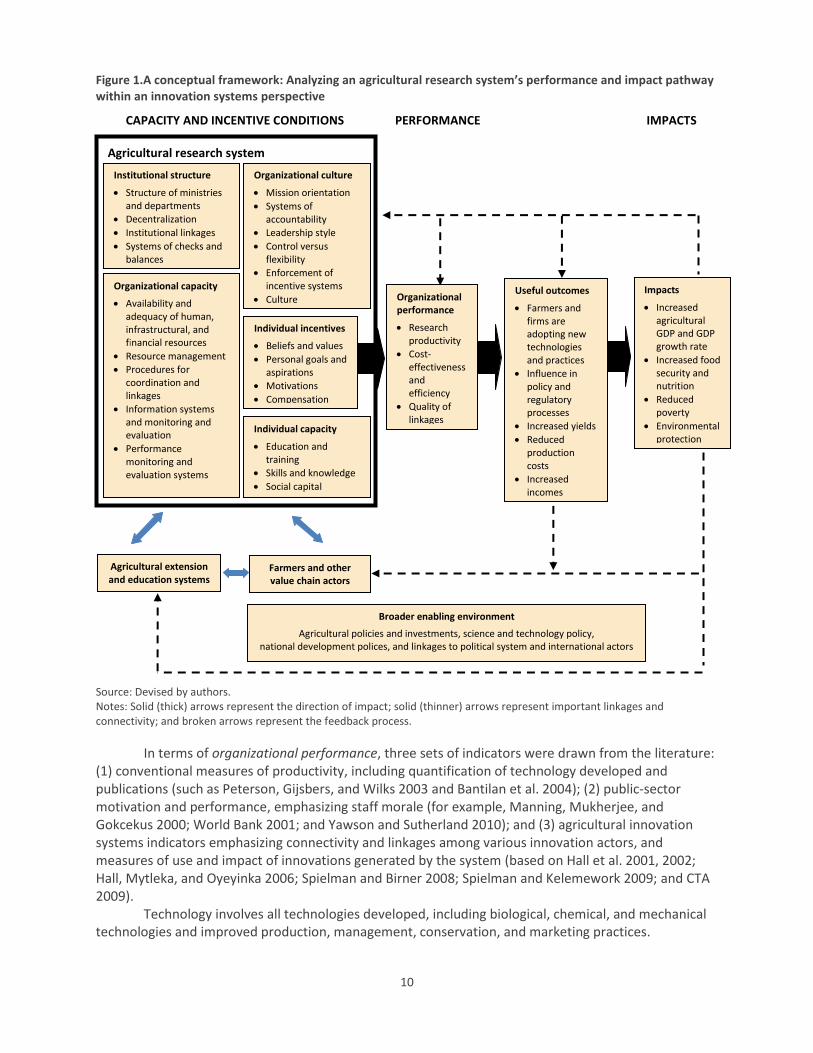