measuring rail seat pressure distribution with...
TRANSCRIPT

Measuring Concrete Crosstie Rail Seat
Pressure Distribution with Matrix
Based Tactile Surface Sensors
Christopher T. Rapp, Marcus S. Dersch, J. Riley Edwards
2012 Joint Rail Conference
Philadelphia, PA
17-19 April 2012

Measuring Rail Seat Pressure Distribution with MBTSS Slide 2
Outline
• Pulsating Load Testing Machine (PLTM)
• Current Objective and Roles of MBTSS
• Sensor Layout and Data Representation
• Experimentation at UIUC
– Pad Modulus Test
– Fastening Clip Test
• Conclusions from Testing
• Future Work with MBTSS
• Questions / Comments
Measuring Rail Seat Pressure Distribution with MBTSS Slide 3
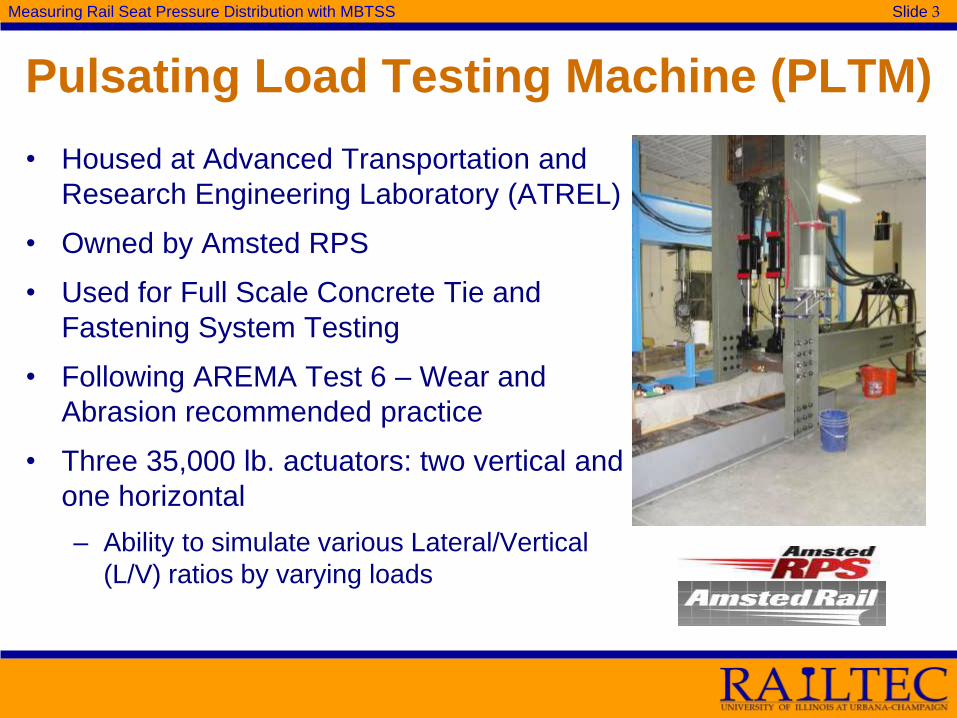
Pulsating Load Testing Machine (PLTM)
• Housed at Advanced Transportation and
Research Engineering Laboratory (ATREL)
• Owned by Amsted RPS
• Used for Full Scale Concrete Tie and
Fastening System Testing
• Following AREMA Test 6 – Wear and
Abrasion recommended practice
• Three 35,000 lb. actuators: two vertical and
one horizontal
– Ability to simulate various Lateral/Vertical
(L/V) ratios by varying loads
Measuring Rail Seat Pressure Distribution with MBTSS Slide 4
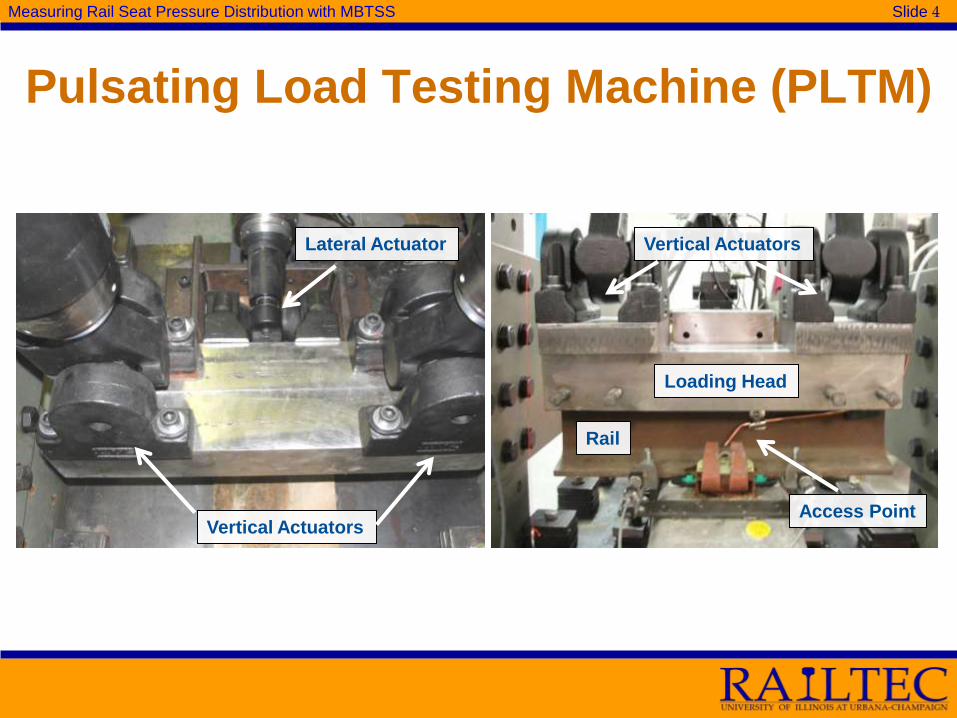
Pulsating Load Testing Machine (PLTM)
Vertical Actuators
Lateral Actuator
Loading Head
Access Point
Rail
Vertical Actuators

Measuring Rail Seat Pressure Distribution with MBTSS Slide 5
Current Objectives of Experimentation
with MBTSS • Research co-sponsored by Amsted RPS and Federal Railway
Administration as part of a larger research program on
concrete crossties and fastening systems
• Measure magnitude and distribution of pressure at the
rail seat
• Gain better understanding of how load from wheel/rail contact
is transferred to rail seat
• Compare pressure distribution to rail seats in various
loading scenarios
• Compare pressure distribution of various fastening systems
• Identify regions of high pressures and quantify peak values
Measuring Rail Seat Pressure Distribution with MBTSS Slide 6
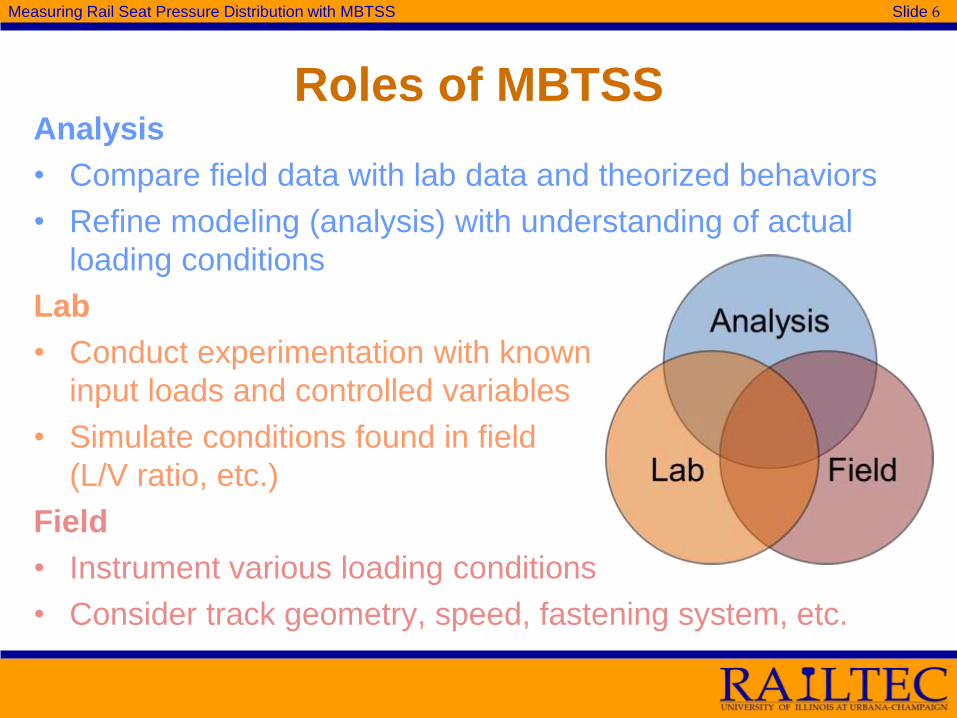
Roles of MBTSS Analysis
• Compare field data with lab data and theorized behaviors
• Refine modeling (analysis) with understanding of actual
loading conditions
Lab
• Conduct experimentation with known
input loads and controlled variables
• Simulate conditions found in field
(L/V ratio, etc.)
Field
• Instrument various loading conditions
• Consider track geometry, speed, fastening system, etc.
Measuring Rail Seat Pressure Distribution with MBTSS Slide 7
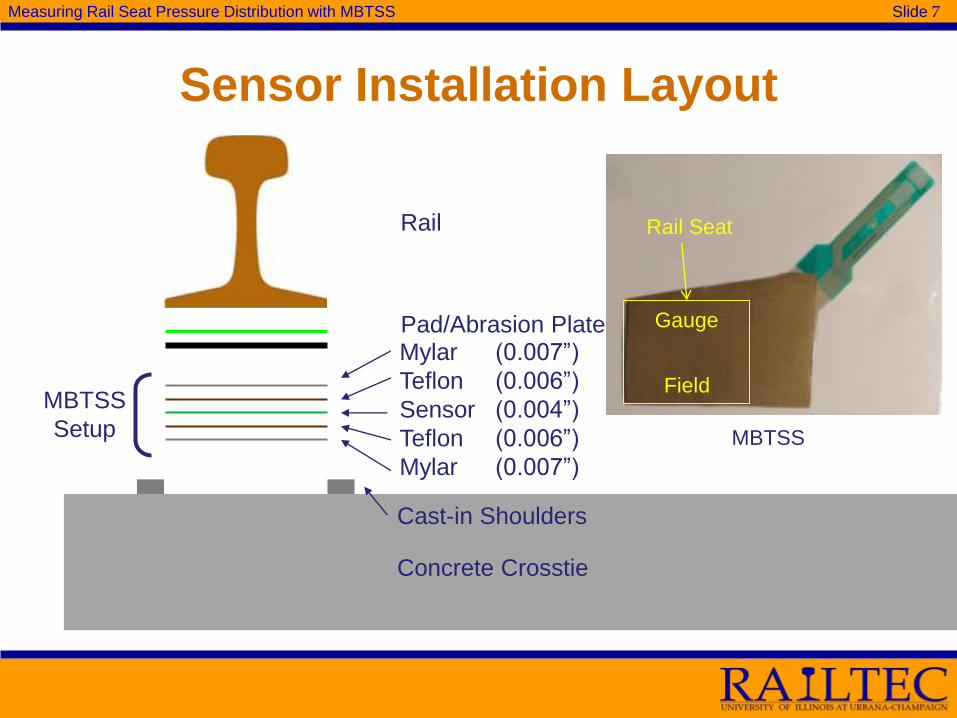
Rail
Concrete Crosstie
Sensor Installation Layout
Mylar (0.007”)
Teflon (0.006”)
Sensor (0.004”)
Teflon (0.006”)
Mylar (0.007”)
Concrete Crosstie
Cast-in Shoulders
MBTSS
Setup
Field
Gauge
MBTSS
Rail Seat
Pad/Abrasion Plate

Measuring Rail Seat Pressure Distribution with MBTSS Slide 8
Visual Representation of Data • Data visually displayed as color 2D or 3D images
• Calculate force and pressure at each sensing point
• Set standard color scale to apply to all data for better comparison
Sample MBTSS output
FIE
LD
GA
UG
E

Measuring Rail Seat Pressure Distribution with MBTSS Slide 9
FIE
LD
GA
UG
E
0.22”
0.2
2”
Area = 0.0484 in2
Measuring Rail Seat Pressure Distribution with MBTSS Slide 10
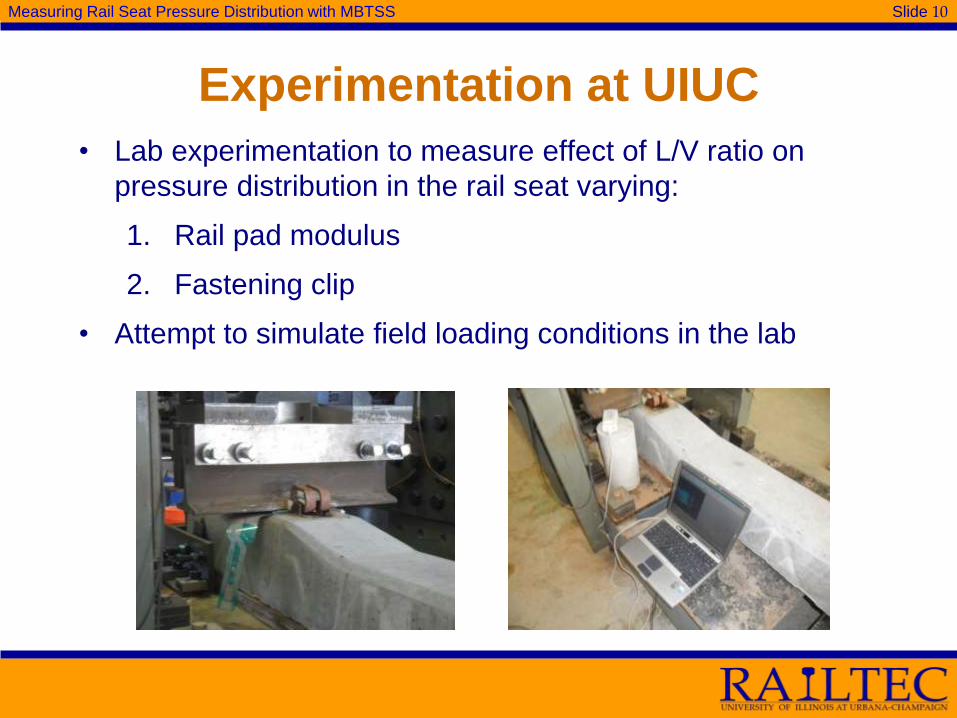
Experimentation at UIUC
• Lab experimentation to measure effect of L/V ratio on
pressure distribution in the rail seat varying:
1. Rail pad modulus
2. Fastening clip
• Attempt to simulate field loading conditions in the lab

Measuring Rail Seat Pressure Distribution with MBTSS Slide 11
Rail Pad Test • Objective: bound the experiment by using low
and high modulus pads
• Two rail pad types with same dimensions
and geometry
– Santoprene™ (Low Modulus)
– High-Density Polyethylene (HDPE –
High Modulus)
• Concrete rail seat and fastening system
held constant
• Identical loading conditions
– 32.5 kip vertical load
– Lateral load varies based on respective
L/V ratio
Santoprene
HDPE

Measuring Rail Seat Pressure Distribution with MBTSS Slide 12
Rail Pad Test Results
HDPE
Santoprene™
Contact Area (in2) 20.1 19.3 19.1 19.0 18.6 17.8
% of Rail Seat 59 57 56 56 55 52
Peak Pressure
(psi) 3,213 3,469 3,546 3,721 3,838 4,096
Contact Area (in2) 28.8 27.9 27.3 25.8 24.0 21.3
% of Rail Seat 85 82 80 76 71 63
Peak Pressure
(psi) 2,139 2,573 2,800 2,925 3,162 3,400
L/V Ratio 0.25 0.44 0.48 0.52 0.56 0.60
FIELD GAUGE
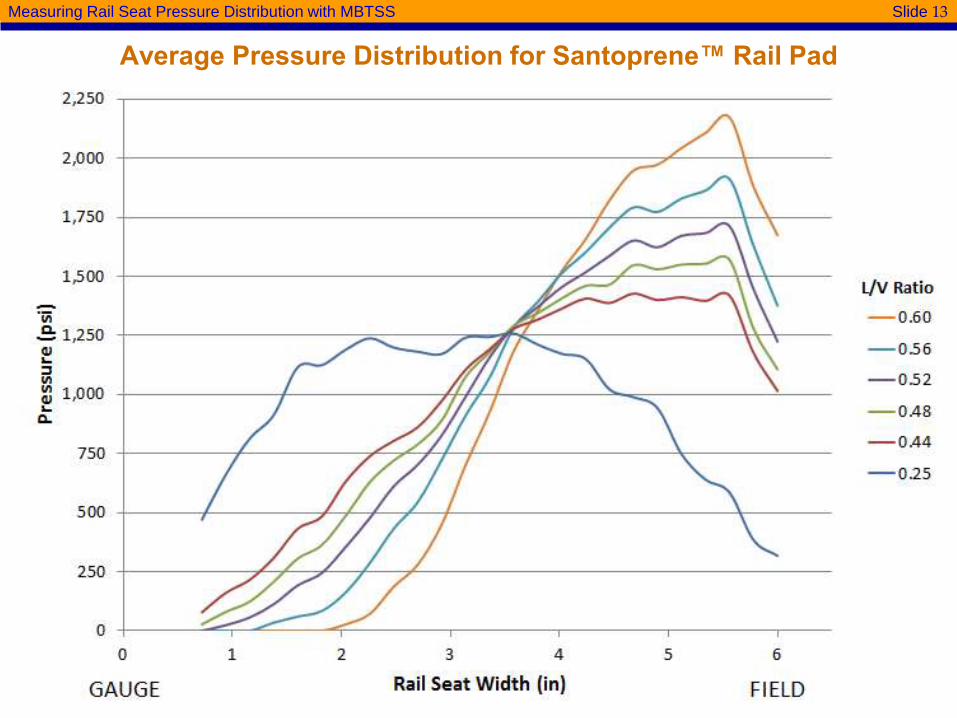
Measuring Rail Seat Pressure Distribution with MBTSS Slide 13
Average Pressure Distribution for Santoprene™ Rail Pad
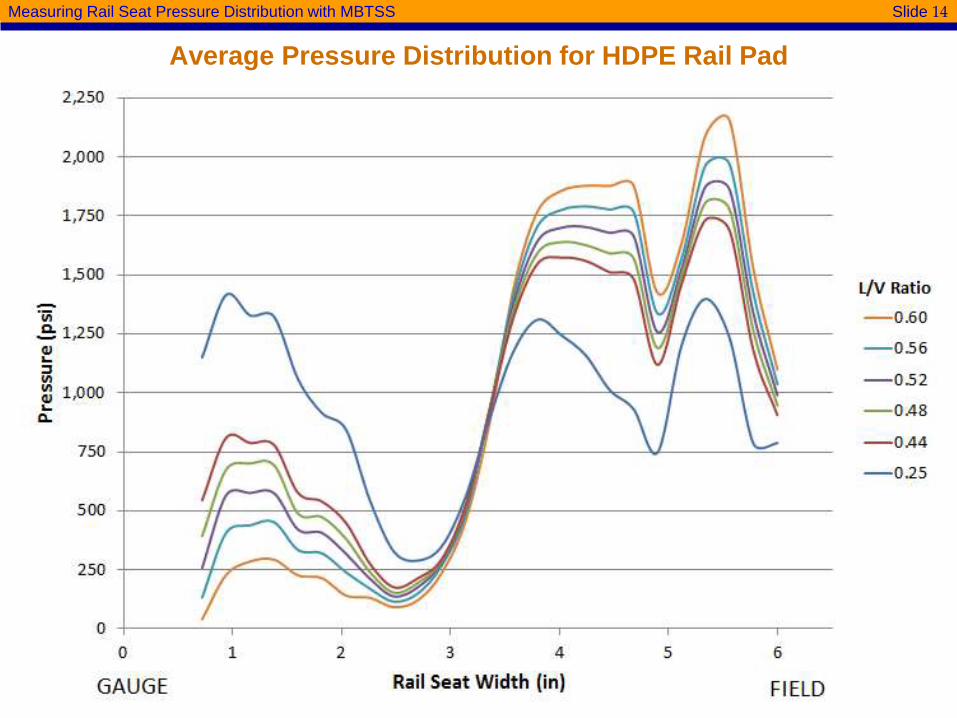
Measuring Rail Seat Pressure Distribution with MBTSS Slide 14
Average Pressure Distribution for HDPE Rail Pad
Measuring Rail Seat Pressure Distribution with MBTSS Slide 15
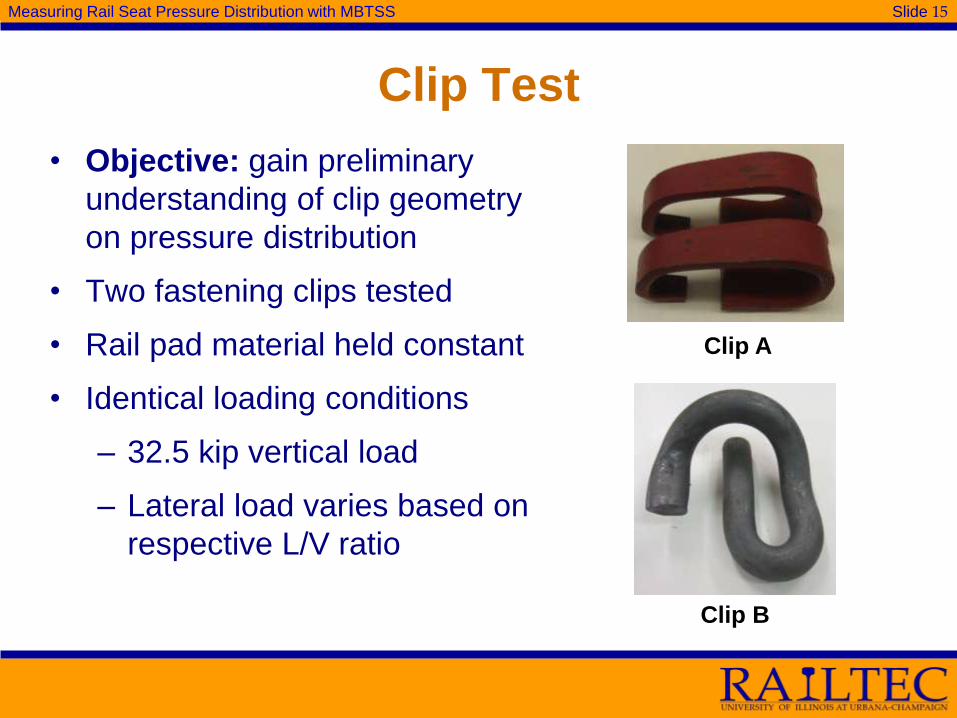
Clip Test
• Objective: gain preliminary
understanding of clip geometry
on pressure distribution
• Two fastening clips tested
• Rail pad material held constant
• Identical loading conditions
– 32.5 kip vertical load
– Lateral load varies based on
respective L/V ratio
Clip B
Clip A

Measuring Rail Seat Pressure Distribution with MBTSS Slide 16
Clip Test Results
Clip B
Clip A Contact Area (in2) 28.4 26.6 23.6 16.6
% of Rail Seat 84 78 70 49
Peak Pressure (psi) 2,188 2,327 2,872 3,809
Contact Area (in2) 27.6 24.5 21.0 17.2
% of Rail Seat 81 72 62 51
Peak Pressure (psi) 2,744 3,067 3,385 4,083
L/V Ratio 0.25 0.44 0.52 0.60
FIELD GAUGE
Measuring Rail Seat Pressure Distribution with MBTSS Slide 17
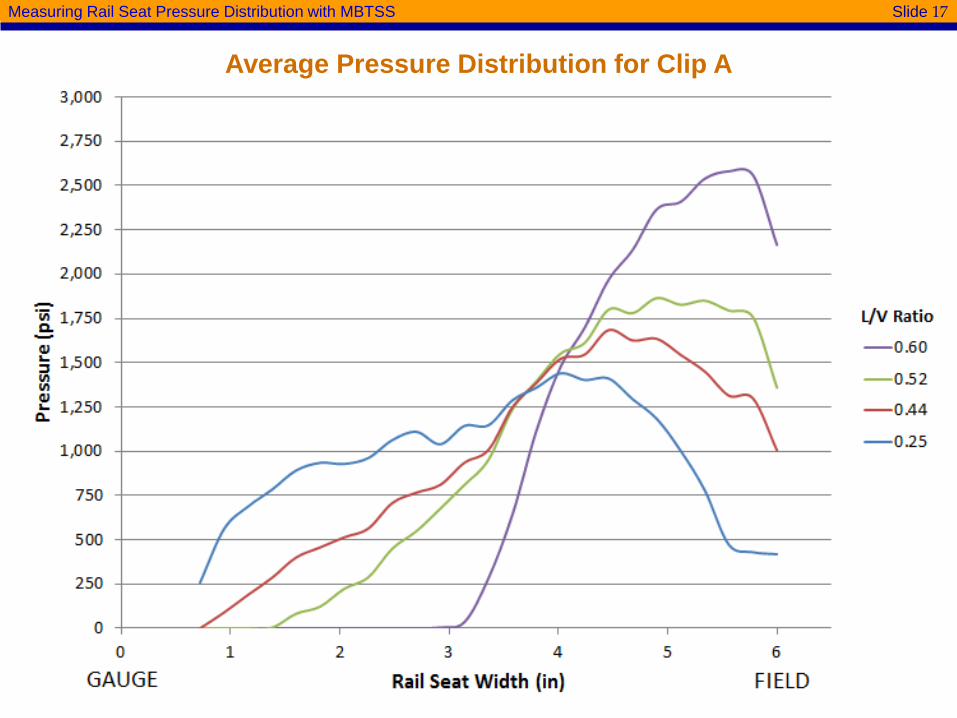
Average Pressure Distribution for Clip A

Measuring Rail Seat Pressure Distribution with MBTSS Slide 18
Average Pressure Distribution for Clip B

Measuring Rail Seat Pressure Distribution with MBTSS Slide 19
Conclusions from Testing • L/V Ratio
– A lower L/V ratio of the resultant wheel load distributes the
pressure over a larger contact area
– A higher L/V ratio of the resultant wheel load causes a
concentration of pressure on the field side of the rail seat,
resulting in higher peak pressures
• Pad Modulus
– Lower modulus rail pads distribute rail seat loads over a larger
contact area, reducing peak pressure values and mitigating
highly concentrated loads at this interface
– Higher modulus rail pads distribute rail seat loads in more highly
concentrated areas, possibly leading to localized crushing of the
concrete surface
Measuring Rail Seat Pressure Distribution with MBTSS Slide 20
Conclusions from Testing (cont.)
• Fastening Clip
– Design of the clip component of the fastening system
affects the shape of the pressure distribution on the
rail seat
– Minimal differences in peak pressures and contact
areas of pressure distribution between the two clips
tested

Measuring Rail Seat Pressure Distribution with MBTSS Slide 21
Future Work with MBTSS
• Field testing at TTC in Pueblo, CO to understand pressure
distribution varying:
– Degree of curvature
– Fastening system design
– Train speeds
• Perform field testing at Monticello Railway Museum in Monticello, IL on
section of concrete crosstie track
• Instrument high and low rail seats of a crosstie to compare varying
track geometries
• Continue pad modulus testing within bounded experiments
• Continue testing various fastening systems

Measuring Rail Seat Pressure Distribution with MBTSS Slide 22
Acknowledgements
• Funding for this research has been provided by the Federal Railway
Administration (FRA)
• Industry Partnership and support has been provided by
– Union Pacific (UP) Railroad
– BNSF Railway
– National Railway Passenger Corporation (Amtrak)
– Amsted RPS / Amsted Rail, Inc.
– GIC Ingeniería y Construcción
– Hanson Professional Services, Inc.
– CXT Concrete Ties, Inc., LB Foster Company
• Marc Killion and Timothy Prunkard – UIUC
• Professor Jerry Rose and graduate students – University of Kentucky
• AAR/TTC – Dave Davis, for assisting in field tests
FRA Tie and Fastener BAA
Industry Partners:
Measuring Rail Seat Pressure Distribution with MBTSS Slide 23
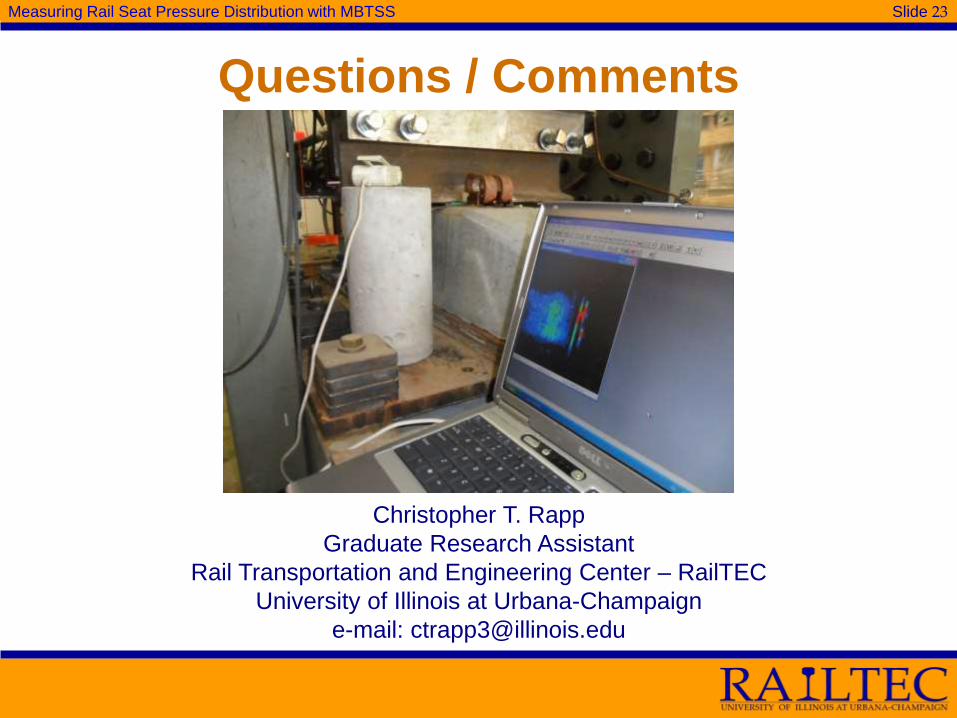
Questions / Comments
Christopher T. Rapp
Graduate Research Assistant
Rail Transportation and Engineering Center – RailTEC
University of Illinois at Urbana-Champaign
e-mail: [email protected]