measuring media influence on u.s. state courts
TRANSCRIPT

Measuring Media Influence on U.S. State Courts∗
Claire S.H. Lim†
Stanford UniversityJames M. Snyder, Jr.‡
MITDavid Stromberg§
Stockholm University
July 13, 2010
Abstract
Media coverage has been one of the main channels through which voters acquire informa-tion about public officials’ behavior in modern democracy. In this research, we investigate theinfluence of newspaper coverage oncourts, the branch of government that is often regarded asthe most insulated from public opinions. Specifically, we focus on the influence of newspapercoverage on criminal sentencing decisions in U.S. state trial courts. We pose three questionsthat are essential to understanding the relationship between media and court decisions: (1)how often do newspapers convey information about judges to voters?; (2) does the likelihoodof press coverage affect harshness of sentencing decisions?; and (3) does media influence oncourt decisions depend on the mechanisms through which judges are selected?
To address these questions, we use anewly collected data seton the frequency of newspa-per coverage of approximately 10,000 state trial court judges from 45 states. In addition, weconstruct a proxy measure of active media coverage – the degree of overlap (“congruence”)between judicial districts and circulation areas of newspapers – for more than 1,000 judicialdistricts in the nation, in order to address the endogeneityof press coverage.
First, we find that there are on average 80-90 newspaper articles about judges in a district inthe trial court per year and newspaper. Second, active mediacoverage does not influence courtdecisions independently of voter preferences, but it substantially magnifies the influence ofvoter preferences on court decisions. Third, media influence on court decisions depends verymuch on judicial selection mechanisms. Active newspaper coverage significantly magnifiesthe influence of voters’ preferences on court deicisions only when judges are elected.
Keywords: Court, Media, Sentencing, Crime, Appointment, Election,Voter Information
JEL Classification: H1, H7, K4, L8
∗We thank seminar participants at UC-Berkeley, Northwestern-Kellogg School, Stanford GSB, U.Illinois, U.Chicago Harris School, and conference participants at the ASSA annual meeting 2010, CIPREE Political EconomyWorkshop, Erasmus Political Economy Workshop for their suggestions and comments. We also thank ChristopherStanton for excellent research assistance.
†Graduate School of Business, Stanford University. e-mail:[email protected]‡Department of Political Science and Economics, MIT. e-mail: [email protected]§IIES, Stockholm University. e-mail: [email protected]
1

1 Introduction
Media coverage has been one of the main channels through which voters acquire information
about public officials’ behavior in modern democracy. In this study, we investigate the influence
of newspaper coverage oncourts, the branch of government that is often regarded as the most
insulated from public opinions. Specifically, we focus on the influence of newspaper coverage on
criminal sentencing decisions inU.S. state trial courts.
There are several reasons why U.S. state courts is an important context for analyzing media
influence. First, they play an important role in the Americansociety. State courts deal with more
than 90 percent of civil and felony cases in the U.S. In 2006, state courts handled 21.6 million
felony cases and 17.3 million civil cases. In 2005, state courts spent 17.7 billion dollars while
federal courts spent 10.8 billion dollars. Second, the set of tasks handled by state trial court judges
is quite homogenous across states. Therefore, their decisions serve as a good measure of “behavior
of public officials” in analyzing government accountability. Third, judiciary is often regarded
to be highly insulated from public opinions compared with other branches of the government.
Estimating the effect of media on judiciary can give us a goodunderstanding of the potential
“lower bound” of the overall media influence on governments.Fourth, there is an interesting
variation in the mechanisms by which state court judges are selected: in many states, judges are
initially appointed by the governor or the legislature, andthen either get life-tenured or face a
non-competitive approval (yes-or-no) vote by voters for subsequent terms; in other states, judges
are selected and retained through competitive elections. Analyzing media influence on state courts
provides us with a unique opportunity to understand the interaction between selection systems of
public officials and voter information.
We address three questions that are essential to understanding the relationship between media
and court decisions: (1) how often do newspapers convey information about judges to voters?; (2)
does the likelihood of press coverage affect harshness of sentencing decisions?; and (3) does media
influence on court decisions depend on the mechanisms through which judges are selected?
To capture a factor that causes newspaper coverage of courtsto vary across jurisdictions, we
construct a measure,congruence(a la Snyder and Stromberg (2010)), which captures the degree of
a fit between judicial districts and local newspaper markets. The basic premise behind the usage of
congruence measure, which is empirically validated in our analysis, is that newspapers cover more
stories about court cases in a jurisdiction (trial court district) when a large share of readers reside
in the jurisdiction. That is, if a jurisdiction constitutesa large share of readers of the newspapers
sold in it, voters can get more information about court casesin that jurisdiction, compared with
2

those who live in a jurisdiction that does not.
In order to document the amount of press coverage about judges and to ensure that our congru-
ence measure captures significant variation in press coverage, we use anewly collected data set
on thefrequency of newspaper coverageof approximately 10,000 state trial court judges in the na-
tion. We also construct thecongruence measurefor more than 1,000 judicial districts in 45 states,
combining a newly collected data on the composition of judicial districts and the county-level
newspaper circulation data from the Audit Bureau of Circulation. In the main analysis, we build
an empirical linkage between congruence and harshness of criminal sentencing, using a detailed
data set on 2.5 million sentencing decisions from the National Judicial Reporting Program.
Our result shows that there are on average 80-90 newspaper articles that mention state trial
court judges’ name, per district, newspaper and year. We also find a salient positive relationship
between the congruence measure and the amount of newspaper coverage on state trial court judges.
In addition, we compare the amount of press coverage for appointed and elected judges, and we
find that selection mechanisms of judges do not significantlyaffect the amount of press coverage.
Secondly, we find a substantial media influence on court decisions. Specifically, we find that
press coverage doesnot influence sentencing decisionsindependently of voter preferences. But,
it magnifies the effect of voters preferenceson criminal sentencing decisions by about two-folds.
Additionally, this effect is present mainly in violent crime cases, and it is insignificant in property
crime cases or drug cases.
Lastly, media influence on court decisions is very dependenton the mechanisms by which
judges are selected. Specifically, we find that the degree of media influence on criminal sentencing
decisions is substantially larger when judges are elected.
The remainder of this paper is organized as follows. In the next section, we introduce the
political economy literature on media and the literature onU.S. state courts. In Section 3, we
introduce the institutional background of the U.S. state court system. In Section 4, we introduce
our congruence measure and document its major feature in ourdata. In Section 5, we describe
our data on the amount of press coverage on judges, and we document the relationship between
congruence/reader-share and the amount of coverage. In Section 6, we discuss the measure that we
use for voter preferences for crime and punishment. In Section 7, we document the main results.
3

2 Related Literature
Our study contributes to the growing political economy literature on the impact of media on public
policy outcomes. Recently, there has been significant research about media impact on government
spending such as studies by Stromberg (2004) and Besley andBurgess (2002). While the focus of
this stream of research has been on media penetration, we focus on the likelihood of press coverage
holding media penetration constant. In this sense, our research is an extension of Snyder and
Stromberg (2010). There has also been evidence on media influence on elections, e.g., DellaVigna
and Kaplan (2007) and Gentzkow (2006). We contribute to the literature by documenting the
interaction between political process, specifically selection mechanisms and media.
This study also contributes to the growing literature of comparing the behavior of non-elected
and elected public officials. Recent studies by Alesina and Tabellini (2007, 2008) theoretically
analyze what types of policy tasks are better performed by non-elected bureaucrats as opposed to
elected politicians, focusing on the reelection concerns of politicians vs. the career concerns of
bureaucrats. In another important paper, Besley and Coate (2003) compare policy outcomes from
appointment and election as selection procedures. Specifically, they show that selecting regulators
through election as opposed to appointment leads to issue-unbundling and leads to selecting the
types of regulators who will conform to voter preferences. There have also been numerous efforts
to document the politico-economic causes and consequencesof different judicial selection mech-
anisms, such as Hanssen (2004a, 2004b), Hall (2001), Besleyand Payne (2003), Bohn and Inman
(1996). Several studies in this stream of research documentthe empirical relationship between the
selection mechanisms and court decisions, e.g, Lim (2008),Huber and Gordon (2004, 2007), Gel-
man et al. (2004), Blume and Eisenberg (1999), Tabarrok and Helland (1999). Our study deepens
understanding of this issue further by providing empiricalevidence on the role of voter informa-
tion in the mechanism through which the difference between appointed and elected public officials
behavior is generated.
3 Institutional Background of the State Court System
In this section, we introduce basic institutional backgrounds of the U.S. state court system. In most
states, state court system has three layers: state supreme court, state appellate court, and state trial
court. State trial courts are often called district court, circuit court, or superior court.
State trial courts are courts of general jurisdiction: theyhave original jurisdiction over civil
cases with non-trivial amount in dispute and felony crime cases. That is, civil cases with nontrivial
4

amount in dispute and felony crime cases are initially filed to trial courts. Traffic cases and misde-
meanor cases are typically handled local courts, usually called county courts or municipal courts,
and they arenot usually by state trial courts.
3.1 Judicial District
In most states, the state trial court is divided to multiple judicial districts. Usually, the geographic
basis of judicial districts is county, in the sense that boundaries of a judicial district do not usually
cut through the boundaries of a county. In most states, a judicial district has multiple judges.
There are approximately 1,700 judicial districts of state trial courts nationwide. As for the
average size of a judicial district, there are 1.8 counties per judicial district and they hold an average
population of just under 170,000. On average there are 9 judges presiding in each district.
We have collected information on the geographic boundariesof these judicial districts from
1982 to 2004. We did not collect data for Alaska, Connecticut, Massachusetts, Texas and Virginia,
where the county is not the primary geographical unit of the judicial districts. In total, we have data
on 1,181 judicial districts. Of the 544 districts for which we do not have geographical information,
452 are in Texas. The procedure we used was to first allocate each county to a court usingThe
American Bench2004-2005 edition. To find out if and when each state’s judicial district lines were
redrawn, we contacted various state officials, typically the director of the administrative office of
the judicial branch. We then used the data in the annual series of The American Benchto track
each such change.
Table 1 on page 6 shows the number of judicial districts and counties in each state by census
regions. There are clear regional patterns in the geographyof the judicial districts. Small states
in New England (e.g., Maine, New Hampshire) tend to have justone judicial district covering the
whole state. States in Pacific region (e.g., California) andMid-Atlantic region (e.g., New Jersey,
Pennsylvania) tend to have one judicial district covering one or two counties. The Southern and
Midwestern states have judicial districts covering multiple (three or four) counties.
We also have data on a number of demographic characteristicsat the court level. These have
been aggregated from the county level, using data from the U.S. Census Bureau. We have this data
for the censuses of 1980, 1990 and 2000.
5

Table 1: Number of Judicial Districts and Counties by State (in 2004)
Region 1 : Northeast Region 2 : MidwestNumber of Number of Number of Number ofState
Judicial Districts Counties State Judicial District CountiesConnecticut 8 8 Illinois 22 102Maine 1 16 Indiana 92 92Massachusetts 62 14 Iowa 8 99New Hampshire 1 10 Kansas 31 105New Jersey 15 21 Michigan 57 83New York 12 62 Minnesota 10 87Pennsylvania 60 67 Missouri 45 115Rhode Island 1 5 Nebraska 12 17Vermont 1 14 North Dakota 7 53
Ohio 88 88South Dakota 7 66Wisconsin 69 72
Region 3: West Region 4: SouthNumber of Number of Number of Number ofState
Judicial Districts CountiesState
Judicial District CountiesAlaska 4 18 Alabama 41 67Arizona 15 15 Arkansas 28 75California 58 58 Delaware 1 3Colorado 22 64 Florida 20 67Hawaii 4 5 Georgia 49 159Idaho 7 44 Kentucky 57 120Montana 22 56 Louisiana 41 64Nevada 9 17 Maryland 8 240New Mexico 13 33 Mississippi 22 82Oregon 27 36 North Carolina 47 100Utah 8 29 Oklahoma 26 77Washington 31 39 South Carolina 16 4Wyoming 9 23 Tennessee 31 95
Texas 424 254Virginia 31 134West Virginia 31 55
6

3.2 Judicial Selection Mechanisms
In this section, we describe the selection mechanisms by which judges are selected and retained
for U.S. state courts. Currently, there are three major selection mechanisms: 1) In ‘merit selection’
system, judges are appointed by the governor. And, when the judges’ term expires, they have to run
for a non-competitive reelection process with approval (yes-or-no) vote for subsequent periods. 2)
In ‘partisan election’ system, judges are selected by usualcompetitive elections. That is, judicial
candidates seek nomination from political parties in primaries, and candidates nominated by parties
compete in general elections. 3) In ‘non-partisan election’ system, multiple candidates compete
without party identification on the ballot, and the top two vote-getters compete against each other
in general elections (i.e., there are runoff elections). There are states that use a system that does not
fall into one of the above three categories. For example, in Illinois, New Mexico, and Pennsylvania,
judges have to run for partisan election for their initial term, and they run for reelection with voters’
approval (yes-or-no) vote for subsequent terms. There are also three states in New England region,
New Hampshire, Rhode Island, and Massachusetts, in which judges are selected by gubernatorial
appointment and life-tenured.
Table 15 and 16 on pages 30 and 31 in the appendix show the full list of judicial selection
mechanisms used by state trial courts.
4 Congruence
In this section, we introduceCongruence, the main variable we use to capture active media cover-
age on judges. Conceptually, congruence of a judicial district is aweighted average reader share
that the judicial district has for newspapers sold in the district, where the weight is themarket share
of a newspaper in the district.
Consider a judicial district,d, with N judges. Letqmd j be the number of stories newspaper
m prints about each judgej, and letqmd = (1/N)∑ j qmd j be the average number of stories that
newspaperm prints per judge in the district. We relate this to the share of newspaperm’s readers
that lives in districtd, ReaderSharemd. For simplicity, we assume a linear relationship,
qmd = α0 +α1ReaderSharemd. (1)
Most judicial districts have more than one newspaper. Thus,we will often be interested in the
average news coverage across newspapers. We use the sales-weighted average number of stories
7

about a judge in judicial districtd. If there areM papers that sell in districtd,
qd =M
∑m=1
MarketSharemdqmd, (2)
whereMarketSharemd is newspaperm’s share of newspaper sales in districtd. Note that we can
write this as
qd = α0+α1Congruenced, (3)
where
Congruenced =M
∑m=1
MarketSharemdReaderSharemd. (4)
We use variation inCongruenced to identify effects of newspaper coverage of judges on state
courts. Note that sinceCongruenceis defined using market shares, it is not dependent on the total
newspaper penetration in the judicial district. This is important since total newspaper readership
in an area is related to characteristics such as education and income levels.
Figure 1 illustrates cases of high congruence and low congruence. The left panel in the figure
shows a case of perfect match between judicial districts andthe circulation area of newspapers.
The right panel in the figure shows a case of poor match. In the former case (perfect match), court
cases in a judicial district are relevant to all of the readers of the newspaper sold in that district.
Hence, newspapers will cover court cases often. In contrast, in the latter case (poor match), court
cases in a judicial district are relevant to only a small portion of the readers of the newspaper
sold in that district. Therefore, newspapers in low congruence areas cover court cases relatively
infrequently.
Figure 1: Example - High Congruence and Low Congruence
�
���������� � ��������� �
�� ������������������������
�� ������������������������
���� ��������� ��������
8

To measureCongruence, we use county-level newspaper sales data. Each year, the Audit Bureau
of Circulation (ABC) collects data on each newspaper’s circulation in each county, for almost all
U.S. newspapers. We have this data for 1982 and for the period1991-2004. We complemented this
with county-circulation data for non-ABC newspapers for 1991 and 2004, and interpolated values
between those years. The non-ABC data were mainly for smaller papers.1 In our data, the average
number of newspaper copies sold in a year is 56 million. The average number of copies sold per
household is 0.58, falling from around 0.70 in 1982 to 0.50 in2004. For the years 1983-1990 when
we do not have circulation data, we interpolateCongruence.
Figure 2 shows the overall distribution of congruence value, and Figure 3 shows the distribution
of congruence in the nine most populous states. Figure 3 shows that most of large states have
substantial degree of within state variation in congruence. In the main analysis, we will mainly
exploit within state variation in congruence.
02
46
8De
nsity
0 .2 .4 .6 .8 1congruence
Figure 2: Distribution of Congruence (45 states)
5 Newspaper Coverage
In this section, we examine how the number of stories that a newspaper writes about a judge is
related to the fraction of the newspaper’s readers that livein the associated judicial district, the
ReaderShare.1The non-ABC data was provided by SRDS. On average there are about 10,900 observations each year in the ABC
data, and about 500 observations in the non-ABC data. There are about 3,000 counties in the U.S., so the averagenumber of observations per county in each year is slightly less than 4.
9

02
46
80
24
68
02
46
8
0 .5 1 0 .5 1 0 .5 1
CA FL GA
IL MI NC
NY OH PAD
ensi
ty
congruence
Figure 3: Distribution of Congruence in Large States
Our sample of judges consists of 9,828 judges who are state trial court judges in the U.S in
2004 and 2005. Our sample of newspapers consists of all 1,400newspapers for which the articles
published in 2004 and 2005 are searchable through NewsLibrary.com. For each judge in our
sample, and each newspaper with positive sales in the state where the judge presides, we count
the number of articles that appeared in 2004 and 2005. We use the search string{“judge N1” OR
“judge N2”}, where N1 is the judge’s full name including middle initial,and N2 is the judge’s
first and last name only. This yields the frequency of coverage for approximately 1 million judge-
newspaper combinations, and constitutes our measure ofqmd j. Since our key variables vary at the
judicial district level, we aggregate the frequency of coverage to the judicial district-newspaper
level, to makeqmd.
Variable Obs Mean Std. DevArticle Share 15929 0.024 0.116Articles per Judge 18760 1.162 8.518Articles per Judge 1224 9.047 18.597(circulation weighted)Reader Share 18760 0.024 0.133Circulation in Court (1000) 18760 1.442 11.232Total Circulation (1000) 18760 63.423 94.292Congruence 1224 0.227 0.317
Table 2: Summary Statistics of Press Coverage (All Sample)
Summary statistics of the basic data are shown in Table 2. On average, a newspaper in our
sample writes 9 articles about each judge per year. Coveragevaries considerably – the standard
10

deviation in coverage is 19 articles. When we include all thenewspapers sold in a state, the
average reader share is around 2.4 percent. When we include only newspapers sold in the district,
the average reader share of a newspaper in a judicial district is 19 percent (not shown in Table 2).
The average circulation in a district is 14,420.
A few other comments about coverage are worth noting. First,to estimate the degree to which
coverage of judges focuses on especially violent crime, we ran searches that included the search
string {AND (murder* OR rape*)}. In our sample, about 20% of the stories contain the added
string. Thus, while murder and rape are over-represented innewspapers, relative to the share of
criminal acts they represent, they do not dominate the coverage.
Second, to estimate the degree to which coverage of judges focuses on their sentencing behav-
ior, we ran searches that included the search string{AND sentenc*}. About 33% of the stories
contain this added string.
Third, inspection of a sample of 200 articles reveals that stories that are not about sentencing
cover a wide range of topics, including: election campaigns, and candidates’ backgrounds, qualifi-
cations, and endorsements; election results; judicial procedures and reforms; prison overcrowding
and building new prisons and jails; crime rates; laws on the statute of limitations; appellate court
rulings; other judicial decisions such as restraining orders; and articles describing ongoing court
proceedings in particular high-profile cases.
Fourth, based on the stories in theLocal TV News Media Project, there appears to be very
little coverage of local judges on local television news.2 Searching for news stories using the
word “judge” yielded just 12 hits, none of which were about sentencing.3 Searching for the word
“sentence” or “sentenced” or “sentencing” yielded 35 stories about criminal sentencing decisions
or appeals, but none of these mentioned the name of the judge who passed the sentence.
We also analyze whether the amount of newspaper coverage about trial court judges depends
on the selection mechanisms by which judges are selected. Table 3 shows the summary statistics
of the amount of coverage by selection mechanisms. The difference in the amount of newspaper
2TheLocal TV News Media Project, at the University of Delaware, contains a database with over 10,600 individ-ually digitized stories from over 600 broadcasts of 61 stations in 20 local television markets around the country thataired during the spring of 1998.” See http://www.localtvnews.org/index.jsp for more information.
3One these stories was about election judges rather than trial or appellate judges, and one was about a judge’sfuneral, so only 10 stories were actually about judges’ actions or decisions, or judicial elections. Of these, 3 wereabout a judge who was sentenced to jail for fraud, 2 were aboutwhether a candidate met the residency requirements torun for a judicial office (the candidate was not a sitting judge), 1 was about a federal judge’s decision to struck downChicago’s ban on tobacco and alcohol billboards, 1 was abouta state supreme court’s decision that a judge had notviolated a state ethics law but had simply exercised his freespeech, 1 was about a judge’s decision not to quit a trialagainst tobacco companies, 1 was about the dismissal of a complaint against a judge for using a racial slur, and 1 wasa retraction by the station of an error in an earlier broadcast.
11

coverage about judges, between states with elected judges and those with appointed judges, is not
statistically significant.
Elected AppointedVariableObs Mean Std. Dev Obs Mean Std. Dev
Article Share 12118 0.02 0.10 3811 0.04 0.15Articles per Judge 14515 1.12 8.83 4245 1.32 7.33Articles per Judge 916 8.682 18.69 308 10.13 18.31(circulation weighted)Reader Share 14515 0.02 0.12 4245 0.04 0.17Circulation in Court (1000) 14515 1.26 10.66 4245 2.08 12.98Total Circulation (1000) 14515 64.37 96.64 4245 60.18 85.70Congruence 916 0.205 0.305 308 0.294 0.347
Table 3: Summary Statistics of Press Coverage by Selection Mechanism
We now show the relationship between the share of articles written about judges in a judicial
district by a newspaper and theReaderShareof the newspaper in the district. Figure 4 shows
Figure 4: Reader Share and Share of Articles
(unit: judicial district - newspaper)
the basic relationship betweenReaderShareof a judicial district for a newspaper and the share of
articles of a judicial district for a newspaper.4
4To elaborate the definition of the article share, the variable in the y-axis of Figure 4, the denominator is the totalnumber of articles written about state trial court judges bya newspaper, and the numerator is the number of articleswritten about state trial court judges in a particular judicial district by the given newspaper.
12

In the figure, we divide data points to 200 groups based on the value ofReaderShare(x-axis),
and average outReaderShareand the article share of a district within a group. (I.e., each point in
Figure 4 represents 0.5% of the data points.) The figure showsa clear positive relationship between
reader share and share of coverage of judicial districts.
Newspapers with low values ofReaderSharein a given judicial district (values near .01) print
about one article per judge. This number increases to about ten articles per judge for newspapers
with ReaderSharevalues in a district near one – i.e., newspapers whose readers nearly all live in
the given judicial district.
Table 4: Regression of Frequency of Judge-related Coverageon Reader Share (All Sample)
Article Article Articles ArticlesShare Share per Judge per Judge
Share Readers 0.761 0.766 21.296 22.508(0.004)∗∗∗ (0.003)∗∗∗ (0.441)∗∗∗ (0.318)∗∗∗
Controls No Yes No YesObservations 15929 14601 18760 17120R2 0.742 0.808 0.112 0.246
Note: Unit of observation is newspaper by judicial districtin 2004.Standard errors in parentheses;∗∗∗ significant at 1%.
Controls: State-FE, demographic characteristics, political orientation, and crime rates.
Table 4 investigates this relationship more closely, via a set of OLS regressions. In Columns 1
and 2, the dependent variable is theshareof articles from a particular paper that is about judges on
a particular court,qmd/qm. In Column 1, the only independent variable isReaderSharemd. Column
2 adds a number of controls: state-fixed effects, crime ratesfor 9 crime categories, population, per
capita income, average education levels (share with 1-11 years, share with 12 years, and share
with more than 12 years), share black, share urban, area in square miles, employment, turnout in
presidential election, the Democratic vote share in the presidential election, and the share religious
adherents.
The dependent variable in Columns 3 and 4 isqmd, the numberof articles per judge in the
court. Thus, these columns estimate equation (1) on page 7. An increase inReaderSharefrom
zero to one is associated with 21 more articles per judge.
In Table 5, we collapse the data at the judicial district level, and study the overall measure of the
circulation-weighted average newspapers articles about judges in each court,qd. These columns
estimate equation (3) on page 8. An increase inCongruencefrom zero to one is associated with an
13
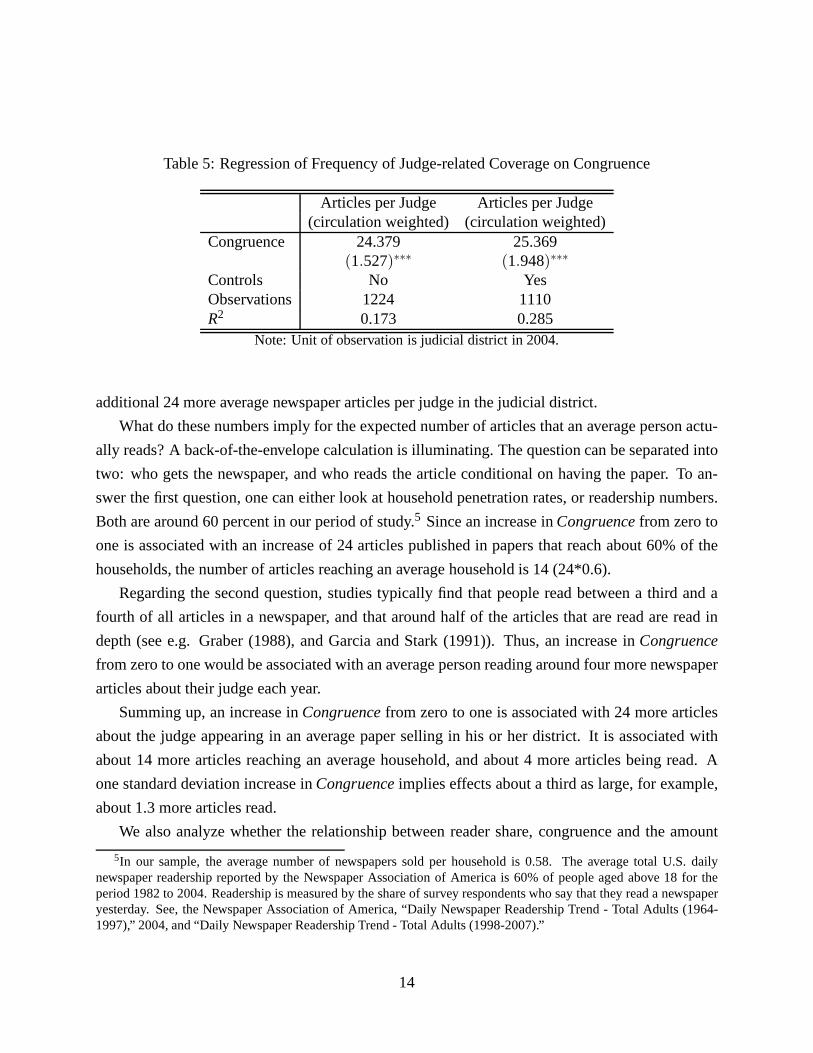
Table 5: Regression of Frequency of Judge-related Coverageon Congruence
Articles per Judge Articles per Judge(circulation weighted) (circulation weighted)
Congruence 24.379 25.369(1.527)∗∗∗ (1.948)∗∗∗
Controls No YesObservations 1224 1110R2 0.173 0.285
Note: Unit of observation is judicial district in 2004.
additional 24 more average newspaper articles per judge in the judicial district.
What do these numbers imply for the expected number of articles that an average person actu-
ally reads? A back-of-the-envelope calculation is illuminating. The question can be separated into
two: who gets the newspaper, and who reads the article conditional on having the paper. To an-
swer the first question, one can either look at household penetration rates, or readership numbers.
Both are around 60 percent in our period of study.5 Since an increase inCongruencefrom zero to
one is associated with an increase of 24 articles published in papers that reach about 60% of the
households, the number of articles reaching an average household is 14 (24*0.6).
Regarding the second question, studies typically find that people read between a third and a
fourth of all articles in a newspaper, and that around half ofthe articles that are read are read in
depth (see e.g. Graber (1988), and Garcia and Stark (1991)).Thus, an increase inCongruence
from zero to one would be associated with an average person reading around four more newspaper
articles about their judge each year.
Summing up, an increase inCongruencefrom zero to one is associated with 24 more articles
about the judge appearing in an average paper selling in his or her district. It is associated with
about 14 more articles reaching an average household, and about 4 more articles being read. A
one standard deviation increase inCongruenceimplies effects about a third as large, for example,
about 1.3 more articles read.
We also analyze whether the relationship between reader share, congruence and the amount
5In our sample, the average number of newspapers sold per household is 0.58. The average total U.S. dailynewspaper readership reported by the Newspaper Association of America is 60% of people aged above 18 for theperiod 1982 to 2004. Readership is measured by the share of survey respondents who say that they read a newspaperyesterday. See, the Newspaper Association of America, “Daily Newspaper Readership Trend - Total Adults (1964-1997),” 2004, and “Daily Newspaper Readership Trend - TotalAdults (1998-2007).”
14

of coverage depends on judicial selection mechanisms, by running OLS regressions separately for
different selection mechanisms. Comparison of Table 6 and Table 7 shows that judicial selection
mechanisms do not significantly affect the relationship between reader share, congruence and the
amount of coverage about judges.
Table 6: Regression of Frequency of Judge-related Coverageon Reader Share (Elected Judges)
Article Article Articles ArticlesShare Share per Judge per Judge
Share of Readers 0.754 0.749 21.730 22.274(0.004)∗∗∗ (0.004)∗∗∗ (0.576)∗∗∗ (0.366)∗∗∗
Controls No Yes No YesObservations 12118 10883 14515 12973R2 0.750 0.786 0.090 0.242
Note: Unit of observation is newspaper by judicial districtin 2004.Standard errors in parentheses;∗∗∗ significant at 1%.
Table 7: Regression of Frequency of Judge-related Coverageon Reader Share (Appointed Judges)
Article Article Articles ArticlesShare Share per Judge per Judge
Share of Readers 0.771 0.798 20.586 23.019(0.008)∗∗∗ (0.006)∗∗∗ (0.599)∗∗∗ (0.647)∗∗∗
Controls No Yes No YesObservations 3811 3718 4245 4147R2 0.728 0.847 0.219 0.257
Note: Unit of observation is newspaper by judicial districtin 2004.Standard errors in parentheses;∗∗∗ significant at 1%.
6 Local Penal Attitudes
The primary purpose of this study is to investigate whether active press coverage makes judges
more accountable to local penal preferences. To measure voters’ penal preferences, we use the
share of voters who vote for harsher crime punishment on various ballot propositions. Specifically,
we use all available statewide ballot propositions that deal mainly with the punishment of criminals,
15

the rights of the accused, and victim’s rights. These propositions are listed in Table 17, 18, 19 on
pages 32-34 in the appendix. Note that in virtually all casesa majority of voters voted for an
increase in harshness towards criminals or the accused, or in favor of victim’s rights. On average,
more than 65% of voters took the harsher position. This is consistent with the widespread view
that most Americans believe the criminal justice system is too lenient.
We collected county-level voting data from states’ election websites and/or election officials.
We code all propositions so that higher vote-shares represent greater support for increased harsh-
ness towards criminals or the accused. For states with more than one proposition, we average the
vote shares across the available propositions. We then de-mean the vote shares so that in each state
the mean score is zero. We call the resulting variablehvs, for “harshness vote share.”
To validate our measure, we explore how it correlates with responses to survey questions of
penal attitudes in the National Annenberg Election Survey (NAES) 2000. The NAES 2000 inter-
viewed 79,458 US residents living in 2,898 counties for 14 months during the 2000 US presidential
campaign and after the election. The survey includes the item: “The number of criminals who are
not punished enough – is this an extremely serious problem, aserious problem, not too serious or
not a problem at all?” We scale the answers to this question from one to four, whereone is “not
a problem” and four is “extremely serious.” The distribution of answers is as follows: “extremely
serious” (34%), “serious” (47%), “not too serious” (14%), and “not a problem” (3%) (Table 8).
This again suggests that most Americans would prefer a harsher criminal justice system.
Table 8: NAES Question on Penal AttitudesFreq. Percent Cum.
extremely serious 26,604 33.89 33.89serious 36,755 46.82 80.71not too serious 10,661 13.58 94.29not a problem 2,106 2.68 96.97don’t know 1,953 2.49 99.46no answer 425 0.54 100.00Total 78,504 100.00
Table 9 shows the results from the regression of the penal attitudes expressed in the NAES
survey responses on our measure of penal attitudes expressed in voting on ballot measures. The
dependent variable is the survey response to the question whether underpunished criminals is a
problem. The main independent variable is the share of voters who voted for harsher punishments
on ballot propositions. Table 9 shows the OLS regression results with three specifications: one
16

Table 9: OLS regression results based on NAES survey 2000.Dependent Variable: Under-punishing criminals is a problem.
I II III“Harsh” vote share (hvs) 0.062 0.638 0.409
(0.091) (0.174)∗∗∗ (0.131)∗∗∗
Democratic vote share -0.579 -0.345 -0.268(0.100)∗∗∗ (0.085)∗∗∗ (0.097)∗∗∗
demographic controls no no yesstate FE no yes yesObservations 25558 25558 18886R2 0.011 0.019 0.062
Standard errors, clustered by county in parenthesis.
without state fixed effects (FE) and demographic control variables (column I), another with state
FE but without demographic control variables (column II), and the other with both state FE and
demographic control variables (column III). In all three specifications, we control for Democratic
vote share of the two-party vote in the presidential election. Demographic control variables include
a number of respondent controls (race, party id dummy variables on a seven-point scale, ideology
dummy variables on a five-point scale, and dummy variables for how frequently the respondent
attend religious services on a five-point scale). It also includes county-level controls: crime rates
for murder and rape, population, per capita income, averageeducation levels (share with 1-11
years, share with 12 years, and share with more than 12 years), share black, share females, share
urban, share younger than 20, share older than 65, employment, and the share religious adherents.
The lack of statistical significance of our measure in columnI reflects that questions on ballot
measures are state-specific. The results with state-FE showthat there is a statistically signifi-
cant correlation between voters’ penal attitudes in surveyresponses and our measure from ballot
propositions. The correlation is still significant after inclusion of a large set of demographic control
variables.
7 Sentencing
We use sentencing data from the National Judicial ReportingProgram (NJRP). This program col-
lects felony sentencing data from a national sample of statecourts. The information collected
includes: age, race and gender of offenders; dates of arrest, conviction and sentencing; offense cat-
17

egory and penal codes applied; mode of conviction and type ofsentence imposed. Data has been
collected every 2 years since 1986 by the Census Bureau. Since the offense classifications were
changed in 1990, we only use observations starting in that year. The total number of observations
is 2.65 million, of which 2.5 million are after 1990. The number of observations is around 55,000
in 1986, around 100,000 per year for the period 1988-1994, and more than 400,000 per year for
the period 1996-2004. Each survey year, approximately 300 counties are sampled, except in 1986
were 100 counties were sampled. The counties are selected through stratified sampling. Within
each court, cases are randomly sampled within crime types.
In the main analysis, we focus on the three most serious offense types: homicides, sexual
assaults and robberies, because these are most likely to attract media attention. These types of
crimes also give the longest sentences. (We will compare results from these offense types with
results from other offense types.) Table 10 lists the 12 offense categories used in the NJRP data,
the number of sentences in each category.
Most serious offense:12 categories Freq. Percent Cum.
Violent crimesmurder 36,122 1.44 1.44
sexual assault 80,863 3.21 4.65robbery 132,786 5.28 9.93
aggravated assault 213,818 8.50 18.43other violent 39,657 1.58 20.01
Property crimesburglary 224,705 8.93 28.94larceny 285,226 11.34 40.28fraud 188,967 7.51 47.79
Drug crimesdrug possession 350,688 13.94 61.73drug trafficking 527,998 20.99 82.72
Weapons and otherweapon offenses 113,018 4.49 87.21other offenses 321,627 12.79 100.00
Total 2,515,475 100.00
Table 10: Most Serious Offenses - 12 Categories in NJRP Data
Our main dependent variable is a measure of the harshness of sentencing, relative to other
sentences in the same state, year and penal code citation. (Given that a felon has been convicted
18

under a certain penal code citation, it is typically under the discretion of the judge to set the
sentence. Our measure is supposed to capture the discretionary part of sentencing by judges.) To
construct this measure, we first generate a variable, penal code, that takes the same value for all
crimes in each state in each year that has the same penal code citation for the 1st, 2nd, and 3rd
most serious offense. We then identify the minimum and maximum sentence given for that penal
code. The variableharshnessis defined as
harshness=sentence−minimummaximum−minimum
.
Our main independent variable isHighCongruence, a dummy variable for whether congruence is
higher than the sample median.
If judges are responsive to local penal attitudes, then we expect sentences to be harsher in ar-
eas where more support the harsh side in ballot propositionson crime. If media coverage make
judges more responsive, then we would expect an even stronger relationship between these vari-
ables where the press covers the judges more. To test this, weregress harshness on our measure of
penal attitudes,HighCongruence, and the interaction betweenHighCongruenceand the penal atti-
tudes. We demeanhvsbefore computing the interaction variables, so that the main effects measure
the effects at the sample means.
7.1 Basic results
Table 11 shows regression results from three specifications: one without state fixed effects (FE)
and control variables (column I), another with state FE but without control variables (column II),
and the other with both state FE and control variables (column III). In column III, we include an
extensive set of controls. Individual-level controls include dummy variables for male, black, His-
panic defendants, age, age squared. Court-level controls include the population (logged), income
(logged), share religious adherents, area, share females,share younger than 20, share older than
65, share black, share Hispanics, share urban, education (share with 1-11 years, share with 12
years, and share with more than 12 years), turnout in presidential election, number of aggravated
assaults, property crimes, burglaries, larceny-thefts, motor vehicle thefts, violent crimes, murders
and non-negligible manslaughters, forcible rapes and robberies known to police.
After including state-fixed effects, sentences are harsherin judicial districts where people have
harsher penal attitudes (captured byhvs), and even more so where we expect more press cover-
age (captured by interaction ofHighCongruenceandhvs). These effects are not very sensitive to
19

Table 11: The Effect of congruence and penal attitudes on sentencingDependent Variable:Harshness I II IIIHarsh vote share (hvs) -0.041 0.337 0.332
(0.056) (0.070)∗∗∗ (0.121)∗∗∗
HighCongruence -0.035 -0.032 -0.015(0.013)∗∗∗ (0.008)∗∗∗ (0.010)
HighCongruence*hvs 0.449 0.331(0.089)∗∗∗ (0.092)∗∗∗
Newspaper penetration 0.132 0.150 0.007(0.044)∗∗∗ (0.038)∗∗∗ (0.039)
state-year FE no yes yescontrols no no yesObservations 75008 75008 68587R2 0.003 0.032 0.094
Standard errors in parentheses;∗∗∗ significant at 1%;
the inclusion of the control variables. Interpreting the results in terms of normalized harshness
of sentencing, increasing the district-level vote share for harsh punishment from 0 to 1 increases
the normalized harshness of sentencing (“harshness”) by 33.2% of overall discretion in low con-
gruence area (HighCongruence= 0). In high congruence area (HighCongruence= 1), i.e., in
the presence of active press coverage, an increase in vote share from 0 to 1 is associated with an
increase in normalized harshness of sentencing by 66.3% (=33.2%+33.1%) of overall discretion.
Therefore, we conclude that the active press coverage substantially magnifies the influence of voter
preferences on harshness of sentencing (by about two-folds).
In addition, we find that there isno influenceof press coverageindependently of voter prefer-
ences. In theory, one can conceive a situation in which judges wantto avoid press coverageper se.
For example, a critical press coverage of judges may affect their reputation among their peers and
negatively affect their prospect of promotion. If newspapers cover a particular kind of sentencing
decisions (e.g., lenient sentencing) more often and judgeswant to avoid press coverageper se, then
judges would avoid making decisions that are likely to be covered, independent of voter prefer-
ence. Such effect, if any, would be captured in the above specification byHighCongruence. Our
result shows that there is no such effect.
Our finding that press coverage magnifies the influence of voter preferences on sentencing
leads to the following question: Would press coverage influence harshness of sentencing only in
the political environments where voters can elect judges directly? This is the question that we
20

answer in the next section.
7.2 Electedvs. Appointed Judges
The variation in mechanisms by which state trial court judges are selected, introduced in Section
3.2, provides us with a unique opportunity to understand theinteraction between the “accountabil-
ity” of public officials and the amount of information that voters acquire through media.
How the selection mechanisms of judges will interact with media influence on courts is not
an obvious issue. To be precise, the issue that we investigate in this section can be divided to
two different but tightly interlinked questions. One is whether the influence of voter preferences
on court decisions are different under different selectionmechanisms. The other is how media
influence affects the answer to the former.
Theoretically, there are two main reasons why judicial selection mechanisms matter. The first
reason is the possibility that the types of judges selected by the governor can be different from the
types of judges selected through direct elections. On one hand, even when judges are not directly
elected by the voters, the public officials (typically the governor) who appoint them are elected
by the voters. If unpopular decisions by judges affect reelection prospect of the governor who ap-
pointed them, the governor will want to appoint judges who are sensitive to public opinions. But,
on the other hand, to the extent that judicial appointment isa relatively minor issue in guberna-
torial elections, governors have the freedom to choose judges whose views are more in line with
their (governors’) own views as opposed to voters’ preferences. For example, Besley and Coate
(2003) propose a theoretical model of ‘issue unbundling’ through direct election of regulators, and
they provide evidence that selection mechanisms matter in the case of public utility regulators,
using panel data on electricity prices.6 Lim (2008) explicitly estimates the preference distribution
of judges selected under the two selection mechanisms, and shows that there are significant dif-
ferences in the intrinsic preferences of appointed and elected judges. In brief, different selection
mechanisms may yield judges with different preferences (i.e., “selection effect”), and this effect
depends on how salient judicial issues are in gubernatorialelections.
If there is more active media coverage about courts in general, voters may acquire better in-
formation about judicial candidates. This would result in selecting judges whose preferences are
more in line with voters under direct elections. That is, press coverage may strengthen the selection
effect by providing voters with more information about courts.
6The possibility that different selection mechanisms can result in different policy outcomes was investigated invarious contexts. For details, see the literature cited in Besley and Coate (2003).
21

Secondly, appointed and elected judges face different retention processes. While appointed
judges typically face a yes-or-no vote without challengers, elected judges face reelection processes
that can potentially be competitive. While the presence of challengers in the retention process of
elected judges may encourage voters to acquire informationabout judges’ behavior, the absence of
potential challengers in retention process of appointed judges will discourage voters from acquiring
information about incumbent judges. This may result in a substantial difference in the degree of
reelection concerns that appointed and elected judges face.
Hall (2001) shows that there is a striking difference in the reelection rates of incumbents judges
under different reelection processes (yes-or-no votevs.competitive elections), using a nationwide
data set on state supreme court judges. In addition, Lim (2008) estimates reelection probability
as a function of judges’ criminal sentencing decisions, using their potential outside payoffs as an
instrument variable for their decisions, and provides an evidence that elected judges face strong re-
election concerns. In brief, even for judges with the same preferences, the differences in reelection
process results in a substantial variation in their sentencing decisions (“reelection effect”).
Active media coverage may strengthen elected judges’ reelection concerns by providing more
information that potential challengers can use to attack incumbent judges.
In Table 12, we run regressions separately for elected judges and appointed judges, with cases
on three most severe crimes (homicides, sexual assaults, and robberies). The specification of re-
gressions in column I,II, and III in each panel is identical to that of Table 11. Our results have
several notable features. First, when we run regressions only for elected judges (left panel), the
influence of voter preferences on sentencing is more pronounced than for the whole sample. In
contrast, for appointed judges alone (right panel), the magnitude of voter influence on court deci-
sions is much smaller, and it is not statistically significant.
Second, for elected judges, the presence of active press coverage substantially magnifies the
influence of voter preferences on sentencing decisions (by about two-folds). In contrast, for ap-
pointed judges, there does not exist any media influence.
In addition, there is no media influence on judges’ decisionsthat are independent of voters’
preferences, regardless of whether they are elected appointed.
In brief, press coverage magnifies the influence of voter preferences on judges’ decisions only
in an environment where voter can directly participate in selection and retention of judges.
22

Table 12: The Effect of Congruence and Penal Preferences by Selection Systems
Elected AppointedDependent Variable:Harshness
I II III I II IIIHarsh vote share (hvs) 0.129 0.418 0.403 -0.629 0.089 0.205
(0.065)∗∗ (0.083)∗∗∗ (0.168)∗∗ (0.081)∗∗∗ (0.121) (0.169)HighCongruence -0.049 -0.039 -0.022 0.016 0.020 -0.028
(0.014)∗∗∗ (0.011)∗∗∗ (0.012)∗ (0.028) (0.010)∗ (0.015)∗
HighCongruence*hvs 0.600 0.360 -0.120 -0.026(0.109)∗∗∗ (0.135)∗∗∗ (0.113) (0.139)
state-year FE no yes yes no yes yescontrols no no yes no no yesObservations 62660 62660 56522 12348 12348 12065R2 0.003 0.032 0.094 0.034 0.117 0.182
Standard errors, clustered at the district-level, in parentheses;∗∗∗ significant at 1%;∗∗ significant at 5%;∗ significant at 10%.
7.3 Results by Offense Type and Severity
So far, we have focused on the three most serious crimes (homicides, sexual assaults, and rob-
beries) because they are the most likely to get the press coverage. In this section, we compare the
influence of press coverage by category of crimes: violent crimes, property crimes, drug crimes,
and weapons and other. The results are shown in Table 13 on page 24. There are several no-
table features in the results. First, the influence of voter preferences on sentencing decisions is
statistically significant in all categories except for “weapons and other”. However, media influence
through magnification of voter preferences, captured by theinteraction between penal attitudes
(hvs) andHighCongruence, is substantial in magnitude and statistically significantat 1%-level
only for violent crimes. The magnitude is only half as large for property crimes and is statistically
significant only at 10%-level. For drug crime, the magnitudeof the effect of congruence is only a
quarter of the effect for violent crimes, and it is not statistically significant even at 10% level.
We also investigate the effect by severity level of offensesin Table 14. The results by severity
level shows a similar pattern. The effect of congruence is substantial and statistically significant at
5% and 1% level only for class 1-3 offenses out of 12 offense severity levels in NJRP.
23

Table 13: The Effect of Congruence and Penal Preferences by Offense CategoryViolent Property
Dependent Variable:HarshI II III I II III
“Harsh” vote share (hvs) 0.007 0.258 0.259 0.154 0.380 0.260(0.051) (0.063)*** (0.116)** (0.053)*** (0.071)*** (0.091)***
HighCongruence -0.037 -0.037 -0.020 -0.017 -0.036 -0.022(0.010)*** (0.008)*** (0.010)** (0.011) (0.007)*** (0.009)**
HighCongruence*hvs 0.345 0.287 0.380 0.146(0.088)*** (0.101)*** (0.093)*** (0.086)*
Newspaper penetration 0.105 0.127 0.005 0.065 0.133 0.013(0.038)*** (0.036)*** (0.037) (0.035)* (0.031)*** (0.025)
State-by-year FE no yes yes no yes yesControls no no yes no no yesObservations 170837 170837 154084 269425 269425 245538R2 0.005 0.025 0.069 0.005 0.032 0.058
Drug Weapons and otherDependent Variable:Harsh
I II III I II III“Harsh” vote share (hvs) 0.145 0.230 0.235 0.042 0.279 0.157
(0.054)*** (0.060)*** (0.113)** (0.056) (0.064)*** (0.119)HighCongruence -0.001 -0.020 -0.002 0.013 -0.028 -0.023
(0.011) (0.008)** (0.010) (0.011) (0.007)*** (0.009)**HighCongruence*hvs 0.417 0.077 0.201 0.058
(0.082)*** (0.100) (0.084)** (0.094)Newspaper penetration 0.148 0.109 -0.013 0.057 0.123 0.050
(0.047)*** (0.032)*** (0.028) (0.043) (0.030)*** (0.030)*State-by-year FE no yes yes no yes yesControls no no yes no no yesObservations 344204 344204 315101 137084 137084 123759R2 0.009 0.043 0.078 0.001 0.035 0.040
Standard errors, clustered at the district-level, in parentheses;∗∗∗ significant at 1%;∗∗ significant at 5%;∗ significant at 10%.
24

Table 14: The Effect of Congruence and Penal Preferences by Severity LevelClass 1-3 Class 4-5
Dependent Variable:HarshI II III I II III
“Harsh” vote share (hvs) -0.041 0.337 0.332 0.093 0.170 0.203(0.056) (0.070)*** (0.121)*** (0.061) (0.073)** (0.136)
HighCongruence -0.035 -0.032 -0.015 -0.041 -0.053 -0.042(0.013)*** (0.008)*** (0.010) (0.010)*** (0.009)*** (0.013)***
HighCongruence*hvs 0.449 0.331 0.208 0.221(0.089)*** (0.092)*** (0.114)* (0.145)
Newspaper penetration 0.132 0.150 0.007 0.044 0.120 -0.003(0.044)*** (0.038)*** (0.039) (0.041) (0.041)*** (0.044)
State-by-year FE no yes yes no yes yesControls no no yes no no yesObservations 172716 172716 136696 180720 180720 141106R2 0.010 0.062 0.114 0.006 0.052 0.074
Class 6-8 Class 9-11Dependent Variable:Harsh
I II III I II III“Harsh” vote share (hvs) 0.154 0.380 0.260 0.132 0.236 0.230
(0.053)*** (0.071)*** (0.091)*** (0.054)** (0.059)*** (0.116)**HighCongruence -0.017 -0.036 -0.022 0.001 -0.021 -0.006
(0.011) (0.007)*** (0.009)** (0.010) (0.008)*** (0.009)HighCongruence*hvs 0.380 0.146 0.392 0.074
(0.093)*** (0.086)* (0.081)*** (0.102)Newspaper penetration 0.065 0.133 0.013 0.142 0.105 -0.005
(0.035)* (0.031)*** (0.025) (0.046)*** (0.031)*** (0.027)State-by-year FE no yes yes no yes yesControls no no yes no no yesObservations 533299 533299 420508 793297 793297 616414R2 0.002 0.050 0.077 0.004 0.065 0.093
Standard errors, clustered at the district-level, in parentheses;∗∗∗ significant at 1%;∗∗ significant at 5%;∗ significant at 10%.
25

8 Conclusion
Judiciary is often regarded as the branch of the government that is the most insulated from public
opinions. In this research, we investigated the amount of press coverage about U.S. state trial
court judges, its influence on criminal sentencing, and the interaction between press coverage and
the selection mechanisms of judges. Our main results can be summarized as follows: 1) There is
a substantial amount of press coverage about state trial court judges, 2) presence of active press
coverage magnifies the influence of voters’ penal preferences on criminal sentencing decisions, 3)
such effect is statistically significant only for severe violent crimes, 4) such effect exists only for
elected judges. The presence of salient effects documentedabove shows that public opinions do
influence court decisions to a substantial degree, and that the main mechanism is the interaction
of electoral process and voter information on court decisions affected by the presence of active
media.
Much remains to be done to uncover details of the mechanisms by which the press coverage
affects court decisions. For example, in this paper, we onlydocumented theamountof press cover-
age (number of articles mentioning judges’ name). If we can acquire information on the timing of
coverage (e.g., electoral cycles) and what type of court decision gets covered, it would further our
understanding of the media influence. In addition, an analysis of media influence on the election
of judges will help us better understand the channels through which media influence interacts with
selection mechanisms of judges. These issues will be addressed in our future research.
26

References
Alesina, Alberto and Guido Tabellini, “Bureaucrats or Politicians? Part I: A Single Policy Task,”
American Economic Review, March 2007,97, 169–79.
and , “Bureaucrats or Politicians? Part II: Multiple Policy Tasks,” Journal of Public Eco-
nomics, April 2008,92, 426–447.
Besley, Timothy and Abigail Payne, “Judicial Accountability and Economic Policy Outcomes:
Evidence from Employment Discrimination Charges,” 2003. IFS Working Paper No.W03/11.
and Robin Burgess, “The Political Economy of Government Responsiveness: Theory and
Evidence from India,”Quarterly Journal of Economics, 2002,117(4).
and Stephen Coate, “Elected Versus Appointed Regulators: Theory and Evidence,” Journal of
the European Economic Association, Sep. 2003,1 (5), 1176–1206.
Blume, John and Theodore Eisenberg, “Judicial Politics, Death Penalty Appeals, and Case Se-
lection: An Empirical Study,”Southern California Law Review, 1999,72, 464–503.
Bohn, Henning and Robert Inman, “Balanced Budget Rules and Public Deficits: Evidence from
the U.S. States,”Carnegie-Rochester Conference Series on Public Policy, Nov. 1996.
DellaVigna, Stefano and Ethan Kaplan, “The Fox News Effect: Media Bias and Voting,”Quar-
terly Journal of Economics, 2007,122, 1187–1234.
Flanagan, Timothy J. and Dennis R. Longmire, Americans View Crime and Justice: A National
Public Opinion Survey, Sage Publications, 1996.
Garcia, Mario R. and Pegie Stark, Eyes on the News, St. Petersburg, FL: Poynter Institute, 1991.
Gelman, Andrew, James S. Liebman, Valerie West, and Alexander Kiss, “A Broken System:
The Persistent Patterns of Reversals of Death Sentences in the United States,”Journal of Em-
pirical Legal Studies, July 2004,1 (2), 209–261.
Gentzkow, Matthew, “Television and Voter Turnout,”Quarterly Journal of Economics, 2006,121
(3).
27

Goldberg, D., C. Holman, and S. Sanchez, “The New Politics of Judicial Elections,” 2002.
Technical Report, The Institute on Money in State Politics.
Graber, Doris A., Processing the News: How People Tame the Information Tide, New York:
Longman., 1988.
Hall, Melinda Gann, “State Supreme Courts in American Democracy: Probing the Myths of
Judicial Reform,”American Political Science Review, June 2001,95 (2), 315–330.
Hanssen, F. Andrew, “The Effect of Judicial Institutions on Uncertainty and the Rate of Litigation:
The Election versus Appointment of State Judges,”Journal of Legal Studies, 1999,28 (1), 205–
232.
, “Independent Courts and Administrative Agencies: An Empirical Analysis of the States,”Jour-
nal of Law, Economics, and Organization, 2000,16, 534–571.
, “Is There a Politically Optimal Level of Judicial Independence?,”American Economic Review,
2004,94, 712–729.
, “Learning about Judicial Independence: Institutional Change in State Courts,”Journal of Legal
Studies, 2004,33, 431–474.
Huber, Gregory A. and Sanford C. Gordon, “Accountability and Coercion: Is Justice Blind
When It Runs for Office?,”American Journal of Political Science, Apr. 2004,48 (2), 247–263.
and , “The Effect of Electoral Competitiveness on Incumbent Behavior,” Quarterly Journal
of Political Science, May 2007,2, 107–138.
Lim, Claire S.H., “Turnover and Accountability of Appointed and Elected Judges,” 2008. Stan-
ford University working paper.
Maskin, Eric and Jean Tirole, “The Politician and the Judge: Accountability in Government,”
American Economic Review, September 2004,94 (4), 1034–1054.
National Center for State Courts, “Examining the Work of State Courts,” 2005.
http://www.ncsconline.org/DResearch/csp/CSPMain Page.html.
Stromberg, David, “Radio’s Impact on Public Spending,”Quarterly Journal of Economics, 2004,
119(1).
28

, “News Floods, News Droughts, and U.S. Disaster Relief,”Quarterly Journal of Economics,
2007,122(2).
and Jr. James M. Snyder, “Press Coverage and Political Accountability,”Journal of Political
Economy, 2010,118(2).
Tabarrok, Alexander and Eric Helland , “Court Politics: The Political Economy of Tort Awards,”
Journal of Law and Economics, Apr. 1999,42 (1), 157–88.
U.S. Courts, “Federal Judicial Caseload Statistic,” 2004. http://www.uscourts.gov/caseload
2004/contents.html.
29

Appendix
In Table 15 and 16, we document the details of the judicial selection mechanisms. Further de-
tails can be found on a webpage of the American Judicature Society, http://www.judicialselection.us/.
And, in Table 17-19, we list the ballot propositions used to measure penal preferences.
Table 15: Judicial Selection Mechanisms for State Trial Courts
State Name of Trial Court Initial Selection Reelection
Alabama Circuit Court Partisan Election Partisan ElectionAlaska Superior Court Gubernatorial Appointment Retention ElectionArizona Superior Court (Variation across counties) (Variation across counties)
Gubernatorial Appointment Retention ElectionNonpartisan Election Nonpartisan Election
Arkansas Circuit Court Nonpartisan Election Nonpartisan ElectionCalifornia Superior Court Nonpartisan Election Nonpartisan ElectionColorado District Court Gubernatorial Appointment Retention Election
Connecticut Superior Court Gubernatorial Appointment ReappointmentDelaware Superior Court Gubernatorial Appointment ReappointmentFlorida Circuit Court Nonpartisan Election Nonpartisan ElectionGeorgia Superior Court Nonpartisan Election Nonpartisan ElectionHawaii Circuit Court Gubernatorial Appointment ReappointmentIdaho District Court Nonpartisan Election Nonpartisan ElectionIllinois Circuit Court Partisan Election Retention ElectionIndiana Superior Court Partisan Election Partisan ElectionIowa District Court Gubernatorial Appointment Retention Election
Kansas District Court (Variation across districts) (Variation across districts)Gubernatorial Appointment Retention Election
Partisan Election Partisan ElectionKentucky Circuit Court Nonpartisan Election Nonpartisan ElectionLouisiana District Court Partisan Election Partisan Election
Maine Superior Court Gubernatorial Appointment ReappointmentMaryland Circuit Court Gubernatorial Appointment Reappointment
30

Table 16: Judicial Selection Mechanisms for State Trial Courts (con’d)
State Name of Trial Court Initial Selection Reelection
Massachusetts Superior Court Gubernatorial Appointment Life-tenureMichigan Circuit Court Nonpartisan Election Nonpartisan ElectionMinnesota District Court Nonpartisan Election Nonpartisan ElectionMississippi Circuit Court Nonpartisan Election Nonpartisan ElectionMissouri Circuit Court (Variation across Counties) (Variation across Counties)
Gubernatorial Appointment Retention ElectionPartisan Election Partisan Election
Montana District Court Nonpartisan Election Nonpartisan ElectionNebraska District Court Gubernatorial Appointment Retention ElectionNevada District Court Gubernatorial Appointment Retention Election
New Hampshire Superior Court Gubernatorial Appointment Life-tenureNew Jersey Superior Court Gubernatorial Appointment Gubernatorial Appointment
New Mexico District Court Partisan Election Retention ElectionNew York Supreme Court Partisan Election Partisan Election
North Carolina Superior Court Nonpartisan Election Nonpartisan ElectionNorth Dakota District Court Nonpartisan Election Nonpartisan Election
Ohio Court of Common Pleas Partisan Election Partisan ElectionOklahoma District Court Nonpartisan Election Nonpartisan Election
Oregon Circuit Court Nonpartisan Election Nonpartisan ElectionPennsylvania Court of Common Pleas Partisan Election Retention ElectionRhode Island Superior Court Gubernatorial Appointment Life-tenure
South Carolina Circuit Court Legislative Appointment Legislative AppointmentSouth Dakota Circuit Court Nonpartisan Election Nonpartisan Election
Tennessee Circuit Court Partisan Election Partisan ElectionTexas District Court Partisan Election Partisan ElectionUtah District Court Gubernatorial Appointment Retention Election
Vermont Superior Court Gubernatorial Appointment Legislative AppointmentVirginia Circuit Court Legislative Appointment Legislative Appointment
Washington Superior Court Nonpartisan Election Nonpartisan ElectionWest Virginia Circuit Court Partisan Election Partisan Election
Wisconsin Circuit Court Nonpartisan Election Nonpartisan ElectionWyoming District Court Gubernatorial Appointment Retention Election
31

Table 17: Ballot Propositions Used to Measure Penal Preferences
State Year Prop No. Percent Yes Description
AL 1996 Amendment 3 70 Removing the Prohibition on Guilty Pleas within 15 Days of Arrest in Non-Capital Felony CasesAZ 1998 Proposition 301 48 Relating To Probation Eligibility For Drug Possession Or UseAZ 2002 Proposition 103 80 Bailable Offenses; ProhibitionsAZ 2002 Proposition 302 69 Probation For Drug CrimesAZ 2006 Proposition 100 77 Bailable OffensesAZ 2006 Proposition 301 58 Probation for Methamphetamine OffensesCA 2000 Proposition 18 72 Murder; Special Circumstances; Leg Initiative AmendmentCA 2000 Proposition 21 62 Juvenile CrimeCO 1992 Referendum A 80 Rights of Crime VictimsCO 1994 Referendum C 77 Post-Conviction BailFL 1998 Amendment 2 72 Preservation of Death Penalty;
US Supreme Court Interpretation of Cruel And Unusual PunishmentHI 2002 Question 3 57 Initiation of Felony Prosecutions By Written InformationHI 2004 Amendment 1 65 Sexual Assault CrimesHI 2004 Amendment 2 71 Public Access To Registration Information of Sex OffendersHI 2004 Amendment 3 53 Rights of Alleged Crime VictimsHI 2004 Amendment 4 56 Initiation of Criminal ChargesHI 2006 Amendment 4 69 Sexual Assault Crimes Against MinorsIA 1998 Amendment 2 63 Eliminate Limitation of Fines For Offenses That May Be
Summarily Tried Without IndictmentID 1994 H.J.R 16 80 Provide for Rights of Crime VictimsIN 1996 Public Question 1 89 Victims’ RightsIN 2000 Public Question 1 65 Criminal Appeals ProcessLA 1998 Amendment 4 69 Provides for Rights of the Victim of a CrimeLA 1998 Amendment 6 68 Make It Easier For Judges To Deny BailLA 1998 Amendment 14 62 Require a Unanimous Verdict in Criminal Trials That Use Six-Member Jury
32

Table 18: Ballot Propositions Used to Measure Penal Preferences (con’d)State Year Prop No. Percent Yes Description
LA 1999 Amendment 1 59 Provide That Governor May Not Commute Sentences or Pardon PersonsConvicted Without A Favorable Recommendation By Board Of Pardons
LA 1999 Amendment 8 53 Limit Automatic Pardon Provision To Persons Convicted of a Non-Violent CrimeMI 1994 Proposition B 74 A Proposal to Limit Criminal AppealsMS 1998 Amendment 2 Victims’ RightsMT 1998 C-33 71 Criminal Laws Must Be Based on Principles Of Public Safety and
Restitution For Victims As Well As Prevention And ReformationNC 1996 Amendment 2 86 Probation, Restitution, Community Service, Work Programs
and Other Restraints on Liberty May Be Imposed Upon Conviction of Criminal OffenseNC 1996 Amendment 3 78 Victims’ RightsNE 2006 Amendment 4 56 Permit Supervision of Individuals Sentenced To Probation,Released on Parole,
or Enrolled In Court Programs as Provided By LegNJ 2000 Public Question 2 79 To Permit Leg To Auth By Law Disclosure Of Information Concerning Sex OffendersNV 1996 Question 2 74 To Provide Specifically For Rights of Victims of Crime?OH 1997 Issue 1 73 Denial of Bail In Felony OffensesOH 2002 Issue 1 32 Treatment in lieu of Incarceration for Drug OffendersOK 1994 Question 664 91 Allow the Legislature to set Minimum Prison Terms for All Convicted FelonsOR 1996 Measure 26 66 Changes Principles That Govern Laws for Punishment of CrimeOR 1996 Measure 40 58 Gives Crime Victims Rights, Expands Admissible Evidence, Limits Pretrial ReleaseOR 1999 Measure 68 58 Allows Protecting Business, Certain Government Programs from Prison Work ProgramsOR 1999 Measure 69 58 Grants Victims Constitutional Rights In Criminal Prosecutions,
Juvenile Court Delinquency ProceedingsOR 1999 Measure 71 58 Limits Pretrial Release of Accused Person To Protect VictimsOR 1999 Measure 72 45 Allows Murder Conviction by 11 to 1 Jury VerdictOR 1999 Measure 73 46 Limits Immunity from Criminal Prosecution of Person Ordered To Testify
about his or her ConductOR 1999 Measure 74 53 Requires Terms of Imprisonment Announced in Court Be Fully Served, With Exceptions
33

Table 19: Ballot Propositions Used to Measure Penal Preferences (con’d)State Year Prop No. Percent Yes Description
OR 1999 Measure 75 57 Person Convicted of Certain Crimes Cannot Serve on Grand Juries,Criminal Trial Juries
OR 2000 Measure 3 67 Requires Conviction Before Forfeiture; Restricts Proceeds Usage;Requires Reporting, Penalty
OR 2000 Measure 94 26 Repeals Mandatory Minimum Sentences for Certain Felonies,Requires ResentencingOR 2008 Measure 57 61 Increase Sentences for Drug Trafficking, Theft against Elderly and
Specified Repeat Property and Identity Theft CrimesOR 2008 Measure 61 48 Creates Mandatory Minimum Prison Sentences for Certain Theft, Identity Theft,
Forgery, Drug and Burglary CrimesPA 1998 Joint Resolution 1 72 Adding Categories of Criminal Cases in Which Bail Is DisallowedPA 1998 Joint Resolution 2 69 Granting Commonwealth Right to Trial By Jury in Criminal CasesPA 2003 Amendment 1 68 Amending Right of Persons Accused of a Crime To Meet Witness
against Them Face To FacePA 2003 Amendment 2 80 Auth Leg To Enact Laws Regarding Way That Children May Testify
in Criminal ProceedingsSC 1996 Amendment 1 (A) 89 Victims’ RightsSC 1996 Amendment 1 (B) 87 Allows Denial of Bail To Persons Charged With Violent CrimesSC 1998 Amendment 1 48 Allow Leg To Specify Which Crime Victims Are Protected By Victims Bill Of RightsSD 2002 Amendment A 21 Relating To A Criminal Defendant’s RightsTN 1998 Amendment 2 89 Entitles Victims of Crime To Certain Basic Rights To Preserve and
Protect Their Rights To Justice, Due Process In All Cases including Criminal CasesUT 1994 Proposition 1 69 Rights of Crime VictimsWA 1993 Initiative 593 76 Sentencing of CriminalsWI 2006 Question 2 55 Reinstate Death Penalty
34