measuring geopolitical risk - lse home
TRANSCRIPT

Measuring Geopolitical Risk∗
Dario Caldara† Matteo Iacoviello‡
November 9, 2017
Abstract
We present a monthly index of geopolitical risk (GPR index) based on a tally of newspaper
stories that contain terms related to geopolitical tensions, and examine its evolution and effects
since 1985. The GPR index spikes around the Gulf War, after 9/11, during the 2003 Iraq invasion,
during the 2014 Russia-Ukraine crisis, and after the Paris terrorist attacks. High geopolitical risk
leads to a decline in real activity, to lower stock returns, and to movements in capital flows away
from emerging economies and towards advanced economies. When we decompose the index into
a threats and an acts component, the adverse effects of geopolitical risk are mostly driven by the
threat of adverse geopolitical events. Extending our index back to 1900, geopolitical risk rose
dramatically during the two world wars, was elevated in the early 1980s, and has drifted upwards
since the beginning of the 21st century.
PRELIMINARY
Latest version at https://www2.bc.edu/matteo-iacoviello/gpr_files/GPR_PAPER.pdf
∗We thank Alessandra Bonfiglioli, Nick Bloom, Ricardo Correa, Nathan Converse, Chris Erceg, Bo Sun and seminarparticipants at the Federal Reserve Board, the Stanford Institute for Theoretical Economics, the Chengdu InternationalMacro-Finance Conference, the CEF Conference in New York, the Central Bank of Chile, Pontificia Universidad Catolicade Chile, Bank of Italy, University of Cambridge, Bocconi University, and DIW Berlin. Joshua Herman, Lucas Husted,Andrew Kane, and Aaron Markiewitz provided outstanding research assistance. All errors and omissions are our ownresponsibility. The views expressed in this paper are solely the responsibility of the authors and should not be interpretedas reflecting the views of the Board of Governors of the Federal Reserve System or of anyone else associated with theFederal Reserve System.†Federal Reserve Board of Governors. Email: [email protected]‡Federal Reserve Board of Governors. Email: [email protected]

1 Introduction
Entrepreneurs, market participants and central banks officials view geopolitical risks as key determi-
nants of investment decisions. The financial press routinely lists geopolitical risks as important factors
for stock returns and stock market volatility. In a Gallup 2017 survey of more than 1,000 investors,
75 percent of respondents were very or somewhat worried about the economic impact of the various
military and diplomatic conflicts happening around the world, ranking geopolitical risk ahead of po-
litical and economic uncertainty.1 Carney (2016) includes geopolitical risk—together with economic
and policy uncertainty—among an ‘uncertainty trinity’ that could have significant adverse economic
effects. More recently, the European Central Bank—in its April 2017 Economic Bulletin—and the In-
ternational Monetary Fund—in the October 2017 WEO—list geopolitical uncertainties among one of
the most salient risks to the economic outlook.
However, the importance of geopolitical risks in shaping the macroeconomic and financial cycles
has not been the subject of systematic empirical analysis. The main limitation has been the lack of
an indicator of geopolitical risk that is consistent over time, that can be used to rank geopolitical
events over history, and that measures in real time the public perception of these events and the
associated risks. This is the perspective we adopt here. Using newspaper records, we construct a
monthly index of geopolitical risk (GPR), and examine its evolution and determinants since 1985. We
then study the economic effects of geopolitical risks. When we do so, we find that higher geopolitical
risk depresses economic activity, lowers stock return, and leads to movements in capital from emerging
towards advanced economies.
The construction of the GPR index involves three main steps: definition, measurement, and audit.2
In the definition step, we follow one common usage of the term geopolitics, and refer to it as the practice
of states and organizations to control and compete for territory. In particular, we want to identify
geopolitical events in which power struggles over territories cannot be resolved peacefully. Accordingly,
we define geopolitical risk as the risk associated with wars, terrorist acts, and tensions between states
that affect the normal and peaceful course of international relations. Geopolitical risk captures both
the risk that these events materialize, or the new risks associated with an escalation of existing events.
In the measurement step, we draw on the methodology pioneered by Saiz and Simonsohn (2013)
and Baker, Bloom, and Davis (2016), and construct the GPR index with an algorithm that counts
the frequency of articles related to geopolitical risks in leading international newspapers. We plot the
resulting benchmark index in Figure 1. The three largest spikes are recorded during the Gulf War, after
1 See http://www.businesswire.com/news/home/20170613005348/en/.2 The index is available at https://www2.bc.edu/matteo-iacoviello/gpr.htm.
2
9/11, and during the 2003 invasion of Iraq.3 More recently, the index spikes during the Ukraine/Russia
crisis and after the Paris terrorist attacks. We also construct an historical version of the index—dating
back to 1899 and plotted in Figure 3—, which reaches its highest values at the beginning of the two
world wars, as well as at the onset of the U.S. involvement in them.
In the audit step, we assess whether the GPR index is an accurate measure of underlying geopolitical
risks. First, we develop a formal audit process based on a human reading of more than 10,000 newspaper
articles. To quantify type I and type II errors, we audit both articles that comprise the GPR index, and
articles that we sample from a broader set likely mentioning geopolitical events. The audit of a broad set
of articles allows us to construct a human-generated GPR index, which correlates remarkably well with
the benchmark index. The audit also provides an important input to refine the selection of the search
terms used by our algorithm. Second, we compare our index to various metrics of wars and terrorism
intensity, which can be interpreted as alternative proxies for geopolitical risks. Third, we compare the
GPR index to popular measures of economic policy uncertainty and financial volatility. Finally, we
show that potential media bias in the coverage of geopolitical events is not a driver of fluctuations in
our index.
We then turn our analysis to the role that geopolitical risks play for the macroeconomy. Using a
structural VAR estimated on US data, we find that an exogenous increase in geopolitical risk induces
persistent declines in industrial production, employment, and international trade, and that economic
policy uncertainty and consumer confidence both enhance the transmission of the geopolitical risk
shock. We also document that stock returns experience a significant but short-lived drop following
higher geopolitical risk. The stock market response varies substantially across industries, with the
defense sector experiencing positive excess returns, and with sectors exposed to the broader economy—
for instance steel works and mining—experiencing negative returns.
An important question is whether the economic effects of higher geopolitical risk are driven by the
realization of adverse geopolitical events—that is, by first moment shocks—as opposed to increases in
uncertainty that happen regardless of actual adverse events. To answer this question, we construct
two sub-indexes that—together with some exclusion restrictions discussed in the paper—allow us to
separate shocks to geopolitical acts from shocks to geopolitical threats. Including these indexes in the
VAR, we find that what matters about geopolitical events is mostly the uncertainty surrounding them:
a geopolitical acts shock has economically small effects, while a shock to geopolitical threats has large
and persistent effects.
3 Throughout the paper, we refer to historical events by adopting the naming convention followed by the Wikipediaentry for that event.
3

We then expand the analysis to document the global effects of geopolitical risks. Using a battery of
small-scale VARs, we find that geopolitical risks are recessionary for advanced economies, while have no
discernible real effects in emerging economies. Moreover, using monthly stock market data for a panel of
17 countries, we document that, on average, geopolitical risks depress stock prices. Finally, we show that
geopolitical risks determine significant movements in international capital flows. In particular, following
higher geopolitical risk, investors pull capital out of emerging economies and move into towards safe
havens, most notably into the United States. Importantly, our empirical model includes the VIX, a
commonly used proxy for global financial risk. Accordingly, our results suggest a direct and global role
for geopolitical risk that goes beyond its propagation through financial uncertainty.
We are not the first to construct an index of geopolitical risk. Many companies publish some
indicators of political and geopolitical risks.4 The construction of the GPR index overcomes the various
shortcomings of existing indicators that makes them poorly suited for empirical analysis. First, many
indexes either do not define geopolitical risk or use a broad definition that includes very different
events, ranging from wars to major economic crises to climate change. Accordingly, it is unclear what
these indexes measure. Second, existing indexes are extremely hard to replicate. Indexes constructed
by private companies are not publicly available, are constructed subjectively, and with a less-than-
transparent methodology. By contrast, our index is easy to replicate and to audit, as both our algorithm
and audit guide are publicly available. Third, many indexes exhibit very little variability and are
available only for a few years. Many of them are qualitative indicators of whether countries are politically
stable or not, and are reported using color–coded maps or integer numbers ranging from 1 to 5.5
Our analysis can be seen as a complement and extension to the work of several authors that have
tried to measure the macroeconomic consequences of wars, terrorist attacks, and other forms of collective
violence. Using panel annual data on a large set of countries, Blomberg, Hess, and Orphanides (2004)
find that both wars and terrorism have an economically significant negative effect on growth, but the
effect of terrorism is smaller and less persistent than that associated with wars. However, their measure
of terrorism is a simple dummy variable that presents a significant limitation to their analysis. Similar
results are also found in the cross-country study of Tavares (2004), who finds—using annual data from
1987 through 2001—that terrorist attacks have a modest negative effect on growth. Glick and Taylor
4 For example, by inspecting the first 20 entries of a Google search of the terms ”Geopolitical Risk”, we found thefollowing companies providing businesses geopolitical-related intelligence: Marsh-McLennan, Control Risks Online, ZurichInsurance, Cambridge Econometrics, U.S. Energy Stream, Aon plc, Verisk Maplecroft, CSO Online, Euler Hermes, RiskAdvisory, Strategic Risk.
5 A notable example, the Doomsday Clock, measures the countdown to a possible global catastrophe, with fewer minutesto midnight measuring higher risk, but the value of this index has changed only six times in the last twenty years. TheBulletin of the Atomic Scientists webpage has more details about the Doomsday Clock.
4

(2010) find large and persistent impacts of wars on trade, national income, and global economic welfare.6
Our index has several advantages over these measures: it is available at a monthly frequency; it can
separately measure risks and acts; it is a continuous measure that gives higher weight to larger events;
it directly measures the public perception of these events; it is available in real time.
This paper complements the literature that studies the measurement and effects of macroeconomic
uncertainty in two ways. First, many proxies for macroeconomic uncertainty increase in recessions and
during financial crisis.7 Whether this empirical regularity implies that uncertainty is an endogenous
response to adverse macroeconomic and financial conditions or one of their drivers remains an open
question.8 An advantage of our index relative to the existing uncertainty proxies is that it quantifies
episodes of geopolitical tensions that, for most countries and in particular for the United States, are
largely exogenous to the state of the economy. For instance, our index does not systematically rise in
recessions and during the global financial crisis, but it rises—as many uncertainty proxies do—during
the two Gulf Wars and 9/11. Thus, we do not require strong identification assumptions to support that
geopolitical risk has recessionary effects. Second, we provide a first attempt within this literature to
isolate pure movements in risk, that is, movements in our GPR index in periods when the underlying
threat does not materialize. We are able to do so because we can accurately time actual geopolitical
events and control for their direct effect.
Section 2 describes the construction of the geopolitical risk index. Section 3 discusses what our index
measures, and compares it to alternative proxies for geopolitical risk and macroeconomic uncertainty.
Section 4 studies the effects—on economic activity, capital flows and stock returns—of changes in
geopolitical risk. Section 5 concludes.
2 Construction of the Geopolitical Risk Index
The construction of the geopolitical risk (GPR) index involves three main steps: definition, measure-
ment, and audit. In this section, we first describe the definition of geopolitics and geopolitical risk
6 Several papers have looked at the theoretical channels by which terrorism and war may affect economic activity.Lenain, Bonturi, and Koen (2002) describe three channels in which terrorism can influence activity: shrinking insurancecoverage stemming from the perception of greater risk, higher trade costs, and stepped-up security spending. Ecksteinand Tsiddon (2004) present a model where terror endangers life such that the value of the future relative to the presentis reduced. In their model, a rise in terror activity reduces investment, income, and consumption.
7 See the proxies used and constructed by, among many, Bloom (2009), Bachmann, Elstner, and Sims (2013), Gilchrist,Sim, and Zakrajek (2014), Jurado, Ludvigson, and Ng (2015) and Scotti (2016).
8 Ludvigson, Ma, and Ng (2015) use a structural VAR model identified with external information and find a two-wayrelationship between uncertainty and the business cycle. Caldara, Fuentes-Albero, Gilchrist, and Zakrajek (2016) also usea structural VAR and document that macroeconomic uncertainty does endogenously respond to tightening in financialconditions.
5

that we adopt in our paper. We then discuss how we construct the index and describe its key features.
Finally, we provide a detailed review of the audit process.
2.1 Definition: Geopolitics and Geopolitical Risk
Geopolitics is a term that encompasses multiple definitions (Flint, 2016). Historically, geopolitics has
been used to describe the practice of states to control and compete for territory. However, in the past
twenty years, power struggles and other events involving a diverse set of agents, from corporations
to NGOs to rebel groups to organized labor to political parties, have also been classified as part of
geopolitics. For this reason, the common usage of the word geopolitics covers a diverse set of events
with a wide range of causes and consequences, from terrorist attacks to climate change, from Brexit to
the global financial crisis.
In defining geopolitical risk, we want to identify situations in which the power struggles of agents
over territories cannot be resolved peacefully and democratically. Accordingly, we define geopolitical
risk as the risk associated with wars, terrorist acts, and tensions between states that affect the normal
and peaceful course of international relations. Geopolitical risk captures both the risk that these events
materialize, or the new risks associated with an escalation of existing events.
Our definition closely follows the historical use of the term geopolitics, and, in line with recent
assessments of modern international relations among states, includes terrorism. At least since 9/11,
terrorism has come to dominate the practice and the language of geopolitics. Even before 9/11, terrorist
acts have generated political tensions among states, and in some instances have led to fully-fledged wars.
This practice is not confined to Al Qaeda and ISIS, but dates back to every episode in which acts of
violence were carried by political organizations to bolster religious, economic or revolutionary objectives.
It is worth stressing that this definition of geopolitical risk is not exhaustive. That is, we cannot
uniquely rely on this definition to classify events and risks as being geopolitical or not, and some
judgment both in the construction of the index and in the auditing process is required. As an example,
political tensions that are initially confined within nations’ borders and not aimed at affecting the
normal course of international relations could potentially escalate and create geopolitical instability.
Occasionally, the classification of these events is not clear cut. For instance, we view the coup attempted
in Turkey in July 2016 as being an event that falls within our definition. While the coup ended up
having mostly domestic consequences, there were significant spillovers to the Middle East and to the
fight against ISIS in Syria and Iraq. By contrast, we do not view Brexit as an event that falls within
our definition, as it was the outcome of a democratic referendum. We match the need for judgment
with high standards of replicability, robustness, and transparency in the construction of the index and
6

in the audit process.
2.2 Measurement
We construct the GPR index by counting the occurrence in leading English-language newspapers of
articles discussing the geopolitical events and risks described by our definition. In particular, we con-
struct a monthly index that starts in 1985 running automated text-searches of the electronic archives
of 11 newspapers: The Boston Globe, Chicago Tribune, The Daily Telegraph, Financial Times, The
Globe and Mail, The Guardian, Los Angeles Times, The New York Times, The Times, The Wall Street
Journal, and The Washington Post. We also construct a long-span historical index (GPRH) dating back
to 1900. We restrict the newspapers’ coverage to the only three journals for which we have electronic
access to all articles from 1900, namely the New York Times, Chicago Tribune, and the Washington
Post. We calculate the index by counting the number of articles related to geopolitical risk for each
month as a share of the total number of articles. The index is normalized to average a value of 100
in the 2000-2009 decade, so that a reading of 200, for instance, indicates that newspaper mentions of
geopolitical risk in that month were twice as frequent as they were during the 2000s.9
We search for articles containing references to any of the six categories of words reported in Table 1.
As described in the next section, we arrive at this set of words after a pilot audit study of articles men-
tioning geopolitical tensions and after isolating the most common unigrams and bigrams in geopolitics
textbooks.10 In doing so, we verify that the defining elements of geopolitics concern territory, countries,
nations, and leadership, and that defining elements of geopolitical risk center around the risk of wars
and terrorism. Building on this characterization, we construct a set of search terms that give us an
index that is robust, sensible, and easily interpretable.
As shown in Table 1, the first four categories of words are related to geopolitical threats and tensions,
9 A monthly reading of 100 for the index corresponds to about 350 articles per month containing terms related togeopolitical risk. The companion dataset reports the total number of articles across newspapers in each month. Thenumber of articles is around 70,000 since the early 1990s. For one representative newspaper, this corresponds to about200 articles per day, of which about one in 300 mentions, on average, terms related to geopolitical risk. As a comparisonbenchmark, one in 500 articles mentions the Beatles, and one in 300 articles mentions the Federal Reserve.
10 For instance, the book “Introduction to Geopolitics” (Flint, 2016) contains 48,759 bigrams, of which the most commonones are “geopolit code”, “world leader”, “unit[ed] states”, “world leadership”, “war [on] terror”, “modelski model”,“geopolit agent”, “cold war”, “soviet union”, “world war”, and “foreign polic[y]”. The book “The Geopolitics Reader”(Dalby, Routledge, and Tuathail, 2003), which is a compendium of 39 geopolitics essays written by different authors,contains 91,210 bigrams, of which the most common ones are “unit[ed] states”, “cold war”, “foreign polic[y]”, “nationsecur[ity]”, “world war”, “world order”, “nation[al] state”, “gulf war”, “war II”, and “nuclear weapon”.
7

while the last two categories are related to geopolitical events and acts.11 Group 1 includes words that
explicitly define geopolitical risk, as well as describe military-related tensions involving large regions
of the world and the United States. The associated articles not only describe geopolitical risks with a
direct US involvement (e.g. the Gulf Wars), but also regional tensions among two or more countries
with a US diplomatic involvement. Group 2 includes words describing nuclear tensions. Groups 3 and
4 include words that describe war threats and terrorist threats, respectively. Finally, groups 5 and 6
aim at capturing press coverage of actual geopolitical events as opposed to just risks. Importantly, the
words included in these groups describe negative events—the start of a war—as opposed to positive
events—for instance the end of a war or peace talks.
Searching directly for geopolitical events in groups 5 and 6 plays an important role in our analysis
for two reasons. First, geopolitical events often spark an increase in geopolitical risk. For instance, a
terrorist attack increases the risk of future attacks. Hence, searching directly for events rather than risk
can help obtaining a more precise identification of the timing of some risk-inducing shocks. Second, in
assessing the impact of geopolitical risk, we want to control for the direct impact that the event itself
might have. For this reason, as described below, we create two sub-indexes that measure geopolitical
threats and acts separately.
Figure 1 presents the GPR index. The index is characterized by several spikes corresponding to key
geopolitical events. The first spike is recorded in April 1986 and it corresponds to the terrorist escalation
that led to the US bombing of Lybia. The second spike happens during the Iraq invasion of Kuwait
and the subsequent Gulf War. The index spikes again at the beginning of 1998, during a period of
escalating tensions between the United States and Iraq. It then stays low until 9/11. The index reaches
its maximum during the 2003 invasion of Iraq. Since 2003, the index rises in correspondence of major
terrorist events in Europe, like the March 2004 Madrid bombing, the July 2005 London bombing, and
the November 2015 Paris terror attacks. The index also rises in 2014, during the Russian annexation
of the Crimea peninsula and the escalation of ISIS military operations in Iraq and Syria.
Figure A.1 in the Appendix elaborates further on the contribution of each component to the index.
Nuclear threats are disproportionately more important prior to the end of the Cold war, and gradually
subside after 1989. By contrast, terror threats trend higher over the sample period, spiking after 9/11,
and remaining at elevated levels ever since. Interestingly, while “war threats” and “war acts” appear
11 We refrain from including in the search words containing proper nouns, except for “United States” and the namesof the four largest continents. We do so because we want to guard our search against the possibility that terms relatedto geopolitical risks may cease to be such for a limited period of time. For instance, although the name “Adolf Hitler”may have correctly identified geopolitical risks in the 1930s, it is far more often associated today to books, movies andhistorical accounts of the World War II, and is best left out of the searches. The same is often true of many politicalleaders or figures once they die, or are jailed, or retire from office.
8

to move somewhat in sync throughout the sample, mentions of “terrorist threats” seem to increase
proportionally to mentions of actual terrorist acts since 9/11.
Since spikes in risk often coincide with the realization of big events, the GPR index—as well as
many other uncertainty indexes—captures a convolution of shocks to first and higher order moments.
We attempt to isolate the effects of pure geopolitical risk by constructing two indexes: the geopolitical
threats index (GPT) and the geopolitical acts (GPA) index. The GPT index is constructed by searching
articles that include words in groups 1 to 4, while the GPA index searches only for groups 5 and 6.
Figure 2 plots the two indexes. The GPT and GPA indexes display a high degree of comovements, with
a correlation of about 0.6. In particular, nearly all spikes in the GPA index coincide with spikes in the
GPT index. Nonetheless, there is also a non-trivial amount of independent variation. In particular, the
GPT index rises in the months prior to major events—for instance the two Gulf wars—and in some cases
remains elevated after the event has ended. We will exploit this independent variation to disentagle the
effects of geopolitical acts and threats in the VAR analysis presented in Section 4.
Finally, Figure 3 displays GPRH, the monthly long-span index. The long-span index closely mimics
the benchmark index for the period in which the coverage overlaps, with a monthly correlation of 0.95.12
As for the baseline GPR index, every major spike in the index can be associated with episodes of rising
geopolitical tensions. The index stays elevated during the two world wars and peaks at the onset of
both of them. Figure A.2 in the Appendix further illustrates how the components in the measure of
historical geopolitical risk have evolved over the last 115 years. Early in the sample, the index rises
and stays high during World War I and World War II, and phrases directly related to the conflict itself
dominate the index. The index stays at high levels between the 1950s and the 1980s, at a time when the
threat of a nuclear war and rising geopolitical tensions between countries become more prevalent than
wars themselves. Since the 2000s, terrorist events have come to dominate the index, alongside rising
bilateral tensions among countries. Indeed, the index reaches the highest values at the start of World
War I and II, and around 9/11.
2.3 Audit
The construction of any index based on automated text-searches raises concerns about accuracy and
bias. We explain how we address these concerns by describing our audit process. To preview the results,
human reading of 11, 000 newspapers articles as well as comparison to external proxies confirms that
12 To capture shifts in the usage of particular words over time, we add to the search category “War Threats”: {(war ORmilitary) N/3 (crisis OR uncertain*)}, and {(“war effort*” OR “military effort*”) AND (risk* OR threat* OR fear*)}.We add to the search category “War Acts”: {“state of war”}, and {“declaration of war”}.
9

the index accurately captures movements in geopolitical risk.
The sample of newspaper articles used to construct the index—denoted by U—contains about 65, 000
news articles each month. After an initial reading of a few hundred articles selected at random from
U , we concluded that the largest payoff to an audit study involved selecting and evaluating articles
that talked about geopolitics, war, and terrorism, as articles that mention these words related to rising
geopolitical risks often cover different topics such as anniversaries or declining risks. Accordingly, the
audit was conducted from a subset of U—denoted by E—consisting of articles that contain any of the
following words: geopolitics, war, military, terrorism/t. This choice of word reflects our definition of
geopolitics and geopolitical risks, and is also supported by an analysis of the most common unigrams
found in books on the subject of geopolitics.13 The sample E contains about 8, 000 articles per month,
about 15% of the articles in U .
Pilot Audit. We conducted the pilot audit as follows. We randomly selected 50 months between
1985M1 and 2016M12. For each month, we randomly selected 50 articles from the sample E . Together
with a team of research assistants, we read each of these 2,500 articles and assigned them to the set E1
if they mentioned high or rising geopolitical tensions, and to the set E0 otherwise. We found that about
half of the articles in E discussed high or rising geopolitical risks, with the remaining half being false
positives. Additionally, the fraction of false positives is very volatile, with a monthly standard deviation
of 17%, thus indicating that a very broad search is likely to be contaminated by high noise-to-signal
ratio. For instance, the fraction of false positives averages around 80 percent in the months after the
end of the Gulf War, when newspaper coverage of the Gulf War is very extensive, but a substantial
majority of articles cites declining tensions, peace initiatives after Saddam Hussein’s withdrawal from
Kuwait, and the importance of the UN mandate to maintain peace and stability in the region.
The pilot audit served two purposes. The first purpose was to identify words that would allow an
automated search algorithm to differentiate between articles belonging to E1 and those belonging to
E0. To this end, we scanned the abstracts of the audited articles and used text analytics techniques
to identify the bi-grams that appeared more frequently in articles belonging to the set E1 and E0.14
Using Bayes’ rule, we computed the odds ratio of an article belonging to E1 instead of E0 given that it
contains each bi-gram. We used the list of bi-grams with the highest odd ratio as an input to choose
13 For instance, the most common word roots in Flint (2016) textbook “Introduction to Geopolitics” (Flint, 2016) are“geopolit”, “war”, “nation”, “terror”, “polit”, and “countri”, and “global”. Similarly, the most common word roots inSamuel Huntington’s classic book on the ‘Clash of Civilizations ’(Huntington, 1997) are “civil”, “war”, “cultur”, “polit”,“power”, “econom”, “societi”, “conflict”.
14 Prior to selecting bi-grams, we filter out stop words and proper names, including names of countries, cities, andpolitical organizations. For each bi-gram, we can calculate the probability that the bi-gram signals an article belongingto E1 using Bayes’ rule.
10

the group of search words that are listed in Table 1. We also found the bi-grams that have the highest
odds ratio of beloning to the set E0. For instance, most false positives are articles written at times of
anniversaries—such as the centenary of the First World War in 2014)—upon death of historical figures,
at the time of books’ publication and movies’ releases, and other art events that are connected to wars,
terrorism, and other episodes of important historical relevance. We used this list of bi-grams to choose
words that articles should not contain in order to be included in the index.15 The second purpose of the
pilot audit was to create a detailed audit guide to be used during the full-scale audits discussed next.16
To develop the audit guide and to identifying coding difficulties, we assigned 10 months to multiple
auditors.
Full-Scale Audit. The full-scale audit involved the construction of a human-generated GPR index
and the evaluation of the computer-generated GPR index. To construct a human-generated GPR
index, we randomly sampled 6,125 articles from E , on average about 50 articles per quarter. For each
quarter, we calculated the fraction of articles assigned to E1, multiplied this fraction by the quarterly
rate E/U , and normalized the resulting index to 100 over the 2000-2009 period. Figure 4 shows that
our computer index lines up well with an index that could be constructed by intelligent humans. The
correlation between the two series is 0.837, a value that is remarkably high when one takes into account
the sampling uncertainty. Figure A.4 shows a high correlation—0.86 when we aggregate the data at
annual frequency, and 0.78 at quarterly frequency—when we repeat the same exercise using historical
data, and a random sample of 7,416 articles, from 1899 through 2017.
To evaluate the computer-generated GPR index, we randomly sampled 50 articles from 50 different
months from the set of articles selected by the automated text-search algorithm, and classified them
as either discussing high or rising geopolitical tensions or not. About 87 percent of the articles that
constitute the computer-generated GPR mention high or rising geopolitical risks. For the 50 months
that we sample, the correlation between the human-audited GPR index and the benchmark GPR index
is 0.98. The error rate—the fraction of articles that do not discuss rising geopolitical risks—is essentially
uncorrelated with the GPR index itself as well as with other macroeconomic variables.
Finally, we construct three variants of the GPR index based on a broader and narrower set of articles,
as well as on a very parsimonious choice of search words. These indexes—which we name broad, narrow,
and simple— are discussed in Appendix B and plotted in Figure A.7. As the figure shows, the index is
robust to the inclusion and exclusion of specific phrases and synonyms.
15 The set of words that are highly likely to signal false positives are “civil war”, “human rights”, the word “war” in closeproximity of the word “end” (end N/2 war), the phrase “air force”, the words “movie”, “film”, “museum”, “anniversary”,“memorial” and “art”.
16 The audit guide is available at https://www2.bc.edu/matteo-iacoviello/gpr_files/audit_guidelines_GPR.
pptx.
11

One way of summarizing the outcome of our audit process is to link it to the work of Saiz and
Simonsohn (2013). These authors state a number conditions that must hold to obtain useful document-
frequency based proxies for variables, such as geopolitical risk, that are otherwise difficult to measure.
As described in Appendix C, our index satisfies these conditions, and thus we can reasonably argue that
the GPR index is a robust and reliable measure of geopolitical risk.
3 Understanding the GPR Index
In this section, we first discuss what type of risks is the GPR index likely to capture and whether
biases in media coverage of some events can distort our measure. We then compare the GPR index
to alternative proxies of geopolitical risks. Finally, we compare the GPR index to popular measures of
economic uncertainty.
3.1 What Are We Measuring?
A crucial aspect that concerns the measurement of geopolitical risk is that exposure to such risk varies
both geographically and by sector of the economy. The index captures geopolitical events and risks as
perceived and chronicled by the press in English-speaking countries, and in particular in the United
States: To construct the index, we use eight American, two British, and one Canadian newspaper.
Moreover, one of the search categories measures regional tensions with US involvement.
Thus, a narrow interpretation of the index is that it captures geopolitical risks as perceived in
the United States, Canada, and the UK. At the same time, we search newspapers that have wide
geographical coverage and routinely reprort on international events. Furthermore, geopolitical events
that involve the United States and their interests abroad have global implications. Hence, a broader
interpretation is that the index is also a good proxy for global geopolitical risk.
Additionally, the use of press coverage has the potential to induce fluctuations in, or exceedingly high
levels of, the GPR index even if the underlying geopolitical risk factors remain constant due to either
changes in geopolitical-related risk aversion of the public or to state-dependent bias in news coverage.
For example, the high levels in the years following 9/11 may reflect public fear towards geopolitical
tensions more than actual risk.
To formally test this hypothesis, we purge our geopolitical risk index from fluctuations in geopolitical
risk that are driven by event that are exogenous to geopolitical risk and are likely to receive large
media attention. Following Jetter (2017), we use natural disasters as an instrument that exogenously
diminishes media coverage of other events, including geopolitical events. If underlying geopolitical risks
12

are constant and our index moves only in reaction to media slant towards geopolitical risk, one should
expect that natural disasters can explain our GPR index, and that the component of geopolitical risk
that is explained by natural disasters is a measure of the media attention towards geopolitical risk.
In the top panel in Figure A.3 in the Appendix, we compare the GPR index with a news-based index
of natural disasters, constructed using media mentions of words related to natural disasters (such as
tsunamis, hurricanes, and earthquakes). The correlation between geopolitical risk and natural disasters
is -0.07, and not statistically different from zero at conventional significance levels. The bottom panel
plots the fitted values of a regression of the GPR index on the news-based index of natural disasters,
and shows that the explenatory power of the latter is negligible. This finding suggests that mentions of
geopolitical risks are not systematically varying in response to other exogenous events that might divert
media attention from chatter about geopolitical risk. For this reason, we do not attempt at separating
the actual underlying risk factors from the public and media perception of the risk itself, as there are
reasons to believe that the two are very highly correlated.
3.2 Alternative Measures of Geopolitical Risks
Several studies have used various proxies to construct quantitative measures of risk that speak to
concerns specific to wars or terrorist-related events. A widely used database is the ICB annual database,
which provides detailed information on 447 major international political crises that occurred over the
period 1918–2016. This database has been used in the political science literature, as well as in studies
on war and economics. One example is the work by Berkman, Jacobsen, and Lee (2011), who use the
ICB database to create a crisis index that adds up, for each year, the total number of crises. The top
panel of Figure 5 compares the historical GPR index with the count of international crises per month
according to the ICB database (to reduce high–frequency noise, both indexes are plotted at quarterly
averages). While this crisis index has some correlation with the GPR index, it would be a very crude
proxy of geopolitical instability. For instance, the value of the index is below its historical average before
and during the Second World War.
The middle-top panel of Figure 5 compares our index to two alternative indicators that offer a
different perspective on the threats coming from geopolitical risk. The two indicators are deaths due to
terrorist attacks (1) in the world and (2) in the United States and Europe combined. The latter are likely
to receive more press coverage in the English-speaking press.17 Both series appear to be uninformative
17 The data on terrorism-related deaths largely exclude wars, but the distinction appears mostly semantic as the dividingline between wars and terrorism has been blurred at least since 9/11. The data are from the Global Terrorism Database(GTD), which is an open-source database including information on terrorist events around the world.
13

about overall movements in the GPR index. However, all indexes spike around 9/11 and the somewhat
elevated level of the GPR index in 2015 and 2016 appear to reflect a rise in the worldwide number of
deaths due to terrorism, alongside heightened media attention to conflicts in the Middle East.
The middle-bottom panel of Figure 5 compares the GPR index with the national security component
of the economic policy uncertainty index (EPU) constructed by Baker, Bloom, and Davis (2016). Like
our measure, the national security EPU spikes during the Gulf War, after 9/11, and during the Iraq
war. However, the GPR index seems to better capture other spikes in geopolitical risk that are missed
by the national security EPU. The correlation between the two measures is 0.69, a plausible value since
the national security component of the EPU captures uncertainty about policy responses about events
associated to national security (of which geopolitical events are a subset), which is a different concept
from the uncertainty generated by geopolitical events.18.
Finally, the bottom panel of Figure 5 compares the GPR index with an outside measure of political
risk related to wars, the U.S. External Conflict Rating (ECR) constructed by the International Country
Risk Guide (ICRG). The ratings constructed by the ICRG are largely subjective, as they are based on the
insights of various analysts following developments in a particular country or region. The ECR measure
moves only occasionally over the sample, changing on average once a year, with more pronounced
movements and more frequent changes around 9/11, when both the GPR index and ICRG index spike.
The correlation between the two series is 0.41.
3.3 Relation to Popular Measures of Economic Uncertainty
Figure 6 compares the benchmark index with two other popular measures of uncertainty: the VIX and
the economic policy uncertainty (EPU) index of Baker, Bloom, and Davis (2016). All indexes share
two common spikes: in 1991, at the time of the Gulf War, and in 2001, after the 9/11 terrorist attacks.
However, in both cases it seems plausible to argue that the correlation runs from geopolitical events to
stock market volatility and policy uncertainty. Similarly, the 2003 US invasion of Iraq and the 2015 ...
seem to cause an increase in EPU, while they do not induce financial volatility.
The three indexes also feature a large amout of independent variation. The GPR index does not
move during periods of economic and financial distress, such as at the onset of the dotcom bubble
and during the global financial crisis, when both the VIX and the EPU index rise sharply and remain
elevated. Similarly, the GPR index does not move around presidential elections, periods characterized
18 Another relevant database is the Militarized Interstate Disputes Dataset, which records all instances of when one statethreatened, displayed, or used force against another. This dataset is only available with several years delay and is onlyavailable annually. See http://cow.dss.ucdavis.edu/data-sets/MIDs. Other papers have performed news–searcheslooking for early warning signals for wars. See for instance Chadefaux (2014).
14

by elevated policy uncertainty.
Summing up, compared to the VIX and the EPU index, the GPR index captures events that (i) are
more likely to be exogenous to the business and financial cycles, and (ii) could give rise to heightened
financial volatility and policy uncertainty. This comparison motivates the identification assumptions
used in the Structural VAR analysis described in the next section.
4 Economic Effects of Geopolitical Risk
4.1 Overview
This section presents our main results. We first estimate a battery of structural VAR models, which we
use to track the macroeconomic and financial implications of an exogenous rise in geopolitical risk. We
then test whether global stock market returns depend on geopolitical risk. Finally, we estimate a panel
regressions to unveil whether geopolitical risk affects international capital flows.
4.2 VAR Results
Our main VAR specification—which we estimate on data from 1985M1 through 2016M12—aims at
characterizing the economic effects of high geopolitical risk on the US economy. The model consists of
nine variables: (1) the GPR index; (2) the EPU index of Baker, Bloom, and Davis (2016); (3) consumer
sentiment from the University of Michigan Survey of Consumers; (4) the log of US industrial production;
(5) the log of nonfarm payroll employment; (6) a measure of US gross trade, namely the log of US import
plus exports; (7) the Standard and Poors 500 index, expressed in real terms dividing by the US CPI
index; (8) the log of the West Texas Intermediate price of oil, also expressed in real terms dividing by the
US CPI index; (9) the yield on 2 year US treasuries. We also estimate bivariate VAR models consisting
of the GPR index and IP for various countries.19 All VAR models presented in the paper are estimated
using Bayesian techniques. We impose a Minnesota prior on the reduced-form VAR parameters by
using dummy observations as in Del Negro and Schorfheide (2011) . The resulting specification, which
includes a constant, is estimated using twelve lags of the endogenous variables.20
19 We estimate bivariate models as the IP responses to the GPR shock were robust to use of larger models. Yet, the lackof availability of long time series data for some advanced and emerging economies made us opt for a simple specification.In addition, similar impulse responses can be estimated by simple local projections.
20 The vector of hyperparameters of the Minnesota prior is λ = [1, 3, 1, 1, 1]. We use the first year of the sample asa training sample for the Minnesota prior. All the results reported in the paper are based on 10,000 draws from theposterior distribution of the structural parameters, where the first 2,000 draws were used as a burn-in period.
15

We identify the structural shocks by using a Cholesky decomposition of the covariance matrix of the
VAR reduced-form residuals, ordering the GPR index first. The ordering implies that the GPR index
reacts contemporaneously only to its own shock. Hence, any contemporaneous correlation between
the macro variables and the GPR index reflects the effect of the GPR on the macro variables. The
characteristics of the GPR index discussed in Section 2—as well as the comparison to the EPU index
in Section 3—lend support to this assumption. Nonetheless, in Section D we explore robustness to an
alternative Cholesky ordering, as well as to alternative specifications of the baseline VAR model.
The solid lines in Figure 7 show the median impulse responses to an exogenous increase in the GPR
index of 167 points, while the light and dark shaded areas represent the corresponding 68 and 90 percent
pointwise credible bands, respectively. The size of the shock equals the average change in the index
following the nine episodes of largest increases in the GPR index.21 The rise in the GPR index induces
a small and short-lived increase in the EPU index and a decline in consumer sentiment. Intuitively,
geopolitical risk can induce some economic policy uncertainty on items such as national security and the
fiscal budget and negatively weigh on consumer sentiment. On the real side, IP responds quickly to the
increase in geopolitical risk, bottoming out at 0.9 percent after about 6 months, and converges slowly
back to trend. The deterioration in labor market condition, while substantial, is a bit more gradual,
with payroll employment reaching a trough of −0.4 nearly a year after the shock. Gross trade contracts,
with US import and exports dropping by little less than 2 percent.
On the financial side, the response of the stock market is economically and statistically significant,
dropping by 2.8 percent on impact and remaining below average for a little over 3 months. The
increase in the GPR leads to a decrease in oil prices, which bottom out at 7 percent below trend
after 3 months. This result stands in contrast with much of the conventionally held view that higher
geopolitical risk drives up oil prices persistently, a view that might reflect a selective memory that
confounds all geopolitical tensions with “oil supply shocks driven by geopolitical tensions in the Middle
East.” . Finally, the yield on 2-year Treasuries declines by about 20 basis points, indicating both a
worsening of the macroeconomic outlook and a loosening of the monetary policy stance.
A useful way to assess the exposure to GPR of various sectors of the US economy is depicted in
Figure 8. We add to the VAR model a tenth variable, which measures the cumulative excess return
between firms in given industries and the S&P 500. The solid lines show the excess return for 6 industries.
The defense industry—which is directly exposed to geopolitical risk—records a positive but short-lived
excess return; by contrast, industries that are exposed to the overall US economy—such as aircraft,
21 These episodes are U.S. bombing of Lybia in 1986, the Kuwait Invasion, the Gulf War, the 1998 Iraq DisarmamentCrisis, 9/11, the risk of Iraq invasion in 09/2002, the 2005 London bombings, the Russian annexation of Crimea, and the2015 Paris terrorist attacks.
16

steel works and mining–display negative and somewhat persistent negative returns. Interestingly, the
oil industry, which some commentators argued could benefit from wars, especially in the Middle East,
display an initial positive excess return followed by a persistent decline, a response that mimics the path
of oil prices. The insurance industry, which we included as it could have some exposure to geopolitical
risk, moves in sync with the overall US stock market and thus it does not display any excess return.
On the international side, Figure 9 shows that an increase in the GPR index has real effects outside
the US. The black lines in the top row depict the median response of world IP, advanced economies IP,
and emerging economies IP;22 the bottom row depicts the response of IP for Canada and the United
Kingdom—as we used newspapers from these two countries in the construction of the index—and for
Mexico, an emerging economy selected for its large exposure to the US economy. These responses
suggest that a GPR shock has global consequences—world IP declines by about 0.5 percent 1 year
after the shock—but its effects are mostly concentrated in advanced economies. By contrast, emerging
economies, on average, do not respond to geopolitical risks. Yet, Mexico—possibly through its large
exposure to US trade—experiences a modest but persistent decline in real activity.
4.3 Threats vs Acts
Next, we evaluate the difference between innovations in the two broad components of the GPR index, the
geopolitical acts (GPA) index, and the geopolitical threats (GPT) index. We do so by replacing the GPR
index with the GPA and GPT indexes in the VAR estimated on US data. To achieve identification,
we use a Cholesky ordering with the GPA index ordered first, and the GPT index ordered second.
We interpret the first shock as the realization of some geopolitical acts that can induce an increase
in geopolitical threats; we interpret the second shock as capturing geopolitical threats that are not
contemporaneously associated to geopolitical acts, for instance threats building up before wars or after
terrorist attacks.
The impulse responses to the GPA and GPT shocks are shown for selected variables in Figure 10.
In presenting the results, we adopt the following exposition scheme, which is best viewed in color.
Specifically, the responses to the GPA shock are plotted using a green-based color motif, while the
responses to the GPT shock are plotted using a red-based color motif.
Starting from the responses of the three uncertainty proxies, a GPA shock of size 288—a shock sized
to be equal to the 7 largest spikes in GPA—induces an initial increase in the GPT and EPU indexes,
followed by a period of below-average GPT and EPU that lasts for about about a year. Thus, these
22 Caldara, Cavallo, and Iacoviello (2016) provide details on the construction of the IP indexes for advanced and emergingeconomies.
17

responses are consistent with the realization of acts leading to the resolution of threats and uncertainty.
By contrast, a GPT shock leads to a persistent increase in GPT–which remains above average for over a
year—and in EPU. The GPA index, which by assumption does not move on impact, increases for about
a year, as in our sample many geopolitical threats precede geopolitical acts.
The responses show that the GPA and GPT shocks have asymmetric effects on the US economy.
The GPA shock leads to a small but short-lived decline in economic activity and trade, whereas the
stock market rises sharply one month after the shock. By contrast, an innovation to the GPT produces
large and protracted recessionary effects, as well as a decline in stock prices. The response of the stock
market lends support to the old idea, attributed to London financier Nathan Rothschild, that one should
buy on cannons and sell on trumpets.
Figure 11 further elaborates on the asymmetric response of the stock market by depicting the
response of cumulative excess returns in six industries to GPA and GPT shocks. Excess returns in all
industries feature an asymmetric response, albeit to a various degree. The defense industry features
the largest asymmetry: defense companies, on average, make an excess return of about 5 percent for
more than two years following a GPA shock, while they make only a modest and short-lived excess
return following a GPT shock. By contrast, the asymmetry in excess returns for insurance companies
is economically modest.
One possible interpretation of the asymmetric effects of shocks to acts and threats is that that the
act component of GPR leads to a resolution of the uncertainty around a particular set of events, as
well as to a coordinated policy response that ends up giving protection on the worst possible outcomes.
By contrast, threat shocks depress asset prices and economic activity because they increase uncertainty
and send signals about future adverse events.23
4.4 Geopolitical Risk and Capital Flows
We now present additional evidence on the global economic consequences of changes in geopolitical
risk, by showing how it affects capital inflows in a sample of advanced and emerging economies. The
procyclical and volatile nature of capital flows makes them a leading policy concern, especially in
economies which rely heavily on external funds. We use country-level, quarterly data on capital inflows
from the IMF’s Balance of Payments Statistics database. The sample consists of 22 advanced economies,
23 emerging economies and the US. Our sample covers the period from 1990Q1 through 2015Q4.
Our baseline specification tests whether movements in geopolitical risk have any explanatory power
for gross capital inflows. We choose gross capital inflows—purchases of domestic asset by foreign
23 See Pastor and Veronesi (2013) for a model of political uncertainty and risk premia.
18

residents—in line with a large and growing body of empirical evidence that shows that gross capi-
tal flows respond systematically to changes in global conditions, and in line with the notion that our
measure of geopolitical risk is more likely to matter for the economic decisions of global investors on
where to allocate capital across countries.24 Our regression takes the form:
yi,t = αi + ρ1yi,t−1 + βGPRt + ΓXt + ui,t, (1)
where yi,t = inflows i,t/GDPi,t are gross capital inflows divided by annualized GDP, αi are country
fixed effects and Xt is a vector of control variables. We estimate equation (1) separately for emerging
economies, advanced economies excluding the United States, and the United States. Throughout, we
assume that the effect of GPR on capital inflows is equal within each group of countries. Following
the work of Ahmed and Zlate (2014), our model specification includes the VIX to control for global
economic risk and lagged GDP growth to control for country-level persistence in economic growth.
Table 2 reports the results. Comparing columns (1) and (2) of the table, an increase in GPR has
different effects on capital inflows in emerging versus advanced economies. In emerging economies, a
1 standard deviation increase in the GPR reduces capital inflows by 0.25 percentage points, while an
equally sized increase in the VIX reduces capital inflows by 0.91 percentage points. By contrast, for
advanced economies, increases in the VIX reduces capital inflows, whereas increases in GPR lead to an
increase in capital inflows. In column (3), the effect of changes in geopolitical risk in the United States
is modest, and not statistically different from zero. As expected, the coefficient on the VIX is negative
across all specifications. Additionally, the coefficient on lagged GDP growth is positive.
4.5 Geopolitical Risk and Stock Returns
In this section, we examine the reaction of country-specific stock market returns to changes in geopolitical
risk. We do so both for the sample covered by the benchmark GPR index and for the sample covered
by the historical GPR index.
The baseline econometric specification echoes the work of Berkman, Jacobsen, and Lee (2011). These
authors find that disaster risk depresses stock returns. Their measure of disaster risk is the crisis index
constructed using data from the International Crisis Database discussed in Section 3 and plotted in
Figure 5. Since their measure of disaster risk is tightly linked to geopolitical events, in this section we
24 See Forbes and Warnock (2012) and Ahmed and Zlate (2014) for recent discussion of the focus on gross vs. netcapital flows. As discussed in Ahmed and Zlate (2014), whether to look at net capital inflows or gross capital inflows is anopen question. Conceptually, global geopolitical risk should more directly relevant for the investment decisions of foreigninvestors. For this reason, we focus on gross capital inflows. Note that gross capital inflows measure flows of both debtand equity capital from foreign investors and lenders, and that capital withdrawals are subtracted.
19

ask whether using our proxy—which displays only a weak correlation with their crisis index— we can
confirm a significant relationship between geopolitical risk and stock returns.
We obtain data on monthly stock returns based on general market price indexes from Global Finan-
cial Data. We select 17 countries for which data before World War II are available. The world stock
price index is the Morgan Stanley Capital International (MSCI) index from 1970. Prior to 1970, world
returns are calculated using the weighted average of country-specific returns. Nine countries have data
starting before World War I. Many countries included in our regressions have gaps in the coverage that
range from one month to over a year. Since these gaps partly coincide with World War II—as some stock
markets did not operate in those years—we decided to use all available information. In the Appendix
we show an alternative estimation with the sample starting in 1950 for all countries, a starting date
that avoids gaps in coverage.
Consequently, we estimate the following set of country-by-country regressions
ri,t = µi + αiGPRSHOCKt + εi,t, (2)
where ri,t is stock market return in country i in month t, and GPRSHOCKt is the residual of an
autoregressive process of order 1 estimated for the GPR index. An advantage of the GPR index over the
crisis index of Berkman, Jacobsen, and Lee (2011) is that, by having substantially more time variation,
allows estimating this regression over relatively short samples.Thus, in Table 3 we report results for
two samples, starting in 1985 and starting prior to World War II (with starting year varying across
countries).
Using the baseline GPR index since 1985, we find that geopolitical risks have a strong negative
impact on stock returns in virtually all advanced economies. An increase in geopolitical risk of 100
units reduces world stock returns, on average, by 1.23 percent. Stock returns in some countries, such
as Australia, Finland, and Japan, react less to changes in geopolitical risks. By contrast, European
countries like France, Germany, and Italy seem to be highly exposed to this risk. The UK and the US
display a lower exposure compared to other European countries, but the response of stock returns is
both economically and statistically and significant.
As shown in columns (3) to (5) of the table, the effects are significant also for the historical sample,
although the elasticity of stock returns is, on average, smaller and less statistically significant than
for the short sample. Interestingly, the historical results are broadly consistent with the evidence in
Berkman, Jacobsen, and Lee (2011), even though magnitudes are difficult to compare given the very
different nature of the two indexes.
20

5 Conclusions
We construct a monthly index of geopolitical risk. This index captures an important dimension of
uncertainty: the risk that events might happen that disrupt the normal and peaceful course of relations
across states, populations, and territories.
It is often said that most of the enduring progress of many advanced economies in the last century
owes to peace, democracy, and the creation of institutions for the collective action of countries in
response to social and economic threats, and that collective prosperity and economic development
preserve peace, cooperation and goodwill among countries. Our index captures one of the extreme risks
posed by humans to such progress.
21

References
Ahmed, S., and A. Zlate (2014): “Capital flows to emerging market economies: a brave new world?,”
Journal of International Money and Finance, 48, 221–248. [19]
Bachmann, R., S. Elstner, and E. R. Sims (2013): “Uncertainty and Economic Activity: Evidence
from Business Survey Data,” American Economic Journal: Macroeconomics, 5(2), 217–249. [5]
Baker, S. R., N. Bloom, and S. J. Davis (2016): “Measuring Economic Policy Uncertainty*,” The
Quarterly Journal of Economics, 131(4), 1593. [2, 14, 15, 32, 33, A.2, A.13, A.14, A.15]
Berkman, H., B. Jacobsen, and J. B. Lee (2011): “Time-varying rare disaster risk and stock
returns,” Journal of Financial Economics, 101(2), 313–332. [13, 19, 20]
Blomberg, S., G. D. Hess, and A. Orphanides (2004): “The macroeconomic consequences of
terrorism,” Journal of Monetary Economics, 51(5), 1007 – 1032. [4]
Bloom, N. (2009): “The Impact of Uncertainty Shocks,” Econometrica, 77(3), 623–685. [5]
Caldara, D., M. Cavallo, and M. Iacoviello (2016): “Oil Price Elasticities and Oil Price
Fluctuations,” Mimeo, Federal Reserve Board. [17]
Caldara, D., C. Fuentes-Albero, S. Gilchrist, and E. Zakrajek (2016): “The macroeco-
nomic impact of financial and uncertainty shocks,” European Economic Review, 88(C), 185–207. [5]
Carney, M. (2016): “Uncertainty, the economy and policy,” Bank of England. [2]
Chadefaux, T. (2014): “Early warning signals for war in the news,” Journal of Peace Research, 51(1),
5–18. [14]
Dalby, S., P. Routledge, and G. O. Tuathail (2003): The geopolitics reader. Routledge. [7]
Del Negro, M., and F. Schorfheide (2011): “Bayesian Macroeconometrics,” in Handbook of
Bayesian Econometrics, ed. by H. van Dijk, G. Koop, and J. Geweke, pp. 293–389. Oxford University
Press. [15]
Eckstein, Z., and D. Tsiddon (2004): “Macroeconomic consequences of terror: theory and the case
of Israel,” Journal of Monetary Economics, 51(5), 971 – 1002. [5]
Flint, C. (2016): Introduction to geopolitics. Routledge. [6, 7, 10]
22

Forbes, K. J., and F. E. Warnock (2012): “Capital flow waves: Surges, stops, flight, and retrench-
ment,” Journal of International Economics, 88(2), 235–251. [19]
Gilchrist, S., J. W. Sim, and E. Zakrajek (2014): “Uncertainty, Financial Frictions, and Invest-
ment Dynamics,” Working Paper 20038, National Bureau of Economic Research. [5]
Glick, R., and A. M. Taylor (2010): “Collateral damage: Trade disruption and the economic
impact of war,” The Review of Economics and Statistics, 92(1), 102–127. [4]
Huntington, S. P. (1997): The clash of civilizations and the remaking of world order. Penguin Books
India. [10]
Jetter, M. (2017): “The effect of media attention on terrorism,” Journal of Public Economics, 153,
32 – 48. [12]
Jurado, K., S. C. Ludvigson, and S. Ng (2015): “Measuring Uncertainty,” American Economic
Review, 105(3), 1177–1216. [5]
Lenain, P., M. Bonturi, and V. Koen (2002): “The economic consequences of terrorism,” . [5]
Ludvigson, S. C., S. Ma, and S. Ng (2015): “Uncertainty and Business Cycles: Exogenous Impulse
or Endogenous Response?,” NBER Working Papers 21803, National Bureau of Economic Research,
Inc. [5]
Pastor, L., and P. Veronesi (2013): “Political uncertainty and risk premia,” Journal of Financial
Economics, 110(3), 520 – 545. [18]
Saiz, A., and U. Simonsohn (2013): “Proxying for unobservable variables with internet document-
frequency,” Journal of the European Economic Association, 11(1), 137–165. [2, 12, A.2]
Scotti, C. (2016): “Surprise and uncertainty indexes: Real-time aggregation of real-activity macro-
surprises,” Journal of Monetary Economics, 82(C), 1–19. [5]
Tavares, J. (2004): “The open society assesses its enemies: shocks, disasters and terrorist attacks,”
Journal of Monetary Economics, 51(5), 1039 – 1070. [4]
23

Table 1: Search Groups — Benchmark GPR Index
Search Category Words
1. Geopolitical Threats Geopolitical AND (risk* OR concern* OR tension* OR uncertaint*)
“United States” AND tensions AND (military OR war ORgeopolitical OR coup OR guerrilla OR warfare) AND (“LatinAmerica” OR “Central America” OR “South America” OR EuropeOR Africa OR “Middle East” OR “Far East” OR Asia)
2. Nuclear Threats(“nuclear war” OR “atomic war” OR “nuclear conflict” OR “atomicconflict” OR “nuclear missile*”) AND (fear* OR threat* OR risk*OR peril* OR menace*)
3. War Threats“war risk*” OR “risk* of war” OR “fear of war” OR “war fear*” OR“military threat*” OR “war threat*” OR “threat of war”
(“military action” OR “military operation” OR “military force”)AND (risk* OR threat*)
4. Terrorist Threats“terrorist threat*” OR “threat of terrorism” OR “terrorism menace”OR “menace of terrorism” OR “terrorist risk” OR “terror risk” OR“risk of terrorism” OR “terror threat*”
5. War Acts“beginning of the war” OR “outbreak of the war ”OR “onset of thewar” OR “escalation of the war” OR “start of the war”
(war OR military) AND “air strike”
(war OR battle) AND “heavy casualties”
6. Terrorist Acts “terrorist act” OR “terrorist acts”
Note: This table lists the combination words searched in the construction of the GPR index. The exact search query,inclusive of words that are excluded from the search, is in the Appendix.
24

Table 2: GPR and Capital Flows
(1) (2) (3)Inflows/GDP Inflows/GDP Inflows/GDP
Variables Emerging Economies Advanced Economies United States
Lagged Inflows 0.29 0.14 0.50(0.06) (0.05) (0.09)
GPR Index, standardized -0.25 0.91 0.42(0.13) (0.32) (0.38)
VIX, standardized -1.08 -1.50 -1.05(0.20) (0.70) (0.45)
Lagged GDP Growth 0.28 1.97 -0.27(0.10) (0.48) 0.71
Constant -20.9 -183.00 32.64(9.54) (47.13) (71.64)
Observations 1,796 2,065 103R-squared 0.157 0.047 0.333Number of Countries 23 22 1Country FE YES YES —Clustered SEs YES YES —
Note: Gross inflows are BOP liabilities, and consist of the nonresidents purchases of domestic assets net of sales. Thesample of advanced economies includes Japan, Germany, France, UK, Italy, Canada, Spain, Australia, Netherlands,Switzerland, Sweden, Belgium, Norway, Austria, Denmark, Greece. Finland, Portugal, New Zealand, Slovakia, Slovenia,Estonia. The sample of emerging economies includes China, Brazil, India, Korea, Mexico, Indonesia, Turkey, Argentina,Venezuela, South Africa, Thailand, Colombia, Malaysia, Israel, Chile, Philippines, Peru, Ecuador, Jordan, El Salvador,Russia, Saudi Arabia, and Latvia. We drop from the sample countries with a standard deviation of inflows to GDPlarger than 50 percent (Hong Kong, Ireland, Singapore, Luxembourg and Iceland). GDP growth is quarter-on-quarterGDP growth, expressed in percentage terms. The sample goes from 1990Q1 through 2015Q4, for a maximum of 104observations per country. Robust standard errors reported in parenthesis. Source: IMF’s Balance of Payments Statisticsdatabase.
25

Table 3: GPR and Stock Market Returns
Country GPR Benchmark GPR Historical
(1) (2) (3) (4) (5)Coefficient Std. Errors Coefficient Std. Errors First Obs.
Australia -0.43 0.51 -0.45 0.31 1900
Belgium -2.24 0.71 -1.02 0.45 1900
Canada -1.09 0.43 -0.91 0.34 1914
Finland -0.75 0.98 -0.30 0.52 1923
France -2.00 0.9 -0.86 0.48 1900
Germany -2.45 0.94 -0.14 0.91 1918
India -1.13 0.98 -0.71 0.74 1922
Italy -2.54 0.94 -1.33 0.55 1905
Japan -0.58 0.59 0.10 0.46 1914
Netherlands -2.17 .85 -0.44 0.55 1919
Peru -1.78 1.62 -0.87 1.04 1933
Portugal -1.62 0.73 -0.39 0.77 1934
Spain -1.41 .83 -0.39 0.47 1915
South Africa -2.25 0.53 -1.23 0.34 1910
Sweden -1.40 0.89 -0.58 0.41 1906
United Kingdom -1.62 0.62 -0.81 0.33 1900
United States -1.32 0.59 -0.62 0.42 1900
World -1.21 0.58 -0.84 0.48 1919
Note: Estimation of individual country effects of geopolitical risk on stock market returns. The table reports the
estimated α’s for the following model: ri,t = µi + αiGPRSHOCKt + εi,t, where ri,t is stock market return in country
i in month t, and GPRSHOCKt is the residual of an AR(1) process estimated for GPR divided by 100, so that the
coefficient measures the percentage impact on stock returns from an innovation in GPR of 100 units. Standard errors are
corrected for autocorrelation using the Newey-West method. Source: Global Financial Data.
26

Figure 1: The Geopolitical Risk Index
0
100
200
300
400
500
600
1985 1990 1995 2000 2005 2010 2015
GPR Benchmark Index (GPR)Index (2000-2009 = 100)
TWA Hijacking
US bombs Libya
US Invasion of Panama
Kuwait Invasion
Gulf War
Iraq Disarmament Crisis 1998
9/11
Iraq invasion
Madrid bombings
London bombings
Iran/Nuclear Tensions
Arab Spring: Syrian & Lybian
War
Syrian Civil War Escalation
Russia annexes Crimea
ISIS Escalation
Paris attacks
North Korea
Note: The line plots the benchmark GPR index.
27

Figure 2: The Geopolitical Risk Index: The Two Sub-Indexes
0
100
200
300
400
500
600
1985 1987 1989 1991 1993 1995 1997 1999 2001 2003 2005 2007 2009 2011 2013 2015
GPR THREATS AND ACTSIndex (2000-2009 = 100)
GPR Threats GPR Acts
TWA Hijacking
US bombs Libya
US Invasion of Panama
Kuwait Invasion
Gulf War
Iraq Disarmament Crisis 1998
9/11
Iraq invasion
Madrid bombings
London bombings
Iran/Nuclear Tensions
Arab Spring: Syrian & Lybian
War
Syrian Civil War Escalation
Russia annexes Crimea
ISIS Escalation
Paris attacks
Note: This figure shows the GPR Threat (GPT) and the GPR Acts (GPA) indexes. The GPT is constructed by searching only articlescontaining words included in groups 1 to 4 in Table 1. The GPA is constructed by searching only articles containing words included in groups 5and 6 in Table 1.
28

Figure 3: The Historical Geopolitical Risk Index
0
100
200
300
400
500
600
700
1900 1910 1920 1930 1940 1950 1960 1970 1980 1990 2000 2010
GPR HistoricalS
econ
d B
oer
War
and
Box
er R
ebel
lion
Beg
inni
ng o
f Rus
sian
-Jap
anes
e W
ar
Firs
t Bal
kan
War
Beg
ins
WW
1 B
egin
sU
S J
oins
WW
1
Japa
n at
tack
s S
hang
hai a
nd N
anki
ng
Italia
n In
vasi
on o
f Eth
iopi
aH
itler
thre
aten
s C
zech
oslo
vaki
aB
egin
ning
of W
WII
Atta
ck o
n P
earl
Har
bor
Esc
alat
ion
of K
orea
n W
ar
Sue
z C
risis
Sec
ond
Tai
wan
Str
ait C
risis
Sov
iet U
nion
Res
umes
Nuc
lear
Tes
ts
Mid
dle
Eas
t Ten
sion
s pr
e-6
Day
War
Vie
tnam
War
: Firs
t Bat
tle o
f Qua
ng T
riY
om K
ippu
r W
ar
Gra
in E
mba
rgo
agai
nst U
SS
RF
alkl
ands
War
Beg
ins
Abl
e A
rche
r 83
US
Bom
bing
of L
ibya
Gul
f War
US
Bom
bing
of I
raq
9/11
Iraq
Inva
sion
Rus
sia
anne
xes
Crim
ea
Note: The line plots the monthly GPR index since 1900.
29

Figure 4: Human and Computer-Generated GPR Indexes
1985 1990 1995 2000 2005 2010 20150
100
200
300
400
500
600
GPR IndexHuman Index
Note: Time-series comparison from 1985Q1 to 2016Q4 based on 6,125 articles. The series are plotted quarterly to reduce sampling variability. Bothseries are normalized to 100 from 1985 to 2016.
30

Figure 5: The Geopolitical Risk Index and Other Proxies for Geopolitical Risk
1900 1920 1940 1960 1980 20000
100
200
300
400
500
His
toric
al In
dex
(200
0-20
09=
100)
0
2
4
6
8
10
Cris
is C
ount
GPRHICB: Number of International Crisis
1985 1990 1995 2000 2005 2010 20150
100
200
300
400
500
600
GP
R In
dex
(200
0-20
09=
100)
0
1000
2000
3000
4000
5000
6000
7000
Dea
ths
in W
ar a
nd T
erro
rism
GPRTotal Deaths due to war and terrorCivilian Deaths due to terrorism, US & Europe
1985 1990 1995 2000 2005 2010 20150
100
200
300
400
500
600
GP
R In
dex
0
200
400
600
800
Nat
iona
l Sec
urity
in E
PU
Inde
xGPREPU National Security
1985 1990 1995 2000 2005 2010 20150
100
200
300
400
500
600
GP
R In
dex
4
6
8
10
12
US
Ext
erna
l Con
flict
Rat
ing
(Inv
erte
d S
cale
)
GPRICRG U.S. External Conflict Rating (Inverted Scale)
Note: See Section 3 for details. In the first panel, shaded areas represent the two World Wars.
31

Figure 6: The Geopolitical Risk Index and other Measures of Risk
0
100
200
300
400
500
600
1985 1990 1995 2000 2005 2010 201550
100
150
200
250
GPR vs EPUGPREPU
US bombs Libya
Kuwait Invasion
Madrid bombings
London bombings
Transatlanticaircraft plot
Russia annexes Crimea
Ukraine and ISIS
Paris attacks
Black Monday
Gulf War
Clinton Election
Russian Crisis/LTCM
Bush Election
9/11
Iraq invasion
Stimulus Debate
Lehman Failure and TARP
Euro Crisis
Debt Ceiling Debate Fiscal CliffGovt. Shutdown
(a) Comparison to economic policy uncertainty
(b) Comparison to option-implied volatility
Note: This figure compares the GPR index with the economic policy uncertainty (EPU) constructed by Baker,Bloom, and Davis (2016) and with financial volatility as measured by the VIX.
32

Figure 7: The Macroeconomic Impact of Increased Geopolitical Risk
0 6 12 18 24
0
50
100
150
GPR Index
0 6 12 18 24-10
0
10
20
30EPU Index
0 6 12 18 24
-5
0
5
10
(%)
Consumer Sentiment
0 6 12 18 24-2
-1.5
-1
-0.5
0
0.5
(%)
Industrial Production
0 6 12 18 24-1
-0.5
0
(%)
Employment
0 6 12 18 24
-4
-2
0
2
(%)
Gross Trade
0 6 12 18 24-5
0
5
(%)
S&P500
0 6 12 18 24-20
-15
-10
-5
0
5
(%)
Real Oil Price
0 6 12 18 24-40
-20
0
20
40(B
PS
)2-Year Treas. Yield
Note: The black solid line in each panel depicts the median impulse response of the specified variable to a rise of167 points in the GPR index. The size of the shock equals the average change in the index following the nine episodes oflargest increases in the GPR index. The dark and light shaded bands represent the 68 and 90 percent pointwise crediblesets, respectively. The responses of the GPR index and of the Baker, Bloom, and Davis (2016) EPU index are reportedin levels. The horizontal axis measures months since the shock.
33

Figure 8: Increased Geopolitical Risk and Stock Returns(Excess Returns of Selected Industries)
0 6 12 18 24
-10
-5
0
5
10
15
(%)
Defense
0 6 12 18 24
-10
-5
0
5
10
15
(%)
Oil
0 6 12 18 24
-10
-5
0
5
10
15
(%)
Aircraft
0 6 12 18 24
-10
-5
0
5
10
15
(%)
Steel Works
0 6 12 18 24
-10
-5
0
5
10
15
(%)
Mining
0 6 12 18 24
-10
-5
0
5
10
15
(%)
Insurance
Note: The black solid line in each panel depicts the median impulse response of cumulative excess return of selectedindustries over the S&P 500 to a rise of 167 points in the GPR index. The size of the shock equals the average change inthe index following the nine episodes of largest increases in the GPR index. The dark and light shaded bands representthe 68 and 90 percent pointwise credible sets, respectively. The horizontal axis measures months since the shock.
34
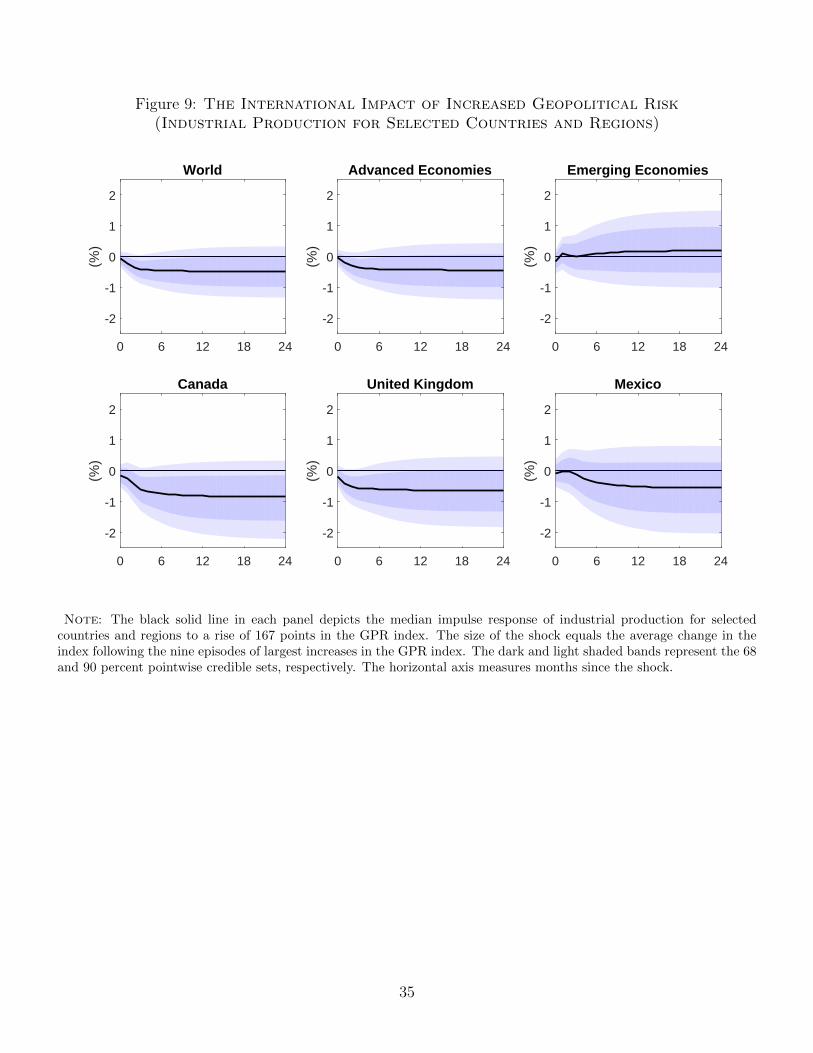
Figure 9: The International Impact of Increased Geopolitical Risk(Industrial Production for Selected Countries and Regions)
0 6 12 18 24
-2
-1
0
1
2
(%)
World
0 6 12 18 24
-2
-1
0
1
2
(%)
Advanced Economies
0 6 12 18 24
-2
-1
0
1
2
(%)
Emerging Economies
0 6 12 18 24
-2
-1
0
1
2
(%)
Canada
0 6 12 18 24
-2
-1
0
1
2
(%)
United Kingdom
0 6 12 18 24
-2
-1
0
1
2
(%)
Mexico
Note: The black solid line in each panel depicts the median impulse response of industrial production for selectedcountries and regions to a rise of 167 points in the GPR index. The size of the shock equals the average change in theindex following the nine episodes of largest increases in the GPR index. The dark and light shaded bands represent the 68and 90 percent pointwise credible sets, respectively. The horizontal axis measures months since the shock.
35

Figure 10: The Impact of Increased Geopolitical Risk: Acts vs. Threats
0 6 12 18 24
0
100
200
300GPA (Acts) Index
0 6 12 18 24-50
0
50
100
150
GPT (Threats) Index
0 6 12 18 24-30
-20
-10
0
10
20
30EPU Index
0 6 12 18 24
-2
-1
0
1
(%)
Industrial Production
0 6 12 18 24-5
0
5(%
)Gross Trade
0 6 12 18 24
-4
-2
0
2
4
6
(%)
S&P500
(a) Response of selected variables to a GPA
0 6 12 18 24
0
100
200
300GPA (Acts) Index
0 6 12 18 24-50
0
50
100
150
GPT (Threats) Index
0 6 12 18 24-30
-20
-10
0
10
20
30EPU Index
0 6 12 18 24
-2
-1
0
1
(%)
Industrial Production
0 6 12 18 24-5
0
5
(%)
Gross Trade
0 6 12 18 24
-4
-2
0
2
4
6
(%)
S&P500
(b) Response of selected variables to a GPT shocks
Note: The green (red) line in each panel depicts the median impulse response of the specified variable to a rise in theGPA (GPT) index. The dark and light shaded bands represent the 68 and 90 percent pointwise credible sets, respectively.The responses of the GPA, GPT, and of the EPU indexes are reported in levels. The horizontal axis measures monthssince the shock.
36

Figure 11: The Impact of Increased Geopolitical Risk: Acts vs. Threats(Excess Return in Selected Industries)
0 6 12 18 24
-10
-5
0
5
10
15
(%)
Defense
0 6 12 18 24
-10
-5
0
5
10
15
(%)
Oil
0 6 12 18 24
-10
-5
0
5
10
15
(%)
Aircraft
0 6 12 18 24
-10
-5
0
5
10
15
(%)
Steel Works
0 6 12 18 24
-10
-5
0
5
10
15
(%)
Mining
0 6 12 18 24
-10
-5
0
5
10
15
(%)
Insurance
(a) Response of excess return in selected industries to a GPA Shock
0 6 12 18 24
-10
-5
0
5
10
15
(%)
Defense
0 6 12 18 24
-10
-5
0
5
10
15
(%)
Oil
0 6 12 18 24
-10
-5
0
5
10
15
(%)
Aircraft
0 6 12 18 24
-10
-5
0
5
10
15
(%)
Steel Works
0 6 12 18 24
-10
-5
0
5
10
15
(%)
Mining
0 6 12 18 24
-10
-5
0
5
10
15
(%)
Insurance
(b) Response of excess return in selected industries to a GPT Shock
Note: The green (red) line in each panel depicts the median impulse response of excess return in selected industriesover the S&P 500 to a rise in the GPA (GPT) index. The dark and light shaded bands represent the 68 and 90 percentpointwise credible sets, respectively. The horizontal axis measures months since the shock.
37
Appendix
A Additional Details on the Construction of the GPR Index
The benchmark GPR index is constructed by running a search query in the ProQuest Newsstand
Database. We search the archives of the following newspapers (start date availability in brackets):
Boston Globe (1/1/1985); Chicago Tribune (1/1/1985); The Daily Telegraph (4/1/1991); Financial
Times (5/31/1996); The Globe and Mail (1/1/1985); The Guardian (8/18/1992); Los Angeles Times
(1/1/1985); The New York Times (1/1/1985); The Times (4/18/1992); Wall Street Journal (1/1/1985);
and The Washington Post (1/1/1985).
For our benchmark index, we run the search query shown in Figure A.5.25 The index is the aggregate
number of articles returned by the search, divided by the total number of articles, indexed to 100 in the
2000–2009 decade. Newspaper-specific indexes are shown for robustness in Figure A.6. As the top left
panel shows, coverage of geopolitical risks aligns with the benchmark GPR index for the three general
interest newspapers that we use in the construction of the historical index. As the top right panel shows,
coverage of geopolitical risks is slightly higher than the average for the two business newspapers in the
sample, the Wall Street Journal and the Financial Times. Coverage also lines up with the average for the
two U.S. newspapers not included in the historical index (bottom left panel). Coverage of geopolitical
events by non-U.S. general interest newspapers lines up with the average, but is slightly more volatile
(bottom right panel).
B Comparison with Broader and Narrower Measures
To evaluate how the choice of search terms impacts the construction of the index, we discuss three
alternative specifications of the search terms. We plot the three resulting indexes in Figure A.7.
The broad index in constructed by mechanically combining the search words in Table 1 with the
ten bi-grams that have the highest odd to belong to E1 instead of E0. While the resulting search criteria
double the number of articles mentioning geopolitical risks, the broad index is highly correlated (0.92)
with the benchmark one, thus suggesting that the index is robust to the exclusion of expressions that
are likely to be associated with rising geopolitical tensions. The broad index exhibits a slightly lower
25 We use the search tips and wild cards discussed at https://proquest.libguides.com/proquestplatform/tips.
A.1

correlation than the benchmark index with the human index, 0.82 when the data are aggregated at
quarterly frequency.
The narrow index excludes articles containing search terms that—in the human audit of the set
E—were often correlated with false positives. As before, we identify bi-grams that are more likely than
not to appear in E0. We then exclude from the index all the articles containing any of these bi-grams.26
The resulting search reduces by approximately 15 percent the number of articles mentioning geopolitical
risks, but the resulting index is virtually indistinguishable from the benchmark one (correlation 0.997),
thus suggesting that the index is sufficiently robust to the inclusion of words that are likely to be
associated with false positives. Like the broad index, the narrow index also exhibits a slightly lower
correlation than the benchmark index with the human index, 0.76 when the data are aggregated at
quarterly frequency.
Finally, the simple index economizes on search words, and is close in spirit to the methodology of
Baker, Bloom, and Davis (2016). The simple index is based on articles that, instead of belonging to any
of the six potential search categories, contain at least one word from each of two sets of terms: the set
S1, including {war OR military OR terrorism OR geopolitical}, and the set S2, containing {risk* OR
concern* OR tension* OR uncertaint* OR threat*}. The correlation between the benchmark index and
the simple GPR index is sizable, at 0.89. Although the principle of parsimony would make this index
appealing (in particular, this index has the same quarterly correlation with the human index, at 0.84),
we prefer the benchmark index because, among other things, it showed a lower error rate in pilot audits,
and because it affords a natural decomposition into several search subcategories that is not afforded by
the simple index.
C Saiz and Simonsohn (2013) Checks
Saiz and Simonsohn (2013) state a number of conditions that must hold to obtain useful document-
frequency based proxies for variables, such as geopolitical risk, that are otherwise difficult to measure.
Our audit, among other things, makes sure that these conditions are indeed satisfied in our application.
We provide a point-by-point discussion on how we perform these data checks below.
1. We verify that our search terms are more likely to be used when geopolitical risk is high than
26 Our benchmark index already excludes expressions that in our first audit were often associated with false positives,like “civil war” and “human rights”, as well as words like movie, museum, anniversary, memorial and art. The additionalbigrams that exclude an article from the count in the narrow index are “air force”, “death penalty”, “national guard”,“supreme court”, “justice department”, “enemy combatant”, “military commission”, “military tribunal”, “military civil-ian”, “military loss”, “defense department”, “chief of staff”, “law enforcement”, “war crime”. These bigrams were foundto have odds of belonging to set E1 instead of set E0 of less than 40 percent.
A.2

when it is low (Data check 1: Do the different queries maintain the phenomenon and keyword
constant?, and Data check 3: Is the keyword employed predominately to discuss the occurrence
rather than non-occurrence of phenomenon? ). Across all the documents in our human audit, we
found that 86 percent of articles measure high geopolitical risk, whereas only 4.3 percent of these
articles measure declining tensions. We therefore conclude that increases in GPR are far more
likely to lead to the use of our preferred search terms.
2. The GPR index is a frequency, thus satisfying data check 2 (Data check 2. Is the variable being
proxied a frequency? ).
3. We verify that the average number of documents found is large enough for variation to be driven by
factors other than sampling error (Data check 4: Is the average number of documents found large
enough [...]? ). In particular, we verify that spikes in GPR are easily attributable to well-defined
historical events not only at monthly, but also at daily frequency. For instance, the monthly data
show that our index spikes in April 1986, mostly following the events that culminated with U.S.
air strikes against Libya on April 15. However, the index also spikes, within the month, on April
8, when the U.S. accused Muammar el-Qaddafi of sponsoring terrorist acts aimed at Americans
(such as the Berlin discotheque bombing which occurred on April 5). It also spikes on April 18,
when British police found a bomb in a bag that was taken onto an El Al aircraft.
4. We verify that measurement error is low enough (Data check 3, and Data check 5: Is the expected
variance in the occurrence-frequency of interest high enough to overcome the noise associated with
document-frequency proxying? ), by choosing combinations of search terms that – unlike with a
single keyword or a bigram – are unlikely to be used outside of the realm of rising geopolitical
risk . For instance, the naive geopolitical risk index GPRE is nearly as high in March 1991 as in
January 1991, whereas the benchmark GPR index is four times as low. This occurs because the
naive index fails to account for the fact that many articles comment the aftermath of the Gulf
war, but do not explicitly mention threats or risks, something that our index takes into account.
5. We construct and examine narrow and broad indexes around the benchmark index, thus satisfying
data check number 5.
6. Because our interest as economists is to look at the economic effects of higher geopolitical risk,
we need to guard against the possibility that words related to geopolitical tensions are more likely
to be mechanically used during, say, recessions, even if recessions are caused by geopolitical ten-
sions. To address this concern, we construct a version of the GPR index that excludes the search
A.3

terms “economy” OR “stock market*” OR “financial market*” OR “stock price*”. Although 19
percent of articles in GPR are filtered out once this criterion is included, the resulting index (GPR-
NOECON) is virtually indistinguishable from the benchmark index (their correlation is 0.989).
Additionally, the share of articles in the GPR index mentioning economic words is uncorrelated
with real outcomes (the correlation with the change in log industrial production is 0.03), thus al-
laying concerns that an omitted variable biases the results both “geopolitical risk” and economic
outcomes (Data check 6: [...] Does the chosen keyword have as its primary or only meaning the
occurrence of the phenomenon of interest?, and Data check 7: [...] Does the chosen keyword also
result in documents related to the covariates of the occurrence of interest? ).
7. We use the naive GPRE index as a placebo document-frequency variable in our VAR analysis.
In particular, there is the possibility that it is not geopolitical risks per se that are bad, but the
overall tendency to discuss geopolitical events during recessions. We show that adding GPRE to
the VAR does not change the predictive power of GPR in explaining GDP drops. (Data check 8:
Are there plausible omitted variables that may be correlated both with the document-frequency and
its covariates? )
D Robustness of VAR Results
In the Appendix we show that the effects of the GPR shock are robust to a number of robustness checks.
First, the 9/11 terrorist attacks are the episode that induced the largest increase in the index (the index
rose to its highest level with the Iraq war two years later, but from already elevated levels). The 9/11
terrorist attacks were not a typical geopolitical event, as they targeted the world financial center and
provoked direct financial effects by forcing the closure of the U.S. stock market and other major financial
institutions. Additionally, the 9/11 attacks had also a great impact on news coverage of terrorism and
more broadly of geopolitical events outside the US. Moreover, 9/11 is potentially associated with a
structural break in the index, which remained persistently elevated after the terrorist attack. Thus, it
is important to ask whether the bulk of our results come from this single episode.
Figure A.8 reports the impulse responses to a GPR shock estimated using a VAR model that includes
dummies for September and October 2001,27, and another VAR model that uses a censored version of the
GPR index. We construct the censored GPR index by setting to zero all observations on the GPR where
the time series of residuals from an AR(1) regression of the GPR increases by less than 1.68 standard
27 We included a dummy for both September and October because news coverage of the 9/11 terrorist attacks andespecially their geopolitical implications was higher in October than in September.
A.4

deviations. The resulting index, which consists of 9 episodes, captures large increases in geopolitical
risk, and gives no weight to small variations in the index.
The impulse responses to a GPR shock in the model with the 9/11 dummies and the censored GPR
are very similar to the baseline model. By censoring the GPR index, a GPR shock induces a very
temporary increase in geopolitical risk, which is zero 3 months after the shock. The lack of persistence
translates into a more muted response of the stock market index and of corporate spreads.
Second, in Figure A.9 we explore the robustness to an alternative Cholesky ordering where we order
the GPR index last. By construction, the impact response of a GPR shock to all other variables in the
VAR is zero. These exclusion restrictions attenuate the recessionary effects of the shock. Nonetheless,
the drop in IP and employment is economically significant, and zero is excluded from the 90 percent
credible set at the six month horizon. Similarly, the response of oil prices remains negative as for the
benchmark model specification. Not surprisingly, the response of the other variables—all fast-moving
variables that quickly respond to shocks— is different compared to the baseline. In particular, consumer
sentiment and the stock market no longer drop on impact, and their dynamic response is positive. The
response of trade and the 2-year Treasury yield is also attenuated. Yet, this identification is not our
benchmark precisely because, given the nature of geopolitical risks, our working hypothesis is that it
is more likely that consumer confidence and stock prices drop and the EPU increases in response to
a GPR shock rather than the reverse. At the same time, this exercise highlights that GPR shocks
have independent real effects on the US economy and on oil prices despite shutting down plausible
transmission channels such as EPU and the stock market.
Finally, in Figure A.10 we show that the results are robust to replacing the EPU with the VIX. The
impulse responses are somewhat attenuated, but all responses are highly economically and statistically
significant.
A.5

Figure A.1: The Geopolitical Risk Index:Contribution of Various Search Groups
1985 1990 1995 2000 2005 2010 20150
100
200
300
400
500
600
Arti
cle
Wor
ds P
er M
onth
Words in the Index
Terrorist ActsTerrorist ThreatsWar ActsWar ThreatsNuclear ThreatsGeopolitical Threats
Note: The chart plots the monthly cumulative contribution to the GPR index of the articles associated with the sixsearch groups described in Table 1. Higher geopolitical risk since the 2000s reflects increased mentions of both terroristacts and terrorist threats, as well as an increased use of words directly mentioning geopolitical uncertainties.
A.6

Figure A.2: The Historical Geopolitical Risk Index:Contribution of Various Search Groups
1900 1910 1920 1930 1940 1950 1960 1970 1980 1990 2000 20100
100
200
300
400
500
600
His
toric
al In
dex
(200
0-20
09=
100)
Words in the Historical Index
Geopolitical ThreatsNuclear ThreatsWar ThreatsWar ActsTerrorist ThreatsTerrorist Acts
Note: The chart plots the cumulative contribution to the historical GPR index (GPRH) of the articles associated withthe six search groups described in Table 1.
A.7

Figure A.3: GPR and Natural Disasters Index
1985 1990 1995 2000 2005 2010 20150
200
400
600
800
1000
Hur
rican
e K
atrin
a
Lom
a P
rieta
Ear
thqu
ake
Nor
thrid
ge E
arth
quak
e
Indi
an O
cean
Ear
thqu
ake
GPRNatural Disasters Index
1985 1990 1995 2000 2005 2010 20150
100
200
300
400
500
600
GPRGPR Explained by Natural Disasters
Note: The top panel of the figure compares the benchmark GPR index with a news-based index of natural disasters.The bottom panel of the figure shows the GPR together with the fitted value of a regression of the GPR index against aconstant and the natural disasters index. As shown by this figure, the GPR hardly moves in response to news coverageof natural disasters. Thus, shifting media attention towards geopolitical events does not move the GPR index, whichcorroborates the view that the index captures movements in underlying geopolitical tensions.
A.8

Figure A.4: Human and Computer-Generated Historical GPR Indexes
1900 1910 1920 1930 1940 1950 1960 1970 1980 1990 2000 20100
50
100
150
200
250
300
350
400
450
GPR IndexHuman GPR Index
Note: Time-series comparison from 1899 to 2016 based on 7,416 articles. The series are plotted annually to reducesampling variability. Both series are normalized to 100 throughout the sample.
A.9

Figure A.5: Search Query for the Benchmark GPR Index
Note: The index is the share of number of articles returned by the search above, divided by the total number of articles,indexed to 100 in the 2000–2009 decade.
A.10

Figure A.6: Share of GPR Articles by Individual Newspaper
1985 1990 1995 2000 2005 2010 20150
1
2
3
4
5
6
% o
f GP
R a
rtic
les
Newspapers also used for Historical Index
N-NYTN-WAPON-CTGPR Benchmark
1985 1990 1995 2000 2005 2010 20150
1
2
3
4
5
6
% o
f GP
R a
rtic
les
Business Newspapers Newspapers
N-WSJN-FTGPR Benchmark
1985 1990 1995 2000 2005 2010 20150
1
2
3
4
5
6
% o
f GP
R a
rtic
les
Other U.S. General Interest Newspapers
N-BGN-LATGPR Benchmark
1985 1990 1995 2000 2005 2010 20150
1
2
3
4
5
6
% o
f GP
R a
rtic
les
Foreign General Interest Newspapers
N-GAMN-DTN-GUAN-TOLGPR Benchmark
Note: Each panel plots the share of articles containing words related to geopolitical risk for each of the 11 newspapers.
A.11

Figure A.7: The GPR Index and Three Alternatives
1985 1990 1995 2000 2005 2010 20150
1
2
3
4
5
Per
cent
of a
ll ar
ticle
s
Broad GPR
BroadGPR Benchmark
1985 1990 1995 2000 2005 2010 20150
1
2
3
4
5
Per
cent
of a
ll ar
ticle
s
Narrow GPR
NarrowGPR Benchmark
1985 1990 1995 2000 2005 2010 20150
5
10
15
Per
cent
of a
ll ar
ticle
s
Simple GPR
SimpleGPR Benchmark
Note: The broad GPR combines the search terms in Table 1 with bigrams that a machine learning algorithm signals asvery likely indicators of rising geopolitical tensions. The narrow GPR excludes articles containing the search terms which,in the human audit, were most likely associated with false positives. The simple GPR is based on articles that contain atleast one word from each of two sets of terms: the set S1, including {war OR military OR terrorism OR geopolitical}, andthe set S2, containing {risk* OR concern* OR tension* OR uncertaint* OR threat*}. The indexes are shown as sharesof total articles by month, rather than normalized to 100.
A.12

Figure A.8: The Impact of Increased Geopolitical Risk
0 6 12 18 24
0
50
100
150
GPR Index
0 6 12 18 24-10
0
10
20
30EPU Index
0 6 12 18 24
-5
0
5
10
(%)
Consumer Sentiment
0 6 12 18 24-2
-1.5
-1
-0.5
0
0.5
(%)
Industrial Production
0 6 12 18 24-1
-0.5
0
(%)
Employment
0 6 12 18 24
-4
-2
0
2
(%)
Gross Trade
0 6 12 18 24-5
0
5
(%)
S&P500
0 6 12 18 24-20
-15
-10
-5
0
5
(%)
Real Oil Price
0 6 12 18 24-40
-20
0
20
40(B
PS
)2-Year Treas. Yield
Baseline 9/11 Dummy Censored GPR
Note: The black solid line in each panel depicts the median impulse response of the specified variable to a rise of167 points in the GPR index in the baseline VAR specification. Lines with round markers depict responses to a VARthat includes a dummy for September and October 2001. Lines with cross markers depict responses when the GPR indexis replaced by a censored version that equals the GPR index for the months associated with the nine episodes of largestincreases in the index, and is zero in all other months. The size of the shock equals the average change in the indexfollowing the nine episodes of largest increases in the GPR index. The dark and light shaded bands represent the 68and 90 percent pointwise credible sets from the baseline model, respectively. The responses of the GPR index and of theBaker, Bloom, and Davis (2016) EPU index are reported in levels. The horizontal axis measures months since the shock.
A.13

Figure A.9: The Impact of Increased Geopolitical Risk
0 6 12 18 24
0
50
100
150
GPR Index
0 6 12 18 24-20
-10
0
10
20
30EPU Index
0 6 12 18 24
-5
0
5
10
(%)
Consumer Sentiment
0 6 12 18 24-2
-1
0
1
(%)
Industrial Production
0 6 12 18 24-1
-0.5
0
0.5
(%)
Employment
0 6 12 18 24
-4
-2
0
2
(%)
Gross Trade
0 6 12 18 24
-5
0
5
10
(%)
S&P500
0 6 12 18 24-20
-15
-10
-5
0
5
(%)
Real Oil Price
0 6 12 18 24-40
-20
0
20
40(B
PS
)2-Year Treas. Yield
Note: The black solid line in each panel depicts the median impulse response of the specified variable to a rise of167 points in the GPR index. Compared to the baseline model, we identify a GPR shock by ordering the GPR indexlast in a Cholesky ordering. The size of the shock equals the average change in the index following the nine episodes oflargest increases in the GPR index. The dark and light shaded bands represent the 68 and 90 percent pointwise crediblesets, respectively. The responses of the GPR index and of the Baker, Bloom, and Davis (2016) EPU index are reportedin levels. The horizontal axis measures months since the shock.
A.14

Figure A.10: The Impact of Increased Geopolitical Risk(Replacing the EPU Index with the VIX)
0 6 12 18 24
0
50
100
150
GPR Index
0 6 12 18 24-10
0
10
20
30VIX
0 6 12 18 24
-5
0
5
10
(%)
Consumer Sentiment
0 6 12 18 24-2
-1
0
1
(%)
Industrial Production
0 6 12 18 24-1
-0.5
0
0.5
(%)
Employment
0 6 12 18 24
-4
-2
0
2
(%)
Gross Trade
0 6 12 18 24
-5
0
5
(%)
S&P500
0 6 12 18 24-20
-15
-10
-5
0
5
(%)
Real Oil Price
0 6 12 18 24-40
-20
0
20
40(B
PS
)2-Year Treas. Yield
Note: The black solid line in each panel depicts the median impulse response of the specified variable to a rise of167 points in the GPR index. Compared to the baseline model, we replace the EPU index with the VIX. The size of theshock equals the average change in the index following the nine episodes of largest increases in the GPR index. The darkand light shaded bands represent the 68 and 90 percent pointwise credible sets, respectively. The responses of the GPRindex and of the Baker, Bloom, and Davis (2016) EPU index are reported in levels. The horizontal axis measures monthssince the shock.
A.15