measuring collaborative digital literacy - k-12 center
TRANSCRIPT
1
Measuring Collaborative Digital Literacy
Mark Wilson and Kathleen Scalise
May 7–8, 2012
2
Measuring Collaborative Digital Literacy
Mark Wilson
University of California, Berkeley
Kathleen Scalise
University of Oregon
Executive Summary The international Assessment and Teaching of 21st Century Skills (ATC21S) project, sponsored
by Cisco, Intel, and Microsoft, aims to help educators around the world enable students with the skills to succeed in future career and college goals. To be successful now and in the future, ATC21S proposes that students need a set of 21st-century skills (see ATC21S white papers, http://atc21s.org/index.php/resources/white-papers/), including problem solving, digital literacy, and working together in learning communities. This presentation summarizes some results from a portion of ATC21S Phase 3 work on the “ICT Literacy — Learning in Digital Networks” learning progression. The data were collected in Fall 2011 studies in Australia, Finland, Singapore, and the United States, which took place from August to November 2011. The paper concludes with a discussion of ideas toward the reporting of the outcomes for the learning progression results.
3
Introduction Responding to changes in the global economy involving advances in information and
communication technologies (ICT), a collaborative effort by three information technology companies, Cisco, Intel, and Microsoft (CIM), led to the founding of the Assessment and Teaching of 21st Century Skills project (ATC21S) launched in 2009.1
The economy of leading countries is now based more on the manufacture and delivery of information products and services than on the manufacture of material goods. Even many aspects of the manufacturing of material goods are strongly dependent on innovative uses of technologies. The start of the 21st century also has witnessed significant social trends in which people access, use, and create information and knowledge very differently than they did in previous decades, again due in many ways to the ubiquitous availability of ICT. (CIM, 2008)
In the words of the company collaborative:
This global change will have significant effects on how people live their personal and working lives and hence must have significant effects on the educational systems that prepare people for their careers. This will include the very subjects that are taught in schools, how those new subjects and traditional subjects are taught and learned, and how schooling is organized. In order to help move this effort along, the companies determined that a leading edge of change lies in the domain of assessment. Hence, they founded the ATC21S project to develop new assessments in these innovative areas, to serve as demonstrations of what the new assessment might look like.
The ATC21S view of assessment is based on beliefs that the current practice of schooling is outmoded in the global working environment. For example, the CIM partners contrasted the typical context of student standardized assessment as having students take tests individually with a situation in the outside world where people work both individually and in groups to share complimentary skills and accomplish shared goals. A second difference is in the nature of the test subjects themselves, where today school subjects are divided by disciplinary boundaries, but in the workplace this subject knowledge is applied across disciplinary boundaries in the process of solving real world problems. Moreover, these problems are not solvable by simply recalling facts or applying simple procedures but are complex and ill-structured—and set in specific concrete contexts. Finally, the traditional “closed book” testing context is contrasted with a setting where people have access to a vast array of information and technological tools, where the challenge is to strategically craft a solution (CIM, 2008).
The ATC21S project commissioned a series of white papers to help establish this effort (now published in Griffin, McGaw, & Care, 2012). Among them, the most important for this paper are the skills paper (Binkley et al., 2012) and the methodology paper (Wilson et al., 2012). The first of these white papers lays out a scheme for encompassing and understanding the nature of these new skills and the ways in which they relate to traditional school subjects. The scheme is referred to as KSAVE, standing for knowledge, skills and attitudes, values and ethics. Using this scheme as a basis, two particular 21st century skills were chosen for inclusion in an ATC21S assessment demonstration—
1 See: http://www.intel.com/pressroom/archive/releases/2009/20090113corp.htm
4
collaborative problem solving and ICT literacy. The latter is the focus of this paper, and our particular slant on that will be described below. The second white paper lays out an approach to developing the new assessments based on the insights of a groundbreaking U.S. National Research Council report (NRC, 2001). The approach chosen is called the BEAR Assessment System (BAS; Wilson, 2005; Wilson, 2009a; Wilson & Sloane, 2001), and it will not be detailed here other than to note that it is based on the following four principles.
Principle 1: Assessment should be based on a developmental perspective of student learning; the building block is a construct map of a progress variable that visualizes how students develop and how we think about their possible changes in response to items.
Principle 2: There must be a match between what is taught and what is assessed; the building block is the items design, which describes the most important features of the format of the items—the central issue though is how the items design results in responses that are related back to the levels of the construct map.
Principle 3: Teachers must be the managers of the system, with the tools to use it efficiently and effectively; the building block is the outcome space, or the set of categories of student responses that make sense to teachers.
Principle 4: There is evidence of quality in terms of reliability and validity studies and evidence of fairness; the building block is a measurement model that provides for multidimensional item responses and links over time, both longitudinally within cohorts and across cohorts. (Wilson, 2009b)
How these principles become embedded in the process and the product of the assessment development will be exemplified in the account below.
Learning in Networks: The Construct Map The term ICT literacy encompasses a wide range of subtopics, including learning in networks,
information literacy, digital competence, and technological awareness, all of which contribute to learning to learn through the development of enabling skills. In the current global economy, learning through digital networks, and the use of digital media, is becoming increasingly important in private life, in learning, and in professional life. We predict that this aspect of learning will become very important in the future. We see this as being true at the individual level and local or regional levels as well as at international levels.
For the ATC21S project effort, the focus of ICT literacy was on learning in networks, which was seen as being made up of four strands:
1. Functioning as a consumer in network (CiN)
2. Functioning as a producer in networks (PiN)
3. Participating in the development of social capital through networks
4. Participating in intellectual capital (i.e., collective intelligence) in networks
5
In our view of ICT literacy, it is seen as involving thinking across platforms and hardware implementations, and also thinking outside the computer itself, to other devices and uses of technology.
The Four Strands The four strands mentioned above are seen as interacting together in the activity of learning in
networks. They are conceptualized as parallel developments that are interconnected and make up that part of ICT literacy that is concerned with learning in networks.
First, functioning as a CiN involves obtaining, managing, and utilizing information and knowledge from shared digital resources and experts in order to benefit private and professional lives. It involves questions such as the following:
• Will a user be able to ascertain how to perform tasks (e.g., by exploration of the interface) without explicit instruction?
• How long will it take an experienced user to find an answer to a question using their PDA or other mobile device?
• What arrangement of information on a display yields more effective visual search? • How difficult will it be for a user to find information on a Web site?
Second, functioning as a PiN involves creating, developing, organizing, and reorganizing information/knowledge in order to contribute to shared digital resources.
Third, developing and sustaining social capital through networks (SCN) involves using, developing, moderating, leading, and brokering the connectivities within and between individuals and social groups in order to marshal collaborative action, build communities, maintain an awareness of opportunities, and integrate diverse perspectives at community, societal, and global levels.
Fourth, developing and sustaining intellectual capital through networks (ICN) involves understanding how tools, media, and social networks operate and using appropriate techniques through these resources to build collective intelligence and integrate new insights into personal understandings.
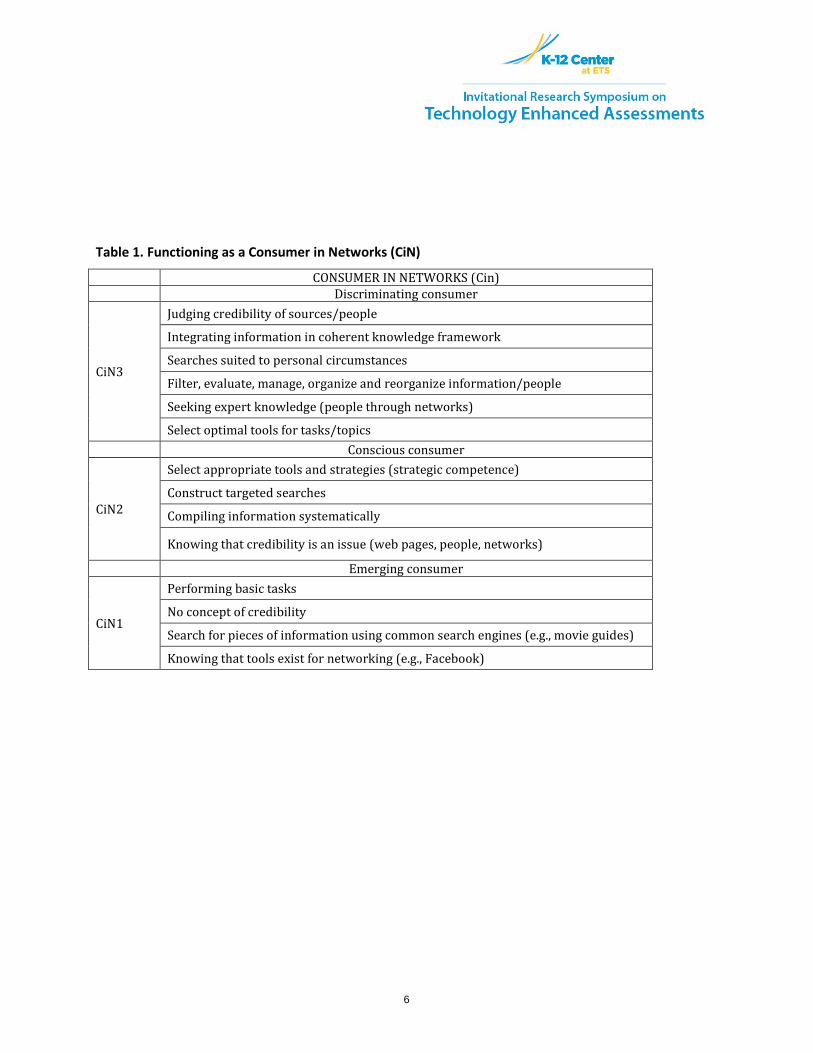
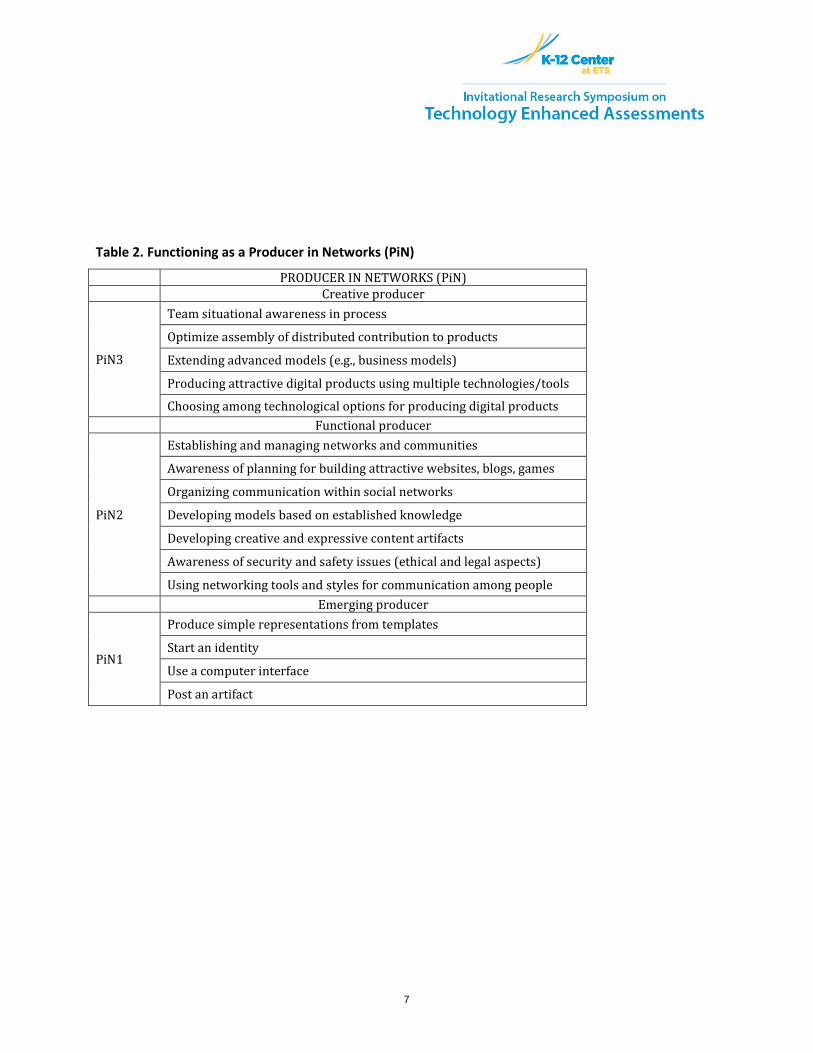
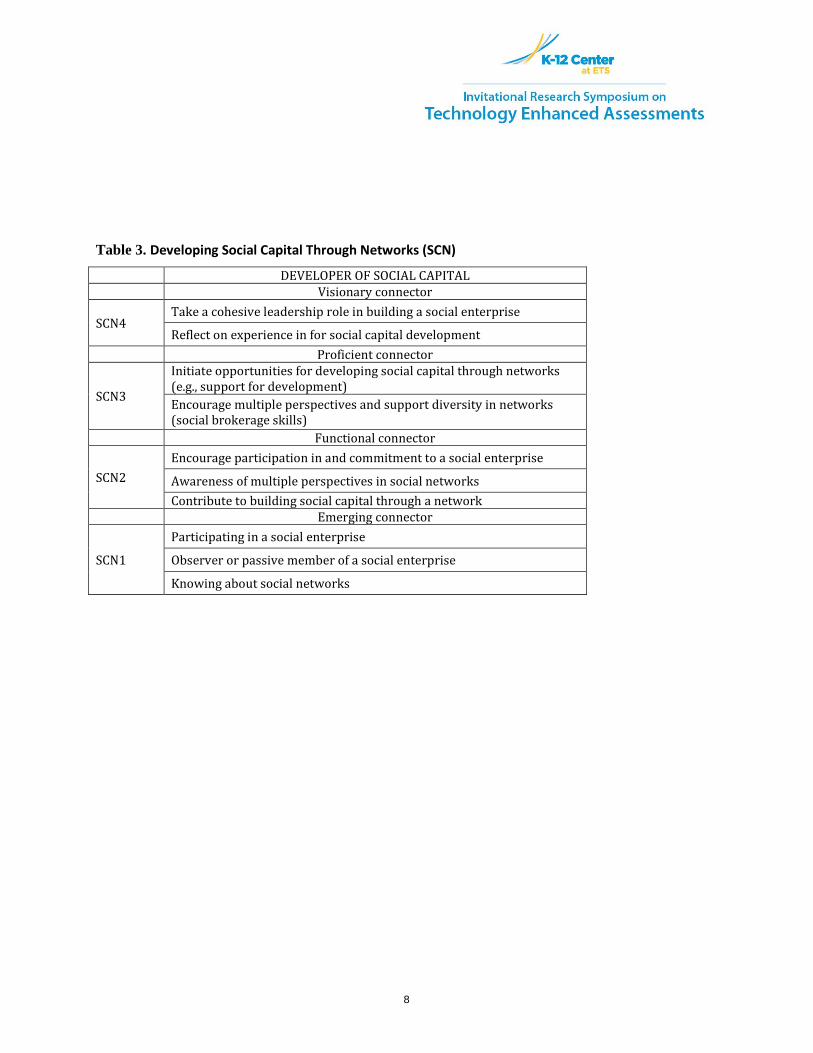
In Tables 1 through 4, levels of these four strands have been described as hypothesized construct maps showing an ordering of skills or competencies involved in each. At the lowest levels of each are the competencies that one would expect to see exhibited by a novice or beginner. At the top of each table are the competencies that one would expect to see exhibited by an experienced person—someone who would be considered very highly literate in ICT. These construct maps are hierarchical in the sense that a person who would normally exhibit competencies at a higher level would also be expected to be able exhibit the competencies at lower levels of the hierarchy. The maps are also probabilistic in the sense that they represent different probabilities that a given competence would be expected to be exhibited in a particular context rather than certainties that the competence would always be exhibited.
6
Table 1. Functioning as a Consumer in Networks (CiN)
CONSUMER IN NETWORKS (Cin) Discriminating consumer
CiN3
Judging credibility of sources/people
Integrating information in coherent knowledge framework
Searches suited to personal circumstances
Filter, evaluate, manage, organize and reorganize information/people
Seeking expert knowledge (people through networks)
Select optimal tools for tasks/topics Conscious consumer
CiN2
Select appropriate tools and strategies (strategic competence)
Construct targeted searches
Compiling information systematically
Knowing that credibility is an issue (web pages, people, networks)
Emerging consumer
CiN1
Performing basic tasks
No concept of credibility
Search for pieces of information using common search engines (e.g., movie guides)
Knowing that tools exist for networking (e.g., Facebook)
7
Table 2. Functioning as a Producer in Networks (PiN)
PRODUCER IN NETWORKS (PiN) Creative producer
PiN3
Team situational awareness in process
Optimize assembly of distributed contribution to products
Extending advanced models (e.g., business models)
Producing attractive digital products using multiple technologies/tools
Choosing among technological options for producing digital products Functional producer
PiN2
Establishing and managing networks and communities
Awareness of planning for building attractive websites, blogs, games
Organizing communication within social networks
Developing models based on established knowledge
Developing creative and expressive content artifacts
Awareness of security and safety issues (ethical and legal aspects)
Using networking tools and styles for communication among people Emerging producer
PiN1
Produce simple representations from templates
Start an identity
Use a computer interface
Post an artifact
8
Table 3. Developing Social Capital Through Networks (SCN)
DEVELOPER OF SOCIAL CAPITAL Visionary connector
SCN4 Take a cohesive leadership role in building a social enterprise
Reflect on experience in for social capital development Proficient connector
SCN3
Initiate opportunities for developing social capital through networks (e.g., support for development) Encourage multiple perspectives and support diversity in networks (social brokerage skills)
Functional connector
SCN2 Encourage participation in and commitment to a social enterprise
Awareness of multiple perspectives in social networks Contribute to building social capital through a network
Emerging connector
SCN1
Participating in a social enterprise
Observer or passive member of a social enterprise
Knowing about social networks
9
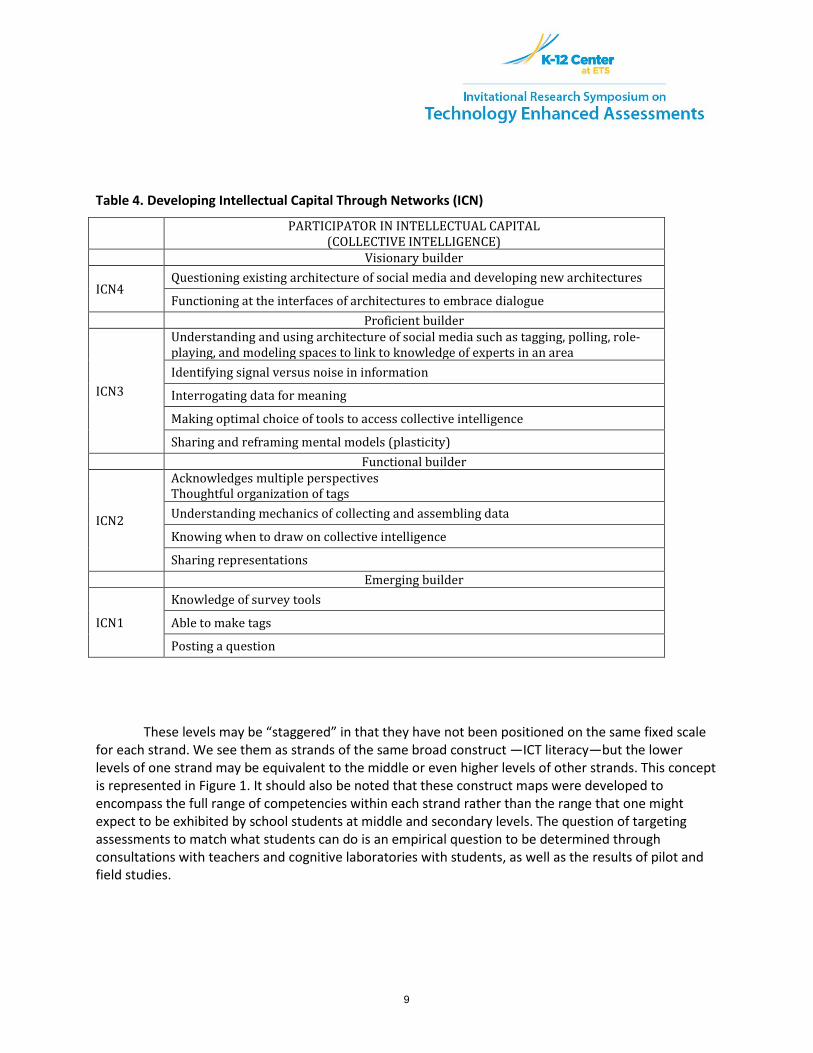
Table 4. Developing Intellectual Capital Through Networks (ICN)
PARTICIPATOR IN INTELLECTUAL CAPITAL (COLLECTIVE INTELLIGENCE)
Visionary builder
ICN4 Questioning existing architecture of social media and developing new architectures
Functioning at the interfaces of architectures to embrace dialogue Proficient builder
ICN3
Understanding and using architecture of social media such as tagging, polling, role-playing, and modeling spaces to link to knowledge of experts in an area Identifying signal versus noise in information
Interrogating data for meaning
Making optimal choice of tools to access collective intelligence
Sharing and reframing mental models (plasticity) Functional builder
ICN2
Acknowledges multiple perspectives Thoughtful organization of tags Understanding mechanics of collecting and assembling data
Knowing when to draw on collective intelligence
Sharing representations Emerging builder
ICN1
Knowledge of survey tools
Able to make tags
Posting a question
These levels may be “staggered” in that they have not been positioned on the same fixed scale for each strand. We see them as strands of the same broad construct —ICT literacy—but the lower levels of one strand may be equivalent to the middle or even higher levels of other strands. This concept is represented in Figure 1. It should also be noted that these construct maps were developed to encompass the full range of competencies within each strand rather than the range that one might expect to be exhibited by school students at middle and secondary levels. The question of targeting assessments to match what students can do is an empirical question to be determined through consultations with teachers and cognitive laboratories with students, as well as the results of pilot and field studies.
10
Figure 1. The four strands of ICT literacy, represented as a four-part learning progression. CiN = consumer in networks; PiN = producer in networks; SCN = social capital through networks;
ICN = intellectual capital through networks.
11
Learning in Networks: Three Scenarios The BEAR Center at UC Berkeley developed three scenarios in which to place tasks and
questions that could be used as items to indicate where a student might be placed along each of the four strands. Each scenario was designed to address more than one strand, but there were different emphases in how the strands area represented among the scenarios. Where possible, we took advantage of existing Web-based tools for instructional development. These are each briefly described below.
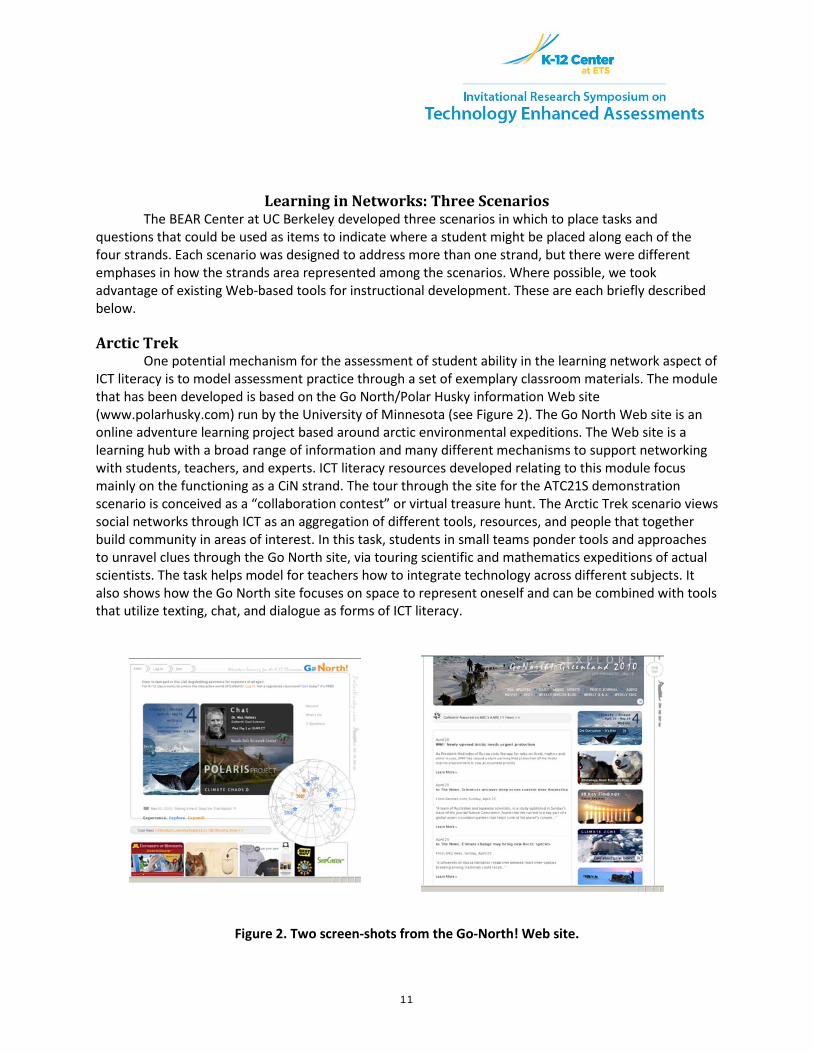
Arctic Trek One potential mechanism for the assessment of student ability in the learning network aspect of
ICT literacy is to model assessment practice through a set of exemplary classroom materials. The module that has been developed is based on the Go North/Polar Husky information Web site (www.polarhusky.com) run by the University of Minnesota (see Figure 2). The Go North Web site is an online adventure learning project based around arctic environmental expeditions. The Web site is a learning hub with a broad range of information and many different mechanisms to support networking with students, teachers, and experts. ICT literacy resources developed relating to this module focus mainly on the functioning as a CiN strand. The tour through the site for the ATC21S demonstration scenario is conceived as a “collaboration contest” or virtual treasure hunt. The Arctic Trek scenario views social networks through ICT as an aggregation of different tools, resources, and people that together build community in areas of interest. In this task, students in small teams ponder tools and approaches to unravel clues through the Go North site, via touring scientific and mathematics expeditions of actual scientists. The task helps model for teachers how to integrate technology across different subjects. It also shows how the Go North site focuses on space to represent oneself and can be combined with tools that utilize texting, chat, and dialogue as forms of ICT literacy.
Figure 2. Two screen-shots from the Go-North! Web site.

12
Webspiration In the second demonstration task, framed as part of a poetry work unit, students of ages 11 to
15 read and analyze well-known poems. In a typical school context, one might imagine that the teacher has noticed that his or her students are having difficulty articulating the moods and meanings of some of the poems—in traditional teacher-centered instruction regarding literature the student role tends to be passive. Often, teachers find that students are not being spontaneous in their responses to the poems but may tend to wait to hear what the teacher has to say and then agree with what is said. To help encourage students to formulate their own ideas on the poems, we use a collaborative graphic organizer through the Webspiration online tool. The teacher directs the students to use Webspiration to create an idea map collaboratively using the graphic organizer tools and to analyze each poem they read. Students submit their own ideas and/or build on classmate thoughts. Figure 3 shows a screen from the computer module to give a feel for how the scenario looks onscreen.
Figure 3. A sample page from the Webspiration scenario.
Second Language Chat This scenario was developed as a peer-based second language learning environment through
which students interact in learning. Developing proficiency in a second language (as well as in the mother tongue) requires ample opportunities to read, write, listen, and speak. This assessment scenario asks students to set up a technology/network-based chat room, invite participants, and facilitate a chat—in two languages. It also involves evaluating the chat and working with virtual rating systems and
13
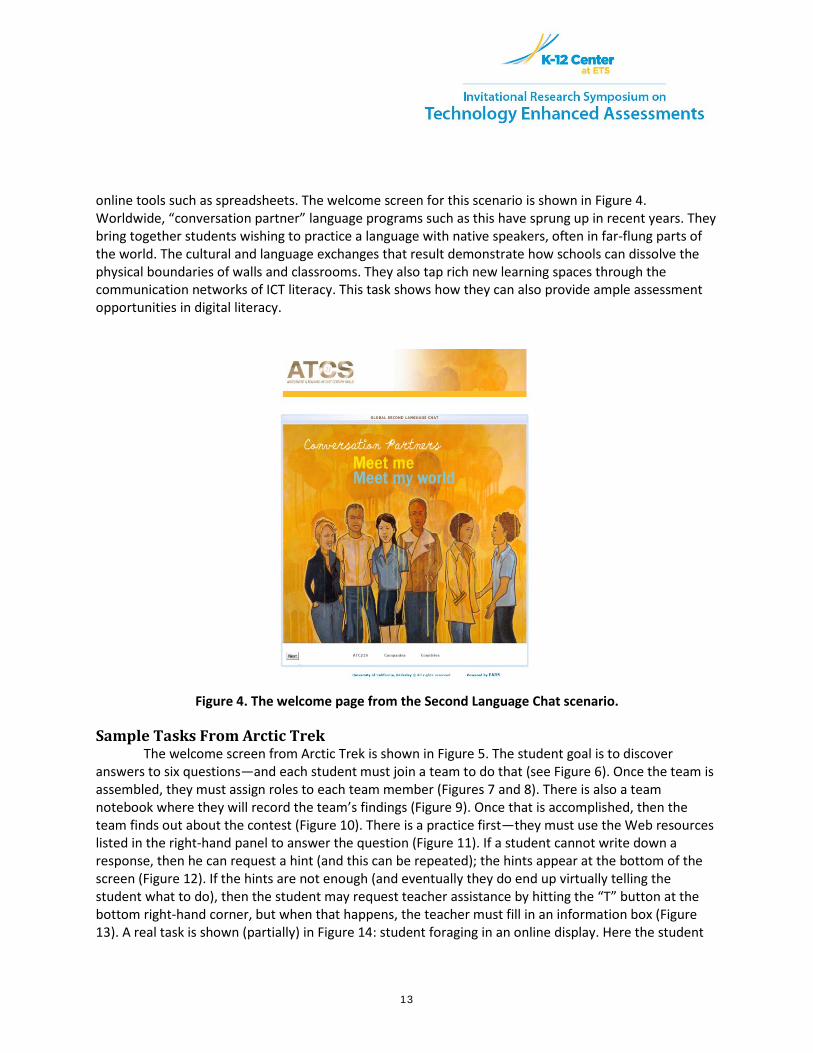
online tools such as spreadsheets. The welcome screen for this scenario is shown in Figure 4. Worldwide, “conversation partner” language programs such as this have sprung up in recent years. They bring together students wishing to practice a language with native speakers, often in far-flung parts of the world. The cultural and language exchanges that result demonstrate how schools can dissolve the physical boundaries of walls and classrooms. They also tap rich new learning spaces through the communication networks of ICT literacy. This task shows how they can also provide ample assessment opportunities in digital literacy.
Figure 4. The welcome page from the Second Language Chat scenario.
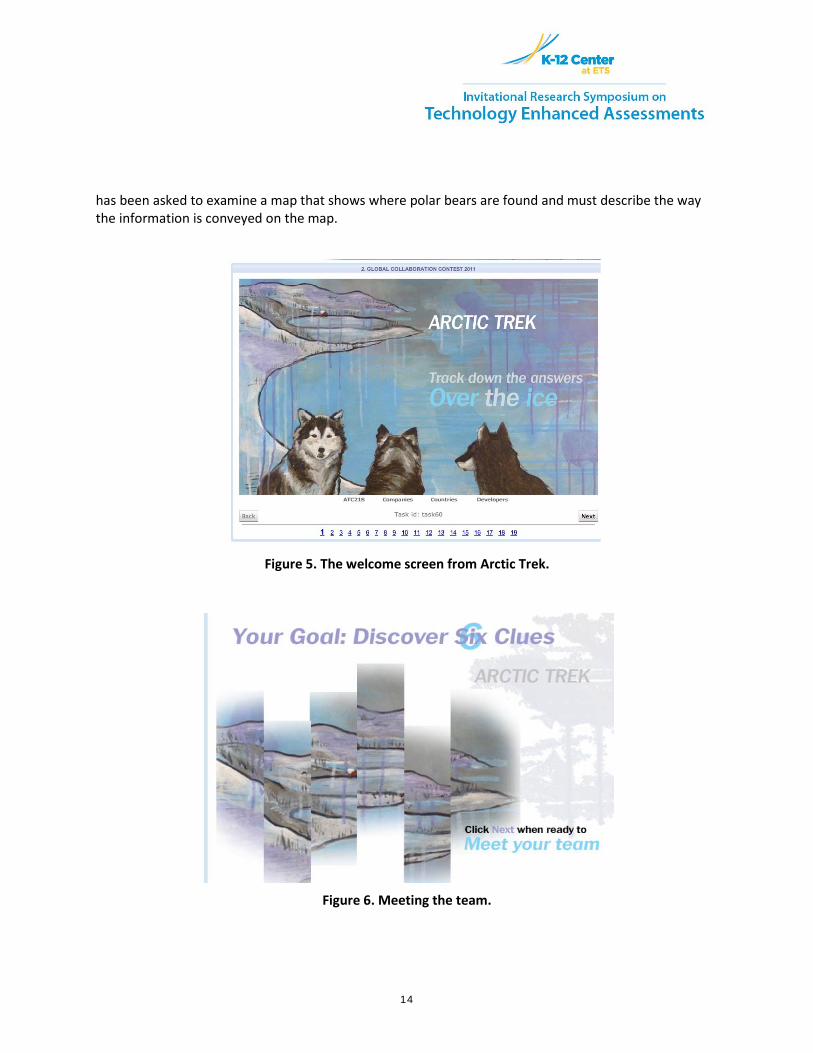
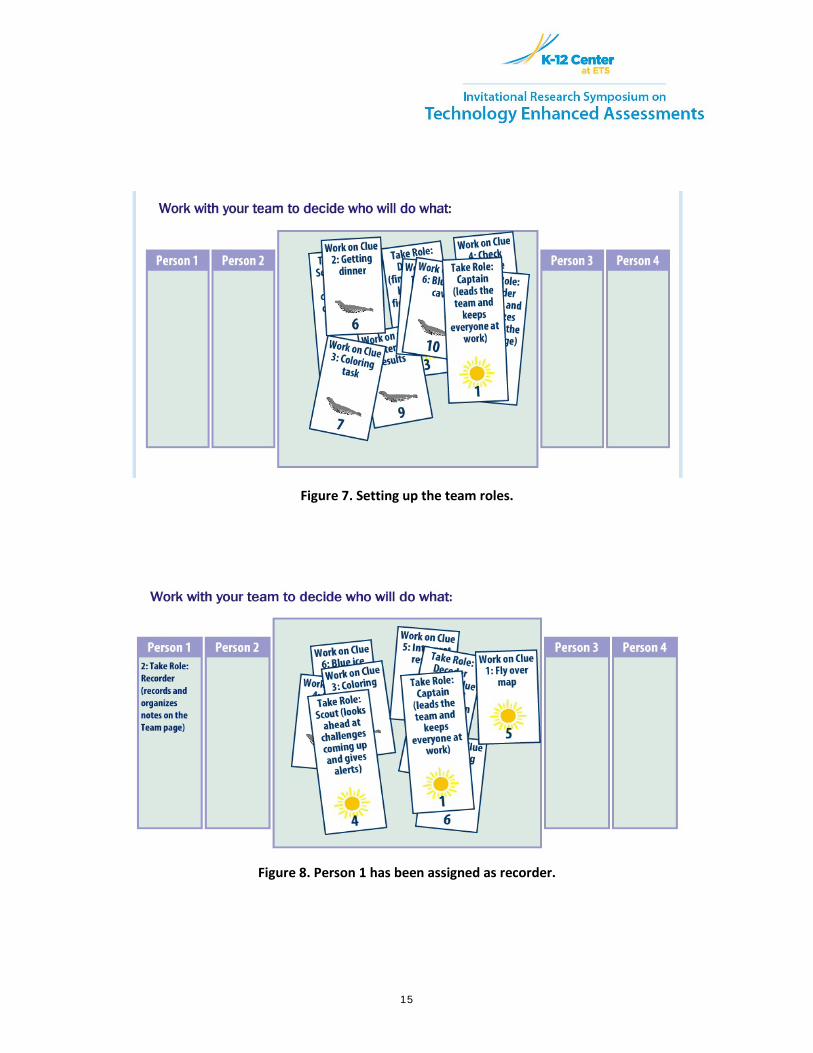
Sample Tasks From Arctic Trek The welcome screen from Arctic Trek is shown in Figure 5. The student goal is to discover
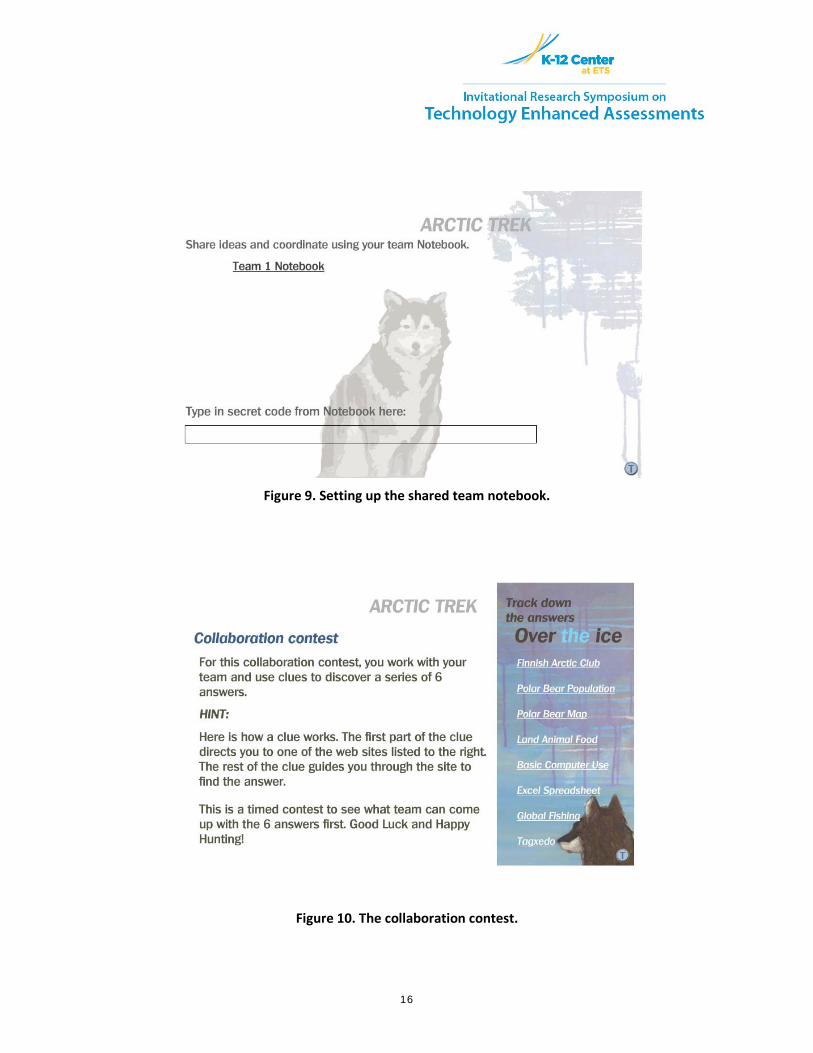
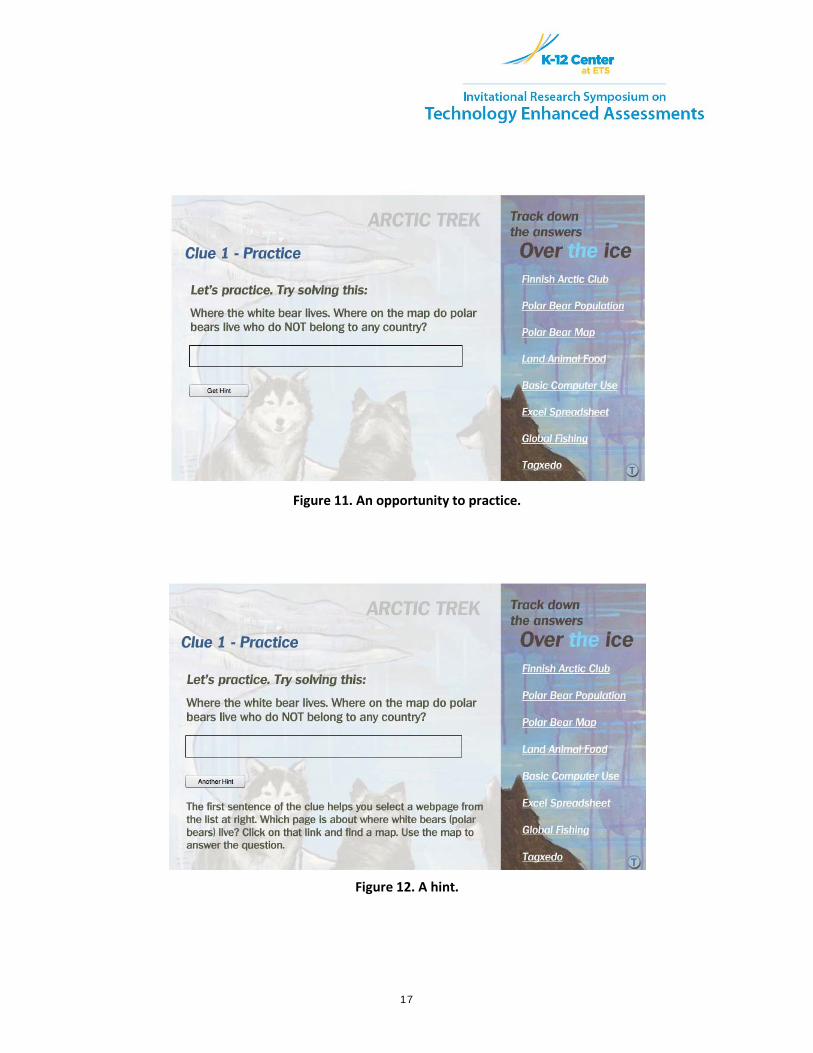
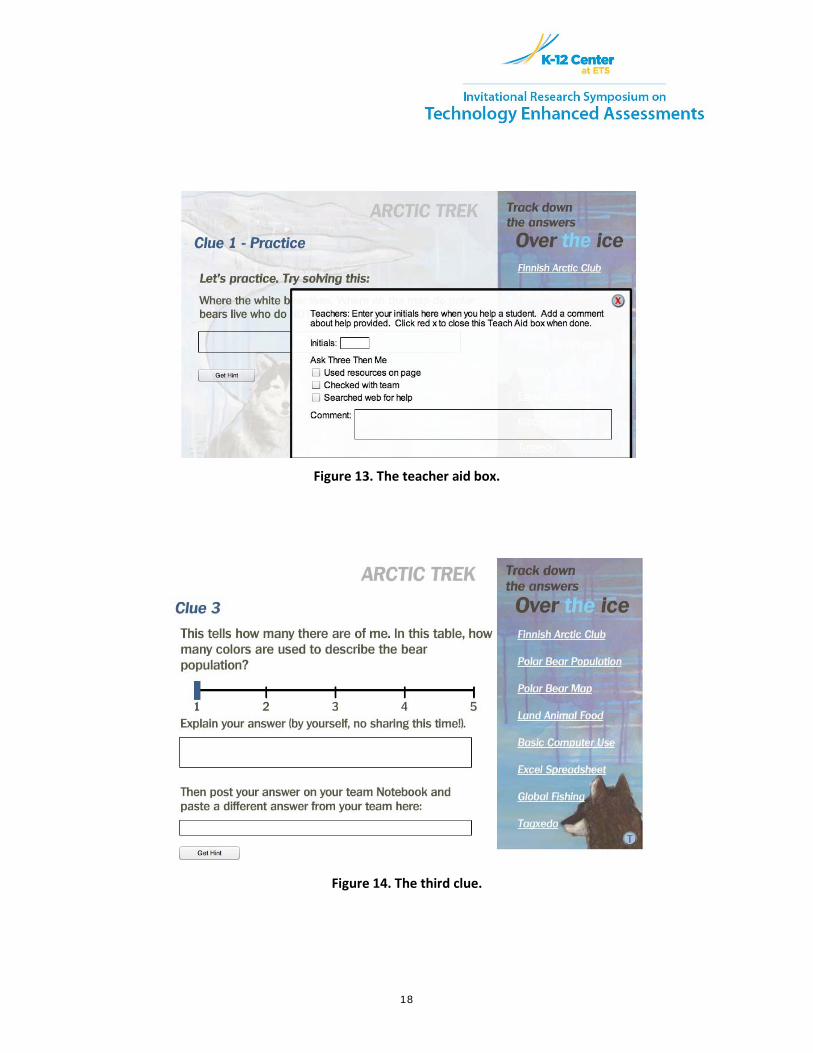
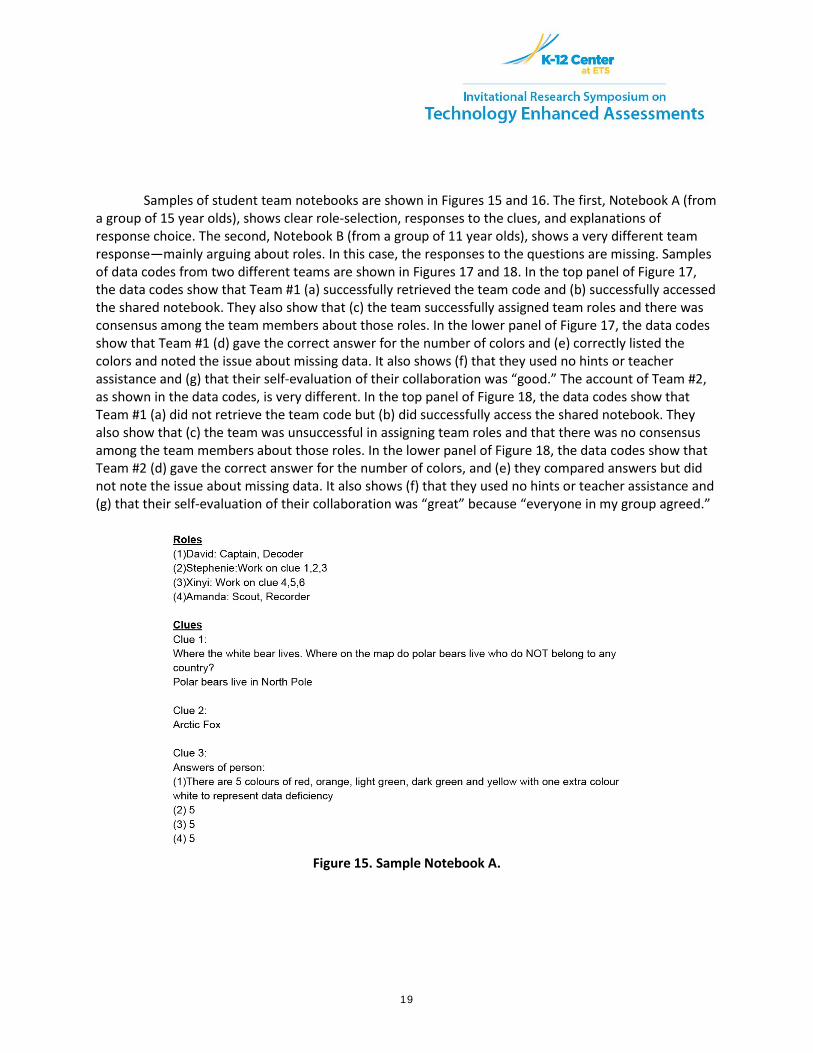
answers to six questions—and each student must join a team to do that (see Figure 6). Once the team is assembled, they must assign roles to each team member (Figures 7 and 8). There is also a team notebook where they will record the team’s findings (Figure 9). Once that is accomplished, then the team finds out about the contest (Figure 10). There is a practice first—they must use the Web resources listed in the right-hand panel to answer the question (Figure 11). If a student cannot write down a response, then he can request a hint (and this can be repeated); the hints appear at the bottom of the screen (Figure 12). If the hints are not enough (and eventually they do end up virtually telling the student what to do), then the student may request teacher assistance by hitting the “T” button at the bottom right-hand corner, but when that happens, the teacher must fill in an information box (Figure 13). A real task is shown (partially) in Figure 14: student foraging in an online display. Here the student
14
has been asked to examine a map that shows where polar bears are found and must describe the way the information is conveyed on the map.
Figure 5. The welcome screen from Arctic Trek.
Figure 6. Meeting the team.
15
Figure 7. Setting up the team roles.
Figure 8. Person 1 has been assigned as recorder.
16
Figure 9. Setting up the shared team notebook.
Figure 10. The collaboration contest.
17
Figure 11. An opportunity to practice.
Figure 12. A hint.
18
Figure 13. The teacher aid box.
Figure 14. The third clue.
19
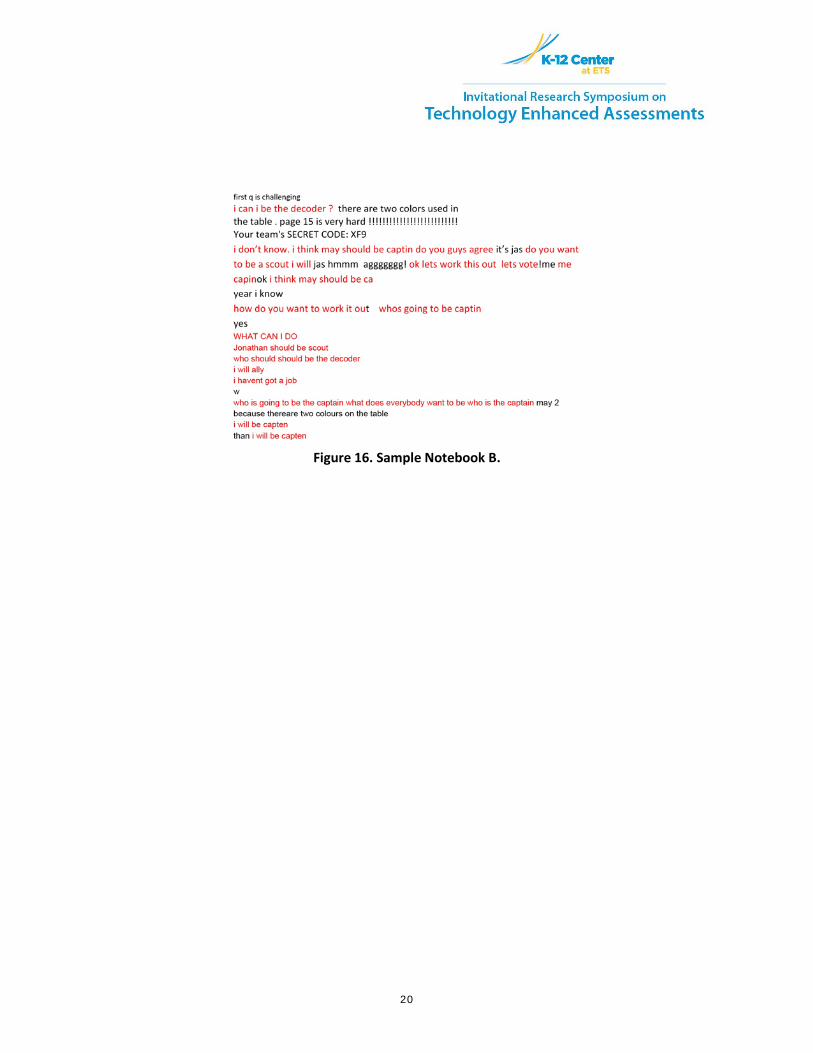
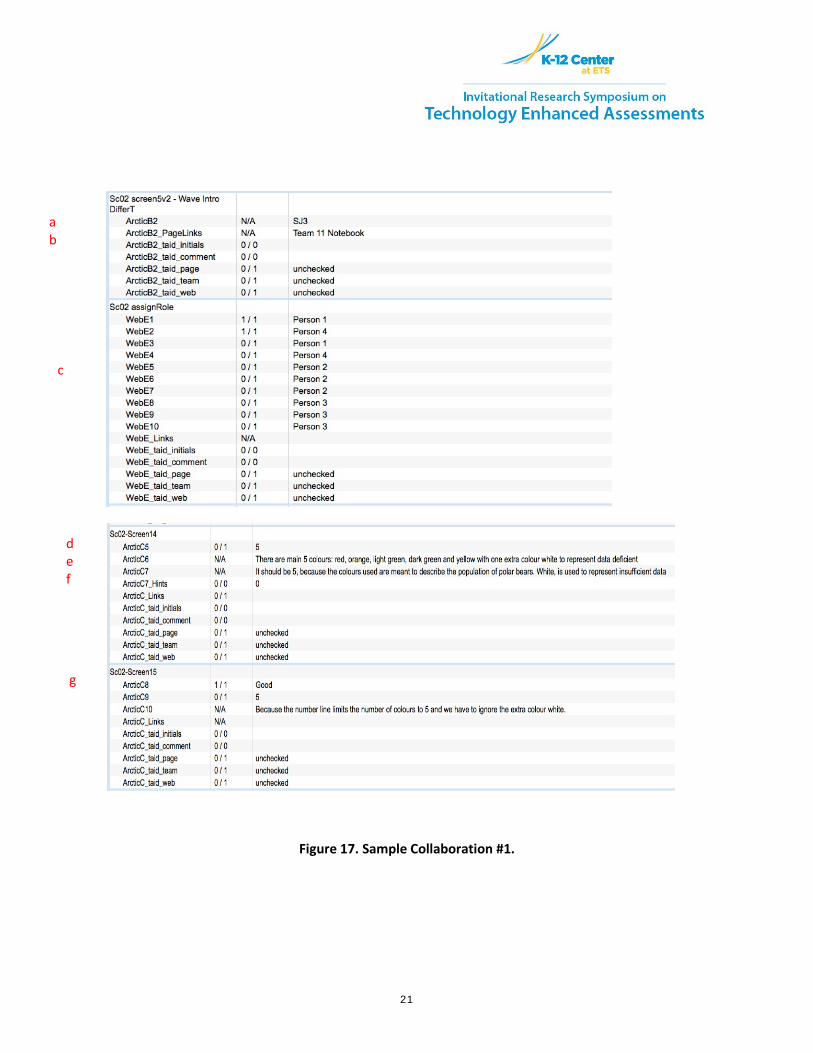
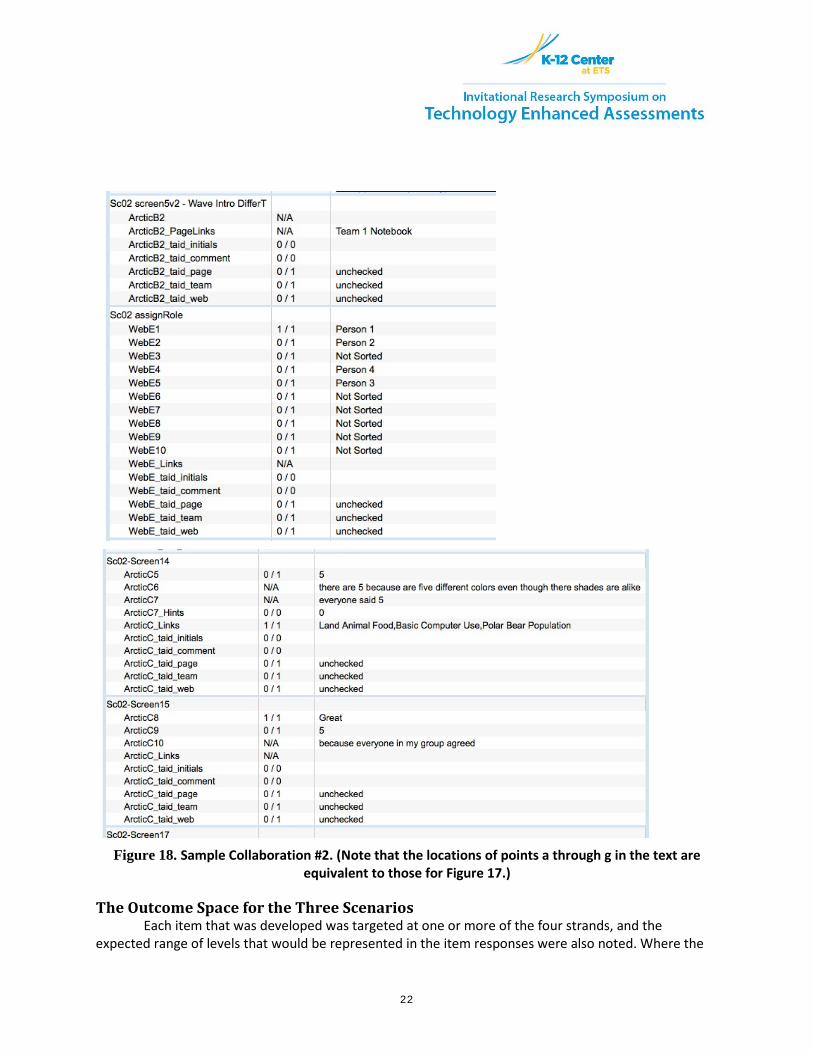
Samples of student team notebooks are shown in Figures 15 and 16. The first, Notebook A (from a group of 15 year olds), shows clear role-selection, responses to the clues, and explanations of response choice. The second, Notebook B (from a group of 11 year olds), shows a very different team response—mainly arguing about roles. In this case, the responses to the questions are missing. Samples of data codes from two different teams are shown in Figures 17 and 18. In the top panel of Figure 17, the data codes show that Team #1 (a) successfully retrieved the team code and (b) successfully accessed the shared notebook. They also show that (c) the team successfully assigned team roles and there was consensus among the team members about those roles. In the lower panel of Figure 17, the data codes show that Team #1 (d) gave the correct answer for the number of colors and (e) correctly listed the colors and noted the issue about missing data. It also shows (f) that they used no hints or teacher assistance and (g) that their self-evaluation of their collaboration was “good.” The account of Team #2, as shown in the data codes, is very different. In the top panel of Figure 18, the data codes show that Team #1 (a) did not retrieve the team code but (b) did successfully access the shared notebook. They also show that (c) the team was unsuccessful in assigning team roles and that there was no consensus among the team members about those roles. In the lower panel of Figure 18, the data codes show that Team #2 (d) gave the correct answer for the number of colors, and (e) they compared answers but did not note the issue about missing data. It also shows (f) that they used no hints or teacher assistance and (g) that their self-evaluation of their collaboration was “great” because “everyone in my group agreed.”
Figure 15. Sample Notebook A.
20
Figure 16. Sample Notebook B.
21
Figure 17. Sample Collaboration #1.
a b
c
d e f
g
22
Figure 18. Sample Collaboration #2. (Note that the locations of points a through g in the text are
equivalent to those for Figure 17.)
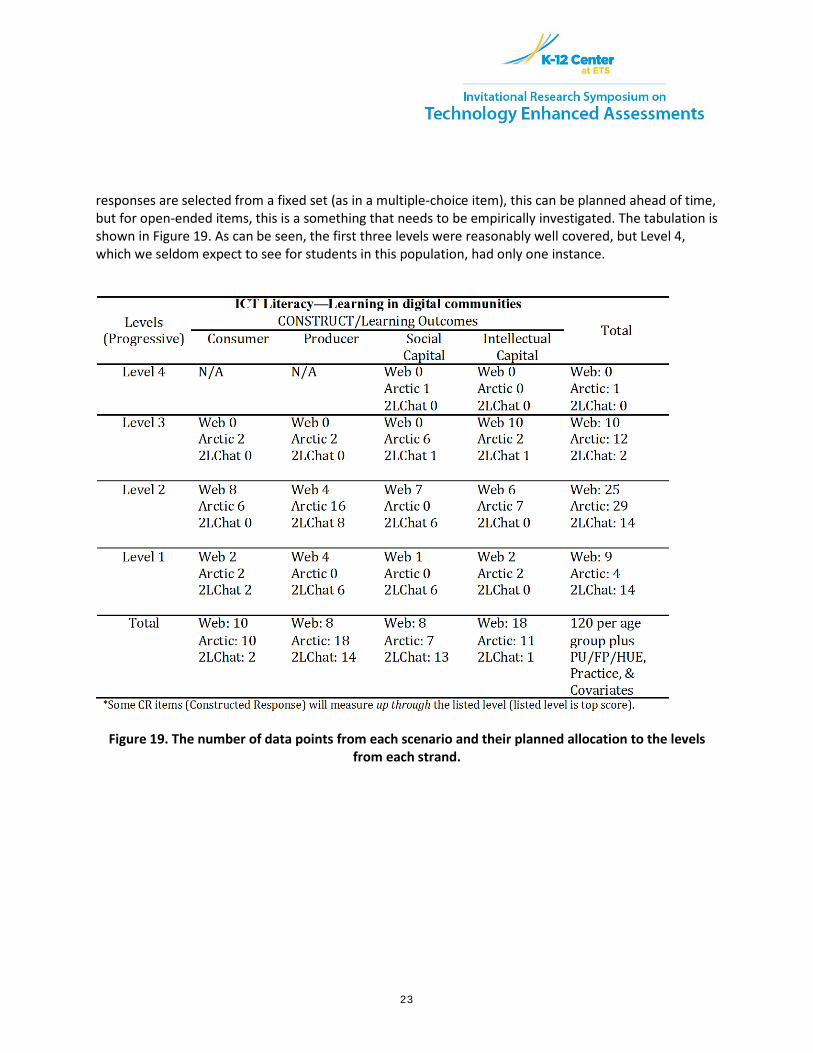
The Outcome Space for the Three Scenarios Each item that was developed was targeted at one or more of the four strands, and the
expected range of levels that would be represented in the item responses were also noted. Where the
23
responses are selected from a fixed set (as in a multiple-choice item), this can be planned ahead of time, but for open-ended items, this is a something that needs to be empirically investigated. The tabulation is shown in Figure 19. As can be seen, the first three levels were reasonably well covered, but Level 4, which we seldom expect to see for students in this population, had only one instance.
Figure 19. The number of data points from each scenario and their planned allocation to the levels from each strand.
24
Samples of teachers in Australia, Finland, Singapore and the United States were asked to provide feedback about draft tasks for ICT literacy. Those teachers were provided with access through a teacher interface and for each set of tasks they were asked a set of questions to consider. These questions included the following:
• For Webspiration o What skills or capabilities do you think the tasks are targeting?
o Considering the capabilities of your students, are there any questions or activities that should be eliminated from this scenario for students of specified ages (11, 13 and 15 years)?
• For Arctic Trek
o Identify and write down two clues to retain and two clues to eliminate from the task for students of specified ages.
• For Second Language Chat o At what age do you believe native speakers would be able to learn and use a rating
system? o At what age would native speakers be able to facilitate a chat topic? o Suggest a chat topic for language learners at the selected age that has the potential to
engage them. Cognitive laboratories, which involve small samples of students who attempt the tasks and
respond to questions about them, were also carried out in the four countries on all three task demonstrations. Information from these two sources contributed to the final editing of the tasks and to the compilation of the information in Figure 19.
Results From the Pilot Study In the pilot study two of the three scenarios were selected for further studies with students. The
two, the science/math Arctic Trek collaboration contest and the Webspiration shared literature analysis task, were identified by participating countries as the most desirable to pilot at this time, due to several reasons. The reasons included that they were more aligned with traditional school systems in the countries, which rarely used cross-country chat tools in the classroom but sometimes did employ math simulations and online scientific documents as well as graphical and drawing tools for student use. By contrast, the third task of the Second Language Chat was described by participating countries, teachers, and schools as a forward-looking, intriguing scenario but farther away on the adoption curve for school-based technology.
Not all of the planned automated scoring and data analysis for the items in the two piloted scenarios has been applied to this data set, as the total numbers of cases was too small for the empirically based scoring to be successfully calibrated. This analysis will be completed when larger data sets are available. Each of the two scenarios were presented in three forms, for 11-, 13-, and 15-year-olds, respectively, with a subset of common items across the three forms. Due to the nature of the pilot
25
study data design, results for the two scenarios are reported separately. The data were analyzed using a partial credit item response model (Masters, 1982), and the estimation software was ConQuest 2.0 (Wu, Adams, Wilson, & Haldane, 2007).
For the Webspiration scenario, 176 cases were collected in Australia, Finland, Singapore, and the United States. A total of approximately 90% of the items were auto-scored, and 10% were hand-scored (by trained scorers using a common scoring guide). There are 61 items in the three forms, and 16 are common across all forms. Approximately 10% of the items showed significant misfit—these items will be retained for further examination in the field test. The reliability was estimated at 0.93 using the EAP formulation (Wu et al., 2007). The Wright Map, showing how items compare to students on the composite learning in networks latent variable is shown in Figure 20.
Figure 20. Wright Map for composite construct using the Webspiration scenario.
26
Note that, due to the small number of cases available at this point, the four strands are all mapped onto the same composite variable—with greater numbers of sample cases; this will be investigated using a multidimensional model. The map shows that students are reasonably well matched by the range of item difficulties. Examination of the match between empirical locations of the item response and the four strand construct maps resulted in a segmentation of the variable into five levels that correspond quite well with the planned levels.
The five levels are indicated by the alternating yellow and white bands in Figure 20. The lowest two bands are associated with the first level of the strand construct maps. In the lowest band students are required to move information (e.g., cut/paste, drag/drop, texting), ask simple questions, and begin to use rankings to arrange crowd-sourced information. In the second band, students correctly access team and individual pages provided and begin to discriminate among the crowd-sourced information provided. The third band is associated with the second levels of the strand construct maps: Students search for targeted information, create links to displayed ideas, and use context to discriminate crowd-sourced information. The fourth band also is associated with the second level of the strand construct maps: Students access digital tools and resources available in the environment, and select/share tagged ideas. The highest band is associated with the third level of the strand construct maps: Students create explanations in new media and use tools to share products with others in new interfaces. As expected, this highest level is rarely seen in the data for the sample population assessed in the tasks to date.
For the Arctic Trek scenario, 135 cases were collected in Australia, Finland, and the United States. A total of approximately 84% of the items were autoscored, and 16% were handscored (again, by trained scorers using a common scoring guide). There are 25 items in the three forms, and 20 are common across all forms. Approximately 8% of the items showed significant misfit—these items will be retained for further examination in the field test. The reliability was estimated at 0.88 using the EAP formulation (Wu et al., 2007). The Wright Map for the Arctic Trek data yielded similar results as for the Webspiration case.
In summary, these preliminary results show that it is indeed feasible to collect data on a new variable such as learning in networks using innovative item types that encompass Web resources. The reliability coefficients that were observed were quite strong, even though the number of items in Arctic Trek was not very large. The good match between the expected levels of response and the empirical results indicate quite sound levels of internal structure validity.
Conclusion and Next StepsMeasuring collaborative digital literacy as described here is helping us understand how students think and work differently than in previous decades. Accessing, using, and creating information and knowledge digitally employ many important skills needed today for career and college readiness. This paper describes a domain modeling process for assessing collaborative digital literacy through BAS along with examples of task development and results from implementation of a pilot study in four countries.
The domain modeling process is as yet incomplete for this set of constructs. The hypothesis indicated in Figure 1 has not yet been properly tested (that will have to wait until we have a larger data set from field trials), and indeed, the final form of the hypothesized structure is also incomplete. What is as yet missing is a next level of elaboration of the learning progression, which is characterized by hypothesized links between the levels of different constructs. The substantive and empirical discovery process that establishes these hypotheses is not yet complete, but the full diagram will be more like the
27
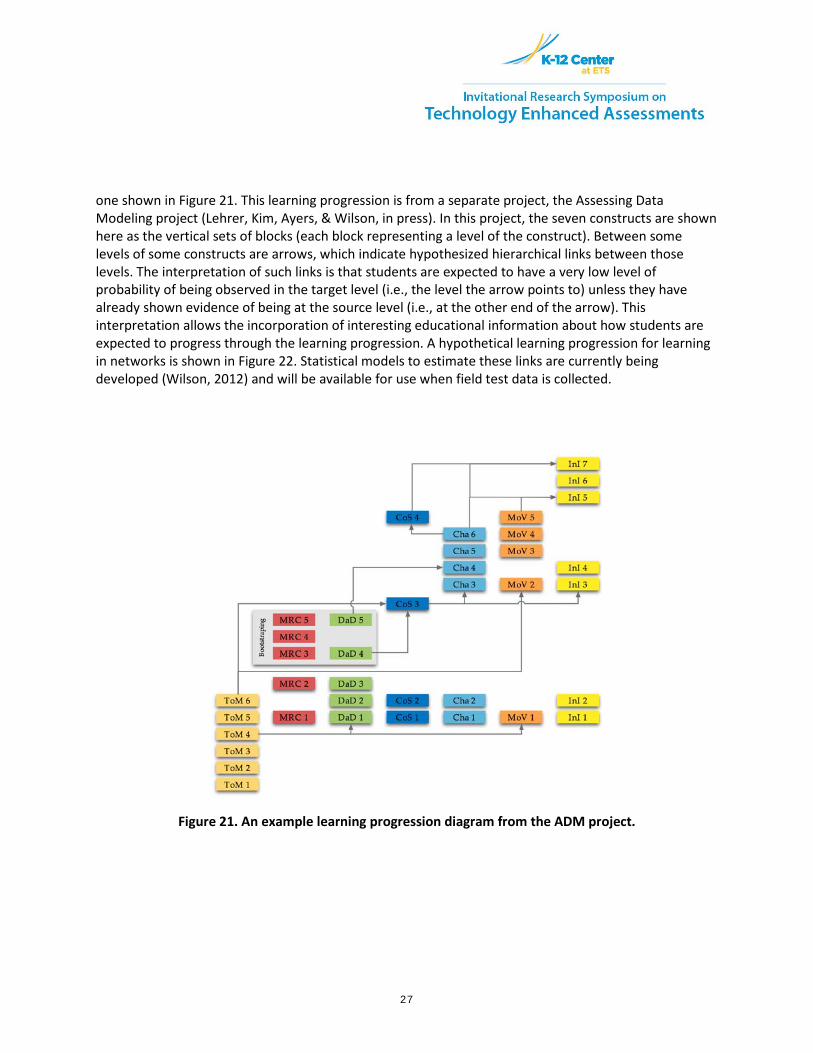
one shown in Figure 21. This learning progression is from a separate project, the Assessing Data Modeling project (Lehrer, Kim, Ayers, & Wilson, in press). In this project, the seven constructs are shown here as the vertical sets of blocks (each block representing a level of the construct). Between some levels of some constructs are arrows, which indicate hypothesized hierarchical links between those levels. The interpretation of such links is that students are expected to have a very low level of probability of being observed in the target level (i.e., the level the arrow points to) unless they have already shown evidence of being at the source level (i.e., at the other end of the arrow). This interpretation allows the incorporation of interesting educational information about how students are expected to progress through the learning progression. A hypothetical learning progression for learning in networks is shown in Figure 22. Statistical models to estimate these links are currently being developed (Wilson, 2012) and will be available for use when field test data is collected.
Figure 21. An example learning progression diagram from the ADM project.
28
Figure 22. A hypothetical learning progression for learning in networks.
29
The participating ATC21S countries through the first phases of this project have helped illustrate how their teachers and school systems support students to develop these competencies. Conclusions from the pilot studies include that students in the 11- to 15-year age group show widely differing knowledge and skills in these areas. Some are only beginning to make first tentative steps toward digital competence while other students exhibit quite breathtaking levels of mastery, such as collaborating seamlessly to create insightful audio commentaries and sharing them for common understanding in mere moments. Differences in what students can do, and the absence of formal teaching and opportunities to learn these skills, point to a fast widening gap between what schools offer and important ICT skills. ATC21S results are showing this gap to be particularly true when collaboration, creation, and problem solving are involved based on such early assessment efforts as described here.
Next steps for ATC21S involve wide-scale fieldwork trials for a segment of the tasks, currently drawn from the collaborative problem-solving domain, now being conducted in Australia, Finland, Singapore, and the United States, Associate countries Costa Rica and The Netherlands are joining in to help test how language and culture affect the 21st-century teaching and assessments. The digital literacy domain tasks described here are being used to explore the language and culture localization process.
The final phase of the project will place the ATC21S resources in the public domain. This placement will allow government policymakers, teachers, school systems, and assessment institutions to download, modify, and extend existing research and materials. This may help to more broadly bring the 21st-century skill domains described here into classrooms around the world. However, certainly an important contribution is to encourage more conversation on how information age trends do not stop at the school door.
Acknowledgments We thank the ATC21S project and its funders for their support for the work reported in this
report. We also acknowledge the expertise and creative input of the ATC21S Expert Panel in ICT Literacy: John Ainley (chair), Julian Fraillon, Peter Pirolli, Jean-Paul Reeff, Kathleen Scalise, Mark Wilson. Of course, the views and opinions expressed in this paper are those of the authors alone.
30
References Binkley, M., Erstad, O., Herman, J., Raizen, S., Ripley, M., Miller-Ricci, M., & Rumble, M. (2012).
Defining twenty-first century skills. In P. Griffin, B. McGaw, & E. Care (Eds.), Assessment and teaching of 21st century skills. Dordrecht, Germany: Springer.
Cisco, Intel, Microsoft (CIM). (2008). Transforming education: Assessing and teaching 21st century skills. Retrieved from http://atc21s.org/wp-content/uploads/2011/04/Cisco-Intel-Microsoft-Assessment-Call-to-Action.pdf
Griffin, P., McGaw, B., & Care, E. (Eds.). (2012). Assessment and teaching of 21st century skills. Dordrecht, Germany: Springer.
Lehrer, R., Kim, M-J., Ayers, E., & Wilson, M. (in press). Toward establishing a learning progression to support the development of statistical reasoning. In J. Confrey and A. Maloney (Eds.), Learning over time: Learning trajectories in mathematics education. Charlotte, NC: Information Age Publishers.
Masters, G. (1982). A Rasch model for partial credit scoring. Psychometrika, 47(2), 149–174. Pellegrino, J., Chudowsky, N., & Glaser, R. (Eds.). (2001). Knowing what students know: The science
and design of educational assessment. Washington, DC: National Academy Press. Wilson, M. (2005). Constructing measures: An item response modeling approach. Mahwah, NJ:
Erlbaum. Wilson, (2009a, December). Assessment for learning and for accountability. Paper presented at the
Exploratory Seminar: Measurement Challenges Within the Race to the Top Agenda, ETS, Princeton, NJ.
Wilson, (2009b, December). Assessment for learning and for accountability. Policy brief from the Exploratory Seminar: Measurement Challenges Within the Race to the Top Agenda, ETS, Princeton, NJ.
Wilson, M. (2012). Responding to a challenge that learning progressions pose to measurement practice: hypothesized links between dimensions of the outcome progression. In A. C. Alonzo & A. W. Gotwals (Eds.), Learning progressions in science. Rotterdam, The Netherlands: Sense Publishers.
Wilson, M., Bejar, I., Scalise, K., Templin, J., Wiliam, D., & Torres-Irribarra, D. (2012). Perspectives on methodological issues. In P. Griffin, B. McGaw, & Care, E. (Eds.), Assessment and teaching of 21st century skills. Dordrecht, Germany: Springer.
Wilson, M., & Sloane, K. (2000). From principles to practice: An embedded assessment system. Applied measurement in education, 13(2), 181–208.Retrieved from http://www.informaworld.com/smpp/content~content=a783685281~db=all
Wu, M., Adams, R., Wilson, M., & Haldane, S. (2007). ConQuest: Generalised item response modelling software (Version 2.0). Camberwell, Australia: ACER Press.
The Center for K–12 Assessment & Performance Management at ETS creates timely events where
conversations regarding new assessment challenges can take place, and publishes and disseminates the best thinking and research on the range of measurement
issues facing national, state and local decision makers.
Copyright 2012 by Mark Wilson and Kathleen Scalise.
ETS is a registered trademark of Educational Testing Service (ETS).