measuring central banks communications with machine …
TRANSCRIPT
Universidade de BrasíliaFaculdade de Economia, Administração e Contabilidade
Departamento de Economia
Measuring Central BanksCommunications with Machine Learning
Santiago Ravassi
Brasília2020

Santiago Ravassi
Measuring Central Banks Communications withMachine Learning
Tese apresentada ao Programa deDoutorado em Economia da Universidadede Brasília como requisito à obtenção dotítulo de Doutor em Ciências Econômicas.
Universidade de Brasília
Faculdade de Economia, Administração e Contabilidade
Departamento de Economia
Orientador: Prof. Daniel Oliveira Cajueiro, PhD
Brasília2020

Santiago Ravassi
Measuring Central Banks Communications withMachine Learning
Tese apresentada ao Programa deDoutorado em Economia da Universidadede Brasília como requisito à obtenção dotítulo de Doutor em Ciências Econômicas.
Prof. Daniel Oliveira Cajueiro, PhDUniversidade de Brasília
Orientador
Profa. Marina Delmondes de CarvalhoRossi, PhD
Universidade de Brasília
Profa. Gisele Ferreira Tiryaki, PhDUniversidade Federal da Bahia
Prof. Herbert Kimura, PhDUniversidade de Brasília
Prof. José Guilherme de LaraResende, PhD
Universidade de Brasília
Brasília2020

Agradecimentos
Agradeço primeiramente ao meu orientador, Professor Daniel Oliveira Ca-jueiro, pela paciência, disponibilidade e tempo, além de suas intervenções semprecontributivas.
À Coordenação de Aperfeiçoamento de Pessoal de Nível Superior (CAPES)pela bolsa concedida. Aos professores do Programa de Pós-Graduação em Economiapor permitir acesso a uma excelente formação e ao pessoal do Departamento peladisponibilidade e ajuda indispensáveis.
Aos professores membros da banca examinadora de qualificação e da tesepelas contribuições fundamentais para a melhoria e aperfeiçoamento deste trabalho.


A mis dos amores:Lívia y Martincito


AbstractThis thesis comprises three articles that use natural language processing and eitherunsupervised or supervised machine learning algorithms to get different measuresof central banks announcements. In the first article, we quantify the optimismof the announcements from the European Central Bank and the Federal Reserve.We empirically show that more optimistic announcements affects the Brazils termstructure of interest rates. In the second article, we analyze the evolution of minutesreleased by the Central Bank of Brazil under different presidencies. We score thediscussion on the minutes in four different macroeconomic dimensions: inflation,economic growth, employment, and fiscal policy. We find inflation is the principalconcern followed by employment, growth, and fiscal policy. We also find that theattention to inflation attains a historic maximum during the Goldfajn and CamposNetos presidency. In the third article, we develop a crisis dictionary with the aidof a supervised machine learning. With this dictionary, we create an index thatmeasures the crisis sentiment of the Federal Reserve Federal Open Market Com-mittee minutes. We empirically show the index predicts the interest rate level andvolatility of the US treasuries. We also show that our index significantly outperformsthe predictive power of indices created with the Correa, the Harvard-IV and theLoughran-McDonald dictionaries.
Keywords: Central banking, Monetary policy, Machine learning, Natural lan-guage processing, Dictionary, Spillover, Interest Rate


ResumoA presente tese está constituída por três artigos que utilizam processamento delinguagem natural e aprendizagem de máquina, tanto não supervisionado comosupervisionado, para obter diferentes medidas de anúncios de bancos centrais. Noprimeiro artigo, quantificamos o otimismo dos anúncios do Banco Central Europeu eda Reserva Federal (Fed). Mostramos, empiricamente, que anúncios mais otimistastêm um efeito na estrutura a termos da taxa de juros. No segundo artigo, analisamosa evolução das atas divulgadas pelo Banco Central do Brasil sob diferentes presidên-cias. Marcamos a discussão da ata em quatro diferentes dimensões macroeconômicas:inflação, crescimento econômico, emprego e política fiscal. Constatamos que a in-flação é a principal preocupação, seguida pelo emprego, crescimento e política fiscal.Também descobrimos que a atenção à inflação atinge um máximo histórico durantea presidência de Goldfajn e Campos Neto. No terceiro artigo, desenvolvemos umdicionário de crise com a ajuda de aprendizagem de máquina supervisionada. Comeste dicionário, criamos um índice que mede o sentimento de crise das atas doComitê Federal de Mercado Aberto da Reserva Federal. Mostramos, empiricamente,que o índice prevê o nível e a volatilidade das taxas de juros dos tesouros dos EUA.Mostramos também que o nosso índice supera significativamente o poder preditivodos índices criados com os dicionários de Correa, Harvard-IV e Loughran-McDonald.
Palavras-chave: Banco central, Política monetária, Aprendizagem de máquina,Processamento de linguagem natural, Dicionário, Efeito transbordamento, Taxa dejuros


List of figures
Figure 1 – Time-series of the press conferences length . . . . . . . . 29Figure 2 – Time-series of the press conferences optimistic factor . . 29Figure 3 – Time-series of the COPOM minutes length. . . . . . . . . 54Figure 4 – Macroeconomic scores. . . . . . . . . . . . . . . . . . . . . 55Figure 5 – Macroeconomic scores of the COPOM minutes. . . . . . 57Figure 6 – Index of Economic/Financial Crisis Index. . . . . . . . . . 70Figure 7 – Relative importance of words. . . . . . . . . . . . . . . . . 71

List of tables
Table 1 – Effect of the ECB press conferences on interest rates . . 28Table 2 – Effect of ECB introductory statements and questions ses-
sions on interest rates . . . . . . . . . . . . . . . . . . . . . . 31Table 3 – Effect of Fed minutes on interest rates . . . . . . . . . . . . 33Table 4 – Effect of ECB press conferences on interest rates volatility 36Table 5 – Effect of Fed minutes on interest rates volatility . . . . . 37Table 6 – Effect of ECB introductory statements and questions ses-
sions on lagged interest rates . . . . . . . . . . . . . . . . . 39Table 7 – Effect of random ECB introductory statements and ques-
tions sessions on interest rates . . . . . . . . . . . . . . . . . 40Table 8 – Effect of Fed minutes on lagged interest rates . . . . . . . 41Table 9 – Effect of random Fed minutes on interest rates . . . . . . 41Table 10 – Effect of random ECB press conferences on interest rates
volatility . . . . . . . . . . . . . . . . . . . . . . . . . . . . . . 43Table 11 – Effect of random Fed minutes on interest rates volatility 44Table 12 – Minutes analyzed . . . . . . . . . . . . . . . . . . . . . . . . . 50Table 13 – Groups used to measure inflation . . . . . . . . . . . . . . . 52Table 14 – Groups used to measure economic growth . . . . . . . . . 52Table 15 – Groups used to measure employment . . . . . . . . . . . . 53Table 16 – Groups used to measure fiscal policy . . . . . . . . . . . . . 53Table 17 – Books used for extracting the crisis features . . . . . . . . 64Table 18 – Books used for extracting the theory features . . . . . . . 65Table 19 – FOMC Minutes, Interest Rates and Volatility . . . . . . . 67Table 20 – Federal Reserve FOMC Minutes Crisis Index and Inter-
est Rate . . . . . . . . . . . . . . . . . . . . . . . . . . . . . . . 72Table 21 – Federal Reserve FOMC Minutes Crisis Index and Volatil-
ity . . . . . . . . . . . . . . . . . . . . . . . . . . . . . . . . . . 73Table 22 – Federal Reserve FOMC Minutes Crisis Index and 1-Year
Interest Rate (DGS1) . . . . . . . . . . . . . . . . . . . . . . 75

Table 23 – Federal Reserve FOMC Minutes Crisis Index and 2-YearInterest Rate (DGS2) . . . . . . . . . . . . . . . . . . . . . . 76
Table 24 – Federal Reserve FOMC Minutes Crisis Index and 3-YearInterest Rate (DGS3) . . . . . . . . . . . . . . . . . . . . . . 77
Table 25 – Federal Reserve FOMC Minutes Crisis Index and 5-YearInterest Rate (DGS5) . . . . . . . . . . . . . . . . . . . . . . 78
Table 26 – Federal Reserve FOMC Minutes Crisis Index and 7-YearInterest Rate (DGS7) . . . . . . . . . . . . . . . . . . . . . . 79
Table 27 – Federal Reserve FOMC Minutes Crisis Index and 10-Year Interest Rate (DGS10) . . . . . . . . . . . . . . . . . . 80
Table 28 – Federal Reserve FOMC Minutes Crisis Index and 20-Year Interest Rate (DGS20) . . . . . . . . . . . . . . . . . . 81
Table 29 – Federal Reserve FOMC Minutes Crisis Index and 30-Year Interest Rate (DGS30) . . . . . . . . . . . . . . . . . . 82
Table 30 – Federal Reserve FOMC Minutes Crisis Index and 1-YearInterest Rate Volatility (σDGS1) . . . . . . . . . . . . . . . . 83
Table 31 – Federal Reserve FOMC Minutes Crisis Index and 2-YearInterest Rate Volatility (σDGS2) . . . . . . . . . . . . . . . . 84
Table 32 – Federal Reserve FOMC Minutes Crisis Index and 3-YearInterest Rate Volatility (σDGS3) . . . . . . . . . . . . . . . . 87
Table 33 – Federal Reserve FOMC Minutes Crisis Index and 5-YearInterest Rate Volatility (σDGS5) . . . . . . . . . . . . . . . . 88
Table 34 – Federal Reserve FOMC Minutes Crisis Index and 7-YearInterest Rate Volatility (σDGS7) . . . . . . . . . . . . . . . . 89
Table 35 – Federal Reserve FOMC Minutes Crisis Index and 10-Year Interest Rate Volatility (σDGS10) . . . . . . . . . . . . 90
Table 36 – Federal Reserve FOMC Minutes Crisis Index and 20-Year Interest Rate Volatility (σDGS20) . . . . . . . . . . . . 91
Table 37 – Federal Reserve FOMC Minutes Crisis Index and 30-Year Interest Rate Volatility (σDGS30) . . . . . . . . . . . . 92
Table 38 – Federal Reserve FOMC Minutes Financial Stability In-dex and Interest Rate . . . . . . . . . . . . . . . . . . . . . . 93

Table 39 – Federal Reserve FOMC Minutes Financial Stability In-dex and Volatility . . . . . . . . . . . . . . . . . . . . . . . . . 93
Table 40 – Federal Reserve FOMC Minutes Sentiment with the Harvard-IV Dictionary and Interest Rate . . . . . . . . . . . . . . . 94
Table 41 – Federal Reserve FOMC Minutes Sentiment with the Harvard-IV Dictionary and Volatility . . . . . . . . . . . . . . . . . . 94
Table 42 – Federal Reserve FOMC Minutes Sentiment with the Loughran-MacDonald Dictionary and Interest Rate . . . . . . . . . . 95
Table 43 – Volatility . . . . . . . . . . . . . . . . . . . . . . . . . . . . . . 95Table 44 – Federal Reserve FOMC Minutes Sentiment with the Loughran-
McDonald Dictionary and Volatility . . . . . . . . . . . . . 95Table 45 – Federal Reserve FOMC Minutes the Loughran-McDonald
Dictionary and 30-Year Interest Rate (DGS30) . . . . . . 96

Contents
1 INTRODUCTION . . . . . . . . . . . . . . . . . . . . . . 17
2 INTERNATIONAL CENTRAL BANK COMMUNICA-TIONS SPILLOVERS TO BRAZILIAN CENTRAL BANK 19
2.1 Introduction . . . . . . . . . . . . . . . . . . . . . . . . . . . 202.2 Data . . . . . . . . . . . . . . . . . . . . . . . . . . . . . . . . 232.3 Measuring optimism . . . . . . . . . . . . . . . . . . . . . . 242.4 Results . . . . . . . . . . . . . . . . . . . . . . . . . . . . . . 262.4.1 Effect of the ECB press conferences on interest rates . 272.4.2 Effect of minutes on interest rates . . . . . . . . . . . . . 322.4.3 Effect of announcements interest rates volatility . . . . 332.5 Robustness . . . . . . . . . . . . . . . . . . . . . . . . . . . . 352.6 Conclusion . . . . . . . . . . . . . . . . . . . . . . . . . . . . 42
3 A QUANTITATIVE ASSESSMENT OF THE EVOLU-TION OF CENTRAL BANK OF BRAZIL COMMU-NICATIONS . . . . . . . . . . . . . . . . . . . . . . . . . 47
3.1 Introduction . . . . . . . . . . . . . . . . . . . . . . . . . . . 483.2 Data . . . . . . . . . . . . . . . . . . . . . . . . . . . . . . . . 503.3 Methodology . . . . . . . . . . . . . . . . . . . . . . . . . . . . 513.4 Results and Discussion . . . . . . . . . . . . . . . . . . . . 533.5 Conclusion . . . . . . . . . . . . . . . . . . . . . . . . . . . . 56
4 A MEASURE OF THE ECONOMIC AND FINAN-CIAL CRISIS SENTIMENT IN CENTRAL BANK COM-MUNICATIONS . . . . . . . . . . . . . . . . . . . . . . . 59
4.1 Introduction . . . . . . . . . . . . . . . . . . . . . . . . . . . 604.2 Literature Review . . . . . . . . . . . . . . . . . . . . . . . 624.3 Data . . . . . . . . . . . . . . . . . . . . . . . . . . . . . . . . 634.4 The Crisis dictionary and the Index . . . . . . . . . . . . 66
4.4.1 The Classifier . . . . . . . . . . . . . . . . . . . . . . . . . . 684.4.2 The Index . . . . . . . . . . . . . . . . . . . . . . . . . . . . 694.5 Methodology . . . . . . . . . . . . . . . . . . . . . . . . . . . 704.6 Robustness tests . . . . . . . . . . . . . . . . . . . . . . . . 734.6.1 Macroeconomic Information . . . . . . . . . . . . . . . . . 744.6.2 Other Indices . . . . . . . . . . . . . . . . . . . . . . . . . . 854.7 Conclusion . . . . . . . . . . . . . . . . . . . . . . . . . . . . 86
BIBLIOGRAPHY . . . . . . . . . . . . . . . . . . . . . . 97

17
1 Introduction
This thesis comprises three articles that use natural language processingand both unsupervised and supervised machine learning algorithms to quantify thecontent of central banks announcements. In the first article, we show empiricallythe association between either the Federal Open Market Committee (FOMC)minutes and the European Central Bank (ECB) press conferences and the Brazilianterm-structure of interest rates. To quantify the sentiment, we use the Harvard-IVdictionary in combination with the term frequency-inverse document frequencystatistic. We find an association between either both central banks announcementaffect the interest term structure in the same direction: an increase of the pessimismconveyed in the announcements, reduces the interest rate level. The FOMC minutesaffect longer maturities and are economically more significant than the ECB pressconferences. When we analyze the effect on the interest rate volatility, we find thatan increase in the optimism of the announcements reduces the interest rate volatilityon mid- and long-term maturities. Finally, we find that the release of the FOMCminutes has a significant reduction in the volatility, and on mid-term contracts.Also, optimistic minutes dominates this effect. These results show that Brazilsinterest rate trades monitor foreign central bank announcements and considerthat the decisions of the Central Bank of Brazil (CBB) are based not only on theBrazilian economy but also on the monetary policy of foreign central banks.
In the second article, we create dictionaries to quantify the importancethat different presidencies of the CBB place on each macroeconomic dimension:inflation, economic growth, employment, and fiscal policy. Rather than measuringthe sentiment that announcements convey, we are interested in measuring theemphasis that the CBB expresses. We use the principal component analysis. Wefind inflation is the major concern followed by both employment and growth; fiscalpolicy is the least relevant topic except during Tombinis second mandate. Finally,we also find that During Neto and Goldfajn, the inflation score attains a historicmaximum which shows a higher commitment to the inflation targeting policy.

Chapter 1. Introduction
In the last article, we use an elastic-net logistic regression classifier to developa crisis sentiment dictionary. We use the dictionary to create a real-time crisis indexof the FOMC minutes. We find that during the 2007-2008 financial crisis, up to 6%of the total number of words are crisis-related. We also show empirically that theindex predicts the interest rate and the volatility of the US treasuries: an incrementin the crisis sentiment predicts a reduction of the interest rate for intermediate-termmaturities and an increase of the volatility for long-term maturities. Finally, ourindex significantly outperforms the predictive power of the indices created with theCorrea, the Harvard-IV, and the Loughran-McDonald dictionaries.

19
2 International Central BankCommunications Spillovers toBrazilian Central Bank
Abstract
We empirically show that the European Central Bank (ECB) press conference andthe Federal Open Market Committee (FOMC) minutes impact the Brazils interestrate structure. We use an automated procedure to quantify the optimism of theannouncements and find more optimistic news drop interest rates. The FOMCminutes affect longer contracts and are economically more significant than the ECBpress conferences. Market reaction is higher to the ECB press conference than tothe introductory statement or the questions session. Regarding volatility, we alsofind economical and statistical significance for the mid- to long-term contracts.When either the FOMC minutes or the ECB press conference are more optimistic,they reduce volatility. Also, the release of either announcements reduce volatility,but this effect is statistically significant for the Fed minutes only.Keywords: Central banking, Monetary policy, Machine learning, Text mining,Natural language processing, Dictionary, Spillover, Interest Rate

Chapter 2. International Central Bank Communications Spillovers to Brazilian Central Bank
2.1 Introduction
With the adoption of inflation targeting in the 1990s central banks haveincreasingly become more transparent (MISHKIN, 2004). Central banks that useexplicit inflation objective as part of their monetary policy framework considertransparency a crucial policy. Transparency not only implies defining the targetinterest rate regularly and explaining the rationale behind these decisions but alsocommunicating the macroeconomic projections. This communication strategy istwo-fold. On one hand, it allows for a more adequate transmission to the market, andconsequently a faster reaction and more efficient achievement of the economic goals.On the other hand, since central banks regulate short-term interest rates and donot control any other interest rates, communication is an important monetary toolto regulate long-term rates. A good central bank communication, that also helps todevelop market expectations regarding long-term interest rates, is a more efficientmonetary policy (BERNANKE, 2004). After the 2008 crisis, forward guidance hasbecame an even more important monetary tool for central banks from developedeconomies with short-term interest rate close to zero (CAMPBELL et al., 2012). Inextreme cases, central bank communication can be the most important monetarytool of a central bank (BLINDER et al., 2008).
Our work tests the hypothesis that when a major foreign central bankreleases a pessimistic announcement, there should be a rise in the interest ratefutures of an emerging economy. Because a low and stable rate of prices is one ofthe main aims of central banks with a hierarchical or dual mandate, the tone oftheir announcements reflects inflation concerns. Variations in optimism conveyedby the central bank’s announcement affect interest rates across different contractlengths for their respective state or monetary union; optimistic announcementssignal the market that the bank will lower the interest rate. This change in marketexpectations will be reflected in a decrease in the interest rate of future contracts.Similarly, if a foreign country’s monetary institution raises the target interest rate,then there will be more capital moving to that country. Countries affected by thisforeign monetary policy will experience an outflow of capital to the foreign country,reducing their money supply. This flow of capital will exert upward pressure ontheir foreign interest rate.

2.1. Introduction 21
We empirically show that traders in Brazil’s market monitor foreign centralbank announcements and consider the monetary policy of the Central Bank ofBrazil (CBB) is based not only on the Brazilian economy but also on the decisionsmade by other central banks. An increase in the optimism of the ECB pressconference and the Federal Open Market Committee (FOMC) minutes reduce theinterest rates of the Brazilian futures. However, each announcement affects thestructure of interest rates differently. The FOMC minutes affect longer contractsand are economically more significant than the ECB press conferences. An increaseof one standard deviation of the optimistic factor of the ECB press conferencereduces the interest rate level in about 1 and 1.5 basic points for contracts rangingfrom four months to four years. The same change in the FOMC minutes is of 2basic points for two-year maturities or older. We also show that market reactionis more significant to changes in the ECB press conference than to its parts (theintroductory statement or the question session). Volatility in future interest ratesare also affected by both announcements. An increase of one standard deviationin the optimistic factor of either announcement reduces volatility by around tenpercent. The effect is statistically significant for the ECB press conferences and theFed minutes starting at two-year and three-year maturities, respectively. Also, thedisclosure of either announcement reduces volatility in all contracts. However, theeffect is only significant for optimistic Fed minutes, where their disclosure reducesthe volatility for two-year contracts or longer.
To measure the level of optimism in the announcements, we use the termfrequency-inverse document frequency (TFIDF) method on entries listed on theHarvard IV dictionary. TFIDF is a statistical method that evaluates the importanceof a word in a collection of scripts. Loughran and McDonald (2011) used the TFIDFmethod for the first time in the economic literature to analyze the corporate 10-Kreports.
We have chosen the effect of the ECB and the Fed on the Brazilian marketfor two reasons. First, measured by the power to buy or sell assets on a large scalewith an inflation target, the ECB and the Fed are the two major banks.1
1The ECB and the Fed explicitly aim for 2 percent inflation over time (ECB, 2019) and (FED,2015), but they are not inflation targeting banks since they do not follow a hierarchical mandatethat makes price stability the primary aim for monetary policy (MEYER, 2001).

Chapter 2. International Central Bank Communications Spillovers to Brazilian Central Bank
In terms of trade volume and reserve currency, the EUR is the second largestonly to the USD. Second, Brazil is an emerging economy with a central bank withinflation targeting. The Brasil Bolsa Balcão (B3) is the third-largest interest ratefutures market or options in the world and the largest among the emerging markets;in which 47% of the interest rates traders are non-residents.2 3
The following literature is closely related to our work. Regarding the ECB,Picault and Renault (2017) quantify the content of the press conference using aterm-weighting and contiguous sequence method and use it to both study the effecton stock market volatility and predict ECB decisions. Schmeling and Wagner (2019)use the Loughran and McDonald (2011) to study the effect of the press conferenceson asset prices. Concerning the Fed, Lucca and Trebbi (2009) developed a methodto measure central bank communications and used it to study the impact of FOMCstatements on the Treasury yield curve. Hansen and McMahon (2016) classifyFOMC communication into forward guidance or state of economic conditions anduse Latent Dirichlet Allocation to analyze how their tone to study the effect onmarket and real variables. Sharpe, Sinha and Hollrah (2017) use TFIDF to studythe predictive power in macroeconomics variables of the tonality of the Greenbookpublished by the Federal Reserve Board of Governors. As for the CBB, Carvalho,Cordeiro and Vargas (2013) use the method developed by Lucca and Trebbi (2009)to study the impact of statements on Brazil’s future interest rates. Chague et al.(2015) study the impact of COPOM minutes on Brazil’s future interest rates; theyuse principal component analysis to measure the level of optimism the minutes, amethod proposed by Tetlock (2007). Our work is different because these articlesexamine the effects the ECB, Fed, and CBB announcements have on their respectiveoverseeing territories, whereas we study the effect that the ECB and Fed have onBrazil’s market.2(FIA, 2018)3(B3, 2019)

2.2. Data 23
The remainder of this paper is organized as follows. Section 2.2 describesthe data we use for this study In Section 2.3 we explain how we use the TFIDFalgorithm to measure the optimism of central banks communications and providessome interpretation of the optimism of the announcements and the expectedinflation rate. In Section 2.4, we study the effect that the ECB press conferenceand the Fed minutes have on the Brazils interest rate level and volatility. Section2.5 presents robustness analysis. Section 2.6 concludes.
2.2 Data
For future interest rates, we use daily returns from the B3 stock marketwebpage. We construct the interest rates term structure with the following matu-rities: two-month, four-month, six-month, one-year, two-year, four-year, six-year,eight-year, and ten-year maturities. 4 Contracts up to eight years are availablefrom October 12, 2003, and contracts up to ten years are accessible from OctoberSeptember 16, 2005. We study the effect of ECB press conference on the matu-rities ranging from two months to eight years as the dependent variable and theone-month maturity as a control for surprises in the target interest rate decision.For the Fed minutes, we consider the contracts ranging from four months to tenyears as dependent variables, and we do not use a control variable. For the ECB,we use 169 press conference from October 2003 to April 2019. For the Fed, we use115 minutes from February 2005 to April 2019 for contracts up to eight years and109 minutes from September 2005 to April 2019 for the ten-year contract.4From October 12, 2003 to September 16, 2005, the B3 publishes contracts up to 2880 days andfrom October 16, 2005 discloses contracts up to 3660 days. For this reason, we get the eight-yearcontract from 2880 days (or seven years and ten months) and the ten-year contract from 3600days (or nine years and ten months).

Chapter 2. International Central Bank Communications Spillovers to Brazilian Central Bank
The ECB organizes the press conference immediately after disclosing thetarget rates announced in the monetary policy decisions, while the Fed releasesmeeting minutes three weeks after the disclosure of the target federal funds rate.Thus, with the ECB press conferences – and to differentiate between the effect ofthe announcement optimism and the disclosure of the new target rate – we need tocontrol for interest rate surprises. For this purpose, we get the difference, in thecurrent-month maturity interest rate of the Brazilian future, between the closingprices the day the announcement is released and the next trading day. We use thecurrent-month difference as the interest rate surprise control variable to analyzethe impact that the ECB press conferences have on the interest rate level. We usethe square root the of the absolute value of the current-month difference when westudy the effects of the ECB press conference on the interest rate volatility. Thisis the same variable used by Carvalho, Cordeiro and Vargas (2013) to control theimpact that the COPOM statements of the CBB have on Brazil’s interest ratefuture. Also, Lucca and Trebbi (2009) use the interest rate change of current-monthfederal funds futures to control the effect of Fed statements on treasury yields.
2.3 Measuring optimism
To quantify the optimism of the announcements we use an automatedprocedure similar to Tetlock (2007), Loughran and McDonald (2011), and Sharpe,Sinha and Hollrah (2017). We use the Harvard IV dictionary as Tetlock (2007)and the term weight method as Loughran and McDonald (2011), and the samedictionary and term weight method as Sharpe, Sinha and Hollrah (2017).

2.3. Measuring optimism 25
Our procedure starts by collecting all the announcements of either the ECBpress conference or the Fed minute. Then, we classify each term in the collectionaccording to the General Inquirer (GI) categories from the Harvard psychosocialdictionary. There are 77 categories, but we use 16, which are those that are the mostobvious in transmitting an optimistic or a pessimistic sentiment to the market thesame used by Chague et al. (2015). The categories with positive tone are: "active","arousal", "complete", "fell", "persist", "pleasure", "positive", "strong", "virtue", and"work", and the categories with negative tone are: "fail", "negative", "pain", "passive","weak", and "try".5 Since the Harvard IV dictionary does not contain all the inflectedforms of a term, we stem terms in both the dictionary and the document with thePorter algorithm.
To measure the level of optimism of the D announcements in the collection,we apply the TFIDF method to each document d. TFIDF is a term-weightingmethod that is the product of two parts. The first part is the term frequency thatuses the raw frequency ft,d of term t in script d,
tft,d =
1 + log ft,d if f(t, d) > 00 otherwise.
(2.1)
The second part is the inverse document frequency, that considers therelation between the total number of documents and df(t) the number of documentswith the term t,
idf(t) = log(
N
df(t)
). (2.2)
Then, TFIDF weighting of the term t in the document d is the combination5Chague et al. (2015) use 18 categories, but we decided not to include the categories "power" and"hostile". The category "hostile" is a subcategory of "ngvt", an early version of "negativ". Thecategory "power" is a subcategory of "strong", and since we use "strong", including "power" doesnot affect the tone of the announcement, when used in the TFIDF algorithm. This differencemight occur because we are using a newer version of the dictionary. Sharpe, Sinha and Hollrah(2017) also use the Harvard IV dictionary; or method and the method to analyze documents issimilar to ours. However, they fined-tuned the dictionary by selecting entries that best fit foreconomic forecasting. To avoid subjective selection, we used Chague et al. (2015) categories as itis.

Chapter 2. International Central Bank Communications Spillovers to Brazilian Central Bank
of the two parts:
tf -idf(t, d) = tf(t, d) · idf(t)
= (1 + log f(t, d)) · log(
N
df(t)
).
(2.3)
To discriminate terms according to their tone, we sign or zero each term, listed inat least one of the sixteen GI categories, according to the semantic group of itscategory. 6
cat(t) =
+1 if t ∈ categories with positive tone−1 if t ∈ categories with negative tone
0 if t ∈ categories with both positive and negative tone.(2.4)
Finally, the optimist factor of the document d is the sign-weighted averageof the terms that compose the document:
OF (d) =∑
t
cat(t) · tf -idf(t, d). (2.5)
Because entries with a positive tone enlarge the optimistic factor, we canassociate higher optimistic factors with the perception of more optimistic announce-ments. For an easier interpretation of the results, we standardize the optimisticfactors in the regressions and represent future interest rates in basic points.
2.4 Results
The following results show an association between the interest rate futurestraded in the B3 stock exchange and the announcements of the ECB and the Fed.Since interest rate futures show the market’s expectations regarding CBB’s futuremonetary decisions, traders believe that the CBB’s actions are partly connected tothe future course of monetary policy of the ECB and the Fed.6For example, the term "abolish" falls into the categories "negative" and "activate" and the term"abrasive" into "negative" and "strong", so we zeroed these two terms.

2.4. Results 27
2.4.1 Effect of the ECB press conferences on interest rates
The Governing Council is the main decision-making organ of the ECB. Itusually meets every two weeks, and, every six weeks, publishes the monetary policydecisions. The monetary policy decisions disclosures the interest rates of: the mainrefinancing operations, the marginal lending facility, and the deposit facility, whichare the key interest rate for the euro area. The same day, after the disclosure ofthe target rates, a press conference is held. The press conference is approximatelyan hour long and has two parts. It starts with an introductory statement and thenis followed by a questions session. The introductory statement is a manuscriptspeech in which the ECB explains the reasoning behind the decision on the mostrecent target interest rates. The introductory statement gives not only the expectedinflation and economic performance but also clues about future decisions. Thesecond part is the questions session in which the president and the vice presidentgive unscripted answers to questions asked by the press from across the euro areaand beyond.
To analyze how changes in the optimistic factor of the ECB press conferencecommunication affect interest rates, we use the following model:
∆ymt+1 = β0 + β1IRSt+1 + β2∆OF IQ
t , (2.6)
where t is the day of the announcement; ∆ymt+1 is, for a maturity m, the interest
rate difference between the following trading day t + 1 and the day t and; andIRSt+1 is the interest rate surprise defined earlier. The communication surprise,∆OF IQ
t is the optimistic factor difference between the press conference of day t
and the previous press conference.

Chapter 2. International Central Bank Communications Spillovers to Brazilian Central Bank
Table 1 – Effect of the ECB press conferences on interest ratesThis table presents regression estimates of future interest rates changes against variations in the optimisticfactor of the press conference as set-out in Eq. 2.6. Columns show the dependent variable ∆ym, changes inyields at different maturities. Rows show the independent variables: interest rate surprise IRS and changein the optimistic factor of the press conference ∆OF IQ; the intercept is not reported. Changes in interestrates are expressed in basis points and the standard deviations of the optimistic factor are standardizedto zero mean and one standard deviation. Each regression is based on 168 observations from October 2003to April 2019. Robust standard errors in parentheses. ∗, ∗∗, ∗∗∗ denote statistical significance at 10%, 5%and 1% levels.
Maturity 2-month 4-month 6-month 1-year 2-year 3-year 4-year 6-year 8-year
IRSl 0.341*** 0.157*** 0.118*** 0.117*** 0.104** 0.124*** 0.113*** 0.102*** 0.080**(0.075) (0.055) (0.023) (0.030) (0.042) (0.038) (0.040) (0.035) (0.032)
∆OF IQ 0.475 -1.604** -0.979*** -1.345*** -1.595*** -1.505** -1.466** -0.944 -0.775(0.599) (0.684) (0.363) (0.433) (0.587) (0.619) (0.682) (0.749) (0.881)
Adj.R2 0.5785 0.1288 0.1320 0.0906 0.0478 0.0430 0.0297 0.0184 0.0037
Table 1 shows that future contracts respond to interest rate surprises in thesame direction; in all cases, the coefficients are statistically significant. Also, exceptfor the first contract, a positive shock in the optimistic factor reduces the interestrate level. The effect is statistically significant for maturities ranging from fourmonths to three years. An increase of one standard deviation in the optimistic factordecreases the interest rate level by 1 basic point in the six-month contract and by1.5 basic point in the four-month, one-year, two-year, three-year, and four-yearcontracts.
These results indicate that the content of the ECB announcements impactsthe Brazilian market. An increase in the optimism of the press conference reducesinterest rates levels; the effect of the shock is more significant in short- and mid-termmaturities.
To analyze how different parts of the press conference affect the interestrate of futures, we use the following models:
∆ymt+1 = β0 + β1IRSt+1 + β2∆OF I
t (2.7)
∆ymt+1 = β0 + β1IRSt+1 + β2∆OF Q
t (2.8)
∆ymt+1 = β0 + β1IRSt+1 + β2∆OF Q
t + β3∆OF It , , (2.9)

2.4. Results 29
where ∆OF It and ∆OF Q
t are the optimistic factor difference for the introductorystatement alone and the questions session with journalists alone, respectively.
Figure 1 – Time-series of the press conferences lengthLines in the chart show the number of Harvard IV steamed entries that are part of either theoptimistic or pessimistic GI’s categories. Gray and black lines represent the number of entries ofthe question session and the introductory statement, respectively. Dashed lines indicate the meannumber of entries for each announcement.
Figure 2 – Time-series of the press conferences optimistic factorLines in the chart represents the optimistic factor. The thick line represents the press conferences,
and the gray and the black thin lines are the questions sessions and the introductory statements,respectively. The correlation between the optimistic factors of the press conferences and theintroductory statements is 0.49; between the press conferences and the question sessions is 0.92,and between the introductory statements and the question sessions is 0.1.

Chapter 2. International Central Bank Communications Spillovers to Brazilian Central Bank
Figure 1 shows the time-series of the length of both the introductorystatements and the press conferences. The length is the number of steamed wordsthat belong to the entries of the sixteen semantic categories. The mean length forthe questions session is 642 and the introductory statement is 278, and the lengthof either announcement remains stable throughout the series. Figure 2 shows thissize difference which affects the correlations of the optimistic factors which are: 0.49between the press conferences and the introductory statements and 0.92 betweenpress conferences and question session.
Panels A, B, and C from Table 2 display the impact that individual partsof the press conference have on the interest rate level. Panels A and B show theindividual effect of the press conference when the optimistic factor difference isfrom the introductory statement (Equation (2.7)) and the questions session withjournalists (Equation (2.8)), respectively. Panel C indicates the two individualeffects combined (Equation (2.9)).
The three panels show that an increase in the optimism of the introductorystatement or the question session reduces the interest rates level; also, interest ratesurprises have the expected effect and are significant. The comparison of Table 1with Panels A and B explains which part of the annoncements leads the effect. Theeffect of the press conference is more statistical and economic significant than eitherthe introductory statement or the questions session –except for the introductorystatement of the eight-year maturity at the 10% significance level. This indicatesthat changes in the press conference optimistic factor have a higher impact on theinterest rates level than the individual changes in the optimistic factor of eitherthe introductory statement or the questions sessions.
Panel C shows the p-values of the null hypothesis which states that neitherof the optimistic factors affects interest rates. If we compare them with the p-valuesof the optimistic factor estimates from Table 1, we see that the estimates in PanelC are less significant for all contracts –except for the two-month and eight-yearmaturities although their p-values are statistically insignificant. Hence, changesin the optimistic factor of the press conference have a more significant effect oninterest rates than the sum of the individual changes of both the introductorystatement and the question session.

2.4. Results 31
Table 2 – Effect of ECB introductory statements and questions sessionson interest rates
This table presents regression estimates of future interest rates changes against variations in the optimisticfactor of the introductory statement or question sessions as set-out in Eq. 2.7, 2.8 and 2.9. Columns showthe dependent variable ∆ym, changes in yields at different maturities. Each horizontal panel displays theresults of a different regression equation. Rows represent the independent variables: IRS is the interestrate surprise control, and ∆OF I and ∆OF Q is the change in the optimistic factor for the introductorystatement and the questions session, respectively; the intercept is not reported. Changes in interest ratesare expressed in basis points and the standard deviations of the optimistic factor are standardized to zeromean and one standard deviation. Each regression is based on 168 observations from October 2003 toApril 2019. Robust standard errors in parentheses.a p-val of H0 : ∆OF I = ∆OF Q = 0.∗, ∗∗, ∗∗∗ denotestatistical significance at 10%, 5% and 1% levels.
Maturity 2-month 4-month 6-month 1-year 2-year 3-year 4-year 6-year 8-year
Panel A Introductory statement
IRS 0.343*** 0.159*** 0.120*** 0.118*** 0.104*** 0.125*** 0.111*** 0.103*** 0.093***(0.077) (0.052) (0.021) (0.026) (0.038) (0.037) (0.038) (0.034) (0.036)
∆OF I 0.066 -1.358** -0.951* -1.086* -1.194 -1.271 -0.905 -0.847 -2.172**(0.643) (0.668) (0.501) (0.643) (0.848) (0.819) (0.863) (0.896) (1.082)
Adj.R2 0.5749 0.1124 0.1251 0.0745 0.0320 0.0346 0.0183 0.0159 0.0252Panel B Questions session
IRS 0.342*** 0.152*** 0.114*** 0.113*** 0.098** 0.118*** 0.107*** 0.098*** 0.075**(0.076) (0.052) (0.020) (0.026) (0.038) (0.036) (0.038) (0.033) (0.031)
∆OF Q 0.410 -1.341** -0.690** -0.978** -1.140** -0.972 -0.964 -0.442 0.124(0.499) (0.639) (0.338) (0.417) (0.564) (0.600) (0.666) (0.729) (0.890)
Adj.R2 0.5776 0.1176 0.1178 0.0750 0.0339 0.0316 0.0205 0.0128 -0.0003Panel C Introductory statement and questions session
IRS 0.343*** 0.161*** 0.121*** 0.120*** 0.106** 0.127*** 0.113*** 0.104*** 0.092***(0.076) (0.055) (0.024) (0.030) (0.042) (0.039) (0.040) (0.035) (0.035)
DOF I -0.011 -1.139* -0.845* -0.928 -1.008 -1.120 -0.745 -0.786 -2.258**(0.599) (0.684) (0.511) (0.639) (0.835) (0.809) (0.860) (0.893) (1.104)
DOF Q 0.411 -1.172* -0.565 -0.841** -0.990* -0.806 -0.854 -0.326 0.459(0.467) (0.656) (0.358) (0.417) (0.556) (0.583) (0.661) (0.711) (0.860)
Adj.R2 0.5750 0.1277 0.1293 0.0821 0.0372 0.0343 0.0179 0.0107 0.0207p-vala 0.380 0.076 0.116 0.046 0.077 0.169 0.198 0.647 0.590

Chapter 2. International Central Bank Communications Spillovers to Brazilian Central Bank
Regarding the level of interest rates, the conclusions from Tables 1 and 2are: (a) the press conferences affect Brazilian market expectations; an increase inone standard deviation of the optimistic factor reduces from 1 to 1.5 basic pointsthe interest rate of contracts from four months to six years; (b) the press conferencehas a greater economic and statistical significance than the individual introductorystatement or questions sessions; moreover, market reaction is more significant to theoptimism conveyed by the introductory statement intertwined with the questionsessions than to the sum of their individual optimism.
2.4.2 Effect of minutes on interest rates
The FOMC has eight regularly scheduled meetings a year and has additionalmeetings as needed. Immediately after each meeting, the FOMC publishes astatement with the target range for the federal funds rate. The statement is theprincipal tool the Fed has to communicate its monetary policy but is not the onlyone. After each statement, the FOMC issues the minutes to provide a general insightinto the discussion at the meeting. Before 2004, minutes were released two daysafter the Committee’s subsequent meeting, and, after 2004, they are released threeweeks later. The decision to bring forward the release of the minutes is to increasethe usefulness of the content. Statements inform about the monetary decisions.Minutes provide insight regarding the monetary policy decisions by giving a morecomplete explanation of the discussions at the meeting.
To analyze the effect of the FOMC minutes on Brazil’s interest rates level,we use the following model:
∆ymt+1 = β0 + β1 ∆OF M
t (2.10)
where ∆ym is the same variable as is in the ECB analysis, and ∆OF Mt is the
optimism factor difference between the FOMC minute release in day t and theprevious one. Since the minutes are published days after the target interest, we donot use the interest rate surprise control variable.
2.4. Results 33
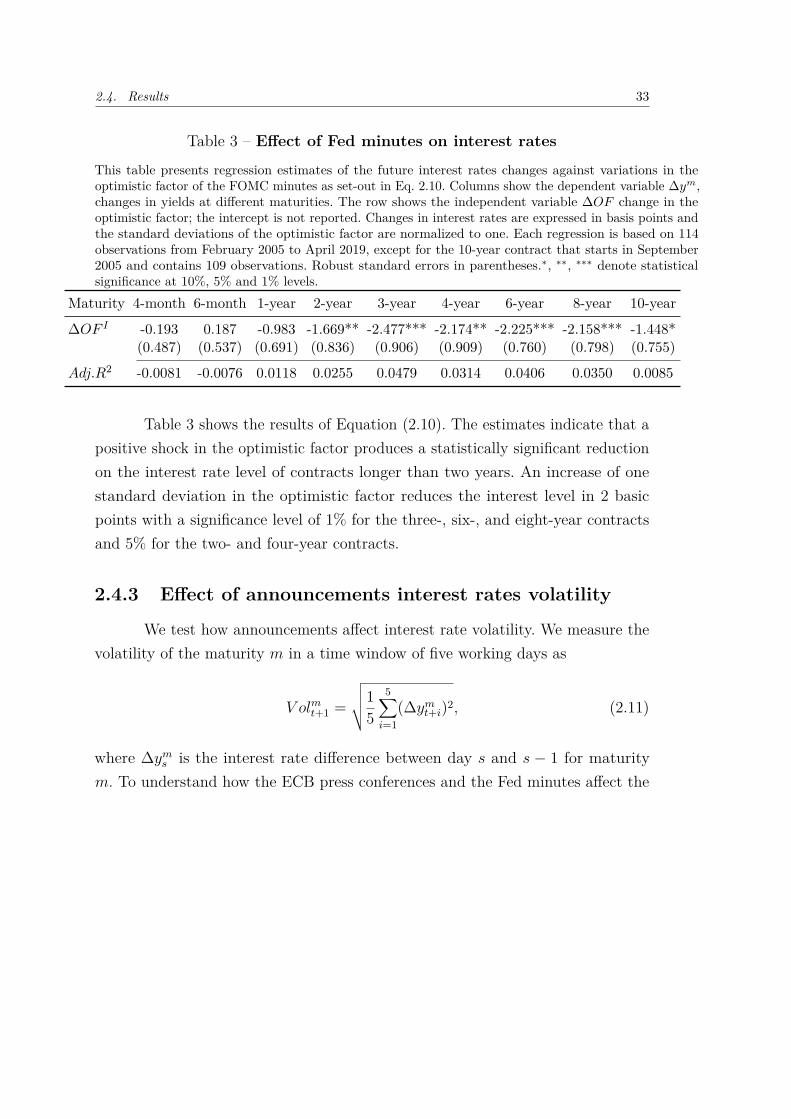
Table 3 – Effect of Fed minutes on interest rates
This table presents regression estimates of the future interest rates changes against variations in theoptimistic factor of the FOMC minutes as set-out in Eq. 2.10. Columns show the dependent variable ∆ym,changes in yields at different maturities. The row shows the independent variable ∆OF change in theoptimistic factor; the intercept is not reported. Changes in interest rates are expressed in basis points andthe standard deviations of the optimistic factor are normalized to one. Each regression is based on 114observations from February 2005 to April 2019, except for the 10-year contract that starts in September2005 and contains 109 observations. Robust standard errors in parentheses.∗, ∗∗, ∗∗∗ denote statisticalsignificance at 10%, 5% and 1% levels.
Maturity 4-month 6-month 1-year 2-year 3-year 4-year 6-year 8-year 10-year
∆OF I -0.193 0.187 -0.983 -1.669** -2.477*** -2.174** -2.225*** -2.158*** -1.448*(0.487) (0.537) (0.691) (0.836) (0.906) (0.909) (0.760) (0.798) (0.755)
Adj.R2 -0.0081 -0.0076 0.0118 0.0255 0.0479 0.0314 0.0406 0.0350 0.0085
Table 3 shows the results of Equation (2.10). The estimates indicate that apositive shock in the optimistic factor produces a statistically significant reductionon the interest rate level of contracts longer than two years. An increase of onestandard deviation in the optimistic factor reduces the interest level in 2 basicpoints with a significance level of 1% for the three-, six-, and eight-year contractsand 5% for the two- and four-year contracts.
2.4.3 Effect of announcements interest rates volatility
We test how announcements affect interest rate volatility. We measure thevolatility of the maturity m in a time window of five working days as
V olmt+1 =
√√√√15
5∑i=1
(∆ymt+i)2, (2.11)
where ∆yms is the interest rate difference between day s and s − 1 for maturity
m. To understand how the ECB press conferences and the Fed minutes affect the

Chapter 2. International Central Bank Communications Spillovers to Brazilian Central Bank
interest rate volatility, we use the following equations:
V olmt+1 = α + β IRSt+1 + γ Releaset (2.12)
V olmt+1 = α + β IRSt+1 + γ Releaset + δ Pessimismt (2.13)
log(V olmt+1) = α + β IRSt+1 + γ Releaset + δ OFt (2.14)
log(V olmt+1) = α + β IRSt+1 + γ Releaset + δ OFt + θ OFt · Pessimismt (2.15)
where t is the day of the announcement is released; OFt is the optimistic factor ofthe announcement; the dummy variable Releaset takes a value of one when theannouncement is released and zero otherwise; the dummy variable Pessimismt isequal to one when OFt is negative and zero otherwise; and IRSt+1 is the interestrate surprise control variable –we used it to study the ECB press conferences.
We use equation 2.12 to study the effect when announcements are released,regardless of their optimism. To analyze the effect of the quality of the announce-ments we employ Equation (2.13), and to assess the effect of the magnitude of theoptimism we use Equation (2.14). Equation (2.15) tests whether the qualitativecontent of the announcement has an asymmetric effect on volatility. These fourequations were also present in Chague et al. (2015) to analyze the volatility of theBrazilian interest rate futures. However, there are some differences since. First, theystudy the effect of the Central Bank of Brazil, whereas we study the effect of foreigncentral banks.Second, when we analyze the effect of the ECB press conferences, weadd the IRS control variable.
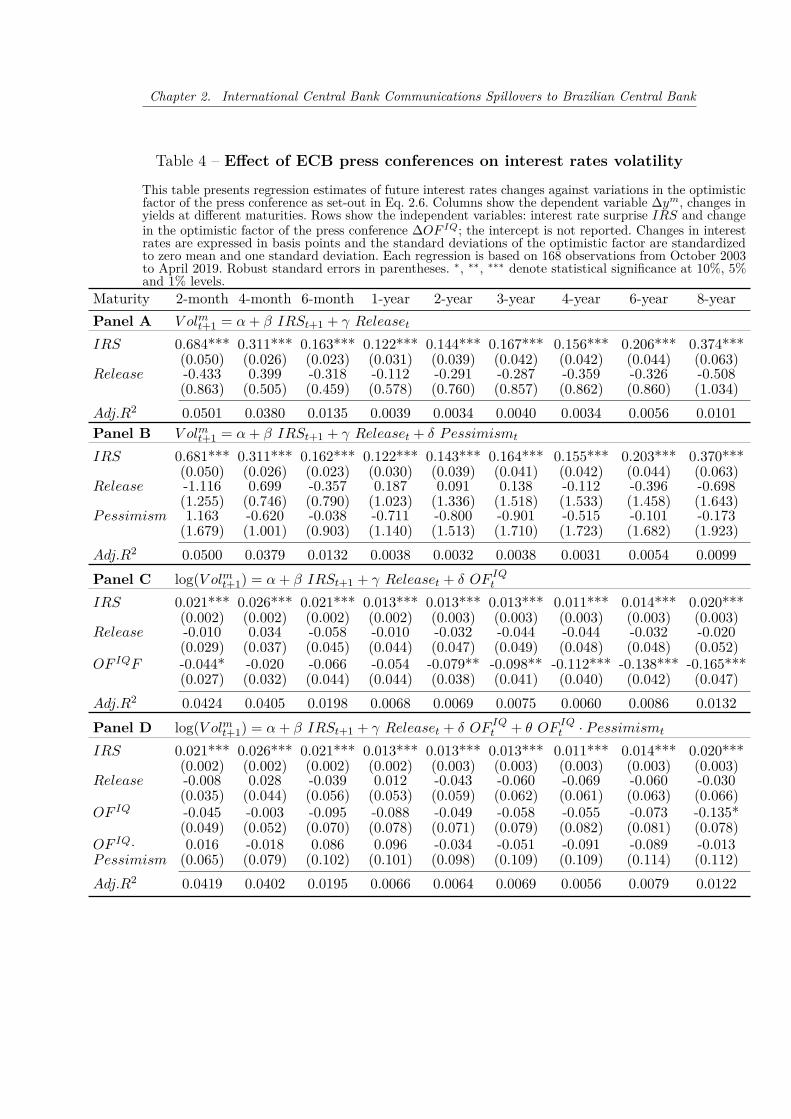
Table 4 reports the effect of the ECB press conference on volatility. We seethat the IRS control variable is positive and statistically significant. Panel A andB show that the release of the press conference (regardless of whether the contentis negative or positive) does not have a statically significant effect. However, themagnitude of the shock has a statistically significant effect on contracts betweentwo and eight years. Panel C shows that an increase of one standard deviationin the optimistic factor reduces volatility by 8% in the two-year contract and theeffect increases monotonically to 17% for the eight-year contracts. From Panel Dwe cannot conclude that shocks from pessimistic or optimistic press conferenceshave different impacts on future volatility.
2.5. Robustness 35
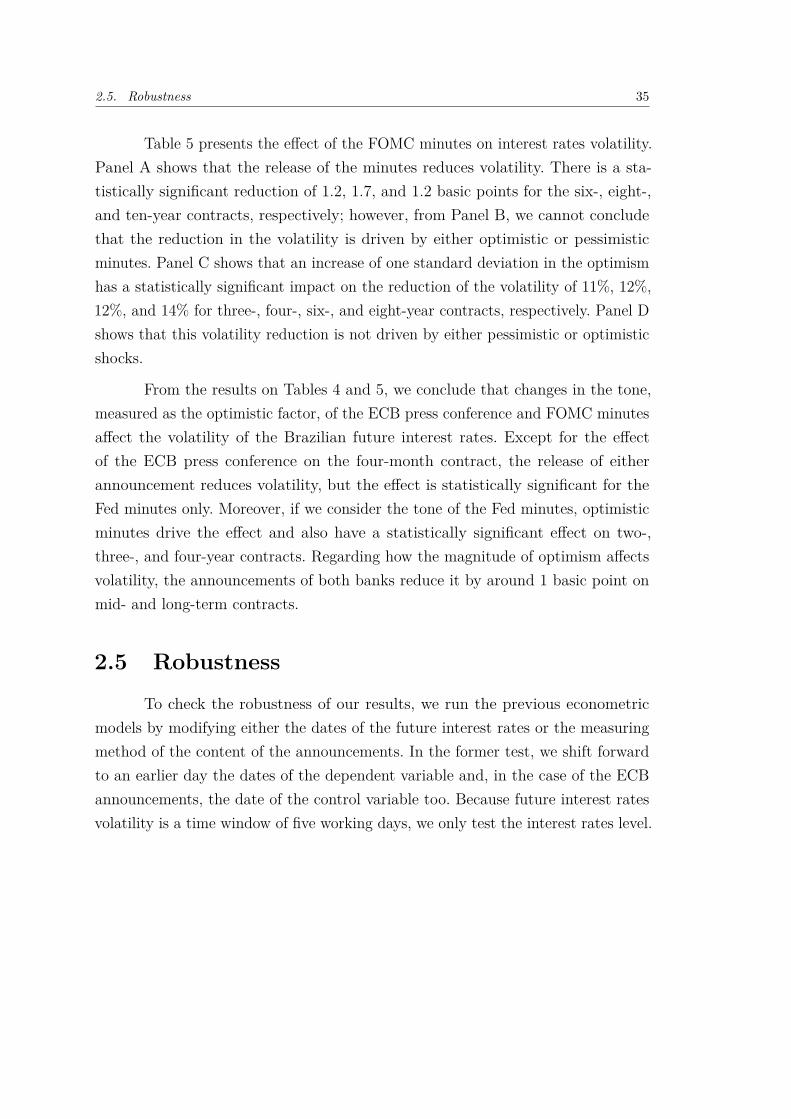
Table 5 presents the effect of the FOMC minutes on interest rates volatility.Panel A shows that the release of the minutes reduces volatility. There is a sta-tistically significant reduction of 1.2, 1.7, and 1.2 basic points for the six-, eight-,and ten-year contracts, respectively; however, from Panel B, we cannot concludethat the reduction in the volatility is driven by either optimistic or pessimisticminutes. Panel C shows that an increase of one standard deviation in the optimismhas a statistically significant impact on the reduction of the volatility of 11%, 12%,12%, and 14% for three-, four-, six-, and eight-year contracts, respectively. Panel Dshows that this volatility reduction is not driven by either pessimistic or optimisticshocks.
From the results on Tables 4 and 5, we conclude that changes in the tone,measured as the optimistic factor, of the ECB press conference and FOMC minutesaffect the volatility of the Brazilian future interest rates. Except for the effectof the ECB press conference on the four-month contract, the release of eitherannouncement reduces volatility, but the effect is statistically significant for theFed minutes only. Moreover, if we consider the tone of the Fed minutes, optimisticminutes drive the effect and also have a statistically significant effect on two-,three-, and four-year contracts. Regarding how the magnitude of optimism affectsvolatility, the announcements of both banks reduce it by around 1 basic point onmid- and long-term contracts.
2.5 Robustness
To check the robustness of our results, we run the previous econometricmodels by modifying either the dates of the future interest rates or the measuringmethod of the content of the announcements. In the former test, we shift forwardto an earlier day the dates of the dependent variable and, in the case of the ECBannouncements, the date of the control variable too. Because future interest ratesvolatility is a time window of five working days, we only test the interest rates level.
Chapter 2. International Central Bank Communications Spillovers to Brazilian Central Bank
Table 4 – Effect of ECB press conferences on interest rates volatility
This table presents regression estimates of future interest rates changes against variations in the optimisticfactor of the press conference as set-out in Eq. 2.6. Columns show the dependent variable ∆ym, changes inyields at different maturities. Rows show the independent variables: interest rate surprise IRS and changein the optimistic factor of the press conference ∆OF IQ; the intercept is not reported. Changes in interestrates are expressed in basis points and the standard deviations of the optimistic factor are standardizedto zero mean and one standard deviation. Each regression is based on 168 observations from October 2003to April 2019. Robust standard errors in parentheses. ∗, ∗∗, ∗∗∗ denote statistical significance at 10%, 5%and 1% levels.
Maturity 2-month 4-month 6-month 1-year 2-year 3-year 4-year 6-year 8-yearPanel A V olmt+1 = α + β IRSt+1 + γ Releaset
IRS 0.684*** 0.311*** 0.163*** 0.122*** 0.144*** 0.167*** 0.156*** 0.206*** 0.374***(0.050) (0.026) (0.023) (0.031) (0.039) (0.042) (0.042) (0.044) (0.063)
Release -0.433 0.399 -0.318 -0.112 -0.291 -0.287 -0.359 -0.326 -0.508(0.863) (0.505) (0.459) (0.578) (0.760) (0.857) (0.862) (0.860) (1.034)
Adj.R2 0.0501 0.0380 0.0135 0.0039 0.0034 0.0040 0.0034 0.0056 0.0101Panel B V olmt+1 = α + β IRSt+1 + γ Releaset + δ Pessimismt
IRS 0.681*** 0.311*** 0.162*** 0.122*** 0.143*** 0.164*** 0.155*** 0.203*** 0.370***(0.050) (0.026) (0.023) (0.030) (0.039) (0.041) (0.042) (0.044) (0.063)
Release -1.116 0.699 -0.357 0.187 0.091 0.138 -0.112 -0.396 -0.698(1.255) (0.746) (0.790) (1.023) (1.336) (1.518) (1.533) (1.458) (1.643)
Pessimism 1.163 -0.620 -0.038 -0.711 -0.800 -0.901 -0.515 -0.101 -0.173(1.679) (1.001) (0.903) (1.140) (1.513) (1.710) (1.723) (1.682) (1.923)
Adj.R2 0.0500 0.0379 0.0132 0.0038 0.0032 0.0038 0.0031 0.0054 0.0099Panel C log(V olmt+1) = α + β IRSt+1 + γ Releaset + δ OF IQ
t
IRS 0.021*** 0.026*** 0.021*** 0.013*** 0.013*** 0.013*** 0.011*** 0.014*** 0.020***(0.002) (0.002) (0.002) (0.002) (0.003) (0.003) (0.003) (0.003) (0.003)
Release -0.010 0.034 -0.058 -0.010 -0.032 -0.044 -0.044 -0.032 -0.020(0.029) (0.037) (0.045) (0.044) (0.047) (0.049) (0.048) (0.048) (0.052)
OF IQF -0.044* -0.020 -0.066 -0.054 -0.079** -0.098** -0.112*** -0.138*** -0.165***(0.027) (0.032) (0.044) (0.044) (0.038) (0.041) (0.040) (0.042) (0.047)
Adj.R2 0.0424 0.0405 0.0198 0.0068 0.0069 0.0075 0.0060 0.0086 0.0132Panel D log(V olmt+1) = α + β IRSt+1 + γ Releaset + δ OF IQ
t + θ OF IQt · Pessimismt
IRS 0.021*** 0.026*** 0.021*** 0.013*** 0.013*** 0.013*** 0.011*** 0.014*** 0.020***(0.002) (0.002) (0.002) (0.002) (0.003) (0.003) (0.003) (0.003) (0.003)
Release -0.008 0.028 -0.039 0.012 -0.043 -0.060 -0.069 -0.060 -0.030(0.035) (0.044) (0.056) (0.053) (0.059) (0.062) (0.061) (0.063) (0.066)
OF IQ -0.045 -0.003 -0.095 -0.088 -0.049 -0.058 -0.055 -0.073 -0.135*(0.049) (0.052) (0.070) (0.078) (0.071) (0.079) (0.082) (0.081) (0.078)
OF IQ· 0.016 -0.018 0.086 0.096 -0.034 -0.051 -0.091 -0.089 -0.013Pessimism (0.065) (0.079) (0.102) (0.101) (0.098) (0.109) (0.109) (0.114) (0.112)Adj.R2 0.0419 0.0402 0.0195 0.0066 0.0064 0.0069 0.0056 0.0079 0.0122

2.5. Robustness 37
Table 5 – Effect of Fed minutes on interest rates volatility
This table presents regression estimates of the future rates volatility against variations in the optimisticfactor of the FOMC minutes as set-out in Eq. 2.12, 2.13 2.14 and 2.15. Each horizontal panel displays theresults of a different regression equation. Columns show the dependent variable five-workday volatility atdifferent maturities. Rows represent the independent variables: the dummy variable Release indicateswhen the Fed minute is published, OF is the optimistic factor of the minute, and the dummy Pessimismindicates when OF is negative; the intercept is not reported. The period from February 2005 to April2019, regressions are run with 3540 observations for Panels A and C and 3533 observations for Panels Band D. Release is nonzero in 115 observations for Panels A and C and 114 observations for Panels B andD, and Pessimism is nonzero in 56 observations. Changes in interest rates are expressed in basis pointsand the optimistic factor is standardized to zero mean and one standard deviation. Robust standard errorsin parentheses.∗, ∗∗, ∗∗∗ denote statistical significance at 10%, 5% and 1% levels.
Maturity 4-month 6-month 1-year 2-year 3-year 4-year 6-year 8-year 10-yearPanel A V olmt+1 = α + γ Releaset
Release -0.419 -0.499 -0.560 -0.904* -0.664 -0.738 -1.209** -1.636*** 1.208*(0.500) (0.336) (0.376) (0.487) (0.538) (0.584) (0.570) (0.627) (0.660)
Adj.R2 -0.0001 0.0001 0.0000 0.0002 -0.0000 -0.0000 0.0004 0.0006 0.0003Panel B V olmt+1 = α + γ Releaset + δ Pessimismt
Release -0.287 -0.468 -0.750* -1.637*** -1.584*** -1.846*** -2.162*** -2.262*** 1.473*(0.671) (0.353) (0.399) (0.522) (0.564) (0.585) (0.660) (0.778) (0.867)
Pessimism -0.455 -0.146 0.317 1.392 1.798* 2.183* 1.883* 1.230 0.538(0.982) (0.658) (0.733) (0.945) (1.046) (1.137) (1.107) (1.225) (1.299)
Adj.R2 -0.0002 -0.0001 -0.0002 0.0002 0.0001 0.0003 0.0005 0.0005 0.0000Panel C log(V olmt+1) = α + γ Releaset + δ OFt
Release -0.041 -0.054 -0.025 -0.064 -0.027 -0.044 -0.073 -0.097* -0.073*(0.046) (0.048) (0.045) (0.052) (0.049) (0.051) (0.052) (0.055) (0.057)
OF -0.084 -0.079* -0.012 -0.074 -0.108** -0.124** -0.120** -0.141** -0.113*(0.052) (0.044) (0.035) (0.045) (0.044) (0.049) (0.055) (0.060) (0.066)
Adj.R2 0.0007 0.0005 -0.0005 0.0004 0.0007 0.0011 0.0013 0.0019 0.0010Panel D log(V olmt+1) = α + γ Releaset + δ OFt + θ OFt · Pessimismt
Release -0.067 -0.079 -0.052 -0.101* -0.058 -0.083 -0.102* -0.133** -0.078(0.044) (0.049) (0.048) (0.054) (0.052) (0.052) (0.054) (0.059) (0.062)
OF -0.046 -0.040 0.029 -0.016 -0.058 -0.062 -0.074 -0.084 -0.096(0.061) (0.049) (0.034) (0.049) (0.049) (0.054) (0.064) (0.076) (0.082)
OF · -0.110 -0.110 -0.122 -0.184 -0.166 -0.210* -0.157 -0.200 -0.031Pessimism (0.121) (0.104) (0.104) (0.119) (0.111) (0.127) (0.139) (0.145) (0.174)
Adj.R2 0.0006 0.0003 -0.0005 0.0006 0.0008 0.0015 0.0013 0.0021 0.0006

Chapter 2. International Central Bank Communications Spillovers to Brazilian Central Bank
In the latter test, we randomly assign a positive, negative, or neutral toneto each GI category, so the factors created by this random dictionary are false. Thisdictionary lets us assess: a) whether an arbitrary classification of the categoriesaffects the interest rate structure; b) whether we have properly selected and classifiedthe categories in the dictionary. For example, in the random dictionary the category"feel" is neutral; "ovrst" is negative; "positive" is positive; and "weak" is positive.7
We use this test in both interest rates level and volatility.
We present the results of the robustness analysis on the interest rates level inTables 6 to 9. To analyze the effect of the ECB announcements we used Equations(2.6) to (2.9); Tables 6 and 7 show the results of running these equations withthe lagged interest rates and the random dictionary, respectively. To study theimpact of the Fed minutes, we used Equation (2.10); the outcome of running thisequation with lagged interest rates and random dictionary are in Tables 8 and 9,respectively.
Regarding the control variable, te sign in Table 6 is the same as in theoriginal run; however, since shifted dates (in both control and dependent variables)are no longer absorbing the shock of the ECB monetary policy, their estimates arestatistically and economically less significant than in the original run. By contrast,Table 7 shows that both the economic and statistical significance of the estimatesare larger than in Table 6 and coincide with the original run. As expected, Table 7indicates the interest rate shock absorption by both the control and the dependentvariable is not affected by the random factor.
The optimistic factor difference from Tables 6 and 8 and the random factordifference from Tables 7 and 9 are statistically insignificant at the 10% level. Theexceptions are the press conference optimistic factor difference coefficients for thefour-month contract in Panel A of Table 6 and the four- and six-month contractsin Table 8, which are only significant at the 10% level.
7The category "ovrst" indicates overstatement, often reflecting the presence or lack of emotionalexpressiveness.

2.5. Robustness 39
Table 6 – Effect of ECB introductory statements and questions sessionson lagged interest rates
Columns show the dependent variable changes in yields at different maturities with a lag (shifted forwardto an earlier day). Each horizontal panel displays the results of a different regression equation. Rowsrepresent the independent variables: IRSl is the lagged interest rate surprise control, ∆OF IQ, ∆OF I and∆OF Q represent the change in the optimistic factor for the press conference, introductory statement andthe questions sessions, respectively; the intercept is not reported. Changes in interest rates are expressedin basis points and the standard deviations of the optimistic factor are standardized to zero mean andone standard deviation. Each regression is based on 168 observations from October 2003 to April 2019.Robust standard errors in parentheses.a p-val of H0 : ∆OF I = ∆OF Q = 0.∗, ∗∗, ∗∗∗ denote statisticalsignificance at 10%, 5% and 1% levels.
Maturity 2-month 4-month 6-month 1-year 2-year 3-year 4-year 6-year 8-year
Panel A Press conference
IRSl 0.094*** 0.035** 0.057*** 0.050** 0.049* 0.071** 0.055 0.056 0.040(0.022) (0.015) (0.018) (0.022) (0.028) (0.034) (0.035) (0.043) (0.057)
∆RF IQ -0.299 -0.760* -0.133 0.241 0.344 0.153 0.022 -0.118 -0.520(0.463) (0.432) (0.469) (0.530) (0.643) (0.657) (0.681) (0.682) (0.760)
Adj.R2 0.1218 0.0325 0.0549 0.0197 0.0071 0.0231 0.0096 0.0099 0.0002Panel B Introductory statement
IRSl 0.098*** 0.038** 0.061*** 0.052** 0.049* 0.072** 0.056 0.057 0.043(0.022) (0.016) (0.018) (0.022) (0.028) (0.034) (0.035) (0.043) (0.058)
∆OF I 0.143 -0.297 0.418 0.502 0.416 0.162 0.075 0.036 -0.118(0.511) (0.491) (0.471) (0.553) (0.716) (0.737) (0.719) (0.731) (0.801)
Adj.R2 0.1201 0.0179 0.0589 0.0229 0.0074 0.0231 0.0096 0.0097 -0.0021Panel C Questions session
IRSl 0.095*** 0.037** 0.057*** 0.049** 0.048* 0.071** 0.055 0.056 0.041(0.022) (0.015) (0.018) (0.022) (0.028) (0.034) (0.034) (0.042) (0.055)
∆OF Q -0.301 -0.632 -0.175 0.227 0.400 0.207 0.048 -0.098 -0.508(0.457) (0.443) (0.457) (0.544) (0.678) (0.725) (0.761) (0.782) (0.856)
Adj.R2 0.1219 0.0276 0.0553 0.0196 0.0077 0.0233 0.0096 0.0098 0.0001Panel D Introductory statement and questions session
IRSl 0.096*** 0.036** 0.060*** 0.053** 0.050* 0.072** 0.056 0.057 0.041(0.022) (0.016) (0.018) (0.022) (0.029) (0.034) (0.035) (0.044) (0.058)
DOF I 0.201 -0.191 0.459 0.474 0.355 0.129 0.068 0.055 -0.030(0.512) (0.505) (0.476) (0.573) (0.746) (0.778) (0.764) (0.786) (0.860)
DOF Q -0.329 -0.606 -0.238 0.162 0.351 0.190 0.038 -0.106 -0.504(0.466) (0.461) (0.459) (0.559) (0.701) (0.758) (0.798) (0.826) (0.902)
Adj.R2 0.1173 0.0226 0.0550 0.0175 0.0030 0.0175 0.0036 0.0038 -0.0060p-vala 0.481 0.191 0.605 0.772 0.617 0.808 0.962 0.898 0.577

Chapter 2. International Central Bank Communications Spillovers to Brazilian Central Bank
Table 7 – Effect of random ECB introductory statements and questionssessions on interest rates
Columns show the dependent variable ∆ym, changes in yields at different maturities. Each horizontalpanel displays the results of a different regression equation. Rows represent the independent variables: IRSis the interest rate surprise control, ∆RF IQ, ∆RF I and ∆RF Q represent the change in the random factorfor the press conference, introductory statement and the questions sessions, respectively; the interceptis not reported. Changes in interest rates are expressed in basis points and the standard deviations ofthe random factor are standardized to zero mean and one standard deviation. Each regression is basedon 168 observations from October 2003 to April 2019. Robust standard errors in parentheses.a p-val ofH0 : ∆RF I = ∆RF Q = 0.∗, ∗∗, ∗∗∗ denote statistical significance at 10%, 5% and 1% levels.
Maturity 2-month 4-month 6-month 1-year 2-year 3-year 4-year 6-year 8-year
Panel A Press conference
IRS 0.344*** 0.150*** 0.111*** 0.109*** 0.094*** 0.114*** 0.101*** 0.093*** 0.075**(0.077) (0.049) (0.018) (0.023) (0.035) (0.035) (0.037) (0.032) (0.031)
∆RF IQ -0.006 -0.835 0.090 0.092 -0.028 0.247 0.727 1.033 0.192(0.430) (0.709) (0.465) (0.591) (0.789) (0.993) (1.114) (1.003) (1.143)
Adj.R2 0.5748 0.0989 0.1035 0.0568 0.0189 0.0236 0.0167 0.0186 -0.0002Panel B Introductory statement
IRS 0.344*** 0.147*** 0.111*** 0.108*** 0.093*** 0.113*** 0.103*** 0.096*** 0.076**(0.077) (0.049) (0.018) (0.023) (0.035) (0.036) (0.037) (0.032) (0.031)
∆RF IQ -0.102 -0.771 -0.619 -0.884 -1.459 -1.254 -1.011 -0.437 0.560(0.560) (0.847) (0.525) (0.707) (0.926) (1.030) (1.120) (1.087) (1.328)
Adj.R2 0.5750 0.0970 0.1125 0.0685 0.0383 0.0342 0.0195 0.0124 0.0013Panel C Questions session
IRSl 0.344*** 0.150*** 0.111*** 0.108*** 0.093*** 0.112*** 0.099*** 0.091*** 0.074**(0.078) (0.049) (0.018) (0.023) (0.036) (0.036) (0.038) (0.034) (0.032)
∆OF I -0.039 -0.766 0.200 0.331 0.391 0.698 1.201 1.291 0.260(0.391) (0.608) (0.425) (0.551) (0.726) (0.894) (1.004) (0.922) (1.099)
Adj.R2 0.5749 0.0982 0.1044 0.0587 0.0205 0.0272 0.0237 0.0241 0.0000Panel D Introductory statement and questions session
IRS 0.344*** 0.149*** 0.110*** 0.107*** 0.091** 0.110*** 0.098*** 0.091*** 0.075**(0.078) (0.049) (0.018) (0.024) (0.036) (0.036) (0.038) (0.034) (0.032)
δRF I -0.099 -0.706 -0.642 -0.921 -1.505 -1.327 -1.129 -0.559 0.540(0.556) (0.826) (0.527) (0.713) (0.934) (1.029) (1.119) (1.097) (1.358)
δRF Q -0.031 -0.712 0.249 0.402 0.507 0.800 1.288 1.335 0.219(0.386) (0.590) (0.421) (0.548) (0.713) (0.887) (1.001) (0.928) (1.118)
Adj.R2 0.5724 0.0988 0.1089 0.0657 0.0352 0.0336 0.0256 0.0202 -0.0045

2.5. Robustness 41
Table 8 – Effect of Fed minutes on lagged interest rates
Columns show the dependent variable changes in yields at different maturities shifted forward to anearlier day. The row shows the independent variable ∆OF , change in the optimistic factor; the interceptis not reported. Changes in interest rates are expressed in basis points and the standard deviations of theoptimistic factor are normalized to one. Each regression is based on 114 observations from February 2005to April 2019, except for the 10-year contract that starts in September 2005 and contains 109 observations.Robust standard errors in parentheses. ∗, ∗∗, ∗∗∗ denote statistical significance at 10%, 5% and 1% levels.Maturity 4-month 6-month 1-year 2-year 3-year 4-year 6-year 8-year 10-year
∆RF 2.188* 1.230* 0.523 0.423 0.439 0.254 0.693 0.924 -0.285(1.218) (0.631) (0.580) (0.641) (0.908) (1.078) (1.145) (1.249) (1.119)
Adj.R2 0.0727 0.0570 0.0019 -0.0052 -0.0063 -0.0082 -0.0048 -0.0021 -0.0087
Table 9 – Effect of random Fed minutes on interest rates
Columns show the dependent variable ∆ym, changes in yields at different maturities. The row showsthe independent variables ∆RF , change in the random factor; the intercept is not reported. Changes ininterest rates are expressed in basis points and the standard deviations of the random factor are normalizedto one. Each regression is based on 114 observations from February 2005 to April 2019, except for the10-year contract that starts in September 2005 and contains 109 observations. Robust standard errors inparentheses. ∗, ∗∗, ∗∗∗ denote statistical significance at 10%, 5% and 1% levels.
Maturity 4-month 6-month 1-year 2-year 3-year 4-year 6-year 8-year 10-year
∆RF -0.027 0.093 0.541 0.975 1.394 1.127 1.104 1.543 1.425(0.643) (0.559) (0.721) (0.952) (1.085) (1.172) (1.055) (1.015) (1.058)
Adj.R2 -0.0089 -0.0086 -0.0028 0.0025 0.0085 0.0016 0.0029 0.0128 0.0172
Tables 6 to 9 show that when we either change the dates of disclosure or usea random dictionary, the association between the optimism of the announcementsand the interest rates level is no longer significant.
The results of the robustness test on the interest rates volatility are inTable 10, for the ECB press conferences, and in Table 11, for the Fed minutes.Except for the Release dummy variable and the IRS control variable, in the ECBpress conference regression, the value of the variables differ from the original run.We fabricated the random factor RF sing a random dictionary, the RPessimism
dummy takes the value of one to indicate when RF is negative.

Chapter 2. International Central Bank Communications Spillovers to Brazilian Central Bank
Compared to the original run, the coefficients of the surprise control variablein Table 10 preserve the sign and significance, as expected. The remaining coefficientsare mainly insignificant at the 10% level, with few exceptions. The random factorin Panel B is significant in the two- and six-month maturities at the %10 and 5%levels, respectively, and the pessimistic random factor of the one-year maturity inPanel C is significant at the 5% level.
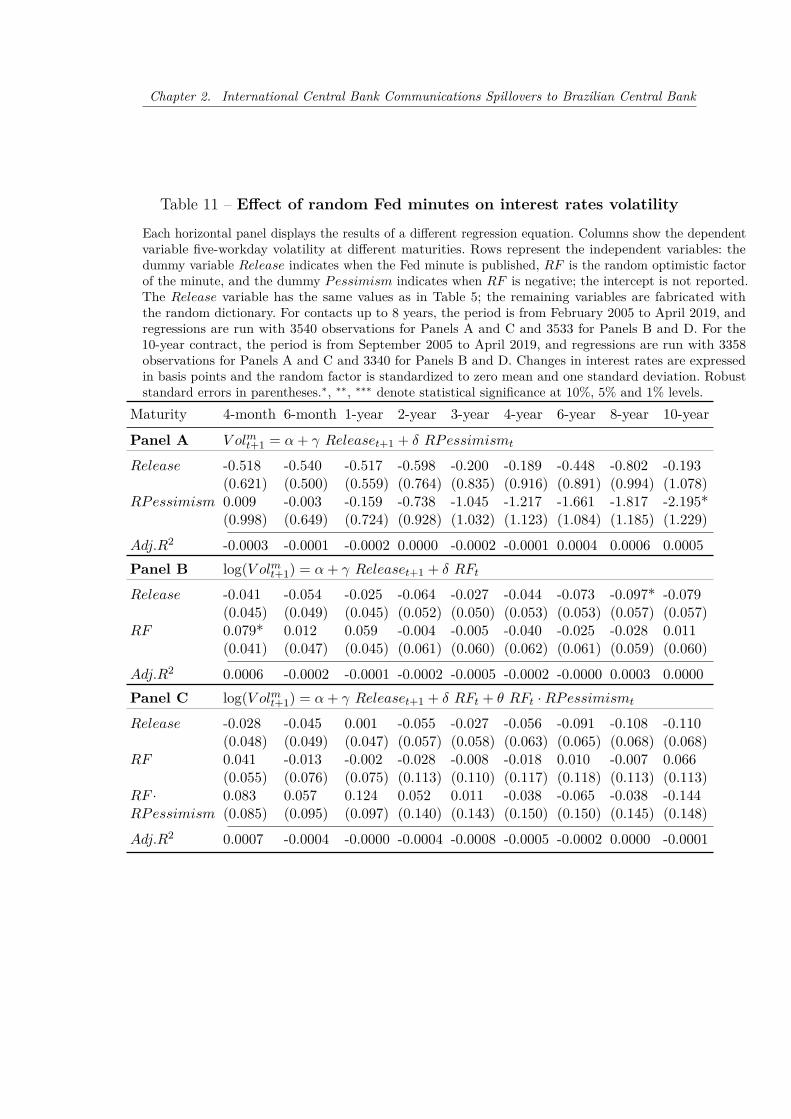
Panel A and B from Table 11 shows that the Release estimates are affectedby the random factor; they have the same sign but are less significant than theoriginal run. The remaining coefficients, which are a function of the randomdictionary, are mostly statistically insignificant at the 10% level. The exceptionsare RPessimism in Panel A and RF in Panel B, which are significant at the 10%level. From Tables 11 and 10 we see that, when the content is analyzed with therandom dictionary, there is not a significant relationship between the interest ratesvolatility and either the ECB press conference or the Fed minutes.
The results of the robustness analysis show that the interest rates level doesnot respond to shocks of arbitrary announcements. They also show that the relationbetween the optimistic factor of either bank and the interest rates is not spurious,and the optimistic factor is likely to be correctly synthesizing the information ofthe announcements that traders use when trading future interest rates.
2.6 Conclusion
This paper analyzes the relationship between the optimism of the ECBpress conference and the Fed minutes on the interest rate level and volatility offuture contracts traded in the Brazil stock exchange.

2.6. Conclusion 43
Table 10 – Effect of random ECB press conferences on interest ratesvolatility
Each horizontal panel displays the results of a different regression equation. Columns show the dependentvariable five-workday volatility at different maturities. Rows represent the independent variables: IRS isthe interest rate surprise control, the dummy variable Release indicates when the ECB press conferenceis published, RF IQ is the optimistic random factor of the press conference, and the dummy RPessimismindicates when RF IQ is negative; the intercept is not reported. The IRS and the Release variables havethe same values as in Table 4; the remaining variables are fabricated with the random dictionary. Theperiod from October 2003 to April 2019, regressions are run with 3875 observations for Panels A and Cand 3864 observations for Panels B and D. Release is nonzero in 169 observations for Panels A and Cand 168 observations for Panels B and D, and RPessimism is nonzero in 83 observations. Changes ininterest rates are expressed in basis points, and the random factor is standardized to zero mean and onestandard deviation. Robust standard errors in parentheses.∗, ∗∗, ∗∗∗ denote statistical significance at 10%,5% and 1% levels.
Maturity 2-month 4-month 6-month 1-year 2-year 3-year 4-year 6-year 8-year
Panel A V olmt+1 = α + β IRSt+1 + γ Releaset + δ RPessimismt
IRS 0.681*** 0.310*** 0.162*** 0.122*** 0.142*** 0.164*** 0.154*** 0.203*** 0.369***(0.050) (0.026) (0.023) (0.030) (0.039) (0.041) (0.042) (0.044) (0.063)
Release 0.286 0.836 0.000 0.295 0.263 0.363 0.312 0.088 0.074(1.186) (0.822) (0.813) (1.024) (1.326) (1.507) (1.528) (1.447) (1.653)
RPessimism -1.629 -0.901 -0.752 -0.936 -1.154 -1.362 -1.368 -1.071 -1.719(1.675) (0.999) (0.896) (1.131) (1.502) (1.697) (1.709) (1.671) (1.908)
Adj.R2 0.0501 0.0380 0.0134 0.0039 0.0033 0.0039 0.0033 0.0055 0.0100
Panel B log(V olmt+1) = α + β IRSt+1 + γ Releaset + δ RF IQt
IRS 0.021*** 0.026*** 0.021*** 0.013*** 0.013*** 0.013*** 0.011*** 0.014*** 0.020***(0.002) (0.002) (0.002) (0.002) (0.003) (0.003) (0.003) (0.003) (0.003)
Release -0.010 0.034 -0.058 -0.010 -0.032 -0.044 -0.044 -0.032 -0.020(0.029) (0.037) (0.044) (0.044) (0.047) (0.049) (0.049) (0.049) (0.053)
OF -0.053* -0.056 -0.089** -0.045 -0.043 -0.026 -0.024 -0.026 -0.048(0.030) (0.038) (0.044) (0.043) (0.047) (0.047) (0.049) (0.049) (0.056)
Adj.R2 0.0426 0.0410 0.0203 0.0067 0.0064 0.0065 0.0046 0.0065 0.0109
Panel C log(V olmt+1) = α + β IRSt+1 + γ Releaset + δ RF IQt + θ RF IQ
t · RPessimismt
IRS 0.021*** 0.026*** 0.021*** 0.013*** 0.013*** 0.013*** 0.011*** 0.014*** 0.020***(0.002) (0.002) (0.002) (0.002) (0.003) (0.003) (0.003) (0.003) (0.003)
Release -0.011 0.008 -0.092* -0.069 -0.054 -0.054 -0.045 -0.048 -0.034(0.031) (0.044) (0.051) (0.053) (0.055) (0.057) (0.057) (0.058) (0.063)
RF -0.054 -0.004 -0.025 0.071 0.001 -0.010 -0.024 0.001 -0.028(0.056) (0.069) (0.080) (0.068) (0.068) (0.069) (0.073) (0.075) (0.085)
RF · 0.006 -0.092 -0.110 -0.205** -0.074 -0.023 0.006 -0.039 -0.023RPessimism (0.069) (0.093) (0.101) (0.098) (0.107) (0.108) (0.114) (0.115) (0.133)
Adj.R2 0.0422 0.0410 0.0203 0.0074 0.0061 0.0061 0.0043 0.0062 0.0106
Chapter 2. International Central Bank Communications Spillovers to Brazilian Central Bank
Table 11 – Effect of random Fed minutes on interest rates volatility
Each horizontal panel displays the results of a different regression equation. Columns show the dependentvariable five-workday volatility at different maturities. Rows represent the independent variables: thedummy variable Release indicates when the Fed minute is published, RF is the random optimistic factorof the minute, and the dummy Pessimism indicates when RF is negative; the intercept is not reported.The Release variable has the same values as in Table 5; the remaining variables are fabricated withthe random dictionary. For contacts up to 8 years, the period is from February 2005 to April 2019, andregressions are run with 3540 observations for Panels A and C and 3533 for Panels B and D. For the10-year contract, the period is from September 2005 to April 2019, and regressions are run with 3358observations for Panels A and C and 3340 for Panels B and D. Changes in interest rates are expressedin basis points and the random factor is standardized to zero mean and one standard deviation. Robuststandard errors in parentheses.∗, ∗∗, ∗∗∗ denote statistical significance at 10%, 5% and 1% levels.
Maturity 4-month 6-month 1-year 2-year 3-year 4-year 6-year 8-year 10-year
Panel A V olmt+1 = α + γ Releaset+1 + δ RPessimismt
Release -0.518 -0.540 -0.517 -0.598 -0.200 -0.189 -0.448 -0.802 -0.193(0.621) (0.500) (0.559) (0.764) (0.835) (0.916) (0.891) (0.994) (1.078)
RPessimism 0.009 -0.003 -0.159 -0.738 -1.045 -1.217 -1.661 -1.817 -2.195*(0.998) (0.649) (0.724) (0.928) (1.032) (1.123) (1.084) (1.185) (1.229)
Adj.R2 -0.0003 -0.0001 -0.0002 0.0000 -0.0002 -0.0001 0.0004 0.0006 0.0005Panel B log(V olmt+1) = α + γ Releaset+1 + δ RFt
Release -0.041 -0.054 -0.025 -0.064 -0.027 -0.044 -0.073 -0.097* -0.079(0.045) (0.049) (0.045) (0.052) (0.050) (0.053) (0.053) (0.057) (0.057)
RF 0.079* 0.012 0.059 -0.004 -0.005 -0.040 -0.025 -0.028 0.011(0.041) (0.047) (0.045) (0.061) (0.060) (0.062) (0.061) (0.059) (0.060)
Adj.R2 0.0006 -0.0002 -0.0001 -0.0002 -0.0005 -0.0002 -0.0000 0.0003 0.0000Panel C log(V olmt+1) = α + γ Releaset+1 + δ RFt + θ RFt · RPessimismt
Release -0.028 -0.045 0.001 -0.055 -0.027 -0.056 -0.091 -0.108 -0.110(0.048) (0.049) (0.047) (0.057) (0.058) (0.063) (0.065) (0.068) (0.068)
RF 0.041 -0.013 -0.002 -0.028 -0.008 -0.018 0.010 -0.007 0.066(0.055) (0.076) (0.075) (0.113) (0.110) (0.117) (0.118) (0.113) (0.113)
RF · 0.083 0.057 0.124 0.052 0.011 -0.038 -0.065 -0.038 -0.144RPessimism (0.085) (0.095) (0.097) (0.140) (0.143) (0.150) (0.150) (0.145) (0.148)
Adj.R2 0.0007 -0.0004 -0.0000 -0.0004 -0.0008 -0.0005 -0.0002 0.0000 -0.0001

2.6. Conclusion 45
We show that while both announcements reduce the interest rates leveland volatility, their effect differs. Regarding interest rates level, Fed minutes affectlonger contracts and their impact is economically more significant. Concerninginterest rates volatility, an increase in the optimism of either announcement reducesit in mid- and long-term contracts. However, only the disclosure of the Fed minutessignificantly reduces uncertainty expressed for longer contracts. Also, the releaseof optimistic minutes is the leading cause of this reduction and affects mid-termcontracts.
The term structure of Brazil’s interest rate reflects investors’ expectationsregarding the future monetary policy of the CBB. These results show that tradersin Brazil’s market closely monitor foreign central bank announcements and considerthat the CBB monetary policy is based not only on the Brazilian economy but alsoon the decisions made by other central banks.


47
3 A Quantitative Assessment ofthe Evolution of Central Bankof Brazil Communications
Abstract
We analyze the evolution of minutes released by the Central Bank of Brazil un-der different presidencies. We text mine the documents and use natural languageprocessing exploring an unsupervised learning algorithm to score the discussionon the minutes in four different macroeconomic dimensions: inflation, economicgrowth, employment, and fiscal policy. Results of the study indicate the emphasisof the Central Bank of Brazil on the control of prices of goods and services, perhapsreflecting concerns of the negative and long-lasting impacts of past hyperinflationin the country.Keywords: Central bank communications, Inflation targeting, Text mining, Natu-ral language processing, Unsupervised learning algorithm

Chapter 3. A Quantitative Assessment of the Evolution of Central Bank of BrazilCommunications
3.1 Introduction
We analyze the Central Bank of Brazil (CBB) minutes under differentinstitutional chair mandates. After the adoption of the targeting inflation regimein July/1999, the minutes of the Monetary Policy Committee (COPOM) meetingrepresent the most important monetary tool of the CBB for the long-term inter-est rate. We study the announcements released between 2000 and 2019 on fourmacroeconomic dimensions: inflation, economic growth, employment, and fiscalpolicy.
For each dimension, we count the terms that appear in an ad hoc dictionaryand perform a principal component analysis (PCA) to get the macroeconomic scores.The scores indicate how much stress a document place on different macroeconomicvariables. The central question of our work is: How does the focus on these variableschange with different chairs of the CBB?
Regarding the size of the minutes, we observe that there are two restruc-turings in the analyzed period. These reorganizations take place at the end ofTombini’s first term, and at the beginning of Goldfajn’s presidency. In both cases,there is a drop in the length of the minutes. Also, over time, the variation of thelength of the document reduces.
Throughout the twenty years of analysis, we find that inflation is the mainconcern, followed by both employment and growth. This result may reflect theBrazilian historical economic context, as inflation has been especially worrisome.During the 1980 and 1990 the country hyperinflation strongly impacted the economy,reaching over 2,700% in 1993.
The results of the study show that fiscal policy is the least relevant topic;however, during the second half of Tombini’s presidency, there is a peak in thescore of fiscal policy reaching the same level of importance as the employment andgrowth scores. During Goldfajn and Campos Neto’s tenure, the gap between thescore of inflation and the scores of economic growth, employment, and fiscal policybecomes larger. This result also coincides with the lack of correlation between themacroeconomic scores and the macroeconomic indicators, which shows that duringtheir tenures there is a stronger adherence to the inflation targeting regime.

3.1. Introduction 49
Textual content in finance have been studied in various context. For in-stance, Cookson and Niessner (2019) analyze tweets to identify disagreement amonginvestors and Rybinski (2019) use natural language processing (NLP) techniquesto predict economic variables from sell-side research reports. Documents and tran-scripts of Central Banks’ meetings have been used in other studies. For instance,Vayid (2013) describes the history and discusses the effectiveness of the commu-nications of central banks, during the 2007 economic crisis, whereas Montes andScarpari (2014) examine the influence of communication policies of the centralbank on bank risk-taking. Amaya and Filbien (2015) investigate potential impactsof the communication of the European Central Bank on the financial market.
More closely related to our work are the studies from Cannon (2015) andHansen, McMahon and Prat (2018). Cannon (2015) analyzes the tone differenceamong bank presidents, governors, and federal reserve staff from transcripts ofthe Federal Open Market Committee (FOMC) announcements of the US FederalReserve System. Hansen, McMahon and Prat (2018) investigate how transparencyaffects the deliberation of monetary policymakers on the FOMC.
In the Brazilian context, the following literature uses text mining in CBB’sannouncements. Filho and Rocha (2010) study how the publication of minutes affectsthe term structure of interest rates. Regarding the content of the announcements,Carvalho, Cordeiro and Vargas (2013) and Chague et al. (2015) show that theinformation conveyed in statements and minutes, respectively, affect the interestrate structure. Our work differs from the former studies, as it analyzes the evolutionof these minutes under different presidencies and focus on economic dimensionsrelated to inflation, economic growth, employment, and fiscal policy. We use specificdictionaries and explore natural language processing with an unsupervised learningalgorithm.
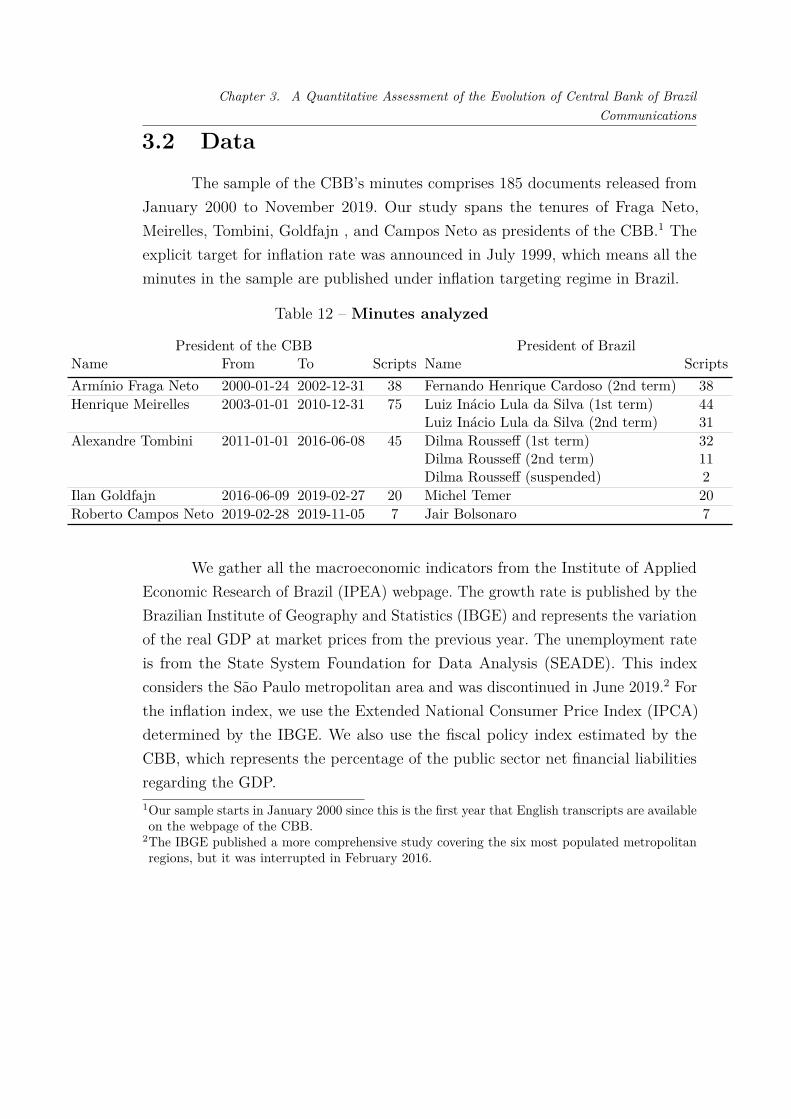
Chapter 3. A Quantitative Assessment of the Evolution of Central Bank of BrazilCommunications
3.2 Data
The sample of the CBB’s minutes comprises 185 documents released fromJanuary 2000 to November 2019. Our study spans the tenures of Fraga Neto,Meirelles, Tombini, Goldfajn , and Campos Neto as presidents of the CBB.1 Theexplicit target for inflation rate was announced in July 1999, which means all theminutes in the sample are published under inflation targeting regime in Brazil.
Table 12 – Minutes analyzed
President of the CBB President of BrazilName From To Scripts Name ScriptsArmínio Fraga Neto 2000-01-24 2002-12-31 38 Fernando Henrique Cardoso (2nd term) 38Henrique Meirelles 2003-01-01 2010-12-31 75 Luiz Inácio Lula da Silva (1st term) 44
Luiz Inácio Lula da Silva (2nd term) 31Alexandre Tombini 2011-01-01 2016-06-08 45 Dilma Rousseff (1st term) 32
Dilma Rousseff (2nd term) 11Dilma Rousseff (suspended) 2
Ilan Goldfajn 2016-06-09 2019-02-27 20 Michel Temer 20Roberto Campos Neto 2019-02-28 2019-11-05 7 Jair Bolsonaro 7
We gather all the macroeconomic indicators from the Institute of AppliedEconomic Research of Brazil (IPEA) webpage. The growth rate is published by theBrazilian Institute of Geography and Statistics (IBGE) and represents the variationof the real GDP at market prices from the previous year. The unemployment rateis from the State System Foundation for Data Analysis (SEADE). This indexconsiders the São Paulo metropolitan area and was discontinued in June 2019.2 Forthe inflation index, we use the Extended National Consumer Price Index (IPCA)determined by the IBGE. We also use the fiscal policy index estimated by theCBB, which represents the percentage of the public sector net financial liabilitiesregarding the GDP.1Our sample starts in January 2000 since this is the first year that English transcripts are availableon the webpage of the CBB.
2The IBGE published a more comprehensive study covering the six most populated metropolitanregions, but it was interrupted in February 2016.

3.3. Methodology 51
3.3 Methodology
We are interested in measuring the emphasis that minutes place on differentmacroeconomic categories: fiscal policy, economic growth, employment, and inflation.To measure each economic category m we use an NLP mechanism that exploresan unsupervised learning algorithm based on PCA, which was first used in theeconomic literature by Tetlock (2007). However, our approach differs since Tetlock(2007) counts terms present in the Harvard dictionary to measure sentiment, whilewe count the terms in each of the m ad hoc dictionaries to measure the emphasisput in each economic dimension. We have chosen the PCA method as it eliminatesthe redundant categories of each dictionary.
To get the quantitative measures from the minutes content we proceed in thefollowing way. First, we define a dictionary for each macroeconomic dimension; welist the dictionaries in Tables 13 to 16 for inflation, economic growth, employment,and fiscal score, respectively. The dictionaries have multiple groups semanticallyrelated, and each group has one or multiple semantically similar terms. For example,the dictionary we used to measure inflation (Table 13) has eight groups semanticallyrelated to inflation. The third group, associated with the Consumer price index(FGV), contains terms such as ipc-10 and ipc-m that are semantically similar (bothmeasure the same basket of goods and services but differ in the collection period).For each group that does not contain anachronisms, we remove the inflected formof words with Porter’s algorithm (PORTER, 1980), so we can increase the matchbetween terms.
Second, we find the principal component of each economic dimension. Foreach of the 185 minutes, we count the number of entries that falls into each of theGm macroeconomic groups of a macroeconomic variable m. Then, we normalize eachfrequency by the length of the corresponding minute and collapse the 185 vectors intoa matrix Am of dimension (Gm × 185). On Am, we apply PCA on covariance; selectthe eigenvector with the highest eigenvalue; and set the eigenvector’s componentto a positive sign. The resulting vector is the basis vectors vm that summarizes theinformation of its corresponding matrix Am. We listed the weight of the componentsin the last column of Tables 13 and 16.

Chapter 3. A Quantitative Assessment of the Evolution of Central Bank of BrazilCommunications
Table 13 – Groups used to measure inflation
Group Description Terms WeightI Inflation related terms† deflat, deflation, deflation-
ari, disinfl, disinflationari,infla, inflat, inflation,inflation-index, inflation-link, inflation-persist,inflation-target, inflation-ari
0.998
II Retail prices (IBGE) ipca, ipca-15, ipca-ex, ip-caex
0.041
III Consumer price index (FGV) ipc, ipc-10, ipc-br, ipc-cor,ipc-di, ipc-m, ipc-s
0.031
IV General price index (FGV) igp, igp-10, igp-di, igp-m 0.029V Wholesale price index (FGV) ipa, ipa-10, ipa-di, ipa-m 0.023VI National construction cost index incc, incc-10, incc-di, incc-
m0.016
(FGV)VII Producer price index (IBGE) ipp 0.014VIII Brazilian inflation linked bonds ntn, ntn-b, ntn-c 0.013
(National Treasury)† Stemmed terms with Porter’s algorithm.
Table 14 – Groups used to measure economic growth
Group Term WeightI product 0.994II output 0.120III gdp 0.104
All terms are stemmed with Porter’s algorithm.
Finally, we get each macroeconomic measure, and construct m time seriesof length 185 from the product between Am and vm. Since the components of eachbasis vector have a positive sign, the greater the score of a document in the timeseries, the higher the document’s attention to the macroeconomic category m.
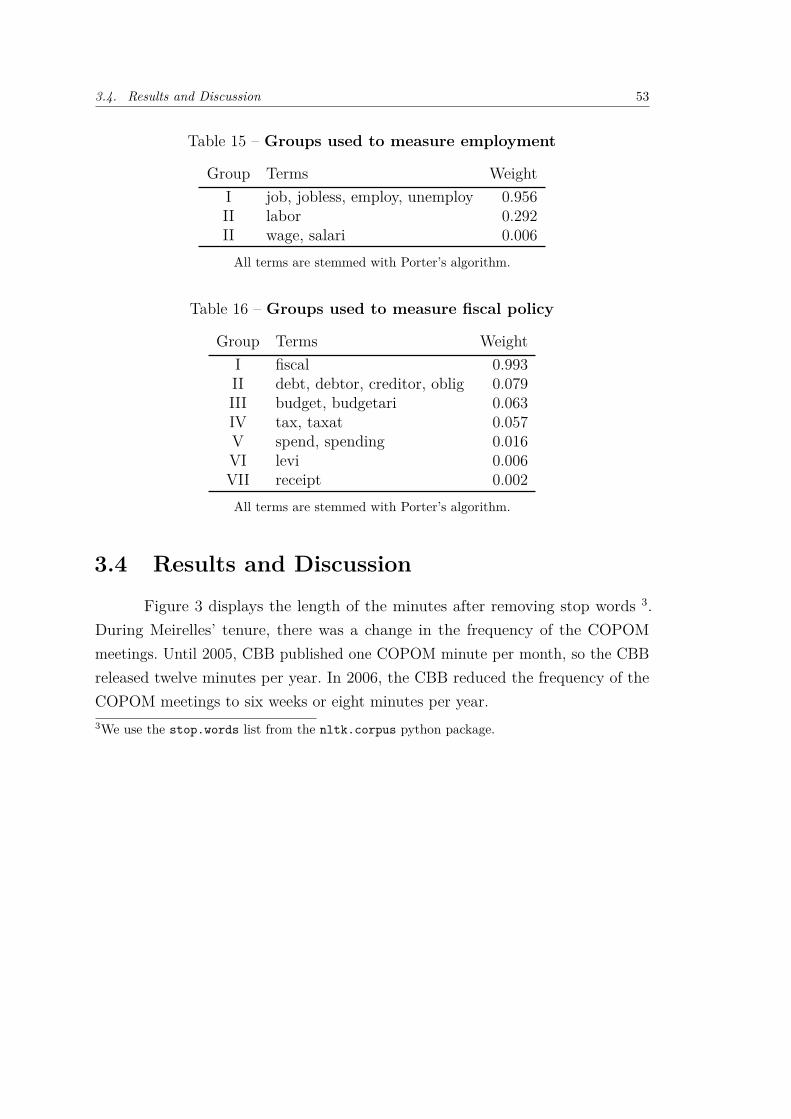
3.4. Results and Discussion 53
Table 15 – Groups used to measure employment
Group Terms WeightI job, jobless, employ, unemploy 0.956II labor 0.292II wage, salari 0.006
All terms are stemmed with Porter’s algorithm.
Table 16 – Groups used to measure fiscal policy
Group Terms WeightI fiscal 0.993II debt, debtor, creditor, oblig 0.079III budget, budgetari 0.063IV tax, taxat 0.057V spend, spending 0.016VI levi 0.006VII receipt 0.002
All terms are stemmed with Porter’s algorithm.
3.4 Results and Discussion
Figure 3 displays the length of the minutes after removing stop words 3.During Meirelles’ tenure, there was a change in the frequency of the COPOMmeetings. Until 2005, CBB published one COPOM minute per month, so the CBBreleased twelve minutes per year. In 2006, the CBB reduced the frequency of theCOPOM meetings to six weeks or eight minutes per year.3We use the stop.words list from the nltk.corpus python package.

Chapter 3. A Quantitative Assessment of the Evolution of Central Bank of BrazilCommunications
We can see that when meetings were held less frequently, the minutes gotlarger. From Fraga Neto to Meirelles, minutes grew from a mean size of 2,500 wordsto 4,500 words. In the first half of Tombini’s tenure, the mean length remainedunchanged, but then, in March 2014, the size plunged to a mean size of 2,200 words.In October 2016, with the transition from Tombini to Goldfajn, there was a secondreduction to a mean size of 1,400 words. These two size cuts showed a restructuringof the minutes. During Goldfajn’s and Campos Neto’s term, the mean lengthremained unchanged. Also, over time, the variation of the length reduced. DuringFraga Neto’s tenure, the variation was the largest; with Meirelles and Tombini,decreased; and, with Goldfajn and Campos Neto, attained its minimum.
Figure 3 – Time-series of the COPOM minutes length.The black line represents minutes’ length after removing stop words, and the dashed line indicatesthe mean length by the presidential term of Brazil. Alternate background colors correspond toCBB’s presidencies. The series shows 185 minutes from January 24, 2000 to November the 5,2019.

3.4. Results and Discussion 55
Figure 4 shows the four macroeconomic scores for each dimension: inflation,economic growth, employment, and fiscal policy. As expected, when we comparedthe scores, the most important topic in each presidency is inflation. Its relevance islow with Fraga Neto, increases with Meirelles, and, in the first half of Tombini’spresidency, gradually declines. However, in the second half of his term, inflationarrives at a historical maximum; rises again when Goldfajn assumes the presidency;and remains high with Campos Neto. Employment and economic growth are thesecond most important scores. Employment is more relevant than economic growthuntil the first half of Meirelles presidency, but this relation reverts afterward. Fiscalpolicy is the less important subject throughout the series, except for two occasionsin which it remains close to economic growth and employment: at the end ofTombini’s term when fiscal policy peaks, and with Campos Neto when growth andemployment reach their historical minimum. Finally, the second restructuring notonly places more relevance to inflation but also reduces the attention in economicgrowth, employment, and fiscal policy. Hence, during Campos Neto and Goldfajn,inflation becomes the sole macroeconomic concern.
Figure 4 – Macroeconomic scores.Thick lines represent the macroeconomic scores, and the thin lines are their corresponding meanscore for each president Brazil. Alternate background colors correspond to BCB’s presidencies.The series shows 185 scores corresponding to the minutes release between January 2000 andNovember 2019.
Chapter 3. A Quantitative Assessment of the Evolution of Central Bank of BrazilCommunications
Figure 5 shows the time-series of the factors separated in four frames alongwith their corresponding macroeconomic indicators. The content of each frameis: (a) the inflation scores and rates, (b) economic growth scores and rates, (c)employment scores and unemployment rates, and, (d) fiscal policy scores and debt.We smooth out the inflation, economic growth, and unemployment indicators witha simple moving average of the twelve past observations. That is, the window ofthe moving average is one year for inflation and unemployment and three yearsfor growth. To ease the comparison between each score with its correspondingeconomic indicator, we scale the range in [0, 1] using min-max normalization.
With each presidential term, the scores become less volatile, except forthe fiscal score during the beginning of Goldfajn’s and Campos Neto’s mandates.Frames (a) and (d) show that until Tombini, the inflation score and fiscal policyare correlated with their respective economic indicators. Frame (a) also displaysthat Goldfajn’s and Campos Neto’s presidencies have both low inflation rates andhigh inflation scores. Frame (d) shows the opposite as the fiscal score is relativelylow while debt is in a historic high. Frames (b) and (c) show that economic growthand employment are uncorrelated with the economic growth and unemploymentindicators throughout the series; also, the scores remain to a historic low.
In conclusion, the second restructuring, which takes place with Godlfajn,impacts on the macroeconomic scores. Inflation achieves a historical maximum, whilecuts down not only economic growth and employment to a historical minimum butalso reduces fiscal policy. These results indicate that after the second restructuring,the CBB shows a tighter adherence to the inflation targeting regime.
3.5 Conclusion
Our study contributes to the understanding of communications of centralbanks, by focusing on an emerging country, with high volatile economic and politicalenvironments.

3.5. Conclusion 57
(a) Inflation
(b) Economic growth
(c) Employment
(d) Fiscal policyFigure 5 – Macroeconomic scores of the COPOM minutes.
Black and gray lines represent the macroeconomic scores and indicators, respectively. Alternate back-grounds colors correspond to BCB’s presidencies. Series (a) shows the inflation scores and the IPCAinflation rates. Series (b) shows the economic growth scores and the real GDP growth rates. Series (c)shows the employment scores and the unemployment rates. Series (d) shows the fiscal policy scores andthe government debt as a percentage of the GDP. We smooth out the inflation, economic growth, andunemployment indicators with a simple moving average of twelve observations. Both the scores and eco-nomic indicators are min-max normalized to scale the range in [0, 1]. Except for the unemployment rate,which spans until July 2019, each series shows the macroeconomic score and index from January 2000to November 2019. Each series (a), (b), (c), and (d) displays 239 inflation, 78 GDP, 233 unemployment,and 238 debt indicators, respectively.

Chapter 3. A Quantitative Assessment of the Evolution of Central Bank of BrazilCommunications
The COPOM meeting minutes provide a record of what were the concernsthat the CBB under different presidencies. From Fraga Neto to Meirelles, the sizeof the minutes got larger and remained unchanged until the end of Tombini’s firstpresidency, in which there is a plunge of their size. When Goldfajn assumes thepresidency, there is a second restructuring, which also reduces the size of minutesto its current level.
We used an unsupervised learning algorithm to score the emphasis thatminutes place on inflation, economic growth, employment, and fiscal policy. Wefind that inflation is the major concern, followed by both economic growth andemployment. The fiscal policy is the least important topic; however, before the firstrestructuring its concern attains the attention of growth and employment.
The second restructuring shows that the inflation score attains a historicmaximum, whereas economic growth, employment and fiscal policy remain low.Moreover, the lack of correlation between the macroeconomic scores and themacroeconomic variables reflects that inflation is the main monetary policy aim ofGoldfajn and Campos Neto.
The communications of the CBB may suggest that hyperinflation duringthe 1990s, with enduring effects in the economy, may still influence monetary policyin Brazil, favoring control of prices of goods and services over growth, employmentand fiscal policies.

59
4 A Measure of the Economicand Financial Crisis Senti-ment in Central Bank Commu-nications
Abstract
We build a dictionary to measure the crisis sentiment of central bank announcementsusing a machine learning classifier trained with terms that come from monetarypolicy or economic/financial crisis books. We use the dictionary to create a crisisindex of the Federal Open Market Committee minutes. The index predicts theinterest rate and volatility of the U.S. treasuries. Our index outperforms the indicescreated with the Correa, the Harvard-IV, or the Loughran-McDonald dictionaries.Keywords: Central bank communications, Text mining, Natural language process-ing, Supervised learning algorithm, Crisis sentiment, Interest Rate

Chapter 4. A Measure of the Economic and Financial Crisis Sentiment in Central BankCommunications
4.1 Introduction
The main reason Central bank communication has become more transparentis for economic reasons (GERAATS, 2002). More transparency helps predict centralbank actions, and, by lowering market uncertainty, reduces the volatility in financialmarkets (BLINDER et al., 2008). Since the financial crisis of 2007-2009, many centralbanks from developed economies have set the short-term nominal interest rate closeto zero; thus, forward guidance has gained even more importance (CAMPBELL etal., 2012). However, there is little knowledge regarding the economic crisis sentimentconveyed on central banks forward guidance.
Our article seeks to fill this gap by analyzing the crisis sentiment of centralbank announcements. Our contributions to the literature are threefold: i) we createa crisis sentiment dictionary with the aid of a supervised classifier; to our knowledge,it is the first time a supervised machine learning classifier is used in the economicliterature to develop a lexicon; ii) we provide a real-time index that measures thesentiment crisis of the Federal Open Market Committee (FOMC) minutes; duringthe 2007-2008 financial crisis, our index shows that up to 6% of the total numberof words are crisis-related; iii) we show empirically that the crisis index from theFOMC minutes significantly predicts the interest rate and the volatility of theUS treasuries. An increment (decline) in the crisis sentiment predicts a reduction(increase) of the interest rate level for the intermediate-term maturities and anincrease (reduction) of the volatility for the long-term maturities. We also showthat our index is robust to macroeconomic information available at the time theFOMC minute is released. We also measure alternative sentiments with the Correa,the Harvard-IV, and the Loughran-McDonald dictionaries. We find that our indexsignificantly outperforms those indices.
To create the dictionary, we train a penalized logistic regression with mone-tary policy books classified as either crisis or general theory. The model identifiesthe terms that associated with a crisis. From this subset, we focus our effort onidentifying manually the entries that will compose our lexicon.

4.1. Introduction 61
Our method has several advantages. First, the use of a machine learningapproach greatly reduces the lexicographic effort. Correa et al. (2017) and Picaultand Renault (2017) have to analyze manually 7388 words and 7333 sentences,respectively. Since we let the algorithm filter out irrelevant terms, we only haveto analyze 809 terms; in comparison, this is a reduction of nearly 90% on thetime needed in the create our dictionary. On the other hand, Apel and Grimaldi(2012) created an ad hoc list of twenty-one nouns and adjectives to measure thesentiment of central bank announcements; however, the dictionary fails to predictthe monetary stance of the ECB introductory statement.
Second, since supervised learning classifiers are simple to scale, the dictionaryis easy to update. Each time Picault and Renault (2017) needs to update thedictionary with a recent announcement, it has to both analyze new sentences andrecalculate the weight of the lexicon. Our method only requires adding new booksto the algorithm and then analyze those novel terms that the model highlights.
Third, since the lexicon is from books of general monetary policy theory,the dictionary is independent of the monetary institution; moreover, we designedthe dictionary ready for the creation of real-time indices.
Picault and Renault (2017) use the ECB introductory statements to createdictionaries that measure the stance of the monetary policy and the state of theEurozone economy; when they use these dictionaries for real-time prediction, theirpredictive power is not significant to explain stock market volatility. By design,our method is robust to any look-ahead bias and can be used to different centralbank announcements without further adjustments. Contrary to the assertion ofPicault and Renault (2017), we show empirically that equal-weighted single worddictionaries are powerful tools to create meaningful quantitative indicators.

Chapter 4. A Measure of the Economic and Financial Crisis Sentiment in Central BankCommunications
Our paper is organized as follows. In Section 4.2, we review the literatureassociated with textual analysis in the area of finance and central banks. In Section4.3, we describe the data to train the classifier; the announcements to create thecrisis index; and the macroeconomic variables and the US treasuries to perform theregressions. In Section 4.4, we explain the supervised machine learning model weuse to create the dictionary and to measure the crisis sentiment. In Section 4.5, wedescribe the method and empirical findings. In Section, 4.6 we check if the crisisindex conveys relevant information relative to different macroeconomic indicatorsand test alternative measures. Our paper concludes in Section 4.7.
4.2 Literature Review
Our work is related to the literature that studies central bank communica-tions. We quantify the crisis sentiment of FOMC minutes and its prediction poweron the interest rate level and volatility of the US treasuries.
On a general level, the following works use textual analysis to study the effecton asset prices. Tetlock (2007) uses Principal Component Analysis with the Harvard-IV dictionary to measure the effect of news media on stock markets; Loughranand McDonald (2011) use term frequency-inverse document frequency to createthe financial dictionary; and Shapiro, Sudhof and Wilson (2017) combine differentdictionaries to estimate how sentiment in news articles affect macroeconomicindicators.

4.3. Data 63
Closer to our work is the research on textual analysis and central banking.Boukus and Rosenberg (2006) use latent Dirichlet allocation to assess the effect ofthe Fed communications on the market and Hansen, McMahon and Prat (2018)use the same statistical model to study how transparency affect deliberation withinthe FOMC. Apel and Grimaldi (2012), use bigrams of words to quantify theinformation of the Swedish Central Bank minutes to predict policy decisions;Lucca and Trebbi (2009) develop a method to estimate the economic stance ofthe FOMC statements and the effect on Treasury yields; Picault and Renault(2017) create weighted dictionaries to measure ECB communications and to predictfutures bank’s decisions. Shapiro and Wilson (2019) measure the sentiment of theFed’s policymakers with the Loughran and McDonald (2011) dictionary to estimatethe bank’s objective. Schmeling and Wagner (2019) also use the Loughran andMcDonald (2011) dictionary to study the effect of the ECB press conferences onasset prices.
Related to our crisis dictionary is the financial stability dictionary createdby Correa et al. (2017) used to extract the sentiment from the financial stabilityreports. The major differences with our work are i) we measure a different textualdimension; in economics, crisis and stability are not complementary antonyms; 1
ii) we build our dictionary with the aid of a machine learning approach, whereasCorrea analyzes individually each word; and iii) crisis concerns the public, whilefinancial stability interests policymakers.
4.3 Data
We develop a crisis sentiment index of the FOMC minutes from March18, 2004 to April 10, 2019 that correspond to the FOMC meetings held betweenJanuary 27-28, 2004 and March 19-20, 2019. To build the index, we develop a crisisdictionary with the aid of a machine learning classifier we trained with monetarypolicy or financial/economic crisis books. We list these books on Tables 17 and 18.1For example, the word crisis does not convey sentiment in the financial stability report Correaet al. (2017).

Chapter 4. A Measure of the Economic and Financial Crisis Sentiment in Central BankCommunications
Table17
–B
ooksused
forextracting
thecrisis
features
The
tableshow
s.
Author/Editor
YearT
itleA
restis,Philip;Sawyer,M
alcolm2012
The
EuroC
risisBarth,Jam
esR.;Trim
bath,Susanne;Yago,Glenn;Barth,
James
R.;Yago,G
lenn2004
The
Savingsand
LoanC
risis:Lessonsfrom
aR
egulatoryFailure
Botsiou,Konstantina
E.2011
The
globaleconomic
crisisand
thecase
ofGreece
Celi,
Giuseppe;
Ginzburg,
Andrea;
Guarascio,
Dario;
Simonazzi,A
nnamaria
2017Crisis
inthe
EuropeanM
onetaryU
nion:ACore-Periphery
Perspec-tive
Claessens,Stijn;K
ose,Ayhan;Laeven,Luc;Valencia,Fabian
2014FinancialC
rises:C
auses,Consequences,and
PolicyR
esponses
Han,M
iao2016
CentralBank
Regulation
andthe
FinancialCrisis
Johnson,Simon;Jam
es,Kwak
201113
Bankers:
The
Wall
StreetTakeover
andthe
Next
FinancialM
eltdown
Karasavvoglou,A
nastasios;Polychronidou,Persefoni2014
Economic
Crisis
inEurope
andthe
BalkansLo,A
ndrewW
.2012
Reading
About
theFinancialC
risis:ATwenty-O
ne-BookR
eviewM
acdonald,Roderick
2018Eurocritical
Moro,Beniam
ino;Beker,Victor
A.
2016M
odernFinancialC
risesR
einhart,Carm
enM
.;Rogoff,K
ennethS.
2009T
histim
eis
different:eightcenturies
offinancialfollyT
homas,Lloyd
B.2013
The
FinancialCrisis
andFederalR
eservePolicy
UN
CTA
D2009
The
globaleconomic
crisis:systemic
failuresand
multilateralrem
e-dies

4.3. Data 65
Tabl
e18
–B
ooks
used
for
extr
acti
ngth
eth
eory
feat
ures
The
tabl
esh
ows
.
Aut
hor/
Edito
rYe
arT
itle
Bain
,K.;
How
ells,
P.G
.A.
2003
Mon
etar
yec
onom
ics:
polic
yan
dits
theo
retic
alba
sisBo
finge
r,Pe
ter;
Rei
schl
e,Ju
lian;
Schä
chte
r,A
ndre
a20
01M
onet
ary
polic
y:go
als,
inst
itutio
ns,s
trat
egie
s,an
din
stru
men
tsFl
emin
g,M
iles
1972
Mon
etar
yT
heor
yFr
iedm
an,M
ilton
;Hel
ler,
Wal
ter
Wol
fgan
g19
69M
onet
ary
vs.fi
scal
polic
yFu
hrer
,Jeff
;Kod
rzyc
ki,Y
olan
daK
.;Li
ttle
,Jan
eSn
ed-
don;
Oliv
ei,G
iova
nniP
.20
09U
nder
stan
ding
Infla
tion
and
the
Impl
icat
ions
for
Mon
etar
yPo
licy:
APh
illip
sC
urve
Ret
rosp
ectiv
eH
amor
i,Sh
igey
uki;
Ham
ori,
Nao
ko20
09In
trod
uctio
nof
the
Euro
and
the
Mon
etar
yPo
licy
ofth
eEu
rope
anC
entr
alBa
nkLu
cas,
Jr.,
Rob
ert
E.20
12C
olle
cted
Pape
rson
Mon
etar
yT
heor
y:M
erce
r,Je
ffrey
M.
2001
The
Rol
eof
Mon
etar
yPo
licy
inIn
vest
men
tM
anag
emen
tTa
ylor
,Les
ter
D.
2010
Cap
ital,
Acc
umul
atio
n,an
dM
oney
Wal
sh,C
arlE
.20
10M
onet
ary
theo
ryan
dpo
licy
Whi
te,L
awre
nce
H.
1999
The
theo
ryof
mon
etar
yin
stitu
tions
Woo
dfor
d,M
ichae
l20
03In
tere
stan
dpr
ices
:fou
ndat
ions
ofa
theo
ryof
mon
etar
ypo
licy

Chapter 4. A Measure of the Economic and Financial Crisis Sentiment in Central BankCommunications
We use the 1-, 2-, 3-, 5-, 7-, 10-, 20, and 30-year US treasury constantmaturity rate – defined as DGS1, DGS2, DGS3, DGS5, DGS7, DGS10, DGS20,and DGS30 – for our empirical application, where we test our index and compareits predictability power with the Correa and the Harvard-IV dictionaries. The UStreasury interest rates are from March 08, 2004 to April 18, 2019; except for the30-year treasury that is from February 9, 2006 to April 18, 2019.2 Table 19 showsthe descriptive statistics of the interest rates level and the 5-day volatility.
To control for the crisis effect on the interest rates and the volatility weconsider macroeconomic variables as in Faust et al. (2007): consumer price index(CPI), output (GDP), housing starts (HS), initial job claims (IJC), non-farmpayroll (NFP), consumer sentiment (CS), retail sales (RS), international tradebalance (IT), and unemployment rate (UR). The data is from the repository of theArchival Federal Reserve of Economic Data (ALFRED St. Louis) and is vintage.The data from the CPI, DP, HS, IJC, NFP, CS, RS, IT, and UR is from April 27,2000 to December 20, 2019. In the regressions, we standardize the macroeconomicindicators.
To identify the terminology that central banks employ, we use announce-ments of the Fed and the ECB. From the Fed, we consider the terms in the speechesgiven, during their presidency, by Greenspan and Bernanke (until December 2011);the statements from March 28, 2006 and May 1, 2019; and the minutes used tocreate the index. From the ECB, we gather the terms in the introductory statementsand the questions and answers sessions from March 28, 2006 to May 1, 2019.
4.4 The Crisis dictionary and the Index
We aim to create a dictionary to measure the level of crisis in central bankcommunications. To reduce lexicographic effort, we train a regularized logisticregression classifier with books of monetary policy that belong to two categories:general theory or economic/financial crisis. We only consider those terms theclassifier highlights as an economic/financial crisis.2The 30-year Treasury constant maturity series was discontinued on February 18, 2002, andreintroduced on February 9, 2006.

4.4. The Crisis dictionary and the Index 67
Table 19 – FOMC Minutes, Interest Rates and Volatility
This table contains descriptive statistics for the sample of future rates with constant maturities. The datais from March 8 to April 4, 2019 for The US treasury interest rates up to 20 years and is February 10,2006 to April 18, 2019 for the 30-year interest rate. Units are expressed in basic points.
Panel A: FOMC Minutes
Number Mean Number of Words
FOMC Minutes 122 4313.93(1364.40)
Panel B: Interest Rates
Min Max Mean Std Skew KurtDGS1 0.08 5.30 1.53 1.63 1.00 -0.34DGS2 0.16 5.29 1.75 1.52 0.89 -0.55DGS3 0.28 5.26 1.97 1.41 0.80 -0.62DGS5 0.56 5.23 2.41 1.24 0.61 -0.75DGS7 0.91 5.23 2.76 1.11 0.46 -0.88DGS10 1.37 5.26 3.10 1.02 0.34 -1.12DGS20 1.69 5.61 3.63 1.00 0.13 -1.39DGS30 2.11 5.35 3.62 0.81 0.34 -1.23
Panel C: Volatility
Min Max Mean Std Skew Kurtσ(DGS1) 0.00 30.10 2.39 2.61 3.76 20.01σ(DGS2) 0.00 29.70 3.72 2.79 2.72 12.11σ(DGS3) 0.45 28.51 4.26 2.78 2.42 10.38σ(DGS5) 0.63 24.47 4.96 2.76 1.91 6.03σ(DGS7) 0.45 24.41 5.15 2.69 1.84 5.98σ(DGS10) 0.89 23.69 4.93 2.50 1.87 6.61σ(DGS20) 0.45 17.21 4.82 2.33 1.52 3.64σ(DGS30) 0.63 18.29 4.77 2.40 1.54 3.61
Before training the classifier, we pre-process the books in two steps. First, toidentify the terminology that central banks employ, we collect announcements fromthe Fed and the ECB. From the Fed, we gather speeches, statements, and minutesand, from the ECB, the introductory statements and the questions and answerssessions. Once we compile all the announcements, we stem each term with thePorter algorithm and discard those terms with less than three characters. From thisprocess, we get 13473 unique terms. In the next step, we use this list to pre-processthe books.

Chapter 4. A Measure of the Economic and Financial Crisis Sentiment in Central BankCommunications
Second, we pre-process the books that will be part of the training sample.Tables 17 and 18 show the twenty-six books of monetary policy we use to train theclassifier; we label fourteen books as economic crisis and twelve books as generaltheory. To each word in the books, we apply the Porter stemmer. Then, we removethe terms that are not listed in the central bank terminology (from step one); arelisted as country, city, or stopwords; or whose frequency is lower than 12.3 Finally,we tokenize the remaining content of each book into sentences. These sentences,classified as economic crisis or general theory, is our training sample.
From this process, we obtain 49101 sentences from the crisis books, and54030 sentences from the general theory books, and 7392 unique terms.
4.4.1 The Classifier
The framework of the logistic regression classifier is the standard bag-of-features. Let {t1, t2, .., tp} the predefined set of terms that can appear in any thesentences. Let Ij(si) an indicator function that takes the value 1 when term j
appears in sentence i and 0 otherwise. Then, each sentence si is represented by avector vi = (I1(si), I2(si), .., Ip(si)).
In the binary logistic regression, the probability that the i-th sentence si
belongs to the class ci ∈ {−1, 1} = {crisis, monetary policy} is:
P (ci|si) = 11 + e−ci(β0+βT vi)
. (4.1)
In order to estimate the vector of parameters β, we use the model knownas the elastic net. The elatic-net linearly combines the L1 and L2 penalties ofrespectively the lasso and ridge regression. The elastic-net estimate is defined by
β̂ =argmaxβ
n∑i=1
log 11 + e−ci(β0+βT vi)
subject to(α
p∑j=1
|βj| + (1 − α)p∑
j=1β2
j
)≤ λ,
(4.2)
3The list of countries is from the Encyclopædia Britannica. The list of cities (with a populationlarger than 5000) is from GeoNames. The list of stop words is from the NLTK python library.
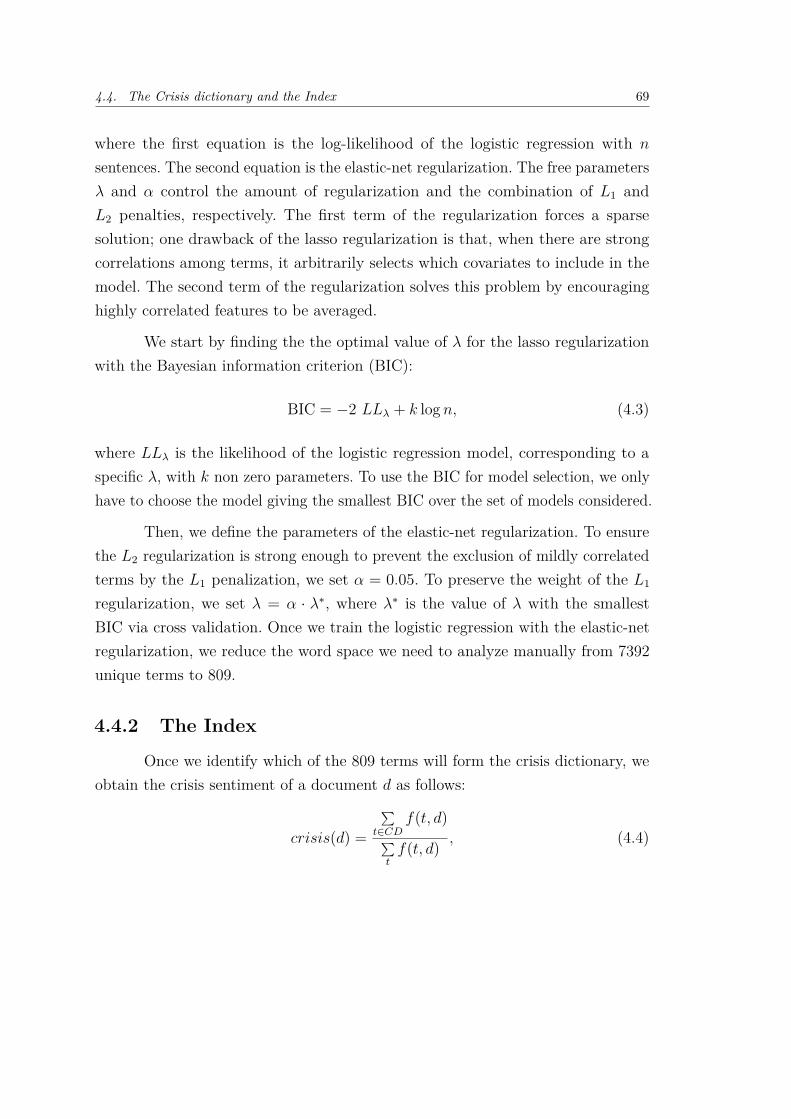
4.4. The Crisis dictionary and the Index 69
where the first equation is the log-likelihood of the logistic regression with n
sentences. The second equation is the elastic-net regularization. The free parametersλ and α control the amount of regularization and the combination of L1 andL2 penalties, respectively. The first term of the regularization forces a sparsesolution; one drawback of the lasso regularization is that, when there are strongcorrelations among terms, it arbitrarily selects which covariates to include in themodel. The second term of the regularization solves this problem by encouraginghighly correlated features to be averaged.
We start by finding the the optimal value of λ for the lasso regularizationwith the Bayesian information criterion (BIC):
BIC = −2 LLλ + k log n, (4.3)
where LLλ is the likelihood of the logistic regression model, corresponding to aspecific λ, with k non zero parameters. To use the BIC for model selection, we onlyhave to choose the model giving the smallest BIC over the set of models considered.
Then, we define the parameters of the elastic-net regularization. To ensurethe L2 regularization is strong enough to prevent the exclusion of mildly correlatedterms by the L1 penalization, we set α = 0.05. To preserve the weight of the L1
regularization, we set λ = α · λ∗, where λ∗ is the value of λ with the smallestBIC via cross validation. Once we train the logistic regression with the elastic-netregularization, we reduce the word space we need to analyze manually from 7392unique terms to 809.
4.4.2 The Index
Once we identify which of the 809 terms will form the crisis dictionary, weobtain the crisis sentiment of a document d as follows:
crisis(d) =
∑t∈CD
f(t, d)∑t
f(t, d) , (4.4)

Chapter 4. A Measure of the Economic and Financial Crisis Sentiment in Central BankCommunications
Figure 6 – Index of Economic/Financial Crisis Index.The crisis index is constructed by measuring the percentage of words belonging to the crisisdictionary words. FOMC minutes are from March 18, 2004 to April 10, 2019 that correspondto the FOMC meetings held between January 27-28, 2004 and March 19-20, 2019. Gray areacorresponds to US business cycle contraction from the NBER’s Business Cycle Dating Committee.
where f(t, d) is the frequency of term t in document d and CD is the set of termsof the crisis dictionary. Figure 6 shows the time series of the crisis index for theFOMC minutes and Figure 2 shows the most relevant terms in the index.
To facilitate comparison, we standardize the indices created with the crisis,the finacial stability, and the Harvard-IV dictionaries.
4.5 Methodology
To explain the effect that the crisis sentiment of FOMC minutes has on theUS treasury interest rates returns for the 1-, 2-, 3-, 5-, 7-, 10-, 20-, and 30-yearmaturities, we use the following equation:
∆Ryt = α + β ∆Crisist, (4.5)

4.5. Methodology 71
Figure 7 – Relative importance of words.The word cloud is generated by estimating the relative importance of the words within the set ofFederal Reserve minutes. A larger word has more relevance in the estimation of the index valuefor the minute. FOMC minutes are from March 18, 2004 to April 10, 2019 that correspond to theFOMC meetings held between January 27-28, 2004 and March 19-20, 2019.
where ∆Ryt represents the interest rate difference between the day the announcement
is released and the previous day for maturity y; ∆crisist represents the crisismeasure difference between the FOMC minute release in day t and the previousone.
To study the effect the crisis sentiment has on the volatility, we use thefollowing model:
V OLyt = α1 + α2 Releaset + α3 V OLy
t−5 + β Crisist, (4.6)

Chapter 4. A Measure of the Economic and Financial Crisis Sentiment in Central BankCommunications
where V OLyt =
√15
∑4i=0 Ry
t+i2 represents the interest rate variation in a time
window of five working days, and crisist is the crisis measure of the FOMC minuterelease in day t. The dummy variable Releaset takes the value of one when theannouncement is released and zero otherwise.
Table 20 – Federal Reserve FOMC Minutes Crisis Index and InterestRate
This table shows the regressions from Equation (4.5). Each column represents a treasury constant maturityinterest rate for 1-, 2-, 3-, 5-, 7-, 10-, 20-, and 30-Year after the release of the FOMC minutes. Eachregression is performed with the FOMC minutes crisis index. FOMC minutes are from March 18, 2004to April 10, 2019 that correspond to the FOMC meetings held between January 27-28, 2004 and March19-20, 2019; interest rates are from March 08, 2004 to April 18, 2019; except for the 30-year treasury thatis from February 9, 2006 to April 18, 2019. Robust standard errors in parentheses.
DGS1 DGS2 DGS3 DGS5 DGS7 DGS10 DGS20 DGS30
const -0.25 -0.09 0.16 0.24 0.31 0.56 0.74 0.78(0.33) (0.40) (0.46) (0.51) (0.50) (0.46) (0.45) (0.48)
crisis -0.30 -0.91** -0.88* -1.37** -1.35*** -1.09** -0.77* -0.73(0.34) (0.43) (0.49) (0.56) (0.52) (0.47) (0.44) (0.45)
Adj.R2 -0.0028 0.0250 0.0162 0.0387 0.0390 0.0285 0.0108 0.0096n 121 121 121 121 121 121 121 106
Table 20 shows that the content of the FOMC minutes affects the interestrate level of the US treasuries. The index shows that an increment (decline) in thecrisis sentiment predicts a reduction (increase) of the interest rate level for all thematurities. The prediction is statistically significant at the 1% level for the 7-yeartreasury and at the 5% level for the 2-, 5-, and 10-year treasuries. These results arein line with the announcement both expressing economy slowdown concerns andsignaling the market to expect a lower interest rate; the US does not experiencedouble-digit inflation since the early 1980s, so, as expected, the crisis sentimentdoes not signal a higher future interest rate.

4.6. Robustness tests 73
Table 21 – Federal Reserve FOMC Minutes Crisis Index and Volatility
This table shows the regressions from Equation (4.6). Each column represents a treasury constant maturityinterest rate for 1-, 2-, 3-, 5-, 7-, 10-, 20-, and 30-Year after the release of the FOMC minutes. Eachregression is performed with the FOMC minutes crisis index. FOMC minutes are from March 18, 2004to April 10, 2019 that correspond to the FOMC meetings held between January 27-28, 2004 and March19-20, 2019; interest rates are from March 08, 2004 to April 18, 2019; except for the 30-year treasury thatis from February 9, 2006 to April 18, 2019. Robust standard errors in parentheses.
σDGS1 σDGS2 σDGS3 σDGS5 σDGS7 σDGS10 σDGS20 σDGS30
const 0.73*** 1.42*** 1.71*** 2.24*** 2.59*** 2.61*** 2.61*** 2.98***(0.05) (0.08) (0.09) (0.09) (0.10) (0.10) (0.08) (0.20)
Release 0.12 0.03 -0.01 0.04 -0.01 -0.05 -0.08 -0.19(0.15) (0.20) (0.20) (0.20) (0.20) (0.20) (0.17) (0.17)
V ol−5 0.69*** 0.62*** 0.60*** 0.55*** 0.50*** 0.47*** 0.46*** 0.37***(0.03) (0.02) (0.02) (0.02) (0.02) (0.02) (0.02) (0.04)
crisis 0.05 0.02 0.06 0.36 0.55** 0.68** 0.59** 0.63**(0.16) (0.23) (0.23) (0.22) (0.25) (0.28) (0.25) (0.30)
Adj.R2 0.4782 0.3809 0.3583 0.3012 0.2496 0.2262 0.2148 0.1825n 3785 3785 3785 3785 3785 3785 3785 3301
Table 21 shows the effect of the crisis index on volatility. We observe thecrisis index has a statistically significant effect on longer maturities. An increment(decline) in the crisis sentiment, predicts a increase (reduction) of the volatility.The effect is statistically significant for the 7-, 10-, 20-, and 30-year treasuries. Asexpected, an increment in the crisis sentiment signals concerns about the economicoutlook and increase in the volatility of markets.
4.6 Robustness tests
We test if our index provides relevant information to the market whenwe add relevant macroeconomic information to the model. We also compare thepredictability power of our index with indices created with the Correa, the Harvard-IV, and the Loughran-MacDonald dictionaries.
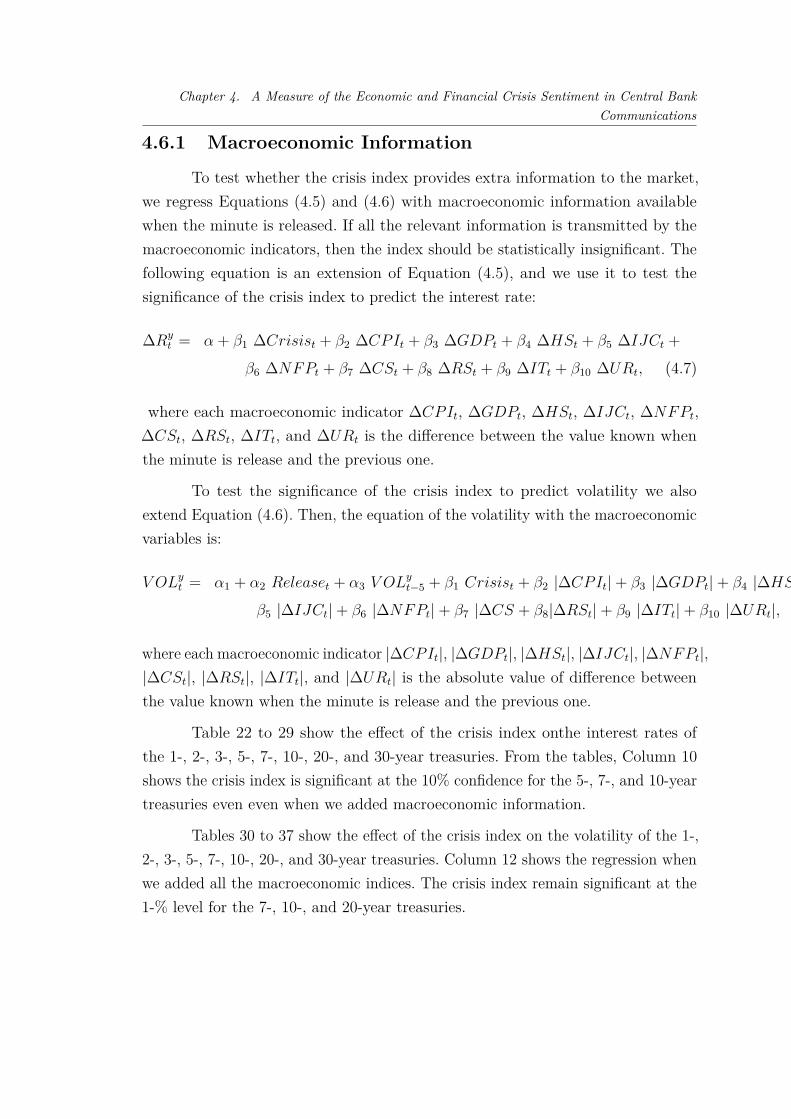
Chapter 4. A Measure of the Economic and Financial Crisis Sentiment in Central BankCommunications
4.6.1 Macroeconomic Information
To test whether the crisis index provides extra information to the market,we regress Equations (4.5) and (4.6) with macroeconomic information availablewhen the minute is released. If all the relevant information is transmitted by themacroeconomic indicators, then the index should be statistically insignificant. Thefollowing equation is an extension of Equation (4.5), and we use it to test thesignificance of the crisis index to predict the interest rate:
∆Ryt = α + β1 ∆Crisist + β2 ∆CPIt + β3 ∆GDPt + β4 ∆HSt + β5 ∆IJCt +
β6 ∆NFPt + β7 ∆CSt + β8 ∆RSt + β9 ∆ITt + β10 ∆URt, (4.7)
where each macroeconomic indicator ∆CPIt, ∆GDPt, ∆HSt, ∆IJCt, ∆NFPt,∆CSt, ∆RSt, ∆ITt, and ∆URt is the difference between the value known whenthe minute is release and the previous one.
To test the significance of the crisis index to predict volatility we alsoextend Equation (4.6). Then, the equation of the volatility with the macroeconomicvariables is:
V OLyt = α1 + α2 Releaset + α3 V OLy
t−5 + β1 Crisist + β2 |∆CPIt| + β3 |∆GDPt| + β4 |∆HSt| +
β5 |∆IJCt| + β6 |∆NFPt| + β7 |∆CS + β8|∆RSt| + β9 |∆ITt| + β10 |∆URt|, (4.8)
where each macroeconomic indicator |∆CPIt|, |∆GDPt|, |∆HSt|, |∆IJCt|, |∆NFPt|,|∆CSt|, |∆RSt|, |∆ITt|, and |∆URt| is the absolute value of difference betweenthe value known when the minute is release and the previous one.
Table 22 to 29 show the effect of the crisis index onthe interest rates ofthe 1-, 2-, 3-, 5-, 7-, 10-, 20-, and 30-year treasuries. From the tables, Column 10shows the crisis index is significant at the 10% confidence for the 5-, 7-, and 10-yeartreasuries even even when we added macroeconomic information.
Tables 30 to 37 show the effect of the crisis index on the volatility of the 1-,2-, 3-, 5-, 7-, 10-, 20-, and 30-year treasuries. Column 12 shows the regression whenwe added all the macroeconomic indices. The crisis index remain significant at the1-% level for the 7-, 10-, and 20-year treasuries.

4.6. Robustness tests 75
Table 22 – Federal Reserve FOMC Minutes Crisis Index and 1-Year In-terest Rate (DGS1)
This table shows the regressions from Equation (4.6.1) of the 1-Year treasury constant maturity interestrate 1-day change (DGS1t − DGS1t−1) after the release of the FOMC minutes. FOMC minutes arefrom March 18, 2004 to April 10, 2019 that correspond to the FOMC meetings held between January27-28, 2004 and March 19-20, 2019; the interest rates DGS1 are from March 08, 2004 to April 18, 2019.The regression is performed over 10 models, nested by the FOMC minutes crisis index, and economicannouncements: Prices and Output, Housing Activity, Labor Market, Expectations and Trade. Robuststandard errors in parentheses.
(1) (2) (3) (4) (5) (6) (7) (8) (9) (10)
const -0.25 -0.26 -0.29 -0.32 -0.32 -0.31 -0.31 -0.32 -0.32 -0.33(0.33) (0.32) (0.33) (0.32) (0.32) (0.32) (0.31) (0.31) (0.31) (0.31)
FOMC Minutescrisis -0.30 -0.24 -0.19 -0.12 -0.10 -0.10 -0.16 -0.15 -0.14 -0.14
(0.34) (0.35) (0.33) (0.33) (0.33) (0.33) (0.35) (0.34) (0.35) (0.35)Economic AnnouncementsPrices and Output
CPI 0.46 0.48 0.44 0.44 0.45 0.44 0.41 0.41 0.41(0.36) (0.36) (0.34) (0.34) (0.34) (0.34) (0.32) (0.32) (0.31)
GDP -0.64 -0.70 -0.71 -0.72 -0.73 -0.72 -0.73 -0.73(0.72) (0.72) (0.71) (0.71) (0.69) (0.69) (0.69) (0.69)
Housing activity, Labor Market, Expectations and TradeHS 0.71*** 0.71*** 0.72*** 0.70*** 0.66*** 0.70*** 0.72***
(0.23) (0.23) (0.23) (0.24) (0.23) (0.24) (0.24)IJC 0.16 0.16 0.17 0.17 0.11 0.10
(0.21) (0.21) (0.21) (0.20) (0.21) (0.20)NFP 0.09 0.07 0.05 0.05 0.03
(0.24) (0.25) (0.24) (0.24) (0.24)CS 0.49 0.52 0.50 0.56
(0.39) (0.39) (0.40) (0.39)RS 0.28 0.27 0.27
(0.28) (0.29) (0.28)IT 0.23 0.20
(0.23) (0.24)UR -0.30
(0.25)
Adj.R2 -0.0028 0.0062 0.0170 0.0495 0.0429 0.0351 0.0436 0.0409 0.0366 0.0334n 121 121 121 121 121 121 121 121 121 121

Chapter 4. A Measure of the Economic and Financial Crisis Sentiment in Central BankCommunications
Table 23 – Federal Reserve FOMC Minutes Crisis Index and 2-Year In-terest Rate (DGS2)
This table shows the regressions from Equation (4.6.1) of the 2-Year treasury constant maturity interestrate 1-day change (DGS2t − DGS2t−1) after the release of the FOMC minutes. FOMC minutes arefrom March 18, 2004 to April 10, 2019 that correspond to the FOMC meetings held between January27-28, 2004 and March 19-20, 2019; the interest rates (DGS1) are from March 08, 2004 to April 18, 2019.The regression is performed over 10 models, nested by the FOMC minutes crisis index, and economicannouncements: Prices and Output, Housing Activity, Labor Market, Expectations and Trade. Robuststandard errors in parentheses.
(1) (2) (3) (4) (5) (6) (7) (8) (9) (10)
const -0.09 -0.10 -0.10 -0.13 -0.12 -0.11 -0.10 -0.13 -0.13 -0.16(0.40) (0.40) (0.40) (0.39) (0.39) (0.39) (0.38) (0.38) (0.38) (0.37)
FOMC Minutescrisis -0.91** -0.87** -0.88** -0.78* -0.73* -0.72* -0.77* -0.75* -0.74* -0.75*
(0.43) (0.44) (0.44) (0.43) (0.44) (0.44) (0.45) (0.43) (0.44) (0.44)Economic AnnouncementsPrices and Output
CPI 0.27 0.27 0.22 0.22 0.25 0.24 0.19 0.20 0.19(0.36) (0.36) (0.34) (0.34) (0.34) (0.34) (0.33) (0.32) (0.31)
GDP 0.04 -0.03 -0.07 -0.09 -0.09 -0.08 -0.10 -0.10(0.72) (0.72) (0.72) (0.72) (0.71) (0.69) (0.69) (0.70)
Housing activity, Labor Market, Expectations and TradeHS 0.85** 0.87** 0.88** 0.86** 0.79** 0.87** 0.92**
(0.37) (0.37) (0.36) (0.36) (0.37) (0.36) (0.37)IJC 0.44 0.43 0.44 0.44 0.32 0.31
(0.38) (0.39) (0.39) (0.38) (0.37) (0.35)NFP 0.27 0.26 0.21 0.22 0.18
(0.33) (0.34) (0.34) (0.33) (0.33)CS 0.40 0.44 0.41 0.54
(0.45) (0.45) (0.44) (0.44)RS 0.53 0.51 0.50
(0.36) (0.38) (0.36)IT 0.46 0.40
(0.37) (0.36)UR -0.61*
(0.37)
Adj.R2 0.0250 0.0208 0.0125 0.0431 0.0433 0.0387 0.0376 0.0425 0.0457 0.0525n 121 121 121 121 121 121 121 121 121 121

4.6. Robustness tests 77
Table 24 – Federal Reserve FOMC Minutes Crisis Index and 3-Year In-terest Rate (DGS3)
This table shows the regressions from Equation (4.6.1) of the 3-Year treasury constant maturity interestrate 1-day change (DGS3t − DGS3t−1) after the release of the FOMC minutes. FOMC minutes arefrom March 18, 2004 to April 10, 2019 that correspond to the FOMC meetings held between January27-28, 2004 and March 19-20, 2019; the interest rates (DGS1) are from March 08, 2004 to April 18, 2019.The regression is performed over 10 models, nested by the FOMC minutes crisis index, and economicannouncements: Prices and Output, Housing Activity, Labor Market, Expectations and Trade. Standarderrors in parentheses.
(1) (2) (3) (4) (5) (6) (7) (8) (9) (10)
const 0.16 0.15 0.17 0.12 0.12 0.13 0.14 0.11 0.09 0.07(0.46) (0.46) (0.46) (0.44) (0.44) (0.44) (0.44) (0.44) (0.43) (0.43)
FOMC minutescrisis -0.87* -0.82 -0.84* -0.70 -0.66 -0.65 -0.71 -0.68 -0.67 -0.67
(0.49) (0.50) (0.50) (0.50) (0.50) (0.50) (0.52) (0.50) (0.51) (0.52)Economic AnnouncementsPrices and Output
CPI 0.40 0.39 0.31 0.30 0.32 0.31 0.26 0.26 0.25(0.43) (0.44) (0.40) (0.40) (0.41) (0.41) (0.39) (0.38) (0.37)
GDP 0.32 0.22 0.17 0.17 0.16 0.17 0.14 0.14(0.77) (0.77) (0.76) (0.77) (0.76) (0.75) (0.76) (0.77)
Housing activity, Labor Market, Expectations and TradeHS 1.34*** 1.35*** 1.36*** 1.35*** 1.26*** 1.40*** 1.45***
(0.39) (0.39) (0.39) (0.39) (0.40) (0.40) (0.40)IJC 0.40 0.40 0.41 0.40 0.20 0.19
(0.38) (0.38) (0.38) (0.38) (0.37) (0.36)NFP 0.16 0.15 0.09 0.11 0.06
(0.40) (0.41) (0.41) (0.39) (0.39)CS 0.41 0.46 0.41 0.53
(0.55) (0.54) (0.52) (0.53)RS 0.62 0.59 0.58
(0.39) (0.42) (0.41)IT 0.79* 0.74*
(0.43) (0.43)UR -0.59
(0.43)
Adj.R2 0.0153 0.0138 0.0079 0.0760 0.0736 0.0665 0.0645 0.0709 0.0901 0.0935n 121 121 121 121 121 121 121 121 121 121

Chapter 4. A Measure of the Economic and Financial Crisis Sentiment in Central BankCommunications
Table 25 – Federal Reserve FOMC Minutes Crisis Index and 5-Year In-terest Rate (DGS5)
This table shows the regressions from Equation (4.6.1) of the 5-Year treasury constant maturity interestrate 1-day change (DGS5t − DGS5t−1) after the release of the FOMC minutes. FOMC minutes arefrom March 18, 2004 to April 10, 2019 that correspond to the FOMC meetings held between January27-28, 2004 and March 19-20, 2019; the interest rates (DGS1) are from March 08, 2004 to April 18, 2019.The regression is performed over 10 models, nested by the FOMC minutes crisis index, and economicannouncements: Prices and Output, Housing Activity, Labor Market, Expectations and Trade. Robuststandard errors in parentheses.
(1) (2) (3) (4) (5) (6) (7) (8) (9) (10)
const 0.16 0.15 0.17 0.12 0.12 0.13 0.14 0.11 0.09 0.07(0.46) (0.45) (0.45) (0.43) (0.43) (0.43) (0.43) (0.42) (0.41) (0.41)
FOMC Minutescrisis -1.37** -1.30** -1.33** -1.17** -1.14** -1.14** -1.19** -1.15** -1.14** -1.15**
(0.56) (0.57) (0.56) (0.55) (0.56) (0.55) (0.56) (0.53) (0.54) (0.55)Economic AnnouncementsPrices and Output
CPI 0.50 0.48 0.39 0.39 0.39 0.38 0.31 0.31 0.30(0.59) (0.60) (0.55) (0.55) (0.56) (0.57) (0.51) (0.50) (0.48)
GDP 0.56 0.44 0.41 0.41 0.40 0.42 0.39 0.40(0.79) (0.78) (0.76) (0.76) (0.76) (0.74) (0.75) (0.75)
Housing activity, Labor Market, Expectations and TradeHS 1.57*** 1.58*** 1.58*** 1.56*** 1.45*** 1.57*** 1.63***
(0.41) (0.41) (0.41) (0.41) (0.40) (0.42) (0.42)IJC 0.24 0.24 0.25 0.24 0.06 0.05
(0.43) (0.43) (0.42) (0.41) (0.41) (0.40)NFP 0.01 -0.00 -0.07 -0.06 -0.11
(0.43) (0.44) (0.43) (0.42) (0.41)CS 0.40 0.47 0.42 0.57
(0.58) (0.55) (0.54) (0.53)RS 0.81* 0.78 0.77
(0.47) (0.49) (0.47)IT 0.69 0.62
(0.45) (0.44)UR -0.72
(0.46)
Adj.R2 0.0387 0.0390 0.0369 0.1120 0.1058 0.0980 0.0947 0.1067 0.1150 0.1206n 121 121 121 121 121 121 121 121 121 121

4.6. Robustness tests 79
Table 26 – Federal Reserve FOMC Minutes Crisis Index and 7-Year In-terest Rate (DGS7)
This table shows the regressions from Equation (4.6.1) of the 7-Year treasury constant maturity interestrate 1-day change (DGS7t − DGS7t−1) after the release of the FOMC minutes. FOMC minutes arefrom March 18, 2004 to April 10, 2019 that correspond to the FOMC meetings held between January27-28, 2004 and March 19-20, 2019; the interest rates DGS7 are from March 08, 2004 to April 18, 2019.The regression is performed over 10 models, nested by the FOMC minutes crisis index, and economicannouncements: Prices and Output, Housing Activity, Labor Market, Expectations and Trade. Robuststandard errors in parentheses.
(1) (2) (3) (4) (5) (6) (7) (8) (9) (10)
const 0.31 0.30 0.32 0.26 0.26 0.26 0.26 0.23 0.21 0.19(0.50) (0.50) (0.50) (0.47) (0.47) (0.47) (0.47) (0.47) (0.46) (0.46)
FOMC Minutescrisis -1.35*** -1.28** -1.31** -1.14** -1.14** -1.14** -1.20** -1.16** -1.15** -1.16**
(0.52) (0.52) (0.52) (0.51) (0.51) (0.52) (0.52) (0.49) (0.51) (0.51)Economic AnnouncementsPrices and Output
CPI 0.51 0.50 0.40 0.40 0.39 0.38 0.31 0.31 0.30(0.62) (0.63) (0.58) (0.58) (0.59) (0.60) (0.54) (0.53) (0.51)
GDP 0.48 0.35 0.34 0.35 0.34 0.36 0.33 0.34(0.72) (0.71) (0.70) (0.70) (0.69) (0.67) (0.68) (0.68)
Housing activity, Labor Market, Expectations and TradeHS 1.59*** 1.59*** 1.58*** 1.56*** 1.45*** 1.55*** 1.60***
(0.40) (0.40) (0.40) (0.39) (0.39) (0.40) (0.41)IJC 0.06 0.06 0.07 0.07 -0.08 -0.09
(0.42) (0.42) (0.41) (0.41) (0.42) (0.42)NFP -0.11 -0.13 -0.20 -0.19 -0.24
(0.42) (0.43) (0.42) (0.41) (0.40)CS 0.47 0.54 0.50 0.63
(0.57) (0.54) (0.53) (0.53)RS 0.85* 0.82* 0.81*
(0.44) (0.45) (0.43)IT 0.58 0.52
(0.44) (0.43)UR -0.61
(0.46)
Adj.R2 0.0390 0.0399 0.0363 0.1158 0.1082 0.1008 0.0995 0.1139 0.1180 0.1201n 121 121 121 121 121 121 121 121 121 121

Chapter 4. A Measure of the Economic and Financial Crisis Sentiment in Central BankCommunications
Table 27 – Federal Reserve FOMC Minutes Crisis Index and 10-Year In-terest Rate (DGS10)
This table shows the regressions from Equation (4.6.1) of the 10-Year treasury constant maturity interestrate 1-day change (DGS10t − DGS10t−1) after the release of the FOMC minutes. FOMC minutes arefrom March 18, 2004 to April 10, 2019 that correspond to the FOMC meetings held between January27-28, 2004 and March 19-20, 2019; the interest rates DGS10 are from March 08, 2004 to April 18, 2019.The regression is performed over 10 models, nested by the FOMC minutes crisis index, and economicannouncements: Prices and Output, Housing Activity, Labor Market, Expectations and Trade. Robuststandard errors in parentheses.
(1) (2) (3) (4) (5) (6) (7) (8) (9) (10)
const 0.56 0.54 0.57 0.52 0.52 0.51 0.51 0.48 0.47 0.44(0.46) (0.46) (0.46) (0.44) (0.44) (0.44) (0.44) (0.44) (0.44) (0.43)
FOMC Minutescrisis -1.09** -1.03** -1.06** -0.92** -0.92** -0.93** -0.98** -0.94** -0.93** -0.94**
(0.47) (0.47) (0.46) (0.46) (0.46) (0.46) (0.46) (0.44) (0.45) (0.45)Economic AnnouncementsPrices and Output
CPI 0.46 0.45 0.37 0.37 0.35 0.34 0.27 0.28 0.27(0.63) (0.64) (0.59) (0.59) (0.61) (0.62) (0.56) (0.56) (0.53)
GDP 0.51 0.40 0.41 0.42 0.41 0.42 0.41 0.41(0.59) (0.59) (0.58) (0.58) (0.57) (0.55) (0.56) (0.56)
Housing activity, Labor Market, Expectations and TradeHS 1.36*** 1.36*** 1.35*** 1.33*** 1.23*** 1.31*** 1.38***
(0.36) (0.35) (0.36) (0.35) (0.35) (0.36) (0.37)IJC -0.04 -0.04 -0.03 -0.03 -0.16 -0.17
(0.41) (0.41) (0.40) (0.40) (0.42) (0.41)NFP -0.19 -0.20 -0.27 -0.26 -0.32
(0.42) (0.42) (0.42) (0.41) (0.38)CS 0.35 0.41 0.38 0.54
(0.52) (0.50) (0.49) (0.48)RS 0.76* 0.74* 0.73*
(0.43) (0.44) (0.42)IT 0.46 0.39
(0.38) (0.37)UR -0.79*
(0.45)
Adj.R2 0.0285 0.0292 0.0272 0.0955 0.0877 0.0812 0.0774 0.0907 0.0917 0.1034n 121 121 121 121 121 121 121 121 121 121

4.6. Robustness tests 81
Table 28 – Federal Reserve FOMC Minutes Crisis Index and 20-Year In-terest Rate (DGS20)
This table shows the regressions from Equation (4.6.1) of the 20-Year treasury constant maturity interestrate 1-day change (DGS20t − DGS20t−1) after the release of the FOMC minutes. FOMC minutes arefrom March 18, 2004 to April 10, 2019 that correspond to the FOMC meetings held between January27-28, 2004 and March 19-20, 2019; the interest rates DGS20 are from March 08, 2004 to April 18, 2019.The regression is performed over 10 models, nested by the FOMC minutes crisis index, and economicannouncements: Prices and Output, Housing Activity, Labor Market, Expectations and Trade. Robuststandard errors in parentheses.
(1) (2) (3) (4) (5) (6) (7) (8) (9) (10)
const 0.74 0.72 0.76* 0.72* 0.72* 0.70 0.71 0.67 0.66 0.64(0.45) (0.45) (0.45) (0.43) (0.43) (0.43) (0.43) (0.43) (0.43) (0.42)
FOMC Minutescrisis -0.77* -0.68 -0.73* -0.60 -0.60 -0.61 -0.64 -0.61 -0.60 -0.60
(0.44) (0.44) (0.43) (0.44) (0.44) (0.44) (0.43) (0.43) (0.43) (0.43)Economic AnnouncementsPrices and Output
CPI 0.60 0.58 0.51 0.51 0.47 0.47 0.40 0.41 0.40(0.62) (0.64) (0.60) (0.60) (0.62) (0.62) (0.57) (0.57) (0.55)
GDP 0.66 0.57 0.57 0.58 0.57 0.58 0.57 0.57(0.51) (0.52) (0.52) (0.52) (0.51) (0.49) (0.50) (0.50)
Housing activity, Labor Market, Expectations and TradeHS 1.22*** 1.22*** 1.20*** 1.19*** 1.09*** 1.16*** 1.22***
(0.35) (0.35) (0.34) (0.34) (0.33) (0.34) (0.35)IJC 0.01 0.01 0.01 0.01 -0.10 -0.11
(0.40) (0.40) (0.39) (0.38) (0.40) (0.39)NFP -0.26 -0.27 -0.33 -0.33 -0.37
(0.42) (0.43) (0.42) (0.41) (0.39)CS 0.27 0.33 0.31 0.43
(0.49) (0.47) (0.47) (0.46)RS 0.74* 0.72* 0.71*
(0.43) (0.43) (0.41)IT 0.43 0.37
(0.37) (0.36)UR -0.62
(0.46)
Adj.R2 0.0108 0.0181 0.0208 0.0775 0.0695 0.0642 0.0588 0.0720 0.0721 0.0767n 121 121 121 121 121 121 121 121 121 121

Chapter 4. A Measure of the Economic and Financial Crisis Sentiment in Central BankCommunications
Table 29 – Federal Reserve FOMC Minutes Crisis Index and 30-Year In-terest Rate (DGS30)
This table shows the regressions from Equation (4.6.1) of the 30-Year treasury constant maturityinterest rate 1-day change (DGS30t − DGS30t−1) after the release of the FOMC minutes. FOMCminutes are from March 18, 2004 to April 10, 2019 that correspond to the FOMC meetings heldbetween January 27-28, 2004 and March 19-20, 2019; the interest rates DGS30 are from February21, 2006 to April 18, 2019. The regression is performed over 10 models, nested by the FOMCminutes crisis index, and economic announcements: Prices and Output, Housing Activity, LaborMarket, Expectations and Trade. Robust standard errors in parentheses.
(1) (2) (3) (4) (5) (6) (7) (8) (9) (10)
const 0.78 0.82* 0.85* 0.82* 0.81* 0.81* 0.84* 0.87* 0.87* 0.84*(0.48) (0.47) (0.47) (0.46) (0.46) (0.46) (0.47) (0.47) (0.46) (0.46)
FOMC Minutescrisis -0.73 -0.64 -0.68 -0.62 -0.60 -0.61 -0.64 -0.58 -0.58 -0.58
(0.45) (0.46) (0.46) (0.46) (0.45) (0.46) (0.45) (0.45) (0.45) (0.46)Economic AnnouncementsPrices and Output
CPI 0.75 0.75 0.73 0.73 0.74 0.76 0.70 0.72 0.71(0.87) (0.88) (0.85) (0.85) (0.86) (0.85) (0.78) (0.78) (0.74)
GDP 0.50 0.44 0.41 0.42 0.40 0.44 0.41 0.46(0.53) (0.56) (0.55) (0.55) (0.54) (0.52) (0.54) (0.54)
Housing activity, Labor Market, Expectations and TradeHS 0.93** 0.94** 0.93** 0.92** 0.81** 0.91** 0.99**
(0.42) (0.42) (0.43) (0.42) (0.41) (0.44) (0.44)IJC 0.20 0.20 0.19 0.14 0.04 0.02
(0.43) (0.42) (0.42) (0.42) (0.45) (0.44)NFP -0.21 -0.23 -0.30 -0.25 -0.25
(0.53) (0.53) (0.53) (0.50) (0.48)CS 0.33 0.46 0.41 0.59
(0.58) (0.55) (0.55) (0.56)RS 0.72 0.68 0.66
(0.48) (0.47) (0.44)IT 0.45 0.37
(0.40) (0.39)UR -0.81
(0.51)
Adj.R2 0.0096 0.0209 0.0174 0.0335 0.0252 0.0170 0.0110 0.0198 0.0191 0.0333n 106 106 106 106 106 106 106 106 106 106

4.6. Robustness tests 83
Table 30 – Federal Reserve FOMC Minutes Crisis Index and 1-Year In-terest Rate Volatility (σDGS1)
This table shows the regressions from Equation (4.8) of the 1-Year treasury constant maturity interestrate volatility (σDGS1) of the next 5-days after the release of the FOMC minutes. FOMC minutes arefrom March 18, 2004 to April 10, 2019 that correspond to the FOMC meetings held between January27-28, 2004 and March 19-20, 2019; the interest rates DGS1 used for the volatility calculations σDGS1 arefrom March 08, 2004 to April 18, 2019. The regression is performed over 12 models, nested by the FOMCminutes crisis index, and economic announcements: Prices and Output, Housing Activity, Labor Market,Expectations and Trade. Robust standard errors in parentheses.
(1) (2) (3) (4) (5) (6) (7) (8) (9) (10) (11) (12)
const 2.39*** 0.73*** 0.73*** 0.77*** 0.54*** 0.53*** 0.57*** 0.55*** 0.45*** 0.42*** 0.43*** 0.45***(0.04) (0.05) (0.05) (0.06) (0.05) (0.06) (0.06) (0.06) (0.08) (0.09) (0.10) (0.11)
Release 0.05 0.12 0.12 0.12 0.10 0.10 0.10 0.10 0.10 0.10 0.10 0.10(0.23) (0.15) (0.15) (0.15) (0.14) (0.14) (0.14) (0.14) (0.14) (0.14) (0.14) (0.14)
V ol−5 0.69*** 0.69*** 0.69*** 0.66*** 0.66*** 0.66*** 0.66*** 0.66*** 0.66*** 0.66*** 0.66***(0.03) (0.03) (0.03) (0.03) (0.03) (0.03) (0.03) (0.03) (0.03) (0.03) (0.03)
FOMC Minutescrisis 0.05 0.05 0.06 0.06 0.06 0.06 0.05 0.04 0.05 0.05
(0.16) (0.16) (0.15) (0.15) (0.15) (0.15) (0.15) (0.15) (0.15) (0.15)Economic AnnouncementsPrices and Output
CPI -0.05 -0.04 -0.04 -0.03 -0.03 -0.03 -0.03 -0.03 -0.03(0.05) (0.05) (0.05) (0.05) (0.05) (0.05) (0.05) (0.05) (0.05)
GDP 0.52*** 0.52*** 0.53*** 0.53*** 0.53*** 0.52*** 0.53*** 0.53***(0.08) (0.08) (0.08) (0.08) (0.08) (0.08) (0.08) (0.08)
Housing activity, Labor Market, Expectations and TradeHS 0.02 0.02 0.01 0.02 0.01 0.01 0.01
(0.04) (0.04) (0.04) (0.04) (0.04) (0.04) (0.04)IJC -0.08** -0.08** -0.09** -0.10** -0.09** -0.09**
(0.04) (0.04) (0.04) (0.04) (0.04) (0.04)NFP 0.03 0.02 0.02 0.02 0.02
(0.05) (0.05) (0.05) (0.04) (0.04)CS 0.16** 0.16** 0.16** 0.16**
(0.07) (0.06) (0.06) (0.06)RS 0.06 0.06 0.06
(0.05) (0.04) (0.05)IT -0.01 -0.01
(0.05) (0.05)UR -0.02
(0.05)
Adj.R2 -0.0003 0.4783 0.4782 0.4782 0.4878 0.4877 0.4879 0.4878 0.4889 0.4890 0.4889 0.4888n 3785 3785 3785 3785 3785 3785 3785 3785 3785 3785 3785 3785

Chapter 4. A Measure of the Economic and Financial Crisis Sentiment in Central BankCommunications
Table 31 – Federal Reserve FOMC Minutes Crisis Index and 2-Year In-terest Rate Volatility (σDGS2)
This table shows the regressions of the 2-Year treasury constant maturity rate volatility (σDGS2) after theFederal Reserve FOMC minutes from Equation (4.8). FOMC minutes are from March 18, 2004 to April10, 2019 that correspond to the FOMC meetings held between January 27-28, 2004 and March 19-20,2019; the interest rates DGS2 used for the volatility calculations σDGS2 are from March 08, 2004 to April18, 2019. The regression is performed over 12 models, nested by the FOMC minutes crisis index, andeconomic announcements: Prices and Output, Housing Activity, Labor Market, Expectations and Trade.Robust standard errors in parentheses.
(1) (2) (3) (4) (5) (6) (7) (8) (9) (10) (11) (12)
const 3.72*** 1.42*** 1.42*** 1.41*** 1.16*** 1.14*** 1.11*** 1.01*** 0.98*** 0.93*** 0.88*** 0.86***(0.05) (0.08) (0.08) (0.09) (0.08) (0.09) (0.09) (0.10) (0.11) (0.11) (0.12) (0.13)
Release -0.03 0.03 0.03 0.03 -0.00 -0.00 -0.00 -0.01 -0.01 -0.01 -0.01 -0.01(0.24) (0.20) (0.20) (0.20) (0.19) (0.19) (0.19) (0.19) (0.19) (0.19) (0.19) (0.19)
V ol−5 0.62*** 0.62*** 0.62*** 0.58*** 0.58*** 0.58*** 0.58*** 0.58*** 0.57*** 0.57*** 0.57***(0.02) (0.02) (0.02) (0.02) (0.02) (0.02) (0.02) (0.02) (0.02) (0.02) (0.02)
FOMC Minutescrisis 0.02 0.02 0.03 0.04 0.04 0.05 0.05 0.05 0.04 0.04
(0.23) (0.23) (0.22) (0.22) (0.22) (0.22) (0.22) (0.22) (0.22) (0.22)Economic AnnouncementsPrices and Output
CPI 0.01 0.03 0.03 0.02 0.01 0.01 0.01 0.02 0.02(0.06) (0.06) (0.06) (0.07) (0.07) (0.07) (0.07) (0.07) (0.07)
GDP 0.67*** 0.67*** 0.67*** 0.67*** 0.67*** 0.65*** 0.64*** 0.64***(0.09) (0.09) (0.09) (0.09) (0.09) (0.09) (0.09) (0.09)
Housing activity, Labor Market, Expectations and TradeHS 0.03 0.03 0.02 0.02 0.01 0.02 0.02
(0.05) (0.05) (0.05) (0.05) (0.05) (0.05) (0.05)IJC 0.04 0.04 0.04 0.02 0.01 0.00
(0.05) (0.05) (0.05) (0.05) (0.05) (0.05)NFP 0.16** 0.16** 0.16** 0.15** 0.15**
(0.06) (0.06) (0.06) (0.06) (0.06)CS 0.05 0.04 0.02 0.02
(0.07) (0.07) (0.07) (0.07)RS 0.15*** 0.15** 0.15**
(0.06) (0.06) (0.06)IT 0.10* 0.10*
(0.06) (0.06)UR 0.02
(0.05)
Adj.R2 -0.0003 0.3811 0.3809 0.3808 0.3944 0.3943 0.3943 0.3952 0.3952 0.3962 0.3966 0.3965n 3785 3785 3785 3785 3785 3785 3785 3785 3785 3785 3785 3785
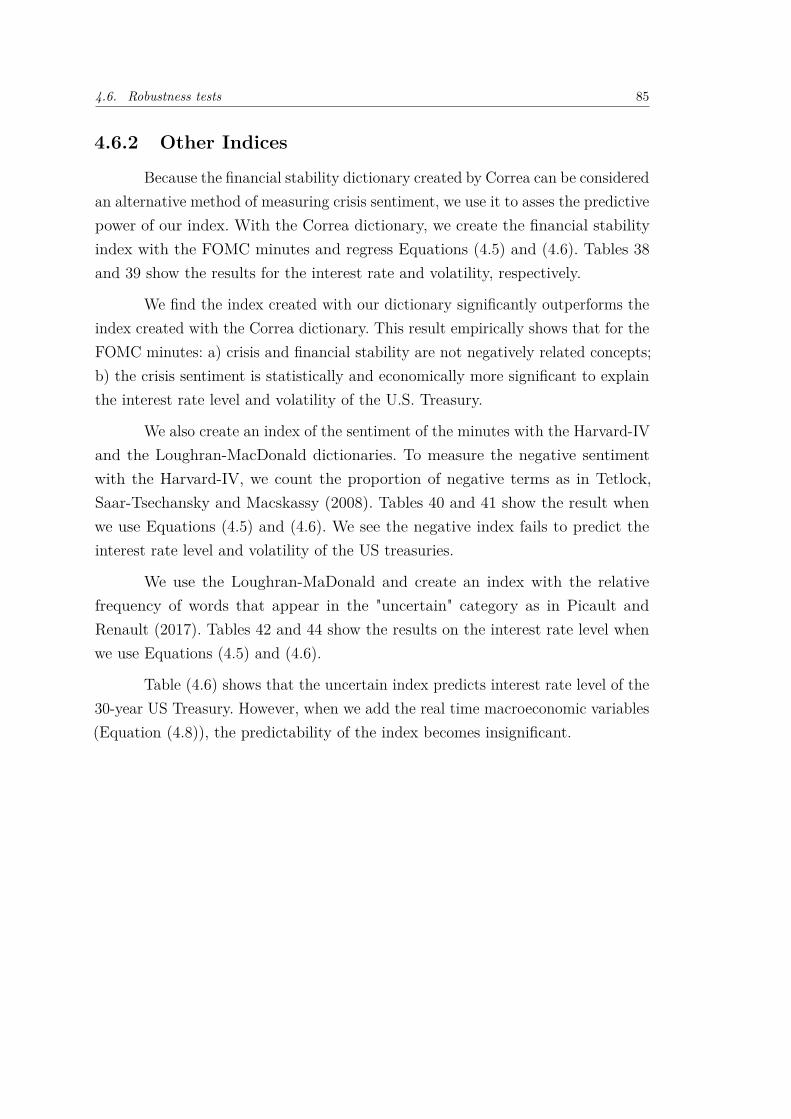
4.6. Robustness tests 85
4.6.2 Other Indices
Because the financial stability dictionary created by Correa can be consideredan alternative method of measuring crisis sentiment, we use it to asses the predictivepower of our index. With the Correa dictionary, we create the financial stabilityindex with the FOMC minutes and regress Equations (4.5) and (4.6). Tables 38and 39 show the results for the interest rate and volatility, respectively.
We find the index created with our dictionary significantly outperforms theindex created with the Correa dictionary. This result empirically shows that for theFOMC minutes: a) crisis and financial stability are not negatively related concepts;b) the crisis sentiment is statistically and economically more significant to explainthe interest rate level and volatility of the U.S. Treasury.
We also create an index of the sentiment of the minutes with the Harvard-IVand the Loughran-MacDonald dictionaries. To measure the negative sentimentwith the Harvard-IV, we count the proportion of negative terms as in Tetlock,Saar-Tsechansky and Macskassy (2008). Tables 40 and 41 show the result whenwe use Equations (4.5) and (4.6). We see the negative index fails to predict theinterest rate level and volatility of the US treasuries.
We use the Loughran-MaDonald and create an index with the relativefrequency of words that appear in the "uncertain" category as in Picault andRenault (2017). Tables 42 and 44 show the results on the interest rate level whenwe use Equations (4.5) and (4.6).
Table (4.6) shows that the uncertain index predicts interest rate level of the30-year US Treasury. However, when we add the real time macroeconomic variables(Equation (4.8)), the predictability of the index becomes insignificant.

Chapter 4. A Measure of the Economic and Financial Crisis Sentiment in Central BankCommunications
4.7 Conclusion
We construct a central bank independent crisis dictionary with the aid of asupervised machine learning algorithm. Our machine learning approach reduces90% of the human supervision efforts. With the dictionary, we create a crisis indexthat measures the crisis sentiment of the FOMC minutes. We observe that duringthe 2007-2008 financial crisis, the crisis index reach up to 6% of the total numberof words. We also test the predictability power of the crisis index on the interestrate and volatility of the U.S.treasury constant maturities.
We find that an increment (decline) in the crisis sentiment predicts areduction (increase) of the interest rate for intermediate-term treasuries. We alsoshow that an increment (decline) in the crisis sentiment predicts an increase(reduction) in the volatility for long-term maturities. We also test the predictabilitypower of the indices created with the Correa, the Harvard-IV, and the Loughran-McDonald dictionaries. Our crisis index significantly outperforms these alternativeindices in predicting the interest rate and volatility of the U.S.treasury constantmaturities.

4.7. Conclusion 87
Table 32 – Federal Reserve FOMC Minutes Crisis Index and 3-Year In-terest Rate Volatility (σDGS3)
This table shows the regressions of the 3-Year treasury constant maturity rate volatility (σDGS3) after theFederal Reserve FOMC minutes from Equation (4.8). FOMC minutes are from March 18, 2004 to April10, 2019 that correspond to the FOMC meetings held between January 27-28, 2004 and March 19-20,2019; the interest rates DGS3 used for the volatility calculations σDGS3 are from March 08, 2004 to April18, 2019. The regression is performed over 12 models, nested by the FOMC minutes crisis index, andeconomic announcements: Prices and Output, Housing Activity, Labor Market, Expectations and Trade.Robust standard errors in parentheses.
(1) (2) (3) (4) (5) (6) (7) (8) (9) (10) (11) (12)
const 4.27*** 1.71*** 1.71*** 1.70*** 1.47*** 1.48*** 1.41*** 1.30*** 1.24*** 1.18*** 1.09*** 1.05***(0.05) (0.09) (0.09) (0.09) (0.09) (0.10) (0.10) (0.10) (0.12) (0.12) (0.12) (0.13)
Release -0.04 -0.01 -0.01 -0.01 -0.04 -0.04 -0.03 -0.04 -0.04 -0.04 -0.04 -0.04(0.24) (0.20) (0.20) (0.20) (0.19) (0.19) (0.19) (0.19) (0.19) (0.19) (0.19) (0.19)
V ol−5 0.60*** 0.60*** 0.60*** 0.57*** 0.57*** 0.56*** 0.56*** 0.56*** 0.55*** 0.55*** 0.55***(0.02) (0.02) (0.02) (0.02) (0.02) (0.02) (0.02) (0.02) (0.02) (0.02) (0.02)
FOMC Minutescrisis 0.06 0.06 0.07 0.07 0.08 0.09 0.08 0.08 0.07 0.06
(0.23) (0.23) (0.21) (0.22) (0.22) (0.22) (0.22) (0.22) (0.22) (0.22)Economic AnnouncementsPrices and Output
CPI 0.02 0.04 0.04 0.02 0.01 0.01 0.01 0.02 0.02(0.06) (0.06) (0.06) (0.06) (0.06) (0.06) (0.06) (0.06) (0.06)
GDP 0.63*** 0.63*** 0.63*** 0.63*** 0.64*** 0.61*** 0.58*** 0.59***(0.09) (0.09) (0.09) (0.09) (0.09) (0.09) (0.09) (0.09)
Housing activity, Labor Market, Expectations and TradeHS -0.01 -0.01 -0.03 -0.03 -0.04 -0.02 -0.01
(0.05) (0.05) (0.05) (0.05) (0.05) (0.05) (0.05)IJC 0.13*** 0.13** 0.12** 0.10** 0.08 0.08
(0.05) (0.05) (0.05) (0.05) (0.05) (0.05)NFP 0.18*** 0.18*** 0.18*** 0.16*** 0.17***
(0.06) (0.06) (0.06) (0.06) (0.06)CS 0.08 0.07 0.04 0.04
(0.07) (0.07) (0.07) (0.07)RS 0.19*** 0.19*** 0.19***
(0.06) (0.06) (0.06)IT 0.19*** 0.19***
(0.06) (0.06)UR 0.05
(0.05)
Adj.R2 -0.0003 0.3585 0.3583 0.3582 0.3704 0.3702 0.3709 0.3723 0.3724 0.3741 0.3760 0.3760n 3785 3785 3785 3785 3785 3785 3785 3785 3785 3785 3785 3785

Chapter 4. A Measure of the Economic and Financial Crisis Sentiment in Central BankCommunications
Table 33 – Federal Reserve FOMC Minutes Crisis Index and 5-Year In-terest Rate Volatility (σDGS5)
This table shows the regressions of the 5-Year treasury constant maturity rate volatility (σDGS5) after theFederal Reserve FOMC minutes from Equation (4.8). FOMC minutes are from March 18, 2004 to April10, 2019 that correspond to the FOMC meetings held between January 27-28, 2004 and March 19-20,2019; the interest rates DGS5 used for the volatility calculations σDGS5 are from March 08, 2004 to April18, 2019. The regression is performed over 12 models, nested by the FOMC minutes crisis index, andeconomic announcements: Prices and Output, Housing Activity, Labor Market, Expectations and Trade.Robust standard errors in parentheses.
(1) (2) (3) (4) (5) (6) (7) (8) (9) (10) (11) (12)
const 4.96*** 2.24*** 2.24*** 2.18*** 1.97*** 2.08*** 1.98*** 1.87*** 1.80*** 1.73*** 1.59*** 1.54***(0.05) (0.09) (0.09) (0.10) (0.11) (0.12) (0.12) (0.12) (0.13) (0.13) (0.13) (0.13)
Release -0.03 0.04 0.04 0.04 0.01 0.01 0.01 0.01 0.01 0.01 0.01 0.01(0.25) (0.21) (0.20) (0.20) (0.19) (0.20) (0.20) (0.20) (0.20) (0.19) (0.20) (0.20)
V ol−5 0.55*** 0.55*** 0.54*** 0.52*** 0.52*** 0.52*** 0.51*** 0.51*** 0.50*** 0.49*** 0.49***(0.02) (0.02) (0.02) (0.02) (0.02) (0.02) (0.02) (0.02) (0.02) (0.02) (0.02)
FOMC Minutescrisis 0.36 0.35 0.36* 0.33 0.34* 0.35* 0.34* 0.34 0.33 0.32
(0.22) (0.22) (0.20) (0.21) (0.21) (0.21) (0.21) (0.21) (0.21) (0.21)Economic AnnouncementsPrices and Output
CPI 0.10* 0.12** 0.13** 0.09 0.09 0.08 0.09 0.11* 0.11*(0.06) (0.06) (0.06) (0.06) (0.06) (0.06) (0.06) (0.06) (0.06)
GDP 0.57*** 0.59*** 0.58*** 0.59*** 0.59*** 0.56*** 0.51*** 0.51***(0.11) (0.11) (0.11) (0.10) (0.10) (0.11) (0.11) (0.11)
Housing activity, Labor Market, Expectations and TradeHS -0.14*** -0.14*** -0.16*** -0.16*** -0.17*** -0.14*** -0.13***
(0.05) (0.05) (0.05) (0.05) (0.05) (0.05) (0.05)IJC 0.20*** 0.20*** 0.19*** 0.17*** 0.12** 0.12**
(0.06) (0.06) (0.06) (0.06) (0.06) (0.06)NFP 0.17*** 0.17*** 0.17*** 0.13** 0.14**
(0.06) (0.06) (0.06) (0.06) (0.06)CS 0.12 0.10 0.05 0.05
(0.07) (0.07) (0.07) (0.07)RS 0.26*** 0.26*** 0.25***
(0.07) (0.07) (0.07)IT 0.35*** 0.35***
(0.06) (0.06)UR 0.07
(0.05)
Adj.R2 -0.0003 0.3009 0.3012 0.3017 0.3122 0.3132 0.3152 0.3163 0.3167 0.3199 0.3270 0.3271n 3785 3785 3785 3785 3785 3785 3785 3785 3785 3785 3785 3785

4.7. Conclusion 89
Table 34 – Federal Reserve FOMC Minutes Crisis Index and 7-Year In-terest Rate Volatility (σDGS7)
This table shows the regressions of the 7-Year treasury constant maturity rate volatility (σDGS7) after theFederal Reserve FOMC minutes from Equation (4.8). FOMC minutes are from March 18, 2004 to April10, 2019 that correspond to the FOMC meetings held between January 27-28, 2004 and March 19-20,2019; the interest rates DGS7 used for the volatility calculations σDGS7 are from March 08, 2004 to April18, 2019. The regression is performed over 12 models, nested by the FOMC minutes crisis index, andeconomic announcements: Prices and Output, Housing Activity, Labor Market, Expectations and Trade.Robust standard errors in parentheses.
(1) (2) (3) (4) (5) (6) (7) (8) (9) (10) (11) (12)
const 5.15*** 2.58*** 2.59*** 2.53*** 2.34*** 2.51*** 2.38*** 2.29*** 2.20*** 2.12*** 1.95*** 1.91***(0.04) (0.11) (0.10) (0.11) (0.13) (0.14) (0.14) (0.14) (0.14) (0.14) (0.14) (0.14)
Release -0.09 -0.01 -0.01 -0.01 -0.03 -0.04 -0.03 -0.04 -0.04 -0.04 -0.04 -0.04(0.25) (0.21) (0.20) (0.20) (0.20) (0.20) (0.20) (0.20) (0.20) (0.20) (0.20) (0.20)
V ol−5 0.50*** 0.50*** 0.49*** 0.48*** 0.47*** 0.47*** 0.47*** 0.46*** 0.45*** 0.42*** 0.42***(0.02) (0.02) (0.02) (0.02) (0.02) (0.02) (0.02) (0.02) (0.02) (0.02) (0.02)
FOMC Minutescrisis 0.55** 0.54** 0.55** 0.50** 0.52** 0.52** 0.51** 0.52** 0.50** 0.49**
(0.25) (0.25) (0.24) (0.24) (0.24) (0.24) (0.24) (0.24) (0.25) (0.24)Economic AnnouncementsPrices and Output
CPI 0.11* 0.12** 0.13** 0.09 0.08 0.08 0.09 0.11* 0.12*(0.06) (0.06) (0.06) (0.06) (0.06) (0.06) (0.06) (0.06) (0.06)
GDP 0.48*** 0.50*** 0.50*** 0.50*** 0.51*** 0.46*** 0.39*** 0.40***(0.11) (0.11) (0.11) (0.11) (0.11) (0.11) (0.11) (0.11)
Housing activity, Labor Market, Expectations and TradeHS -0.20*** -0.21*** -0.22*** -0.22*** -0.24*** -0.20*** -0.19***
(0.05) (0.05) (0.05) (0.05) (0.05) (0.05) (0.05)IJC 0.25*** 0.24*** 0.24*** 0.21*** 0.15*** 0.14**
(0.06) (0.06) (0.06) (0.06) (0.06) (0.06)NFP 0.16** 0.16** 0.16** 0.11* 0.12*
(0.06) (0.06) (0.06) (0.06) (0.06)CS 0.14** 0.13* 0.06 0.06
(0.07) (0.07) (0.07) (0.07)RS 0.34*** 0.34*** 0.34***
(0.07) (0.07) (0.07)IT 0.49*** 0.49***
(0.06) (0.06)UR 0.06
(0.05)
Adj.R2 -0.0002 0.2484 0.2496 0.2502 0.2580 0.2603 0.2635 0.2646 0.2654 0.2712 0.2854 0.2854n 3785 3785 3785 3785 3785 3785 3785 3785 3785 3785 3785 3785
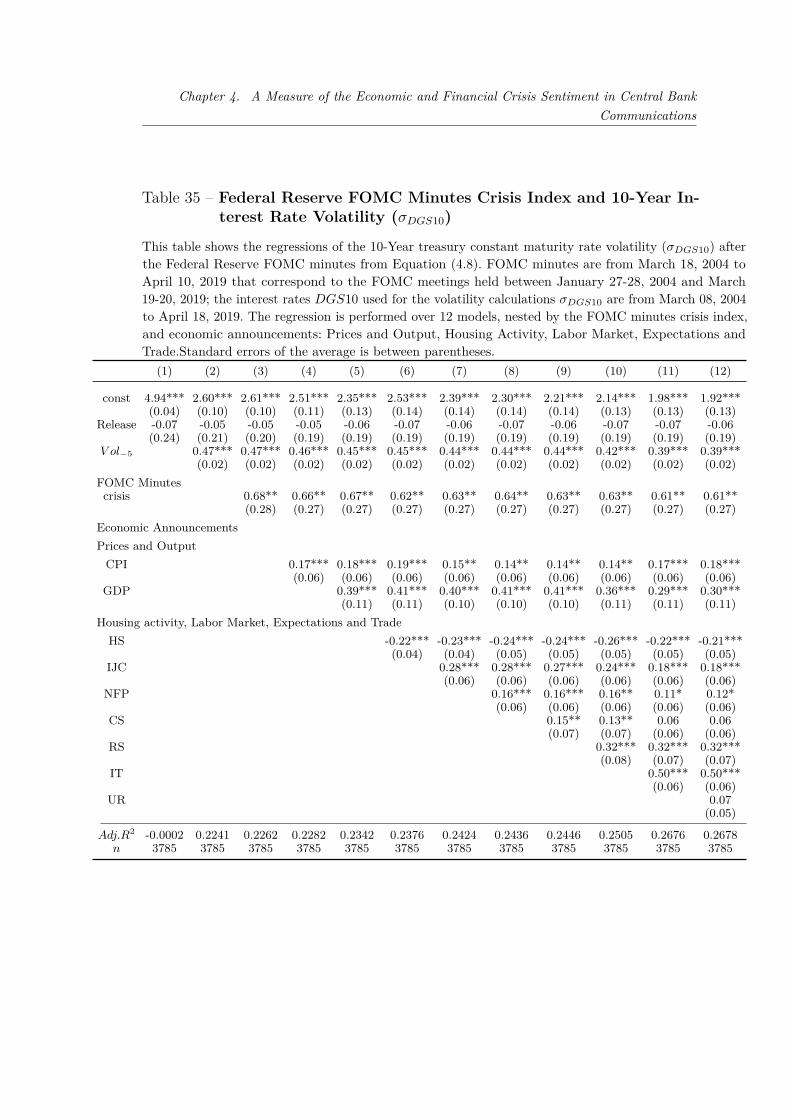
Chapter 4. A Measure of the Economic and Financial Crisis Sentiment in Central BankCommunications
Table 35 – Federal Reserve FOMC Minutes Crisis Index and 10-Year In-terest Rate Volatility (σDGS10)
This table shows the regressions of the 10-Year treasury constant maturity rate volatility (σDGS10) afterthe Federal Reserve FOMC minutes from Equation (4.8). FOMC minutes are from March 18, 2004 toApril 10, 2019 that correspond to the FOMC meetings held between January 27-28, 2004 and March19-20, 2019; the interest rates DGS10 used for the volatility calculations σDGS10 are from March 08, 2004to April 18, 2019. The regression is performed over 12 models, nested by the FOMC minutes crisis index,and economic announcements: Prices and Output, Housing Activity, Labor Market, Expectations andTrade.Standard errors of the average is between parentheses.
(1) (2) (3) (4) (5) (6) (7) (8) (9) (10) (11) (12)
const 4.94*** 2.60*** 2.61*** 2.51*** 2.35*** 2.53*** 2.39*** 2.30*** 2.21*** 2.14*** 1.98*** 1.92***(0.04) (0.10) (0.10) (0.11) (0.13) (0.14) (0.14) (0.14) (0.14) (0.13) (0.13) (0.13)
Release -0.07 -0.05 -0.05 -0.05 -0.06 -0.07 -0.06 -0.07 -0.06 -0.07 -0.07 -0.06(0.24) (0.21) (0.20) (0.19) (0.19) (0.19) (0.19) (0.19) (0.19) (0.19) (0.19) (0.19)
V ol−5 0.47*** 0.47*** 0.46*** 0.45*** 0.45*** 0.44*** 0.44*** 0.44*** 0.42*** 0.39*** 0.39***(0.02) (0.02) (0.02) (0.02) (0.02) (0.02) (0.02) (0.02) (0.02) (0.02) (0.02)
FOMC Minutescrisis 0.68** 0.66** 0.67** 0.62** 0.63** 0.64** 0.63** 0.63** 0.61** 0.61**
(0.28) (0.27) (0.27) (0.27) (0.27) (0.27) (0.27) (0.27) (0.27) (0.27)Economic AnnouncementsPrices and Output
CPI 0.17*** 0.18*** 0.19*** 0.15** 0.14** 0.14** 0.14** 0.17*** 0.18***(0.06) (0.06) (0.06) (0.06) (0.06) (0.06) (0.06) (0.06) (0.06)
GDP 0.39*** 0.41*** 0.40*** 0.41*** 0.41*** 0.36*** 0.29*** 0.30***(0.11) (0.11) (0.10) (0.10) (0.10) (0.11) (0.11) (0.11)
Housing activity, Labor Market, Expectations and TradeHS -0.22*** -0.23*** -0.24*** -0.24*** -0.26*** -0.22*** -0.21***
(0.04) (0.04) (0.05) (0.05) (0.05) (0.05) (0.05)IJC 0.28*** 0.28*** 0.27*** 0.24*** 0.18*** 0.18***
(0.06) (0.06) (0.06) (0.06) (0.06) (0.06)NFP 0.16*** 0.16*** 0.16** 0.11* 0.12*
(0.06) (0.06) (0.06) (0.06) (0.06)CS 0.15** 0.13** 0.06 0.06
(0.07) (0.07) (0.06) (0.06)RS 0.32*** 0.32*** 0.32***
(0.08) (0.07) (0.07)IT 0.50*** 0.50***
(0.06) (0.06)UR 0.07
(0.05)
Adj.R2 -0.0002 0.2241 0.2262 0.2282 0.2342 0.2376 0.2424 0.2436 0.2446 0.2505 0.2676 0.2678n 3785 3785 3785 3785 3785 3785 3785 3785 3785 3785 3785 3785
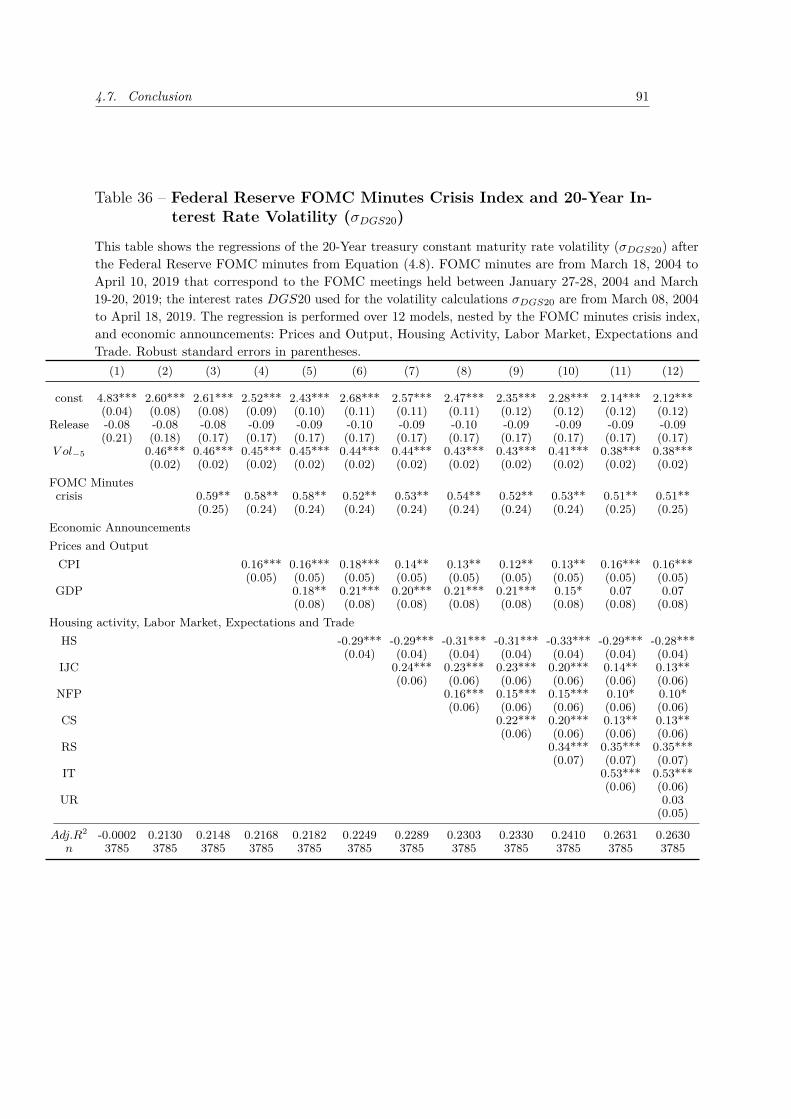
4.7. Conclusion 91
Table 36 – Federal Reserve FOMC Minutes Crisis Index and 20-Year In-terest Rate Volatility (σDGS20)
This table shows the regressions of the 20-Year treasury constant maturity rate volatility (σDGS20) afterthe Federal Reserve FOMC minutes from Equation (4.8). FOMC minutes are from March 18, 2004 toApril 10, 2019 that correspond to the FOMC meetings held between January 27-28, 2004 and March19-20, 2019; the interest rates DGS20 used for the volatility calculations σDGS20 are from March 08, 2004to April 18, 2019. The regression is performed over 12 models, nested by the FOMC minutes crisis index,and economic announcements: Prices and Output, Housing Activity, Labor Market, Expectations andTrade. Robust standard errors in parentheses.
(1) (2) (3) (4) (5) (6) (7) (8) (9) (10) (11) (12)
const 4.83*** 2.60*** 2.61*** 2.52*** 2.43*** 2.68*** 2.57*** 2.47*** 2.35*** 2.28*** 2.14*** 2.12***(0.04) (0.08) (0.08) (0.09) (0.10) (0.11) (0.11) (0.11) (0.12) (0.12) (0.12) (0.12)
Release -0.08 -0.08 -0.08 -0.09 -0.09 -0.10 -0.09 -0.10 -0.09 -0.09 -0.09 -0.09(0.21) (0.18) (0.17) (0.17) (0.17) (0.17) (0.17) (0.17) (0.17) (0.17) (0.17) (0.17)
V ol−5 0.46*** 0.46*** 0.45*** 0.45*** 0.44*** 0.44*** 0.43*** 0.43*** 0.41*** 0.38*** 0.38***(0.02) (0.02) (0.02) (0.02) (0.02) (0.02) (0.02) (0.02) (0.02) (0.02) (0.02)
FOMC Minutescrisis 0.59** 0.58** 0.58** 0.52** 0.53** 0.54** 0.52** 0.53** 0.51** 0.51**
(0.25) (0.24) (0.24) (0.24) (0.24) (0.24) (0.24) (0.24) (0.25) (0.25)Economic AnnouncementsPrices and Output
CPI 0.16*** 0.16*** 0.18*** 0.14** 0.13** 0.12** 0.13** 0.16*** 0.16***(0.05) (0.05) (0.05) (0.05) (0.05) (0.05) (0.05) (0.05) (0.05)
GDP 0.18** 0.21*** 0.20*** 0.21*** 0.21*** 0.15* 0.07 0.07(0.08) (0.08) (0.08) (0.08) (0.08) (0.08) (0.08) (0.08)
Housing activity, Labor Market, Expectations and TradeHS -0.29*** -0.29*** -0.31*** -0.31*** -0.33*** -0.29*** -0.28***
(0.04) (0.04) (0.04) (0.04) (0.04) (0.04) (0.04)IJC 0.24*** 0.23*** 0.23*** 0.20*** 0.14** 0.13**
(0.06) (0.06) (0.06) (0.06) (0.06) (0.06)NFP 0.16*** 0.15*** 0.15*** 0.10* 0.10*
(0.06) (0.06) (0.06) (0.06) (0.06)CS 0.22*** 0.20*** 0.13** 0.13**
(0.06) (0.06) (0.06) (0.06)RS 0.34*** 0.35*** 0.35***
(0.07) (0.07) (0.07)IT 0.53*** 0.53***
(0.06) (0.06)UR 0.03
(0.05)
Adj.R2 -0.0002 0.2130 0.2148 0.2168 0.2182 0.2249 0.2289 0.2303 0.2330 0.2410 0.2631 0.2630n 3785 3785 3785 3785 3785 3785 3785 3785 3785 3785 3785 3785

Chapter 4. A Measure of the Economic and Financial Crisis Sentiment in Central BankCommunications
Table 37 – Federal Reserve FOMC Minutes Crisis Index and 30-Year In-terest Rate Volatility (σDGS30)
This table shows the regressions of the 30-Year treasury constant maturity rate volatility (σDGS30) afterthe Federal Reserve FOMC minutes from Equation (4.8). FOMC minutes are from March 18, 2004 toApril 10, 2019 that correspond to the FOMC meetings held between January 27-28, 2004 and March19-20, 2019; the interest rates DGS30 used for the volatility calculations σDGS30 are from February 12,2006 to April 18, 2019. The regression is performed over 12 models, nested by the FOMC minutes crisisindex, and economic announcements: Prices and Output, Housing Activity, Labor Market, Expectationsand Trade. Robust standard errors in parentheses.
(1) (2) (3) (4) (5) (6) (7) (8) (9) (10) (11) (12)
const 4.77*** 2.97*** 2.98*** 2.81*** 2.74*** 3.07*** 2.89*** 2.72*** 2.51*** 2.44*** 2.32*** 2.33***(0.04) (0.20) (0.20) (0.19) (0.20) (0.23) (0.22) (0.21) (0.20) (0.21) (0.18) (0.18)
Release -0.11 -0.10 -0.19 -0.18 -0.19 -0.19 -0.20 -0.20 -0.18 -0.19 -0.18 -0.18(0.24) (0.20) (0.17) (0.17) (0.17) (0.17) (0.17) (0.17) (0.17) (0.17) (0.18) (0.18)
V ol−5 0.37*** 0.37*** 0.36*** 0.36*** 0.35*** 0.35*** 0.35*** 0.34*** 0.32*** 0.29*** 0.29***(0.04) (0.04) (0.04) (0.04) (0.04) (0.04) (0.04) (0.04) (0.04) (0.04) (0.04)
FOMC Minutescrisis 0.63** 0.58** 0.58** 0.51* 0.54* 0.53* 0.50* 0.50* 0.47 0.47
(0.30) (0.28) (0.28) (0.28) (0.28) (0.28) (0.28) (0.29) (0.29) (0.29)Economic AnnouncementsPrices and Output
CPI 0.33*** 0.34*** 0.31*** 0.28*** 0.28*** 0.29*** 0.29*** 0.32*** 0.32***(0.08) (0.08) (0.08) (0.08) (0.07) (0.08) (0.07) (0.07) (0.07)
GDP 0.16* 0.20** 0.18** 0.19** 0.21** 0.17** 0.05 0.05(0.08) (0.08) (0.08) (0.08) (0.08) (0.08) (0.08) (0.08)
Housing activity, Labor Market, Expectations and TradeHS -0.47*** -0.47*** -0.46*** -0.48*** -0.48*** -0.47*** -0.47***
(0.08) (0.08) (0.08) (0.08) (0.08) (0.07) (0.07)IJC 0.36*** 0.35*** 0.34*** 0.31*** 0.22*** 0.23***
(0.07) (0.07) (0.07) (0.07) (0.06) (0.06)NFP 0.24*** 0.24*** 0.23*** 0.12** 0.12**
(0.06) (0.06) (0.06) (0.06) (0.06)CS 0.34*** 0.32*** 0.23*** 0.23***
(0.07) (0.07) (0.07) (0.07)RS 0.32*** 0.30*** 0.30***
(0.08) (0.07) (0.07)IT 0.64*** 0.64***
(0.07) (0.07)UR -0.01
(0.05)
Adj.R2 -0.0002 0.1806 0.1825 0.1896 0.1905 0.2013 0.2097 0.2126 0.2191 0.2254 0.2576 0.2574n 3301 3301 3301 3301 3301 3301 3301 3301 3301 3301 3301 3301

4.7. Conclusion 93
Table 38 – Federal Reserve FOMC Minutes Financial Stability Index andInterest Rate
This table shows the regressions from Equation (4.5). Each column represents a treasury constantmaturity interest rate for 1-, 2-, 3-, 5-, 7-, 10-, 20-, and 30-Year after the release of the FOMCminutes. The regression is performed with the FOMC minutes financial stability index. FOMCminutes are from March 18, 2004 to April 10, 2019 that correspond to the FOMC meetings heldbetween January 27-28, 2004 and March 19-20, 2019; interest rates are from March 08, 2004 toApril 18, 2019; except for the 30-year treasury that is from February 9, 2006 to April 18, 2019.Robust standard errors in parentheses.
DGS1 DGS2 DGS3 DGS5 DGS7 DGS10 DGS20 DGS30const -0.25 -0.10 0.15 0.22 0.29 0.54 0.73 0.78
(0.33) (0.41) (0.46) (0.51) (0.51) (0.47) (0.45) (0.49)fin. stab. 0.23 -0.43 -0.72 -1.03 -0.99 -0.75 -0.47 -0.46
(0.34) (0.62) (0.67) (0.81) (0.76) (0.68) (0.64) (0.70)Adj.R2 -0.0063 -0.0037 0.0018 0.0085 0.0075 0.0024 -0.0038 -0.0052
n 121 121 121 121 121 121 121 106
Table 39 – Federal Reserve FOMC Minutes Financial Stability Index andVolatility
This table shows the regressions from Equation (4.6). Each column represents a treasury constantmaturity interest rate for 1-, 2-, 3-, 5-, 7-, 10-, 20-, and 30-Year after the release of the FOMCminutes. FOMC minutes are from March 18, 2004 to April 10, 2019 that correspond to the FOMCmeetings held between January 27-28, 2004 and March 19-20, 2019; interest rates are from March08, 2004 to April 18, 2019; except for the 30-year treasury that is from February 9, 2006 to April18, 2019. Robust standard errors in parentheses.
σDGS1 σDGS2 σDGS3 σDGS5 σDGS7 σDGS10 σDGS20 σDGS30
const 0.73*** 1.42*** 1.71*** 2.24*** 2.59*** 2.61*** 2.61*** 2.98***(0.05) (0.08) (0.09) (0.09) (0.10) (0.10) (0.08) (0.20)
ann 0.12 0.03 -0.01 0.04 -0.01 -0.05 -0.08 -0.19(0.15) (0.20) (0.20) (0.20) (0.21) (0.20) (0.18) (0.16)
vollag 0.69*** 0.62*** 0.60*** 0.55*** 0.50*** 0.47*** 0.46*** 0.37***(0.03) (0.02) (0.02) (0.02) (0.02) (0.02) (0.02) (0.04)
crisis 0.09 -0.03 0.01 0.31 0.44 0.54 0.43 0.45(0.16) (0.30) (0.29) (0.26) (0.29) (0.33) (0.28) (0.39)
Adj.R2 0.4782 0.3809 0.3583 0.3011 0.2491 0.2253 0.2139 0.1812n 3785 3785 3785 3785 3785 3785 3785 3301
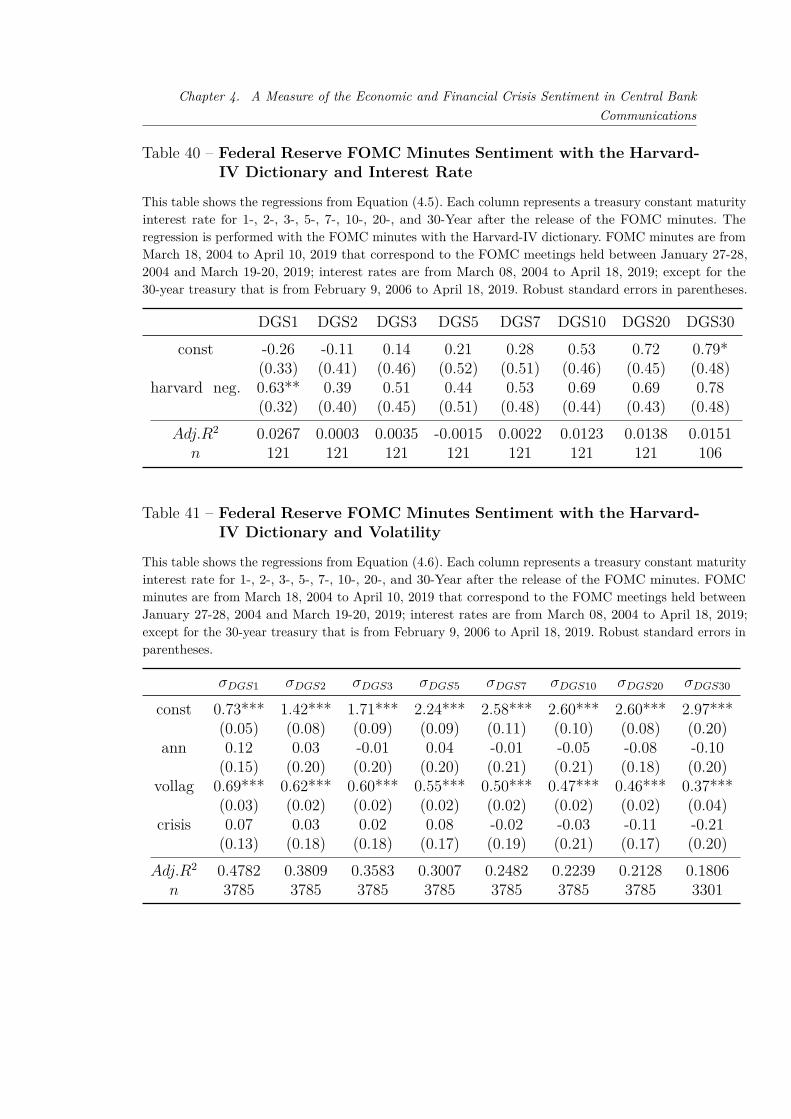
Chapter 4. A Measure of the Economic and Financial Crisis Sentiment in Central BankCommunications
Table 40 – Federal Reserve FOMC Minutes Sentiment with the Harvard-IV Dictionary and Interest Rate
This table shows the regressions from Equation (4.5). Each column represents a treasury constant maturityinterest rate for 1-, 2-, 3-, 5-, 7-, 10-, 20-, and 30-Year after the release of the FOMC minutes. Theregression is performed with the FOMC minutes with the Harvard-IV dictionary. FOMC minutes are fromMarch 18, 2004 to April 10, 2019 that correspond to the FOMC meetings held between January 27-28,2004 and March 19-20, 2019; interest rates are from March 08, 2004 to April 18, 2019; except for the30-year treasury that is from February 9, 2006 to April 18, 2019. Robust standard errors in parentheses.
DGS1 DGS2 DGS3 DGS5 DGS7 DGS10 DGS20 DGS30const -0.26 -0.11 0.14 0.21 0.28 0.53 0.72 0.79*
(0.33) (0.41) (0.46) (0.52) (0.51) (0.46) (0.45) (0.48)harvard neg. 0.63** 0.39 0.51 0.44 0.53 0.69 0.69 0.78
(0.32) (0.40) (0.45) (0.51) (0.48) (0.44) (0.43) (0.48)Adj.R2 0.0267 0.0003 0.0035 -0.0015 0.0022 0.0123 0.0138 0.0151
n 121 121 121 121 121 121 121 106
Table 41 – Federal Reserve FOMC Minutes Sentiment with the Harvard-IV Dictionary and Volatility
This table shows the regressions from Equation (4.6). Each column represents a treasury constant maturityinterest rate for 1-, 2-, 3-, 5-, 7-, 10-, 20-, and 30-Year after the release of the FOMC minutes. FOMCminutes are from March 18, 2004 to April 10, 2019 that correspond to the FOMC meetings held betweenJanuary 27-28, 2004 and March 19-20, 2019; interest rates are from March 08, 2004 to April 18, 2019;except for the 30-year treasury that is from February 9, 2006 to April 18, 2019. Robust standard errors inparentheses.
σDGS1 σDGS2 σDGS3 σDGS5 σDGS7 σDGS10 σDGS20 σDGS30
const 0.73*** 1.42*** 1.71*** 2.24*** 2.58*** 2.60*** 2.60*** 2.97***(0.05) (0.08) (0.09) (0.09) (0.11) (0.10) (0.08) (0.20)
ann 0.12 0.03 -0.01 0.04 -0.01 -0.05 -0.08 -0.10(0.15) (0.20) (0.20) (0.20) (0.21) (0.21) (0.18) (0.20)
vollag 0.69*** 0.62*** 0.60*** 0.55*** 0.50*** 0.47*** 0.46*** 0.37***(0.03) (0.02) (0.02) (0.02) (0.02) (0.02) (0.02) (0.04)
crisis 0.07 0.03 0.02 0.08 -0.02 -0.03 -0.11 -0.21(0.13) (0.18) (0.18) (0.17) (0.19) (0.21) (0.17) (0.20)
Adj.R2 0.4782 0.3809 0.3583 0.3007 0.2482 0.2239 0.2128 0.1806n 3785 3785 3785 3785 3785 3785 3785 3301

4.7. Conclusion 95
Table 42 – Federal Reserve FOMC Minutes Sentiment with theLoughran-MacDonald Dictionary and Interest Rate
This table shows the regressions from Equation (4.5). Each column represents a treasury constant maturityinterest rate for 1-, 2-, 3-, 5-, 7-, 10-, 20-, and 30-Year after the release of the FOMC minutes. Theregression is performed with the FOMC minutes with the Harvard-IV dictionary. FOMC minutes are fromMarch 18, 2004 to April 10, 2019 that correspond to the FOMC meetings held between January 27-28,2004 and March 19-20, 2019; interest rates are from March 08, 2004 to April 18, 2019; except for the30-year treasury that is from February 9, 2006 to April 18, 2019. Robust standard errors in parentheses.
DGS1 DGS2 DGS3 DGS5 DGS7 DGS10 DGS20 DGS30const -0.25 -0.11 0.14 0.21 0.28 0.54 0.73 0.77
(0.33) (0.41) (0.46) (0.52) (0.51) (0.47) (0.45) (0.48)crisis 0.19 0.12 -0.00 0.02 0.09 0.11 0.01 0.13
(0.28) (0.34) (0.38) (0.42) (0.41) (0.38) (0.36) (0.43)Adj.R2 -0.0045 -0.0075 -0.0084 -0.0084 -0.0081 -0.0078 -0.0084 -0.0088
n 121 121 121 121 121 121 121 106
Table 43 – Volatility
Table 44 – Federal Reserve FOMC Minutes Sentiment with theLoughran-McDonald Dictionary and Volatility
This table shows the regressions from Equation (4.6). Each column represents a treasury constant maturityinterest rate for 1-, 2-, 3-, 5-, 7-, 10-, 20-, and 30-Year after the release of the FOMC minutes. FOMCminutes are from March 18, 2004 to April 10, 2019 that correspond to the FOMC meetings held betweenJanuary 27-28, 2004 and March 19-20, 2019; interest rates are from March 08, 2004 to April 18, 2019;except for the 30-year treasury that is from February 9, 2006 to April 18, 2019. Robust standard errors inparentheses.
σDGS1 σDGS2 σDGS3 σDGS5 σDGS7 σDGS10 σDGS20 σDGS30
const 0.73*** 1.42*** 1.71*** 2.24*** 2.59*** 2.60*** 2.60*** 2.98***(0.05) (0.08) (0.09) (0.09) (0.10) (0.10) (0.08) (0.20)
ann 0.12 0.03 -0.01 0.04 -0.01 -0.05 -0.08 -0.10(0.15) (0.20) (0.20) (0.20) (0.21) (0.20) (0.18) (0.20)
vollag 0.69*** 0.62*** 0.60*** 0.55*** 0.50*** 0.47*** 0.46*** 0.37***(0.03) (0.02) (0.02) (0.02) (0.02) (0.02) (0.02) (0.04)
crisis 0.09 -0.08 0.01 -0.27 -0.36* -0.37* -0.25 -0.48**(0.14) (0.18) (0.16) (0.17) (0.19) (0.20) (0.17) (0.21)
Adj.R2 0.4782 0.3809 0.3583 0.3010 0.2488 0.2246 0.2131 0.1815n 3785 3785 3785 3785 3785 3785 3785 3301

Chapter 4. A Measure of the Economic and Financial Crisis Sentiment in Central BankCommunications
Table 45 – Federal Reserve FOMC Minutes the Loughran-McDonald Dic-tionary and 30-Year Interest Rate (DGS30)
This table shows the regressions from Equation (4.6.1) of the 30-Year treasury constant maturity interestrate 1-day change (DGS30t − DGS30t−1) after the release of the FOMC minutes. FOMC minutes arefrom March 18, 2004 to April 10, 2019 that correspond to the FOMC meetings held between January27-28, 2004 and March 19-20, 2019; the interest rates DGS30 are from February 21, 2006 to April 18,2019. The regression is performed over 10 models, nested by the FOMC minutes crisis index, and economicannouncements: Prices and Output, Housing Activity, Labor Market, Expectations and Trade. Robuststandard errors in parentheses.
(1) (2) (3) (4) (5) (6) (7) (8) (9) (10) (11) (12)
const 4.77*** 2.97*** 2.98*** 2.80*** 2.73*** 3.07*** 2.89*** 2.72*** 2.51*** 2.45*** 2.32*** 2.33***(0.04) (0.20) (0.20) (0.19) (0.20) (0.23) (0.22) (0.21) (0.20) (0.21) (0.18) (0.18)
ann -0.11 -0.10 -0.10 -0.10 -0.11 -0.12 -0.12 -0.12 -0.12 -0.12 -0.11 -0.12(0.24) (0.20) (0.20) (0.19) (0.19) (0.19) (0.20) (0.20) (0.19) (0.19) (0.20) (0.20)
vollag 0.37*** 0.37*** 0.36*** 0.36*** 0.35*** 0.35*** 0.35*** 0.34*** 0.32*** 0.29*** 0.29***(0.04) (0.04) (0.04) (0.04) (0.04) (0.04) (0.04) (0.04) (0.04) (0.04) (0.04)
FOMC Minutescrisis -0.48** -0.48** -0.48** -0.51*** -0.46** -0.44** -0.46** -0.43** -0.37* -0.37*
(0.21) (0.19) (0.19) (0.20) (0.20) (0.20) (0.21) (0.20) (0.21) (0.21)Economic AnnouncementsPrices and Output
CPI 0.34*** 0.34*** 0.32*** 0.28*** 0.28*** 0.29*** 0.30*** 0.32*** 0.32***(0.08) (0.08) (0.08) (0.08) (0.08) (0.08) (0.07) (0.08) (0.08)
GDP 0.16** 0.20** 0.19** 0.19** 0.21*** 0.17** 0.05 0.05(0.08) (0.08) (0.08) (0.08) (0.08) (0.08) (0.08) (0.08)
Housing activity, Labor Market, Expectations and TradeHS -0.48*** -0.49*** -0.47*** -0.49*** -0.49*** -0.48*** -0.48***
(0.08) (0.08) (0.08) (0.08) (0.08) (0.07) (0.07)IJC 0.35*** 0.34*** 0.34*** 0.30*** 0.22*** 0.22***
(0.07) (0.07) (0.07) (0.07) (0.06) (0.06)NFP 0.23*** 0.23*** 0.23*** 0.12** 0.12**
(0.06) (0.06) (0.06) (0.06) (0.06)CS 0.35*** 0.32*** 0.24*** 0.24***
(0.07) (0.07) (0.07) (0.07)RS 0.31*** 0.30*** 0.30***
(0.08) (0.07) (0.07)IT 0.64*** 0.64***
(0.07) (0.07)UR -0.01
(0.05)
Adj.R2 -0.0002 0.1806 0.1815 0.1890 0.1899 0.2012 0.2092 0.2120 0.2188 0.2250 0.2572 0.2569n 3301 3301 3301 3301 3301 3301 3301 3301 3301 3301 3301 3301

97
Bibliography
AMAYA, D.; FILBIEN, J.-Y. The similarity of ECB’s communication. FinanceResearch Letters, Elsevier BV, v. 13, p. 234–242, May 2015. Cited on page 49.
APEL, M.; GRIMALDI, M. The information content of central bank minutes.[S.l.], 2012. Cited 2 times on pages 61 and 63.
B3. One-day Interbank Deposit Futures | B3. 2019. Available: <http://www.b3.com.br/en_us/products-and-services/trading/interest-rates/one-day-interbank-deposit-futures.htm>. Cited on page 22.
BERNANKE, B. S. Fedspeak. At the Meetings of the American EconomicAssociation, San Diego, California: [s.n.], 2004. Available: <https://www.federalreserve.gov/boarddocs/speeches/2004/200401032/default.htm>. Cited onpage 20.
BLINDER, A. S. et al. Central Bank Communication and Monetary Policy: ASurvey of Theory and Evidence. Journal of Economic Literature, v. 46, n. 4, p.910–945, Dec. 2008. Cited 2 times on pages 20 and 60.
BOUKUS, E.; ROSENBERG, J. V. The information content of FOMC minutes.[S.l.], 2006. Cited on page 63.
CAMPBELL, J. R. et al. Macroeconomic Effects of Federal Reserve ForwardGuidance. Brookings Papers on Economic Activity, p. 60, 2012. Cited 2 times onpages 20 and 60.
CANNON, S. A. Sentiment of the FOMC: Unscripted. Federal Reserve Bank ofKansas City Economic Review, n. Fourth Quarter, p. 5–31, 2015. Cited on page49.
CARVALHO, C.; CORDEIRO, F.; VARGAS, J. Just words?: A quantitativeanalysis of the communication of the Central Bank of Brazil. Revista Brasileira deEconomia, v. 67, n. 4, p. 443–455, 2013. Cited 3 times on pages 22, 24, and 49.
CHAGUE, F. et al. Central Bank Communication Affects the Term-Structure ofInterest Rates. Revista Brasileira de Economia, v. 69, n. 2, 2015. Cited 4 times onpages 22, 25, 34, and 49.

Bibliography
COOKSON, J. A.; NIESSNER, M. Why don’t we agree? evidence from a socialnetwork of investors. The Journal of Finance, Wiley, v. 75, n. 1, p. 173–228, Nov.2019. Cited on page 49.
CORREA, R. et al. Constructing a dictionary for financial stability. IFDP Notes,v. 2017, n. 33, p. 1–7, Jun. 2017. Tex.publisher: Board of Governors of the FederalReserve System. Cited 2 times on pages 61 and 63.
ECB. Definition of price stability. 2019. Available: <https://www.ecb.europa.eu/mopo/strategy/pricestab/html/index.en.html>. Cited on page 21.
FAUST, J. et al. The high-frequency response of exchange rates and interest ratesto macroeconomic announcements. Journal of Monetary Economics, v. 54, n. 4, p.1051–1068, May 2007. ISSN 0304-3932. Cited on page 66.
FED, T. Why does the Federal Reserve aim for 2 percent inflation over time? 2015.Available: <https://www.federalreserve.gov/faqs/economy_14400.htm>. Citedon page 21.
FIA. FIA Releases Half-Year Data on Futures and Options Vol-ume Trends | FIA. 2018. Available: <https://fia.org/articles/fia-releases-half-year-data-futures-and-options-volume-trends>. Citedon page 22.
FILHO, A. E. C.; ROCHA, F. Como o mercado de juros futuros reage àcomunicação do Banco Central? Economia aplicada, v. 14, n. 3, p. 265–292, 2010.Cited on page 49.
GERAATS, P. M. Central Bank Transparency. The Economic Journal, v. 112,n. 483, p. F532–F565, 2002. ISSN 1468-0297. Cited on page 60.
HANSEN, S.; MCMAHON, M. Shocking language: Understanding themacroeconomic effects of central bank communication. Journal of InternationalEconomics, v. 99, p. S114–S133, Mar. 2016. Cited on page 22.
HANSEN, S.; MCMAHON, M.; PRAT, A. Transparency and Deliberation Withinthe FOMC: A Computational Linguistics Approach. The Quarterly Journal ofEconomics, v. 133, n. 2, p. 801–870, May 2018. Cited 2 times on pages 49 and 63.
LOUGHRAN, T.; MCDONALD, B. When is a liability not a liability? Textualanalysis, dictionaries, and 10-Ks. The Journal of Finance, v. 66, n. 1, p. 35–65,Jan. 2011. Tex.publisher: Wiley. Cited 5 times on pages 21, 22, 24, 62, and 63.

Bibliography 99
LUCCA, D.; TREBBI, F. Measuring central bank communication: An automatedapproach with application to FOMC statements. [S.l.], 2009. Cited 3 times onpages 22, 24, and 63.
MEYER, L. H. Inflation Targets and Inflation Targeting. At the University ofCalifornia at San Diego Economics Roundtable, San Diego, California: [s.n.], 2001.Cited on page 21.
MISHKIN, F. S. Can Central Bank Transparency Go Too Far? [S.l.], 2004. Citedon page 20.
MONTES, G. C.; SCARPARI, A. Does central bank communication affect bankrisk-taking? Applied Economics Letters, Informa UK Limited, v. 22, n. 9, p.751–758, Nov. 2014. Cited on page 49.
PICAULT, M.; RENAULT, T. Words are not all created equal: A new measureof ECB communication. Journal of International Money and Finance, v. 79, p.136–156, Dec. 2017. Tex.publisher: Elsevier BV. Cited 4 times on pages 22, 61, 63,and 85.
PORTER, M. F. An algorithm for suffix stripping. Emerald Group PublishingLimited, v. 14, n. 3, p. 130–137, 1980. Cited on page 51.
RYBINSKI, K. The forecasting power of the multi-language narrative of sell-sideresearch: A machine learning evaluation. Finance Research Letters, Elsevier BV,Aug. 2019. Cited on page 49.
SCHMELING, M.; WAGNER, C. Does Central Bank Tone Move Asset Prices?Rochester, NY, 2019. Cited 2 times on pages 22 and 63.
SHAPIRO, A. H.; SUDHOF, M.; WILSON, D. Measuring news sentiment. FederalReserve Bank of San Francisco, Working Paper Series, p. 01–22, Jan. 2017.Tex.publisher: Federal Reserve Bank of San Francisco. Cited on page 62.
SHAPIRO, A. H.; WILSON, D. J. Taking the fed at its word: A new approach toestimating central bank objectives using text analysis. Federal Reserve Bank ofSan Francisco, Working Paper Series, p. 01–74, Jun. 2019. Tex.publisher: FederalReserve Bank of San Francisco. Cited on page 63.
SHARPE, S. A.; SINHA, N. R.; HOLLRAH, C. What’s the Story? A NewPerspective on the Value of Economic Forecasts. Rochester, NY, 2017. Cited 3times on pages 22, 24, and 25.

Bibliography
TETLOCK, P. C. Giving content to investor sentiment: The role of media inthe stock market. The Journal of Finance, v. 62, n. 3, p. 1139–1168, May 2007.Tex.publisher: Wiley. Cited 4 times on pages 22, 24, 51, and 62.
TETLOCK, P. C.; SAAR-TSECHANSKY, M.; MACSKASSY, S. More thanwords: Quantifying language to measure firms’ fundamentals. The Journal ofFinance, v. 63, n. 3, p. 1437–1467, May 2008. ISSN 0022-1082. Cited on page 85.
VAYID, I. Central Bank Communications Before, During and After the Crisis:From Open-Market Operations to Open-Mouth Policy. [S.l.], 2013. Cited on page49.