measuring cat exposure in the energy space - energy ... › cas › sis12 › webprogram › handout...
TRANSCRIPT

Measuring Cat Exposure in the Energy Space Energy Transmission CatastrophesOCTOBER 4, 2012
Chris RamaruiSenior Vice President
Baltimore, MD
Session MAN-4

1GUY CARPENTER
Energy Transmission CatastrophesIntroduction
• Energy transmission and distribution can result in man-made catastrophes that are only now being fully recognized
• No doubt, some potential catastrophes are not yet contemplated
• Two types that have already demanded more appreciation:– Natural gas pipeline ruptures– Wildfires ignited by electrical power lines

Natural GasPipeline Ruptures

3GUY CARPENTER
Natural Gas – Pipeline Ruptures Pipeline Basics
• Energy transportation network of the United States consists of over 2.5 million miles of pipelines– 321,000 miles of onshore and offshore Gas Transmission and Gathering
pipelines– 2,066,000 miles of Gas Distribution mains and service pipelines
• Natural Gas Pipeline Systems: – Gathering systems gather raw natural gas from production wells– Transmission systems transport material thousands of miles across the
continental US– Distribution systems distribute natural gas to homes and businesses through
mains and service lines– Pipeline Size: usually 2 to 42 inches in diameter
(except for service lines which are ½ to 2 inches in diameter)
– Pipeline Material: cast iron, steel, copper and plastic
Pipeline & Hazardous Materials Safety Administration (PHMSA)

4GUY CARPENTER
Natural Gas – Pipeline Ruptures Map
Hart Energy

5GUY CARPENTER
• Reported incidents are for natural gas pipelines only during the years 1986 – March 2012 as provided by the PHMSA raw data
• Dollar Losses were adjusted for inflation by PHMSA
������������� ����� ��������� ������� ��������� � ���������
����������� �� �������� � ����������� ������������ ���������������������� �����
�������� � ����������� ��������������� ��������������� ������������������������ ����
����� ����� ������������ �������������� �������������� �������� ������������� ���
����� ��� !������� "�#���������� $� %&������� "� #�$ ��%&$'�������� ! �
Natural Gas – Pipeline Ruptures PHMSA Natural Gas Pipeline History

6GUY CARPENTER
Natural Gas – Pipeline Ruptures An Increasing Hazard
"Nationally, the number of major failures on high-pressure natural-gas pipelines climbed 50%climbed 50% in the last decade, while the number of miles of such pipe increased less than 5%,increased less than 5%, according to federal data.”
“Accidents caused by people inadvertently digging into pipelines have decreased 43%decreased 43% over that time; those caused by the failure of pipeline those caused by the failure of pipeline materials have nearly quadrupledmaterials have nearly quadrupled.“
According to US PHMSA "current models companies use are 'ineffective to analyze the risks' posed in a combination of threats" and the regulator is now stepping up pressure on companies to manage pipeline risks.
The Wall Street Journal

7GUY CARPENTER
Natural Gas – Pipeline Ruptures San Bruno Pipeline Rupture, 2010
• San Bruno explosion and fire - September 2010 – 30-inch diameter pipeline ruptured in a residential area 2 mi from SFO
Int’l Airport – Explosion created a crater approximately 72 feet long by 26 feet wide– Subsequent fire destroyed 37 homes and damaged 18 more– Eight people were killed, numerous individuals were injured, and many
more were evacuated from the area

8GUY CARPENTER
Natural Gas – Pipeline Ruptures February 9, 2011 – Allentown, PA
• 5 people killed and 8 homes were destroyed in explosion
• Cause was reported as 12” crack in 84 yr old cast iron main
• This occurred after warnings about replacing old cast iron gas mains– Warnings were in response to an explosion in 1990– From 1990 to 2006 there were four explosions from cast iron mains
owned by the same operating company that resulted in:- At least 2 people killed and many others injured- Multiple homes were also destroyed or damaged
• In 2012 the operating company was cited and fined for multiple safety violations such as failure to keep up appropriate facilities and failure to properly use safety tests weekly and follow emergency procedures.

9GUY CARPENTER
Natural Gas – Pipeline Ruptures Risk Quantification
• Report:– “A MODEL FOR SIZING HIGH CONSEQUENCE AREAS ASSOCIATED
WITH NATURAL GAS PIPELINES”– Performed by C-FER Technologies
- On behalf of the Gas Research Institute- October, 2000
– Purpose:- “To develop a simple and defendable approach to sizing the ground
area potentially affected by the failure of a high-pressure natural gas pipeline.”
• Hazard radius– Largest, highest-pressure pipelines: ~ 1,200 feet– Thermal only (not flash fire, conflagration, blast, projectiles, lateral jets,
wind, etc.)

10GUY CARPENTER
Natural Gas – Pipeline Ruptures Example – Residential Area near Large Pipelines
Three natural gas pipelines:
42”, 36”, 30”

11GUY CARPENTER
Natural Gas – Pipeline Ruptures Example – Commercial Area near Large Pipelines
Bing Maps
Two 30”Pipelines

12GUY CARPENTER
Natural Gas – Pipeline Ruptures Loss Potential
• Property losses
• Casualties
• Business interruption, supply chain interruption, additional living expenses
• Transportation, energy, communications damage and disruption
• Fire-fighting costs
• Liability?– Earthquake?– Terrorism?

ElectricityWildfire Liability

14GUY CARPENTER
Electricity – Wildfire LiabilityBackground
• Electrical power lines– Transmission– Distribution
• 1990’s growing concern:– Electromagnetic fields
- Health effects- Diminished property values- Still developing
• 2007 Southern California wildfires– Wildfires caused by power lines

15GUY CARPENTER
• On average, power lines cause about 2% of wildfires in California
• Varies by year and Santa Ana conditions
• In the Santa Monica Mountains, power lines sparked 8% of the fires since 1981
CAL FIRE
Electricity – Wildfire Liability California Wildfires Caused by Power Lines
16GUY CARPENTER
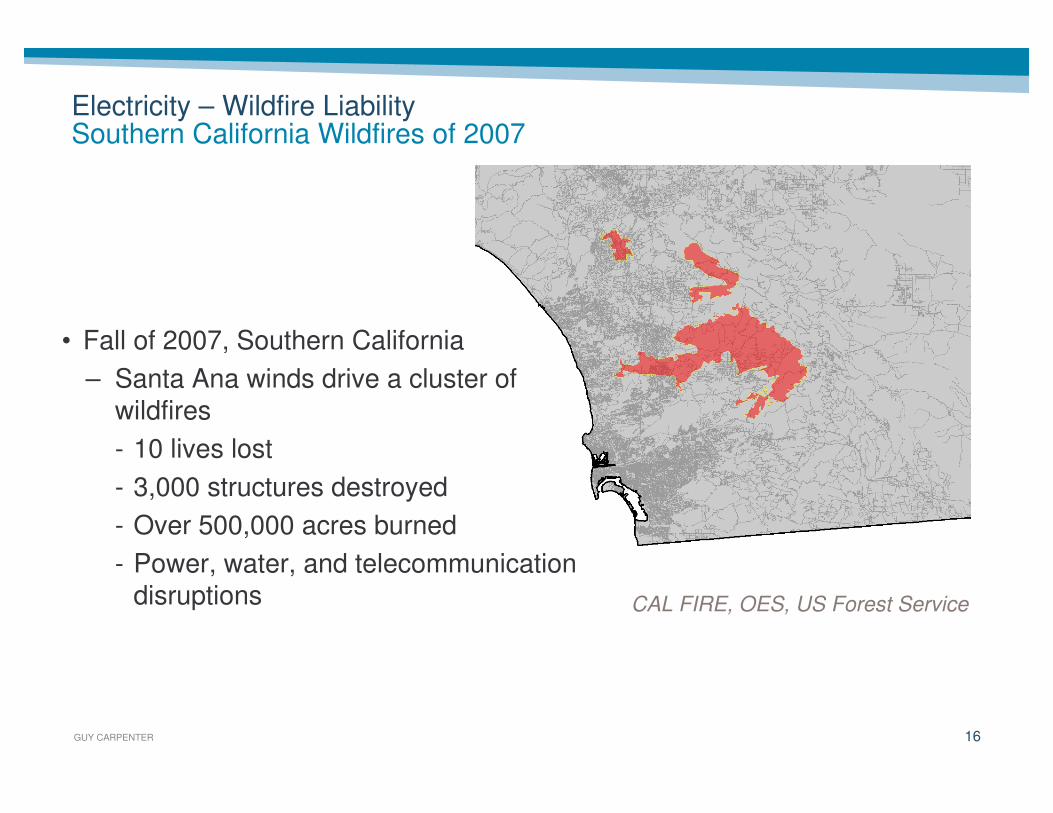
Electricity – Wildfire Liability Southern California Wildfires of 2007
• Fall of 2007, Southern California– Santa Ana winds drive a cluster of
wildfires- 10 lives lost- 3,000 structures destroyed- Over 500,000 acres burned- Power, water, and telecommunication
disruptions CAL FIRE, OES, US Forest Service

17GUY CARPENTER
Electricity – Wildfire Liability Conclusions
• Cal Fire and Public Utilities Commission determination:– SDG&E power lines caused three of the worst fires
- Witch Creek, Guejito, and Rice Canyon
• Claims ~ $1.5 billion
• Essentially strict liability?- $700 million settlement
• Effects on energy insurance and reinsurance– Reduced capacity – Increased premium– Wildfire liability now separate from general liability
U-T San Diego News 5/5/2009

18GUY CARPENTER
Other Energy RisksExamples
• Oil– Enbridge oil spill – July 2012
• Cyber risk– Saudi Aramco Oil computer virus attack – August 2012– RasGas in Qatar – August 2012– Catastrophe potential?
• Solar superstorm– National power grid could be out for a year– $2 trillion in losses– “Carrington event” of 1859
National Academy of Sciences (NAS)


20GUY CARPENTER
Disclaimer
The data and analysis provided by Guy Carpenter herein or in connection herewith are provided “as is”, without warranty of any kind whether express or implied. Neither Guy Carpenter, its affiliates nor their officers, directors, agents, modelers, or subcontractors (collectively, “Providers”) guarantee or warrant the correctness, completeness, currentness, merchantability, or fitness for a particular purpose of such data and analysis. In no event will any Provider be liable for loss of profits or any other indirect, special, incidental and/or consequential damage of any kind howsoever incurred or designated, arising from any use of the data and analysis provided herein or in connection herewith.