measuring attention: the test of attentional and interpersonal style...
TRANSCRIPT
MEASURING ATTENTION:
AN EVALUATION OF THE SEARCH AND CANCELLATION OF ASCENDING
NUMBERS (SCAN) AND THE SHORT FORM OF THE TEST OF ATTENTIONAL
AND INTERPERSONAL STYLE (TAIS)
Michael R. Greher, B.A.
Thesis Prepared for the Degree of
MASTER OF SCIENCE
UNIVERSITY OF NORTH TEXAS
May 2000
APPROVED:
Michael J. Mahoney, Major Professor and ChairRandall J. Cox, Committee MemberCraig S. Neumann, Committee MemberErnest H. Harrell, Chair of the Department of PsychologyC. Neal Tate, Dean of the Robert B. Toulouse School of
Graduate Studies
Greher, Michael R., Measuring attention: An evaluation of the Search and
Cancellation of Ascending Numbers (SCAN) and the short form of the Test of
Attentional and Interpersonal Style (TAIS). Master of Science (Psychology), May 2000,
97 pp., 14 tables, references, 42 titles.
This study found a relationship between the Search and Cancellation of
Ascending Numbers (SCAN), Digit Span, and Visual Search and Attention Test (VSAT).
Data suggest the measures represent a common construct interpreted to be attention. An
auditory distracter condition of the SCAN did not distract participants, while the measure
exhibited ample alternate forms reliability. The study also found that the Test of
Attentional and Interpersonal Style (TAIS) short form poorly predicted performance on
the Digit Span, VSAT, and SCAN. Although the TAIS exhibited good internal
consistency, the items likely measure the subjective perception of attention. Furthermore,
discriminant and convergent validity of the TAIS were found to be poor.

ii
Copyright 2000
by
Michael R. Greher

iii
ACKNOWLEDGMENTS
I have taken the opportunity to express my appreciation to the people who have
helped and supported me throughout the completion of this project. Most notably, I am
grateful to Michael J. Mahoney, Ph.D. for his invaluable knowledge, wisdom, and
guidance. I thank Craig Henderson for his time and patience while assisting me with
many of the statistical analyses of the present study. I am also indebted to Eric Dodson,
Sean McClintock, Alyson Mutchler, Lisa Rogers, and Josh Standridge, who devoted time
and effort to such tasks as collecting materials from the library, organizing measures for
use in the study, running experimental groups, scoring data, proofreading the manuscript,
and offering valuable suggestions. Finally, I am grateful to my parents, Marian and
Larry, and older brother David, whose love and encouragement over the years have
helped give me the confidence to believe in myself and follow my dreams.
iv
TABLE OF CONTENTS
PageLIST OF TABLES…………………………………………………………………. vi
Chapter
1. INTRODUCTION…………………….………………………………………. 1
OverviewA Conceptualization of AttentionA Brief History of Selective AttentionAttention in Sport PsychologyAttention, Depression, Anxiety, and AssessmentThree Behavioral Measures of AttentionOne Self-report Measure of AttentionThe Present StudyHypotheses
2. METHOD……….…………………………………………………………….. 15
ParticipantsMaterialsProcedure
3. RESULTS……. …………….………………………………………………… 30
Descriptive StatisticsPreliminary Data AnalysesHypothesis TestingExploratory Analyses
4. DISCUSSION……………………….………………………………………… 42
Summary and Integration of ResultsExplanations for FindingsIntegration of Findings With Past LiteratureImplications of FindingsLimitationsFuture Directions
v
APPENDICES……………………….…………………………………………….. 57
REFERENCES………………………………………………………………….…. 93
vi
LIST OF TABLES
Table Page
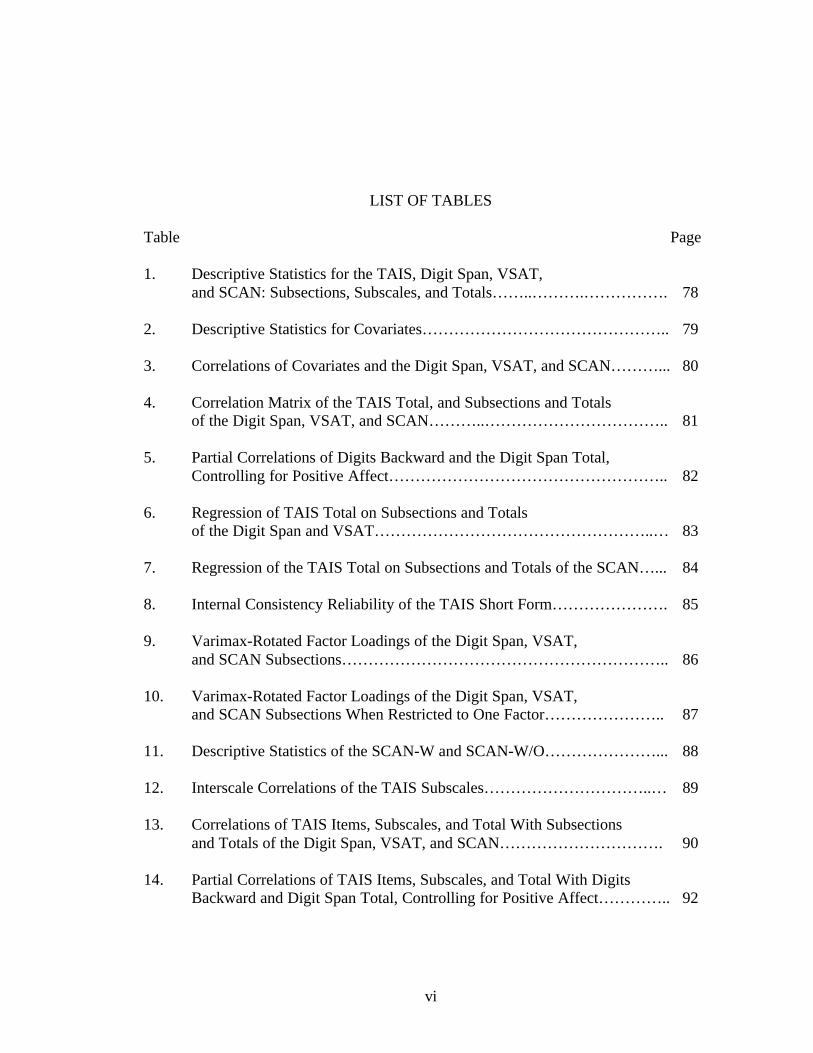
1. Descriptive Statistics for the TAIS, Digit Span, VSAT,and SCAN: Subsections, Subscales, and Totals……..……….……………. 78
2. Descriptive Statistics for Covariates……………………………………….. 79
3. Correlations of Covariates and the Digit Span, VSAT, and SCAN………... 80
4. Correlation Matrix of the TAIS Total, and Subsections and Totalsof the Digit Span, VSAT, and SCAN………..…………………………….. 81
5. Partial Correlations of Digits Backward and the Digit Span Total,Controlling for Positive Affect…………………………………………….. 82
6. Regression of TAIS Total on Subsections and Totalsof the Digit Span and VSAT……………………………………………..… 83
7. Regression of the TAIS Total on Subsections and Totals of the SCAN…... 84
8. Internal Consistency Reliability of the TAIS Short Form…………………. 85
9. Varimax-Rotated Factor Loadings of the Digit Span, VSAT,and SCAN Subsections…………………………………………………….. 86
10. Varimax-Rotated Factor Loadings of the Digit Span, VSAT,and SCAN Subsections When Restricted to One Factor………………….. 87
11. Descriptive Statistics of the SCAN-W and SCAN-W/O…………………... 88
12. Interscale Correlations of the TAIS Subscales…………………………..… 89
13. Correlations of TAIS Items, Subscales, and Total With Subsectionsand Totals of the Digit Span, VSAT, and SCAN…………………………. 90
14. Partial Correlations of TAIS Items, Subscales, and Total With DigitsBackward and Digit Span Total, Controlling for Positive Affect………….. 92
1
CHAPTER 1
INTRODUCTION
Overview
A primary function of cognition is the ability to concentrate and focus mental
effort, a process commonly referred to as “attention” (Best, 1995). Some research
suggests that self-report is an ineffective means of measuring attention (Reisberg &
McLean, 1985). Consequently, psychologists have looked to performance-oriented
methods in order to measure this construct. Validated performance measures of attention
are the Visual Search and Attention Test (VSAT) and the Digit Span task. A non-
validated performance measure of attention is the Search and Cancellation of Ascending
Numbers (SCAN). The present study attempted to determine how strongly the Digit
Span, VSAT and SCAN relate in order to more accurately determine whether or not the
SCAN is an effective means by which to measure attention. An auditory distracter was
included during the administration of one condition of the SCAN. Findings are of
interest to those involved in the assessment of attention for either clinical or research
purposes.
Along with behavioral measures, self-report measures have been developed in
order to attempt to assess attentional skills. One such measure is the Test of Attentional
and Interpersonal Style (TAIS; Nideffer, 1976a), which is most often used by sport
psychologists and athletic coaches for the assessment of professional and Olympic level
2
athletes. However, validity and reliability of the TAIS have not been well established.
Summers and Ford (1990) found that the TAIS lacks adequate factorial validity and
predictive validity. Consequently, the authors recommend against the use of the TAIS as
a measure of attention in either applied or research settings. As mentioned earlier, further
skepticism exists as self-report measures of attention have not been found to be highly
reliable sources of information (Reisberg & McLean, 1985). Consequently, researchers
suggest comparing self-report on measures such as the TAIS to performance on
behavioral measures (Moran, 1996). The present study attempted to determine how
accurately the short form of the TAIS (for which there have been no known reliability or
validity studies) predicts performance on the three previously mentioned behavioral
measures of attention. In addition, an analysis of internal consistency of the TAIS short
form items was performed. Findings are of particular interest to coaches and sport
psychologists who use the TAIS in their professional practices, and may be relevant to a
wide range of psychological services.
A valuable organization and review of the literature on the construct of attention
and attentional research has been offered by Moran (1996), who also outlined how sport
psychologists have conceptualized the role of attention in athletic performance. Moran
also reviews sport psychology and his work has been central to the present investigation.
A Conceptualization of Attention
As early as the turn of the century, psychological theorists noted the effort
necessary to maintain attention on that which has “caught the mental eye” (James, 1890).
William James pointed out though, that despite what he believed to be the apparent
3
importance of attention, the construct itself received little notice from theorists such as
Locke, Hume, Hartley, Mill, and Spencer in their attempts to understand and explain
intricacies of the human condition.
These writers are bent on showing how the higher faculties of the mind are pure
products of ‘experience;’ and experience is supposed to be of something simply
given. Attention, implying a degree of reactive spontaneity, would seem to break
through the circle of pure receptivity which constitutes ‘experience,’ and hence
must not be spoken of under penalty of interfering with the smoothness of the tale
(p. 402).
It would seem that James did not contest the central importance of “experience” in
psychology. Rather, he believed that a misunderstanding lay in the definition of the term
itself. Whereas others believed that attention had little to do with experience, James
argued that “experience is what I agree to attend to,” suggesting that attention is
incorporated in the process of gaining experience and acts as the very foundation on
which such experience is based. Therefore, according to James, the phenomenon of
attention is quintessential to human perception, requiring investigation and
understanding.
Only those items which I [attend to] shape my mind - without selective interest,
experience is an utter chaos. Interest alone gives accent and emphasis, light and
shade, background and foreground - intelligible perspective, in a word. It varies in
every creature, but without it the consciousness of every creature would be gray
chaotic indiscriminateness, impossible for us even to conceive (pp. 402-403).

4
Despite James’ argument that attention receive increased focus and understanding,
theorists and researchers in the field of psychology did not give the construct due
consideration until the middle of the twentieth century.
Although there is evidence that attention was of interest to some in the early
twentieth century (Parasuraman, 1984), substantial avoidance of the topic of attention
was facilitated by Watson and the strictness of the behaviorist movement. Early
behaviorists discounted theories of attention and proclaimed that such concepts were
mentalisitc and therefore inconsequential (Moran, 1996). It was not until strict
behaviorism began to wane in the 1950's that research on the topic came into focus.
Interestingly enough, an impetus to research on attention came from the military’s efforts
to improve performance of lookouts and radar operators during World War II
(Parasuraman, 1984). Over the course of the 1950's, information processing theories
were developed to explain attention, likening the mental processing of information to the
processing of data by a computer (Broadbent, 1958; Cherry, 1953).
Matlin (1994) explains that attention can be divided into two mental activities.
The first of these activities is the concept of “selective” attention. Best (1995) refers to
selective attention as our ability to selectively “shift the focus of mental effort from one
stimulus to another” (p. 36). Examples of such selective attention include the ability to
focus on a professor’s lecture, or someone giving driving directions over the phone.
Another primary example used to illustrate the function of selective attention is that of jet
pilots who are able to focus on the task of flying in the midst of a plethora of distracting
symbols and sounds (e.g. warning lights, radio transmissions, etc.; Moran, 1996).

5
Despite such distracters, pilots overcome these difficulties and data collected from one
study suggest that the ability to use selective attention is a significant predictor of pilots’
abilities to do so (Arthur, Strong, Jordan, Williamson, Shebilske, & Regian 1995).
Moran (1996) submits that the two primary functions of selective attention skills include
(a) the ability to focus a beam of selective attention on a particular source of stimulation,
and (b) the ability to divert one’s selective attention to relevant stimuli and away from
irrelevant stimuli.
Another aspect of attention that Matlin (1994) discusses in some detail is
“divided” attention. It is through use of this divided attention skill that humans are able
to simultaneously process information emanating from two or more separate sources of
stimulation. Commonly used examples of divided attention include the ability to hold a
conversation while driving a car, or read while listening to the radio (Eysenck & Keane,
1995). Although research suggests that we remain limited in terms of the degree to
which we can successfully use our divided attentional skills, research also suggests that
divided attention improves if the tasks involved are regularly practiced (Matlin; 1994).
Yet another aspect of attention referred to in the literature is a state of arousal,
“preparedness,” or vigilance, that facilitates particular attentiveness to one’s environment
(Matlin, 1994; Moran, 1996). An example of vigilance is the arousal experienced just
after avoiding an accident while driving. Similar to the conceptualization of
“preparedness” is the term “orienting,” which Posner (1980) described as attention to
sensory information or memory that relates to reflexes of the autonomic nervous system.
States of “preparedness” are often accompanied by physiological correlates, including

6
high heart rate and increased activity in the right cerebral hemisphere (Moran, 1996).
Preparedness is considered to be a transient state, unrelated to skills that allow for the
focus of prolonged attention (Moran, 1996).
A Brief History of Selective Attention
Selective attention is of particular interest in the present study. Within the
literature of this sub-topic of attention, two historical studies are commonly cited.
Broadbent (1958) examined selective attention by presenting a “dichotic listening task.”
The task involved presenting messages through a set of headphones. The information
coming out of the two headphone speakers was different, and participants were instructed
to attend to one message only and report what they heard (also referred to as a
“shadowing” task). Based on his findings, Broadbent suggested that participants filtered
the sensory information such that all-or-none of the information remained before
committing it to storage. Many considered this “filtering” process to be an effective
means by which to explain selective attention skills (Broadbent, 1954; cited in Treisman,
1960). However, further research suggested that Broadbent’s findings and filter theory
were inadequate.
Treisman (1960) conducted studies in which one message contained meaningful
content while the other contained random words, and the content of the two messages
presented was switched between the two headphones at some point during the
experimental task. Results indicated that many of the participants ignored their
instructions to shadow (or attend to) one ear in which the meaningful message was
played, and continued to shadow that meaningful message despite the switch. It was
7
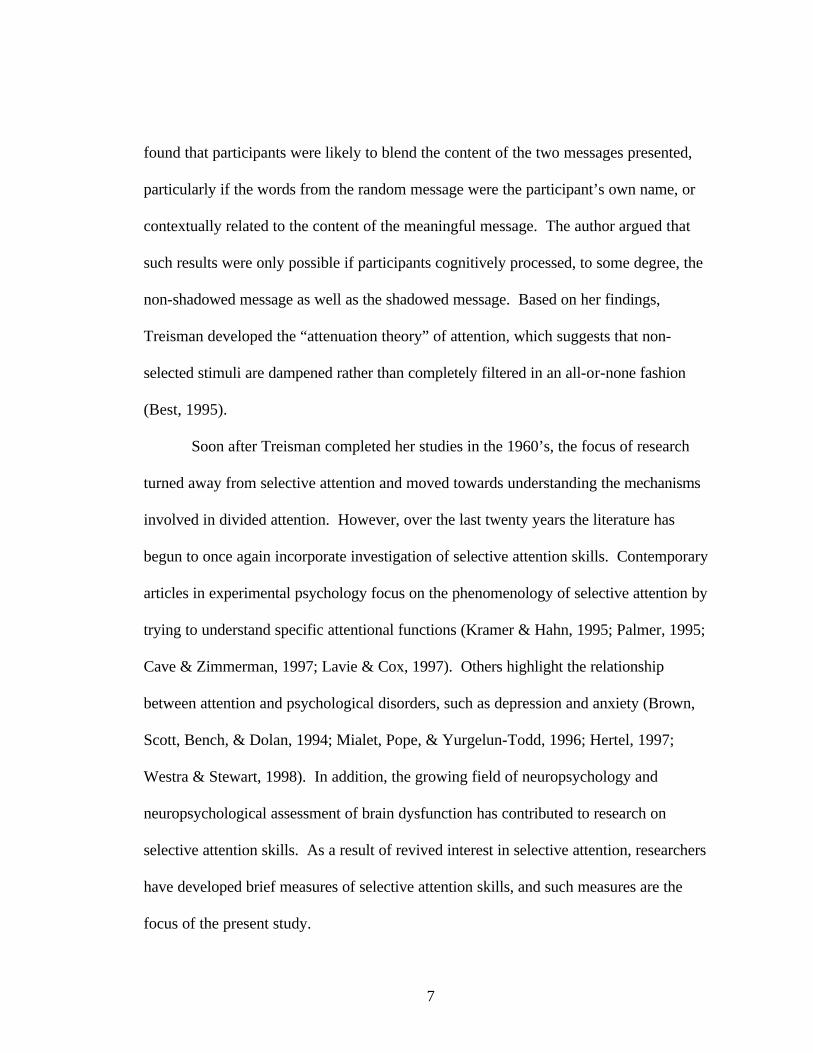
found that participants were likely to blend the content of the two messages presented,
particularly if the words from the random message were the participant’s own name, or
contextually related to the content of the meaningful message. The author argued that
such results were only possible if participants cognitively processed, to some degree, the
non-shadowed message as well as the shadowed message. Based on her findings,
Treisman developed the “attenuation theory” of attention, which suggests that non-
selected stimuli are dampened rather than completely filtered in an all-or-none fashion
(Best, 1995).
Soon after Treisman completed her studies in the 1960’s, the focus of research
turned away from selective attention and moved towards understanding the mechanisms
involved in divided attention. However, over the last twenty years the literature has
begun to once again incorporate investigation of selective attention skills. Contemporary
articles in experimental psychology focus on the phenomenology of selective attention by
trying to understand specific attentional functions (Kramer & Hahn, 1995; Palmer, 1995;
Cave & Zimmerman, 1997; Lavie & Cox, 1997). Others highlight the relationship
between attention and psychological disorders, such as depression and anxiety (Brown,
Scott, Bench, & Dolan, 1994; Mialet, Pope, & Yurgelun-Todd, 1996; Hertel, 1997;
Westra & Stewart, 1998). In addition, the growing field of neuropsychology and
neuropsychological assessment of brain dysfunction has contributed to research on
selective attention skills. As a result of revived interest in selective attention, researchers
have developed brief measures of selective attention skills, and such measures are the
focus of the present study.
8
Attention in Sport Psychology
While applications of research on attention have dealt with an abundance of “real
world” settings, one area of particular interest is within the sub-field of sport psychology.
In the course of the last twenty years, a vast amount of information has been acquired in
reference to the interaction between psychology and athletics, and much of this work has
included research relevant to attention (Cratty, 1983; Moran, 1996). Some studies
discuss how different attentional skill levels tend to vary depending upon the sport. For
instance, Nougier, Stein, and Bonnel (1991) reviewed findings that archers narrow their
attentional beam in order to focus on a specific target (similar to selective attention),
while those involved in fencing, tennis, or boxing focus their beam of attention in a more
diffuse manner (similar to divided attention). Researchers also found that professional
athletes reported being able to more effectively use their attentional abilities during
athletic competition than collegiate or non-professional athletes (Mahoney, Gabriel, &
Perkins, 1987). Moran (1996) explains that high performance athletes often consider
their athletic success or failure a function of their ability or inability to focus their
selective attention skills and thereby ignore distracters (i.e. sights and sounds in the
crowd or in the overall stimulus field). Based on data collected thus far, experts in the
sport psychology realm commonly recognize the positive association between the ability
of athletes to focus attention and to perform well (Mahoney, 1979; Cratty, 1983; Nougier,
Stein, & Bonnel, 1991). Indeed, Nideffer (1976b) writes: “It is hard to imagine a variable
more central to performance than the ability to direct and control one’s attention (p.
395).”
9
Attention, Depression, Anxiety, and Assessment
As previously mentioned, a trend in the literature has formed regarding the effects
of depression on attention. Although some studies have found negative results (Knott,
Lapieree, Grifiths, de Lugt, & Bakish, 1991), others have produced findings which
suggest that attention is affected by the presence of depressive symptoms (Brown, Scott,
Bench, and Dolan, 1994). Some data also suggest that cognitive functions other than
attention, such as memory, are affected by depression-related attentional problems
(Hertel, 1997). However, those who have conducted comprehensive reviews of the
literature contend that researchers have failed to produce specific hypotheses regarding
the relationship between attentional dysfunction and depression, and recommend further
research in this area as a result (Mialet, Pope, & Yurgelun-Todd, 1996).
In addition to examining deficiencies in selective attention as a correlate of
depression, researchers have also addressed the issue of selective attention and its relation
to anxiety. Specifically, Westra and Stewart (1998) offer a comprehensive review of
literature related to the use of medication, cognitive-behavioral therapy, and the
combination of medication and therapy to treat anxiety disorders. The authors discuss
findings that those who suffer from anxiety disorders are more likely to selectively attend
to potential threats. The authors also cite evidence that reduction of such attentional bias
is likely to improve treatment outcome.
Finally, psychological assessment provides further applications for increased
understanding and measurement of attention. Many consider Wechsler’s Digit Span
subtests (Wechsler, 1997) to be useful measures of attentional skills and, concurrently, a
10
primary component of intellectual assessment (Sattler, 1988). Attentional measures are
also widely used to assess cognitive functioning in individuals suspected of suffering
from some form of neuropsychological impairment, such as traumatic brain injuries or
dementia. Clearly, measures of attention have direct clinical applications.
Three Behavioral Measures of Attention
Mialet, Pope, and Yurgelun-Todd (1996) explain the difficulty in measuring
attention. They write that “there is no pure measure of attention; one can only measure
performance on a particular task that is presumed to require a high level of attention” (p.
1010). One of the most widely accepted methods for measuring attention involves
orienting to visual stimuli (Posner, 1980). For example, visual search/cancellation tasks
entail identification of target symbols set in an array of visual distracters. A well
established visual search and cancellation task is The Visual Search and Attention Test
(VSAT; Trenerry, Crosson, DeBoe, and Leber, 1990) which was developed in order to
screen for gross neurological dysfunction. Research suggests that the VSAT is a measure
with reasonably good reliability and validity. A similar visual search and cancellation
measure is the Search and Cancellation of Ascending Numbers (SCAN; Mahoney, 1989).
One factor the SCAN introduces is the use of an auditory distracter condition. However,
reliability and validity studies have not been conducted on the SCAN.
In addition to search and cancellation tasks, one of the more commonly used
measures of attention is the Digit Span subtest of the Wechsler intellectual abilities tests
(Wechsler, 1997). According to Sattler (1988), the Digit Span task, which entails
listening to and repeating strings of digits in forward and backward orders, is a good
11
indicator of auditory attention. As a component of several of the Wechsler tests, the
Digit Span task has been well validated.
One Self-report Measure of Attention
Yet another measure of attention is the TAIS, a 144-item self-report measure with
17 subscales consisting of Likert-type responses. The TAIS was developed in order to
measure attention and interpersonal skills (Nideffer, 1976a). Although the test is largely
used by psychologists for the purpose of assessing athletes’ attentional abilities, it was
developed through administration to college students, and is therefore not exclusive to
those involved in sports. Unfortunately, research thus far suggests that participants have
a difficult time accurately appraising their own attentional skills, making self-report an
ineffective means by which to assess attention (Reisberg and McLean, 1985). As
mentioned earlier, Summers and Ford (1990) found the factorial and predictive validity
of the TAIS to be poor, and yet it remains a commonly used measure (Moran, 1996).
Sport-specific versions of the TAIS have been generated to improve psychometric
qualities of the measure when used in sport-specific settings, such as a tennis version and
a soccer version (Ostrow, 1990). While the sport-specific versions are somewhat more
psychometrically sound, Summers and Ford (1990) did not judge these improvements to
be dramatic. Additionally, there are no known published studies on the reliability and
validity of an abbreviated version of the TAIS, known as the TAIS short form.
The Present Study
First statement of problem. Because the construct of attention is such an integral
component of the study of psychology and consequently applies to so many areas of the

12
field (i.e. sport psychology and clinical psychology), development of new measures for
assessing attentional skills is of critical importance. Posner (1980) wrote:
While orienting to stimuli in visual space is a restricted sense of attention, I
believe that its study is capable of providing us both with important tests of the
adequacy of general models of human cognition and with new insights into the
role of attention in more complex human activity (p. 5).
Bearing this message in mind as well as the aforementioned difficulties of measuring
attention (Mialet, Pope, & Yurgelun-Todd, 1996), the present study attempted to assess
the effectiveness of the SCAN by measuring the strength of the relationships between it
and both the Digit Span and VSAT. An effort was also made to determine whether or not
the three measures define a common factor. It was suggested that moderate relationships
as well as identification of a common factor would make it possible to speculate as to
whether or not that factor is attention. The study also attempted to determine whether or
not the presence of an auditory distracter increased variability in performance on the
SCAN, thereby suggesting variability in attention. Findings on the effectiveness of the
auditory distracter were of particular interest as little focus has been given in the literature
to the effects of distraction (Reisberg & McLean, 1985). Alternate forms reliability
analyses were performed for the two forms (A & B) of the SCAN. As a whole the
present study allows researchers to speculate about the possible applications of the
SCAN.
Second statement of problem. Researchers have focused on developing
techniques and working models in an attempt to increase athletes’ ability to attend to

13
various athletic tasks and ignore distracters, thereby enhancing athletic performance
(Nideffer, 1976; Singer, Cauraugh, Tennant, & Murphey, 1991). In addition, several
inventories such as the TAIS (both long and short forms) have been developed in order to
measure levels of attention and concentration in athletes. However, questions remain as
to whether or not the TAIS short form is a reliable and valid measure. Recommendations
were made that the TAIS be compared with behavioral assessments of attention in order
to more accurately evaluate participants’ attentional skills, rather than perceived attention
as assessed through self-report (Moran, 1996). Consequently, the present study
investigated how well ratings of attention on the TAIS predict levels of attention on the
Digit Span, VSAT and SCAN. The opportunity was also taken to determine if the TAIS
short form is a reliable measure in terms of the internal consistency of the items. It was
hoped that the findings of the present study would help determine whether or not use of
the TAIS short form is recommendable in athletic settings, or otherwise, for assessing
selective attention skills.
Hypotheses
Hypothesis 1. Based on past findings that self-report is not an effective means by
which to measure attention as compared to behavioral measures, as well as the fact that
the TAIS short form items do not appear to be specific to selective attention skills, it was
hypothesized that the TAIS short form would not function as an effective predictor of
performance on either the Digit Span or VSAT.
Hypothesis 2. Similar to Hypothesis 1, it was hypothesized that the TAIS short
form would not be an effective predictor of performance on the SCAN.

14
Hypothesis 3. Because the individual items of the TAIS do not appear to inquire
about a common attentional skill, it was also hypothesized that these items would not
exhibit strong internal consistency reliability.
Hypothesis 4. The VSAT and the SCAN are measures that involve similar visual
search and cancellation tasks. Therefore, it was hypothesized that there would be a
strong relationship between the two behavioral measures when auditory distracters were
not incorporated in the administration of the SCAN. Relationships would also be
examined between the SCAN and Digit Span for comparative purposes.
Hypothesis 5. It was also hypothesized that factor analysis would reflect a
common factor between the Digit Span, VSAT, and SCAN.
Hypothesis 6. It was hypothesized that there would be a greater degree of
variability in performance during the auditory distracter condition of the SCAN as
compared to the non-distracter condition, as it was assumed that the auditory distracter
condition would successfully divert the attention of participants from the visual search
and cancellation task.
Hypothesis 7. It was hypothesized that a relatively strong relationship would be
found between forms A and B of the SCAN (without the auditory distracter) in an
alternate forms reliability pilot study.
15
CHAPTER 2
METHOD
Participants
One hundred and five students at the University of North Texas participated in the
present study (73 females; 32 males). The experiment was conducted in groups ranging
from two to five participants each. Participants received extra credit points for taking
part in the study. Some normative data suggest that participants’ scores differ
significantly on visual search and cancellation tasks depending upon age (Trenerry et al.,
1990). Therefore, in order to control for possible age differences in performance, all
participants in the present study were between the ages of 20 and 29. No requirements
were made in terms of ethnicity or gender, although it was required that all participants’
identify English as their first language. Participants were also screened for a history of
hearing difficulties, neurological difficulties, and physical handicaps. Additionally,
participants were screened for diagnosis of a learning disability, attention
deficit/hyperactivity disorder, and major psychiatric illnesses. In order to control for
potential differences in hemispheric laterality, participants were screened for handedness.
Only right-handed volunteers were tested.
Materials
The sign-up, consent, and screening forms. Participants responded to a notice
posted for research participation in the Department of Psychology at the University of

16
North Texas (see Appendix A). The notice included a brief explanation of the study, the
extra credit points to be earned through participation in the study, and the parameters
necessary for such participation. Each experimental group began with participants
completing an informed consent form (see Appendix B), followed by a screening form
(see Appendix C) that included questions relevant to the requirements for participation in
the study.
The Test of Attentional and Interpersonal Style. The TAIS has 144 items and is
comprised of 17 sub-scales, nine of which attempt to evaluate how one might behave
during certain interpersonal situations. The other six sub-scales attempt to evaluate
attentional processes, while two others attempt to evaluate behavioral and cognitive
control. The TAIS is a theory based measure, designed using a rational-intuitive
approach toward test construction. In his development of the TAIS, Nideffer (1976a)
suggests that attention exists along dimensions which he describes as “width” and
“direction.” Width refers to the focus of attention, which ranges from broad
(encompassing several stimuli simultaneously), to narrow (focusing on a minimal number
of stimuli). Direction refers to the area of focus: either internally on one’s own thoughts
or bodily sensations, or externally on the surrounding environment.
Nideffer (1976a) found that athletes who produced high scores on one of the 17
sub-scales intended to measure excessive narrowing of attention were rated by their
coach as more likely to “choke” under pressure (r = .75), fall apart after making errors
early on in a performance (r = .59), and fixate on one particular source of worry (r = .80).
Athletes that coaches labeled as inconsistent performers reported a tendency to be
17
overloaded with stimuli (both internal and external; r = .60, r = .61, respectively), and
difficulty in narrowing attention (r = .63; Nideffer, 1976a). Nonetheless, the majority of
validity studies have been less than definitive and the TAIS is generally recognized as an
unstandardized, essentially unvalidated measure (Ford & Summers, 1992).
In their study involving 210 first-year psychology graduate students, Ford and
Summers (1992) found the factorial validity of the TAIS subscales to be poor and
concluded that the measure lacks sound discriminant and construct validity. The authors
argue that Nideffer’s model of attentional style is most likely an oversimplification of
attentional processes. Researchers were also unsuccessful in correlating the six
attentional sub-scales of the TAIS with the forward, backward, and total scores of the
Digit Span subtest of the Wechsler Adult Intelligence Scale, further underscoring the
scales’ poor validity (Turner & Gilliland, 1977). Several suggestions have been made as
to why the TAIS is unsuccessful in measuring attention and concentration. Critics
maintain that self-report of attention is an inefficient method for measuring the construct.
As Moran (1996) points out, use of such measures assumes that one can and will
accurately assess one’s own concentration and attentional processes through self-
monitoring, and data collected by Reisberg and McLean (1985) suggest that people are
incapable of doing so.
The present study implemented the short form of the TAIS (see Appendix D)
because of the complicated nature of the standard version and its 17 subscales. This
version of the TAIS is comprised of 12 questions concerning attentional skills, each of
which is rated based on the following scale: 0 = never, 1 = rarely, 2 = sometimes, 3 =
18
frequently, and 4 = all the time. For six of the items, high numeric value responses
indicate effective attention, while low numeric value responses indicate ineffective
attention. For the other six items, high numeric value response indicates ineffective
attention while low numeric value response indicates effective attention. The twelve
items constitute six subscales, with two items per scale. These six subscales are identical
to those intended to assess attention in the full length version of the TAIS and include (1)
the Broad-External subscale (BET), (2) the Broad-Internal subscale (BIT), (3) the Narrow
Effective Focus subscale (NAR), (4) the External Overload subscale (OET), (5) the
Internal Overload subscale (OIT), and (6) the Errors of Underinclusion subscale (RED).
The BIT scale is represented by items 1 and 5; the BIT scale is represented by items 2
and 11; the NAR scale is represented by items 4 and 10; the OET scale is represented by
items 7 and 9; the OIT scale is represented by items 6 and 12; and the RED scale is
represented by items 3 and 8.
The six scales indicate effective and ineffective attentional skills in three general
areas, including external focus (BET, OET), internal focus (BIT, OIT), and attentional
broadening/narrowing abilities (NAR, RED). High scores on the BET scale indicate
good ability to effectively attend to several external stimuli, while high scores on the
OET scale indicate a tendency to be overloaded by external stimuli. High scores on the
BIT scale indicate good ability to effectively think about more than one thing at a time,
while high scores on the OIT scale indicate a tendency to be overloaded by internal
thoughts and feelings. High scores on the NAR scale indicate good ability to effectively
narrow attentional focus when necessary, while high scores on the RED scale indicate
19
difficulty broadening attentional focus. Organized differently, BET, BIT, and NAR are
scales of effective attention, while OET, OIT, and RED are scales of ineffective attention.
For the purposes of the present study, a sum of all items was calculated for the
TAIS short form, although Nideffer (1976a) does not discuss the possible utility of a total
score. In order to calculate the TAIS Total, all reversed items were re-coded such that
low total scores reflected ratings of ineffective overall attention, while high total scores
reflected ratings of effective overall attention. In addition to the TAIS Total score, the re-
coding of individual reversed items was performed for the purpose of internal consistency
reliability analysis. Reversed items were not re-coded when calculating the TAIS
subscales. Data collected on the abbreviated TAIS is of particular interest as researchers
have not yet evaluated its reliability or validity (Moran, 1996).
The Digit Span. The Digit Span task is a subtest that has long been regarded as a
measure of attention and included in the Wechsler measures of intelligence since their
inception, including the recently developed Wechsler Adult Intelligence Scale-Third
Edition (WAIS-III; Wechsler, 1997). The task is divided into two parts including Digits
Forward and Digits Backward. In Digits Forward, digits are presented in strings ranging
in length from two to nine digits, while string length ranges from one to eight digits
during Digits Backward. Two trials are included for each digit string length. For Digits
Forward, the examiner reads aloud each string of numbers which the examinee then
repeats in identical sequence, while Digits Backward entails repeating each string in
backward sequence. Each pair of Digit Span strings receives a score of 2, 1, or 0, and
testing is discontinued after failure of the two trials included in a series (Sattler, 1992).
20
Because the present study involved the use of experimental groups, participants were
instructed to record their responses on a record sheet instead of vocalizing their responses
orally, as instructed during traditional administrations of the WAIS-III. Performance was
based on raw scores of Digits Forward, Digits Backward, and Digit Span Total.
The developers of the Wechsler scales as well as researchers in the field agree that
Digit Span functions as a measure of both short term memory and attention (Sattler,
1992; Wechsler, 1997). When divided into its separate sections, researchers tend to agree
that Digits Forward is a more pure measure of focused attention, although rote memory is
also considered a skill tested by the forward task. Digits Backward, on the other hand,
allows for measurement of working memory: the cognitive skill that allows an individual
to hold the mental image of a digit string for a short period of time, manipulate that image
in memory, and restate it in backward sequence. Whereas data collected using normal
participants indicate that the forward task remains stable across age groups, performance
on the backward task tends to deteriorate with age (Weintraub and Mesulam, 1985; cited
in Wechsler, 1997). In addition to attention and working memory, Sattler (1992) argues
that Digit Span performance is sensitive to such variables as relaxation and stress
tolerance.
Data collected on the WAIS-III Digit Span subtest is highly supportive of the
measure’s reliability and validity (Wechsler, 1997). The normative sample for the
WAIS-III included 2,450 adults, consisting of an equal number of males and females
across 13 age bands. The normative sample was representative of racial proportions in
each of the designated age groups within the U.S., according to 1995 census data. All
21
data reported in the present study on Digit Span involve participants ranging in age from
20 to 29, as this is relevant to the present study’s sample.
Split-half reliability coefficients for ages 20-24 and 25-29 were .90 and .92,
respectively. Test-retest stability for ages 16-29 was also found to be high, yielding a
coefficient of .83. In reference to issues of criterion-related validity, Digit Span of the
WAIS-III correlated strongly with Digit Span of the WAIS-R and WISC-III at .82 and
.73, respectively. Corrected correlation coefficients between Digit Span of the WAIS-III
and the Stanford-Binet Intelligence Scale-Fourth Edition (SB-IV; Thorndike, Hagen, &
Sattler, 1986; cited in Wechsler, 1997) were highest when comparing Digit Span to the
Short Term Memory Area of the SB-IV (.52). Construct validity of Digit Span was
evaluated based on factor analysis with other subtests of the WAIS-III. Exploratory
factor analyses support a four factor solution of the WAIS-III and indicate that a single
construct is defined by the Digit Span, Letter-Number Sequencing, and Arithmetic
subtests. Pattern loadings of each of the three subtests on the Working Memory factor
were .71, .62, and .51 respectively. Confirmatory factor analysis supported the stability
of the above factor structure across five age bands including one band of ages 20-34, and
WAIS-III developers labeled this construct as the Working Memory Index. Comparisons
with other measures suggest that the Working Memory Index is a valid measure of
attention; correlations with the Attention/Concentration Index of the Wechsler Memory
Scale-Revised (WMS-R; Wechsler, 1987; cited in Wechsler, 1997), the Trail Making
Test (Trails A and B) of the Halstead-Reitan Neuropsychological Battery (HRNB; Reitan
& Wolfson, 1993; cited in Wechsler, 1997), and the Attention/Mental Control Index of
22
the MicroCog (Powell et al., 1993; cited in Wechsler, 1997) yielded coeffificents of .66, -
.37, -.65, and .65, respectively.
The Visual Search and Attention Test. The Visual Search and Attention Test
(Trennery et al., 1990) entails administration of four different search and cancellation
tasks. Each task involves the presentation of 10 rows of stimuli with 10 targets randomly
placed throughout the rows. The first two tasks consist of letters in Task 1, and typing
symbols (closed brackets, slash marks, etc.) in Task 2. The letters and symbols in tasks 1
and 2 are printed in black ink. Trennery et al. (1990) explains that the two different kinds
of stimuli were implemented to vary participants’ level of familiarity for both the
distracters and targets. Tasks 3 and 4 are similar to 1 and 2, except that the letters and
symbols in 3 and 4 are printed in blue, green, or red ink. Trennery et al. (1990)
introduced the added variable of color in order to increase the range of complexity
between the target and distracter stimuli. Participant scores are calculated based on age-
normed percentile scores on tasks 3 and 4. Tasks 3 and 4 are exclusively used for scoring
as these two conditions were found to have the greatest sensitivity for detecting brain
damage. Therefore, tasks 1 and 2 act as necessary practice trials. Scores on the VSAT
include totals and percentiles for performance in the left visual field, right visual field,
and a combination of both visual fields.
As Lezak (1983) explains, performance on visual cancellation tests allows for the
assessment of rapidly performed visual selectivity and sustained attention. Poor
performance on cancellation tests is considered indicative of neuropsychological
impairment (Lezak, 1983), and the VSAT was developed to detect such impairment

23
(Trennery et al., 1990). It was validated using a normative sample of 272 adults, and a
sample of 100 adults with confirmed neurological damage or disease (Trenerry et al.,
1990). In the course of this validation study, gender and education were not found to
have a significant relationship with scores on the VSAT. However, age was found to be a
significant factor. Consequently, age-adjusted scores were developed for six age groups
including (a) 18-19, (b) 20-29, (c) 30-39, (d) 40-49, (e) 50-59, and (f) 60+ (Trenerry et
al., 1990). Using age adjusted scores, the VSAT effectively discriminated 117 of 136
normal participants, and 43 of 49 brain damaged participants. These findings translate to
a specificity level of .86 and a sensitivity level of .88. Factor analysis of the VSAT and
four other neuropsychological measures suggests that the VSAT defines an attention
factor required for rapid cognitive processing (O’Donnel, MacGregor, Dabrowski,
Oestreicher, & Romero, 1994). In addition, Trenerry et al. (1990) tested and retested a 28
participant subset of the normative sample with a two month interval between test
administrations. Test-retest reliability was estimated by a correlation coefficient which
was found to be high (.95). However, it was also found that a practice effect occurred for
this sample in which the mean performances improved by 11%.
The Search and Cancellation of Ascending Numbers. The third attentional task to
be employed is the exercise known as the Search and Cancellation of Ascending
Numbers (SCAN). For the SCAN, two matrices were presented (form A and form B).
Each matrix is comprised of 100 cells arranged in a 10 x 10 format. Two digit numbers,
ranging from 00 to 99, are presented in each cell. The numbers are randomly arranged on
both matrices, respectively. During each administration of the SCAN, one form of the

24
SCAN is presented without an auditory distracter, while a second condition is presented
that includes presentation of an auditory distracter. The auditory distracter is a taped
recording of a male voice reading aloud a series of randomly arranged numbers ranging
from 0 to 99, while another male voice simultaneously reads distracting material of a
comical nature. Scores are based on the number of double digit numbers canceled out in
correct sequence. SCAN scores include a score of participants’ performance with an
auditory distracter present (SCAN-W), a score for performance without an auditory
distracter present (SCAN-W/O) and a total score (SCAN Total). No validity or reliability
studies have yet been conducted on this measure and determining its effectiveness in the
assessment of attentional skill is of particular interest in the present study.
The Positive and Negative Affect Schedule. As stated earlier, strong feelings of
sadness and/or anxiety are likely to influence one’s ability to complete performance
measures of attention as such emotions deplete cognitive resources. In order to control
for variance in participants’ performances on attentional measures attributable to
affective state, the Positive and Negative Affect Schedule (PANAS; Watson, Clark, &
Tellegen, 1988), was included in the present study. The PANAS involves presentation of
two 10-item mood scales. Each of the interspersed items is intended to measure either
Positive Affect (PA) or Negative Affect (NA) and is represented by a one word mood
descriptor rated based on the following scale: 1 = very slightly or not at all, 2 = a little, 3
= moderately, 4 = quite a bit, and 5 = extremely. While there are seven different versions
of the PANAS distinguishable by their temporally related instructions, the “Moment”
version used for this study requested that participants rate how they felt “right now (that
25
is, at the present moment).” PA and NA are estimated by summing the total scores
reported for mood descriptors representing the two respective scales.
Watson et al. (1988) explain that high PA is associated with high energy, good
attention, pleasurable engagement, and social satisfaction, while low PA is associated
with sadness and sluggishness. On the other hand, high NA is associated with a number
of negative mood states such as anxiety, anger, contempt, disgust, fear, and nervousness,
while low NA is associated with a state of calmness. The authors argue that depressive
symptomology is most associated with low ratings of PA and high ratings of NA.
Research on the PANAS has generated strong reliability and validity data.
Because the present study involved the “Moment” form of the PANAS, all data reported
in the present study correspond to this version only. Watson et al. (1988) found the
internal consistency reliability of the measure to be strong, with alpha reliabilities
equaling .89 and .85 for the PA scale and NA scale respectively. Also, a low
intercorrelation was found between the PA and NA scales (-.15), suggesting good
discriminant validity. Test-retest reliability data after an eight week retest interval were
good, with correlations between first and second administrations equaling .54 for PA, and
.45 for NA. Factor analyses suggest that the PANAS also exhibits both strong scale
validity and strong item validity. Finally, Watson et al. reported strong external validity
for the PANAS, as correlations with other measures of distress and psychopathology
(e.g., the Hopkins Symptom Checklist, the Beck Depression Inventory, and the State-
Trait Anxiety Inventory State Anxiety Scale) were found to be moderate for PA, ranging
from -.19 to -.36, and high for NA, ranging from .51 to .74.
26
The Hand Preference Questionnaire. All participants in the present study
considered themselves to be right handed, therefore controlling for potential differences
in attentional abilities attributable to variability in hemispheric laterality. The Hand
Preference Questionnaire developed by Peters and Servos (1989) was used to more
specifically identify variations in right hand preference which may or may not have
affected participant performance. The scale includes eight items involving common tasks
that require use of one’s hand (e.g., write, throw, use knife for cutting bread, use
toothbrush) and instructs participants to rate their degree of preference for each item
using the following scale: 1 = always left, 2 = usually left, 3 = right or left, 4 = usually
right, and 5 = always right. The questionnaire was originally used to classify left handers
into two separate categories. Those who responded with two or more items scored 4 or 5
were labeled an inconsistent left-hander (ILH), while those who responded with one or
fewer items scored 4 or 5 were labeled a consistent left hander (CLH). Results obtained
by Peters and Servos (1989) suggest that the classification system used to identify CLHs
and ILHs is valid, based on findings that CLHs exhibited greater strength in the left hand,
while ILHs exhibited greater strength in the right hand. Although Peters and Servos used
the above criteria to classify differences in left-handers, the researchers’ criteria were
adapted for use with right handed individuals, allowing for classification of inconsistent
right handers (IRH) and consistent right handers (CRH) in the present study.
The Anticipatory Performance Scale. In an attempt to control for variance in
attentional performance potentially attributable to expectancy, the Anticipatory
Performance Scale was included in the present study (see Appendix E). The measure

27
asks participants to supply one rating of how well they believe they will perform on the
attentional tasks of the study using the following scale: 1= not successful, 2 = slightly
successful, 3 = quite successful, and 4 = extremely successful. The Anticipatory
Performance Scale was developed for this study and there are no data to support its
reliability or validity.
The Auditory Distraction Scale. The present study also introduced a measure in
an attempt to account for variance attributable to subjective perception of auditory
distraction during administration of the SCAN. The Auditory Distraction Scale (see
Appendix F) was used in order to measure the degree to which participants felt as though
their performance on the SCAN-W condition was hampered by the auditory distracter.
Participants were asked to provide one rating based on the following scale: 1 = not
distracted, 2 = slightly distracted, 3 = quite distracted, and 4 = extremely distracted. The
Auditory Distraction Scale was developed for this study and there are no data to support
its reliability or validity.
Procedure
As stated earlier, all individuals who participated in the present study agreed to
and signed the consent form and screening form. All participants then completed the
Hand Preference Questionnaire, followed by the PANAS, the abbreviated version of the
TAIS, and the Anticipatory Performance Scale. Digit Span was administered next. All
directions to complete the Digit Span were in accordance with those of the WAIS-III,
with the exception of the rule to respond vocally. Because the experiment was

28
administered in groups, participants were instructed to record their responses by writing
them on a record sheet with appropriate spaces provided (see Appendix E).
The final two attention related tasks of the experiment included the VSAT and
SCAN. In order to control for a practice effect that might have occurred because both
measures involve search and cancellation tasks, the presentation of the VSAT and the
SCAN was counterbalanced. Administration of the SCAN included both form A and
form B which were counterbalanced in order to control for possible practice effects
within the measure. Similarly, presentation of the SCAN’s auditory distracter condition
(SCAN-W) and no auditory distracter condition (SCAN-W/O) was also counterbalanced.
The Auditory Distraction Scale was administered following completion of the SCAN.
In the interest of standardization, all experimental groups were conducted through
presentation of audio cassettes. Four different cassettes were generated in
correspondence with various counterbalancing orders of the VSAT and SCAN, as well as
counterbalanced orders of the forms and auditory distracter conditions of the SCAN. The
cassettes included all directions necessary for participation in the study as well as the
auditory distracter presented for the SCAN. A transcript of one of the four experimental
tapes is provided (see Appendix G). The tape was played using a stereo audio tape
cassette player. The space used for testing was a classroom in Terrill Hall at the
University of North Texas. All experimental groups were conducted at 5:00 p.m. and
each group took approximately 45 minutes to complete the experiment. As previously
mentioned, testing was administered in groups ranging from two to five members each,
with one experimenter present at all times. Participants were seated in a line across the
29
front of a room in an attempt to reduce distractions during the experimental process and
to ensure similar amounts of exposure to the experimenter and the auditory stimuli
presented.
A researcher observed each participant during the course of the experimental
administration in order to ensure that participants completed each measure correctly. On
occasions when an experimenter noticed that a participant was completing a task
incorrectly, the researcher made note of the specific discrepancies involved and such data
were not included in any analyses. Experimenters made such notations without
participants’ knowledge, thereby reducing the likelihood that the experimenters’ reactions
might have an effect on participants’ performance.
Alternate forms reliability pilot study. A pilot study was conducted in order to
determine the alternate forms reliability of the SCAN. Nineteen additional participants (6
males; 13 females) who met criteria for the present study were included in the pilot study
and completed counterbalanced orders of forms A and B of the SCAN. The auditory
distracter condition of the SCAN was not included for this portion of the present
investigation.
30
CHAPTER 3
RESULTS
Descriptive Statistics
Descriptive statistics are provided in order to better comprehend the data as a
whole and the analyses that follow. As previously stated, 32 males and 73 females
participated in the current study. The mean age for participants was 22.03. In terms of
counterbalancing orders, 55 of the participants completed the VSAT followed by the
SCAN, while 50 participants completed the SCAN followed by the VSAT. Sixty-three
participants completed SCAN form A followed by SCAN form B, while 41 participants
completed SCAN form B followed by SCAN form A. Forty-nine participants completed
the SCAN-W on form A, while 55 participants completed the SCAN-W on form B. In
addition to counterbalancing orders, means and standard deviations are provided in Table
1 for all subsections, subscales, and totals of the four attentional measures of the present
study (see Appendix H, Table 1). Means and standard deviations are also provided in
Table 2 for covariates in the present study (see Appendix H, Table 2). Additionally, 103
participants were classified as consistent right handers, while 2 were classified as
inconsistent right handers, as determined by the modified Hand Preference Questionnaire.
Preliminary Data Analyses
Based on the large sample size of the present study, normality is assumed to be
met for all analyses. Analyses were performed in order to determine if the covariates

31
accounted for in the present study affected performance on the behavioral measures of
attention. Covariates included age, gender, expectancy (as measured by the Anticipatory
Performance Scale), positive and negative affect (as measured by PA and NA of the
PANAS), degree of right handedness and thereby degree of hemispheric laterality (as
measured by the Hand Preference Questionnaire), and subjective judgment of
performance on the SCAN-W (as measured by the Auditory Distraction Scale). Product
moment correlations were performed in order to measure the strength of the relationships
between the covariates and performance on each of the subsections and totals of the Digit
Span, VSAT, and SCAN. A correlation coefficient of .3 was used as a benchmark for the
correlation analyses because it is argued that such a correlation is enough to demonstrate
a moderate relationship between the variables (Rosenthal & Rosnow, 1991). Table 3
presents the results of the correlation analyses (see Appendix H, Table 3). Based on
these analyses, a meaningful relationship exists between positive affect (PA) and Digits
Backward, indicating that as positive affect increases performance on Digits Backward
increases as well. A similar relationship was found between positive affect and Digit
Span Total. Consequently, partial correlation tests were performed while testing
hypotheses and exploratory analyses that involved correlations of Digits Backward and
Digit Span Total, using PA as a controlling variable (which applied to hypotheses 1 and
4). No other significant relationships were found between PA and the three behavioral
attention measures.
In addition to the above findings, a negative relationship approaching moderate
strength was detected between subjective ratings of distraction on SCAN-W (Auditory

32
Distraction Scale) and actual performance on SCAN-W. Although it is not considered
statistically meaningful, this finding indicates that as performance on the SCAN-W
increases, subjective perception of distraction decreases (see Appendix H, Table 3). In
addition, no meaningful relationships were found between the six subsections of the Digit
Span, VSAT or SCAN, and age, gender, right handedness, negative affect, or expectancy.
However, analyses that included age and gender are considered inconclusive as 70% of
the sample population were female, and 82% ranged between 20 and 23 years of age.
Hypothesis Testing
Hypothesis 1. Hypothesis 1 stated that the TAIS short form would be a poor
predictor of performance on Digit Span and the VSAT. Specifically, the prediction was
made that the TAIS Total score would be a poor predictor of performance on Digits
Forward, Digits Backward, Digit Span Total, VSAT Left, VSAT Right, and VSAT Total.
In order to test this hypothesis, a General Linear Model was used, which subsumes
multivariate analysis of variance (MANOVA) as well as regression. The TAIS Total was
defined as the independent variable (IV) while Digits Forward, Digits Backward, Digit
Span Total, VSAT Left, VSAT Right, and VSAT Total were defined as dependent
variables (DVs). Covariates accounted for in the analysis included both positive and
negative affect (as measured by PA and NA of the PANAS), expectancy (as measured by
the Anticipatory Performance Scale), and degree of right handedness and thereby
hemispheric laterality, (as measured by the Hand Preference Questionnaire). Table 4
displays the correlations between the independent and dependent variables of Hypothesis
1 (see Appendix H, Table 4). Because a meaningful correlation was found between PA

33
of the PANAS and Digits Backward, as well as PA and Digit Span Total, partial
correlations were calculated for both while controlling for positive affect. The results of
these partial correlations are presented in Table 5 (see Appendix H, Table 5). The data
presented in Table 4 involving Digits Backward, Digit Span Total, and TAIS Total and
those presented in Table 5 involving the partial correlations of these measures while
controlling for positive affect, are similar.
In an effort to test whether or not the TAIS Total functions as a strong predictor of
Digit Span and the VSAT, unstandardized regression coefficients B, R2, and Adjusted R2
are displayed in Table 6 (see Appendix H, Table 6). Review of scatterplot graphs
revealed that assumptions of homoscedasticity were met for each of the dependent
variables. No statistically significant relationships were detected between the TAIS Total
and Digits Forward, F (1, 77) = 1.46, p = .230, Digits Backward, F (1, 77) = .721, p =
.399, Digit Span Total, F (1, 77) = .021, p = .885, VSAT Left, F (1, 77) = .017, p = .896,
VSAT Right, F (1, 77) = .013, p = .908, or VSAT Total, F (1, 77) = .005, p = .942. Of
the covariates included in these analyses, those which would have otherwise contributed
significantly to prediction of the DVs included positive affect on Digits Backward, F (1,
77) = 8.16, p = .006, and positive affect on Digit Span Total, F (1, 77) = 5.88, p = .018.
As a whole, the model above accounted for 10.2% of the variance for Digits Forward
(Adjusted R2 = .044), 11.5% of the variance for Digits Backward (Adjusted R2 = .058),
11.8% of the variance for Digits Total (Adjusted R2 = .061), 3.3% of the variance for
VSAT Left (Adjusted R2 = -.030), 1.2% of the variance for VSAT Right (Adjusted R2 = -
.052), and 1.9% of the variance for VSAT Total (Adjusted R2 = -.044). Based on these
34
analyses, the TAIS Total score was found to be a poor predictor of performance on Digits
Forward, Digits Backward, Digit Span Total, VSAT Left, VSAT Right, and VSAT Total.
Hypothesis 2. Hypothesis 2 stated that the TAIS short form would be a poor
predictor of performance on the SCAN. Specifically, the prediction was made that the
TAIS Total score would be a poor predictor of performance on SCAN-W, SCAN-W/O,
and SCAN Total. The TAIS Total was defined as the IV while the SCAN-W, SCAN-
W/O, and SCAN Total were defined as DVs. Covariates accounted for in this second
General Linear Model included both positive and negative affect, expectancy, degree of
right handedness and, thereby, hemispheric laterality, and degree of perceived auditory
distraction on the SCAN-W. Review of scatterplot graphs revealed that assumptions of
homoscedasticity were met for each of the dependent variables. Table 7 displays the
unstandardized regression coefficients B, R2, and Adjusted R2 (see Appendix H, Table 7).
No statistically significant relationships were detected between the TAIS Total and the
SCAN-W, F (1, 96) = .495, p = .483, SCAN-W/O, F (1, 96) = .1.36, p = .247, or SCAN
Total, F (1, 96) = 1.29, p = .258. Of the covariates included in these analyses, those
which would otherwise have contributed significantly to performance on the DVs
included the effect of expectancy on the SCAN-W, F (1, 96) = 5.07, p = .027, the effect
of expectancy on SCAN Total, F (1, 96) = 4.30, p = .041, and the rating of subjective
distraction on the SCAN-W, F (1, 96) = 8.20, p = .005. The model as a whole accounted
for 15.5% of the variance for SCAN-W (Adjusted R2 = .102), 5.3% of the variance for
SCAN-W/O (Adjusted R2 = -.006), and 10% of the variance for SCAN Total (Adjusted
35
R2 = .044). Based on these analyses, the TAIS Total score was found to be a poor
predictor of performance on the SCAN-W, SCAN-W/O, and SCAN Total.
Hypothesis 3. It was hypothesized that the items of the TAIS would not exhibit
strong internal consistency reliability. In order to test this hypothesis, a Chronbach’s
alpha coefficient (α) was calculated for all items on the TAIS. For the purpose of this
analysis, all reversed items were re-coded such that low scores on each individual item
reflected ineffective attentional ability, while high scores reflected effective attentional
ability. Generally, coefficients at or above .7 are considered strong and high internal
consistency is indicative of high reliability while low internal consistency indicates the
possibility that the TAIS measures multiple constructs. The Chronbach’s alpha revealed
that the 12 TAIS short form items have generally good internal consistency reliability, α
= .77. Table 8 provides the correlation coefficients between each of the 12 TAIS short
form items (see Appendix H, Table 8). The good overall internal consistency of the
TAIS short form items suggests that the test measures a single construct, which is
theoretically related to attention. Furthermore, the reliability analysis revealed that
deletion of particular items would not improve the overall internal consistency reliability
of the measure in a meaningful way.
Hypothesis 4. It was hypothesized that there would be a strong relationship
between the SCAN-W/O and VSAT Left, Right, and Total. Because the data being
analyzed were continuous for both measures used, a Pearson’s product moment
correlation coefficient was calculated in order to test this hypothesis. Once again, a
correlation coefficient of .3 was used as a benchmark for the correlation analysis because

36
it is argued that such a correlation is enough to demonstrate that a relationship exists
between measures (Rosenthal & Rosnow, 1991). A correlation of .6 is considered to be
far more telling, as this coefficient is thought to demonstrate a moderately strong
relationship. Review of scatterplot graphs revealed that the assumption of linearity was
met for all analyses performed in the course of testing Hypothesis 4.
The relationships between the SCAN-W/O and VSAT Left, Right, and Total,
were found to be relatively weak (see Appendix H, Table 4). However, as displayed in
Table 4, relationships of adequate strength, or approaching adequate strength, were found
between the SCAN Total and VSAT Left, Right, and Total. Similar relationships were
found between the SCAN-W and VSAT Left, Right, and Total.
Additionally, as displayed in Table 5 (see Appendix H, Table 5) partial
correlation coefficients (controlling for PA) revealed relationships of adequate strength,
or approaching adequate strength, between the SCAN-W/O and both Digit Span
Backward and Digit Span Total. A similar relationship was found between the SCAN
Total and Digit Span Total. Conversely, correlation analyses between the Digit Span and
VSAT were not strong enough to suggest the presence of a relationship (see Appendix H,
Tables 4 and 5). Overall, these analyses suggest a relationship between the SCAN and
the VSAT and a relationship between the SCAN and Digit Span, while a relationship
does not appear to exist between the Digit Span and the VSAT.
Hypothesis 5. Given that Digit Span, the VSAT, and the SCAN each theoretically
measure attention, it was hypothesized that factor analysis would reflect a common factor
among the subsections of the three measures, including Digits Forward, Digits Backward,
37
VSAT Left, VSAT Right, SCAN-W, and SCAN-W/O. Measure totals (Digit Span Total,
VSAT Total, and SCAN Total) were not included because information collected in such
totals is redundant with the measure subsections and, therefore, may result in a singular
matrix. A principal component analysis was used in order to test Hypothesis 5 and the
factors were restricted to a varimax rotation. Factor loadings of .4 or more were
considered to be relatively high and, therefore, meaningful. Review of a randomly
selected series of scatterplot graphs revealed that the assumption of linearity was met for
all of the variables included in this analysis.
Initially, a two component solution was generated by the principal component
analysis. However, the results of this two component solution were not coherent and
eigenvalues suggested that a three component solution may be more appropriate.
Consequently, a principal component analysis was conducted in which the structure of
the analysis was forced into three components. This three component solution accounted
for 82.5% of the total variance, with the first component accounting for 41.3 % of the
variance, the second component accounting for 24.9% of the variance, and the third
component accounting for 16.3 % of the variance. Individual component pattern loadings
of the three component solution are presented in Table 9 (see Appendix H, Table 9). The
results reveal the presence of a coherent solution in which the VSAT Left and VSAT
Right scores loaded highly on to one component, the SCAN-W. The SCAN-W/O loaded
highly on to a second component, and Digits Forward and Digits Backward loaded highly
on to a third component, suggesting that the three components represent three separate
constructs.
38
However, because Hypothesis 5 proposed that the three attentional measures
share one common factor, a principal component analysis was performed in which the
structure of the analysis was restricted to one component. It was found that this one
component accounted for 41.3% of the total variance, and factor loadings are presented in
Table 10 (see Appendix H, Table 10). Loadings on this restricted factor analysis are still
relatively high, ranging from .413 to .794, suggesting that, in addition to three separate
factors, the tests also measure a common construct. This phenomenon is referred to as a
second order factor structure. Based on loading values, VSAT Left and VSAT Right
appear to be the truest measures of the common construct, followed by SCAN-W and
SCAN-W/O, followed by Digits Forward and Digits Backward. These results are largely
consistent with those found when testing Hypothesis 4 which suggest that the Digit Span,
VSAT, and SCAN are related. A confirmatory factor analysis was performed in order to
determine whether or not the relationships between the variables support the second order
factor structure described above. Unfortunately, the second order confirmatory factor
analysis did not fit the data well, suggesting that the three measures do not measure three
distinct constructs as well as a common construct. Further confirmatory factor analyses
indicate that the three tests simply measure three distinct constructs.
Hypothesis 6. It was hypothesized that there would be a greater degree of
variability in performance during SCAN-W when compared to SCAN-W/O, as it was
assumed that the auditory distracter condition would successfully divert the attention of
participants from the visual search and cancellation task of the SCAN. A test of
heterogeneity of variances of nonindependent variances was performed in order to test
39
this hypothesis (Pitman, 1939). Table 11 provides a display of the means and variances
of the SCAN-W and the SCAN-W/O (see Appendix H, Table 11). Variance in
performance on the SCAN-W was not significantly different from the variance in
performance on the SCAN-W/O, t (102) = 1. 739, p > .05.
Hypothesis 7. Finally, it was hypothesized that a relatively strong relationship
would be found between forms A and B of the SCAN (both without the auditory
distracter) in the alternate forms reliability pilot study. Once again, a Pearson’s product
moment correlation coefficient was calculated in order to test this hypothesis. Review of
a scatterplot graph revealed that the assumption of linearity was met. While a correlation
level at or above .6 is considered indicative of a moderately strong relationship, the
relationship between the two forms of the SCAN was found to be of modest strength, r
(17) = .48, p < .05, suggesting that the alternate forms reliability of the SCAN is fairly
good.
Exploratory Analyses
Discriminant Validity of the TAIS. Interscale correlations of the TAIS subscales
were also calculated. Interscale correlations were derived by calculating product moment
correlation coefficients. For interscale correlations, coefficients of adequate to moderate
strength (.3 or above) are undesirable as such results would indicate measurement
redundancy and, thereby, poor discriminant validity. Review of several randomly chosen
scatterplot graphs revealed that the assumption of linearity was met for the interscale
correlation analyses performed. The results of these analyses are presented in Table 12
(see Appendix H, Table 12). The nature of the relationships between those scales
40
intended to measure effective functioning and those intended to measure ineffective
functioning are appropriately inverse with one another, as indicated by negative
correlations. However, the magnitude of several correlations ranges high enough to
suggest that the scales are redundant in their measurement, indicating poor discriminant
validity.
Convergent Validity of the TAIS. Efforts were made to evaluate the convergent
validity of the TAIS short form by comparing the 12 TAIS items, the six TAIS subscales,
and the TAIS Total score with Digit Span, the VSAT, and the SCAN. Table 13 (see
Appendix H, Table 13) provides product moment correlation coefficients between these
measures. Review of several randomly selected scatterplot graphs revealed that the
assumption of linearity was met for all analyses performed in the course of testing the
convergent validity of the TAIS. A meaningful relationship was found between the TAIS
Item 5 and Digits Forward. Similarly, a fairly meaningful relationship exists between the
TAIS Item 10 and Digits Forward. A meaningful relationships was also found between
the Broad-External Scale of the TAIS (BET) and Digits Forward. (As a reminder, the
BET subscale is not defined by the combination of Items 5 and 10). Because a
meaningful correlation was found between PA of the PANAS and Digits Backward as
well as PA and Digit Span Total (see Data Analyses), partial correlations were calculated
for both while controlling for positive affect and are presented in Table 14 (see Appendix
H, Table 14). When controlling for positive affect, no meaningful relationship was found
between Digits Backward and the TAIS items and scales, or Digit Span Total and the
TAIS items and scales. The data presented in Tables 13 and 14 are considered to be
41
similar. Overall, the above analyses suggest that the TAIS short form’s 12 individual
items, six sub-scales, and Total exhibit poor convergent validity when compared with the
Digit Span, VSAT, and SCAN.

42
CHAPTER 4
DISCUSSION
Summary and Integration of Results
Psychologists contend that attention is an essential component of cognition.
Consequently, increased understanding and measurement of attentional skills is pertinent
to a myriad of research within the field, including studies on the effects of
psychopathology, measurement of neuropsychological impairment, and sport psychology.
The present study was intended to determine whether or not a previously unexplored
performance measure of attention, the SCAN, functions as an effective measure of
attention. Comparisons were made between the SCAN and validated performance
measures of attention, including Digit Span and the VSAT. Tests of reliability were
included in the study, as were analyses intended to ascertain how well an auditory
distracter condition of the SCAN helps to assess attentional skills. Additionally, the
present study was intended to measure how well a previously unstudied survey on
attention, the TAIS short form, functions as a predictor of performance on behavioral
tests of attention. The present study also involved an assessment of various aspects of the
TAIS short form’s reliability and validity.
Hypotheses of the present study first involved examining the TAIS short form.
Hypothesis 1 stated that the TAIS short form would not be a significant predictor of
performance on either Digit Span or the VSAT. This hypothesis was corroborated as the
43
TAIS Total was found to be a poor predictor of performance on each of the subsections
and totals of both the Digit Span and the VSAT. Similarly, a hypothesis was made
(Hypothesis 2) that the TAIS short form would not be a significant predictor of
performance on the SCAN. The TAIS Total’s poor prediction of performance on each of
the subsections and totals of the SCAN confirmed this hypothesis. Hypothesis 3 stated
that the TAIS short form would exhibit poor internal consistency reliability. However,
results suggest that the internal consistency of the TAIS short form is fairly good,
particularly for a measure as short as 12 items. Therefore, this hypothesis was not
supported as the TAIS short form appears to measure a single construct.
The next set of hypotheses focused on examining the three behavioral measures of
attention included in the present study. Hypothesis 4 stated that a strong association
would be found between the SCAN-W/O and the VSAT, as both involve search and
cancellation tasks that do not incorporate auditory distraction. However, a weak
relationship was found between the SCAN-W/O and the VSAT Left, Right, and Total,
and Hypothesis 4 was not supported. Instead, adequately strong relationships, or
relationships approaching adequate strength, were found between the SCAN-W and
VSAT Left, Right, and Total, and between SCAN Total and VSAT Left, Right, and
Total. Similar relationships were found between the SCAN and the Digit Span, including
relationships between the SCAN-W/O and both the Digit Span Backward and Digit Span
Total, and between the SCAN Total and Digit Span Total. These findings suggest that
relationships exist between the SCAN and the VSAT, and between the SCAN and the
44
Digit Span. Surprisingly, the findings also suggest that a relationship does not exist
between Digit Span and the VSAT.
Hypothesis 5 stated that factor analyses would reveal a common factor between
Digit Span, the VSAT, and the SCAN. Results support this hypothesis and suggest that
Digit Span, the VSAT, and the SCAN, three distinct constructs in addition to one
common construct. Of the three measures, the VSAT was found to be the most closely
related to the construct, followed by the SCAN, and the Digit Span.
Hypothesis 6 stated that a greater degree of variability would be found in
performance of the SCAN-W as compared to the SCAN-W/O. However, the results of
the present study suggest that the variability of the two SCAN subsections is equal and
Hypothesis 6 was not supported. Hypothesis 7 stated that a strong relationship would be
found between forms A and B of the SCAN (without presenting the auditory distracter) in
the alternate forms reliability pilot study. Results of the present study suggest that the
relationship between forms A and B is fairly good. Therefore, the data tend to
corroborate Hypothesis 7.
Exploratory analyses were performed during the present study, revealing further
information on the TAIS. High interscale correlations suggest that the TAIS does not
exhibit good discriminant validity. Additionally, an exploratory analysis was performed
in order to test the convergent validity of the TAIS. Comparisons of the 12 TAIS items,
six TAIS subscales, and the TAIS Total with the subsections and totals of the Digit Span,
VSAT, and SCAN show that the only notable relationships exist between Digits Forward
45
and the TAIS Item 5, the TAIS Item 10, and the BET scale. Given such limited positive
findings, it is suggested that the TAIS exhibits poor convergent validity.
Explanations for Findings
Results suggest that the TAIS functions as a poor predictor of performance on the
Digit Span, VSAT, and SCAN. Based on these findings, it is argued that the TAIS short
form does not reflect selective attention skills. The ineffectiveness of the TAIS items,
subscales, and Total sum as attentional measures also explains the lack of a relationship
between each of these variables and the Digit Span, VSAT, and SCAN. Notable
relationships found between Digits Forward and Item 5, Item 10 and the BET are the only
which suggest that the TAIS exhibits any convergent validity. However, these
relationships are modest in strength and few in number relative to the correlations
calculated to test the convergent validity of the TAIS. They are therefore deemed
negligible. In considering an explanation for the poor predictive power and poor
convergent validity of the TAIS, there is the possibility that the majority of the items are
not truly relevant to attention. There is also the possibility that the limitation lies in meta-
attention, or our willingness and/or ability to accurately and subjectively assess our own
attentional skills. Finally, a combination of these factors could be contributing to the
ineffectiveness of the measure.
In addition to issues of predictive power and convergent validity, there is the issue
of the TAIS discriminant validity. The several high interscale correlations (measurement
redundancy) of the six TAIS subscales indicates that the scales do not measure six
conceptually distinct components of attention. Based on these findings, use of the TAIS
46
subscales is likely to be misleading. Inaccuracy may be due to theoretical flaws in
conceptualizing the functioning of attention. Other potential explanations include poorly
designed questions and/or difficulties with subjective evaluation of attention, as well as
the fact that the short form subscales are comprised of only two items each.
Also of concern is the TAIS internal consistency reliability. In examining the
individual items of the TAIS, the strong internal consistency of the TAIS suggests that
the TAIS items measure a single construct. Given these findings and the poor predictive
power and convergence of the TAIS items, subscales, and total with performance tests of
selective attention, the question then becomes what, in fact, is the TAIS short form
measuring? Most likely, the above findings suggest that the TAIS measures consistent
yet inaccurate subjective perceptions of attentional skills across a variety of situations.
The discussion that follows involves findings related to the SCAN. The fact that
the relationships between the SCAN-W/O and the VSAT Left, Right, and Total were not
meaningful indicate that the SCAN-W/O does not measure attention. However,
relationships (or those approaching relationships of minimal strength) were found
between the SCAN-W and the VSAT Left, Right, and Total, and between the SCAN
Total and VSAT Left, Right, and Total. These findings suggest that a relationship does
exist between the two measures, and is largely explained by the fact that both measures
are timed search and cancellation tasks requiring rapid performance and similar focus of
selective attention. The modest strength of the relationship between the VSAT and the
SCAN subsections and totals is best explained by differences in completion of the
measures.
47
As explained earlier, the VSAT requires the search and cancellation of random
target letters or symbols which have no meaning in the context of the testing situation.
Consequently, cognitive effort is focused only on attending to the presence of the targets
and not on the processing and memorization of the information conveyed by the targets.
During the SCAN, however, the targets being found and canceled off are meaningful
within the context of the testing situation as there is a correct order by which to ascend
the numbers. Adequate completion of the SCAN therefore involves sequential
processing of each number as it is found and canceled off.
In addition to sequential processing, there is also the issue of memory. Limited
memory is required on the VSAT to remember which symbol to cancel off for each of the
four VSAT sections, particularly because a free-standing sample of the target symbol is
easily viewed at the top of the page and because the target symbol remains consistent
within each respective section. Conversely, a great deal more memory is required by
both sections of the SCAN to remember the changing numbers as they are found,
processed, canceled off, placed in memory, found, processed, canceled off, placed in
memory, and so on. Incorporation of these other cognitive functions (sequential
processing and memory) is a potential explanation for the present yet limited relationship
between the two measures. While such requirements do not invalidate the potential
utility of the measure as a whole, they likely make the SCAN a less effective predictor of
attention.
The presence of relationships (or those approaching minimal strength) between
the SCAN-W/O and Digit Span Backward and Total as well as between the SCAN Total

48
and Digit Span Total can be explained by the fact that the Digit Span also demands
selective attention. There is also a memory component to both conditions of the Digit
Span task. As stated earlier, while the Digits Forward requires rote memory, Digits
Backward requires working memory in order to hold a string of numbers in memory and
manipulate it. The memory skills used to complete Digit Span may be similar to those
used during the SCAN to hold a number in memory while searching for the next number,
and may help explain the existence of a relationship between the two measures.
However, it is likely that these relationships are only of limited strength because, unlike
the SCAN, Digit Span is not timed and requires auditory attention rather than visual
attention.
The relationship between the SCAN and each of these well established attentional
measures is the first indication that the SCAN does measure attention. It is important to
note that the SCAN exhibited a much stronger relationship to both the VSAT and Digit
Span than the VSAT and Digit Span exhibited toward one another. This finding is
surprising given that both the Digit Span and the VSAT are considered effective
measures of attention. It is suggested that the strength of the SCAN/VSAT and
SCAN/Digit Span relationships receive careful consideration despite their modest
strength, particularly when compared to the nonexistent relationship between the VSAT
and Digit Span.
Additionally, although the SCAN-W and SCAN-W/O are involved in the above
relationships, SCAN Total appears to be the most consistent measure of the three
(SCAN-W, SCAN-W, and SCAN Total). It may be the case that one condition of the

49
SCAN is not enough to use as an accurate measure of attention. Instead, the SCAN Total
may be a more valid indicator because it represents the sum of SCAN-W and SCAN-
W/O and data collected across both conditions may allow for a more accurate
quantification of attentional skills.
Factor analysis lends further evidence to the effectiveness of the SCAN as an
attentional measure. Exploratory factor analysis suggested that the three performance
measures of the present study represent three different constructs. When restricted to one
factor, however, the results suggest that the three measures represent one common
construct. The combination of these findings suggest that the Digit Span, the VSAT, and
the SCAN measure three distinct constructs in addition to one general, common
construct. Based on the tasks required to complete each of these measures, selective
attention appears to be the one cognitive skill demanded by each measure. Therefore, the
common construct defined by the Digit Span, VSAT, and SCAN is arguably attention.
The above discussion on the different cognitive skills required to complete the three
measures best explains findings that the VSAT is the measure most closely associated
with attention, followed in succession by the SCAN and the Digit Span.
Finally, explanations are given related to analyses intended to investigate internal
aspects of the SCAN. The finding that the SCAN-W and SCAN-W/O are equal in terms
of variability suggests that the auditory distracter presented during the SCAN-W was not
salient enough to distract participants and effect a difference in performance. The good
alternate forms reliability found during the alternate forms reliability pilot study is
attributable to the similarity of the SCAN forms. While the numbers are arranged
50
differently on the two matrices, forms A and B of the SCAN are similar in terms of the
directions given, the numbers presented, the font size used, the appearance of cells in the
number matrices, and the placement of the number matrices on the paper. As a result of
such similarities and the fact that attentional abilities are likely to be relatively constant in
a short interval such as the time required for completion of the SCAN, participants are
likely to perform similarly from one form to the next.
Integration of Findings With Past Literature
To date, there is no known mention of the TAIS short form in the scientific
literature. Therefore, it is necessary to compare the short form data with previous studies
on the TAIS long form. Much like research by Turner and Gilliland (1977), the present
study found that few relationships exist between the six attentional scales of the TAIS
and the Forward, Backward, and Total scores of Digit Span; the one exception being the
present findings of a positive relationship between Digits Forward and the BET. The
findings are consistent with those of Summers and Ford (1990) who found the TAIS to be
a poor predictor of performance on tasks requiring focused attention. Present findings of
poor discriminant validity of the TAIS subscales also corroborates past research by Ford
and Summers (1992) whose investigation yielded similar results. Finally, Reisberg &
McLean (1985) found that subjective ratings of attention are typically inaccurate as
participants often exhibit difficulty in the task of effective self-monitoring. Such findings
are consistent with the finding that the TAIS short form exhibits poor convergent validity,
suggesting that participants’ subjective ratings of attention are unrelated to their actual
attentional abilities.

51
In terms of findings with the SCAN, Woodworth (1938; cited in Reisberg &
McLean, 1985) found that auditory distracters were typically not effective in distracting
participants, particularly if such distracters were intended to be obnoxious or shocking
rather than attractive or interesting. Reisberg and McLean (1985) found that participants
could even overcome the more attractive and interesting distracters if so motivated.
While the content of the auditory distracter included in the SCAN-W condition of the
present study largely involved comedy, the comedic content was presented in what some
may consider to be a fairly annoying and obnoxious fashion, (with a voice simultaneously
reading random numbers in the background, the interjection of several sound effects, and
an occasional attempt by the comedic voice to address the participants directly in an
attempt to distract them). Consequently, it is possible that the ineffectiveness of the
SCAN-W may be attributable to this obnoxious presentation and/or may be explained by
a high level of motivation. This finding is of particular interest as little attention has been
given to the effects of distraction (Reisberg & McLean, 1985). No other past information
relates to the SCAN as it is a previously unresearched measure.
Finally, similar to the explanation made by Watson, Clark, and Tellegen (1988)
that PA is positively associated with attentiveness, the present study found a positive
relationship between PA and Digit Span. Of course, this finding is not surprising given
the literature mentioned earlier indicating that high levels of depression relate to low
levels of attention (Brown, Scott, Bench, and Dolan, 1994). Intuitively, it is logical that
if negative affect is associated with poor attention, positive affect is likely to be
associated with good attention.
52
Implications of Findings
The implications of the present study are focused on the TAIS short form and the
SCAN. Given its questionable predictive power for performance measures of attention,
poor convergent validity and poor subscale discriminant validity, extreme caution is
recommended when considering the TAIS short form for use in either applied or research
settings. Limitations of the SCAN include the finding that the SCAN task, in addition to
attention, also requires a high degree of sequential processing and memory. The two
forms of the test examined also exhibited only fairly strong alternate forms reliability,
and the auditory distracter condition did not distract participants enough to influence
performance. Nonetheless, the data collected on the SCAN suggest that it is likely to be a
useful measure in the assessment of selective attention as there is evidence of a moderate
relationship with well validated measures that appear to measure a common general
construct. Specifically within the SCAN, the SCAN Total score appears to offer the most
accurate information related to attention skills.
Limitations
The limitations of the present study are noteworthy. First, it is important to assess
the generalizability of the present study with caution, given that the sample population
used was limited to college students, most of whom were taking at least one course in
psychology. The generalizability of the present study is also restricted by the fact that
there were decidedly more female participants than male participants in both the primary
study and the pilot study, and the majority of participants fell within a highly confined
age range of 20 to 23 years old.

53
In addition, group administration of the Digit Span was often problematic.
Participants regularly had difficulty following directions correctly, and this is likely
attributable to the adapted directions of the measure that required participants to answer
in written form. On Digits Backward, participants often responded by writing the string
of numbers in forward sequence but in right to left order (starting on the right side of the
page and ending on the left). On Digits Forward, participants occasionally recorded each
digit as it was read instead of waiting as directed for completion of the entire string.
Unfortunately, much of the data collected on Digit Span was omitted from statistical
analyses because of these errors.
Such problems were noted early on in the data collection process of the study,
after which time experimenters were instructed to clarify instructions on correct
completion of the Digit Span and answer any questions necessary. This intervention may
have reduced standardization of experimental administration slightly, but seemed
necessary in the interest of collecting useful data. Unfortunately, the added instructions
were not found to be particularly helpful in this effort. Also largely unstandardized was
the posture of experimenters during administration of experimental groups, as some
experimenters chose to stand while others chose to sit. Such differences in posture may
have had an effect on performance in those participants concerned with evaluation or
experiencing feelings of self-consciousness or performance anxiety.
During the administration of experimental groups, group size varied between two
and five participants and it is possible that such variation in group size could have
affected performance. Average group size tended to increase toward the end of the
54
semester of data collection. Also, participants sometimes laughed out loud in response to
the auditory distracter condition of the SCAN, which may have affected the ability of
other participants in the room to maintain their attention on the task at hand. It should
also be noted that the present study did not take color-blindness into account. This
information would have been useful as performance on the two matrices used for scoring
the VSAT partially depends upon the ability to accurately perceive the color of the target.
Finally, a potentially significant variable that was not specifically taken into account was
level of autonomic arousal.
Future Directions
Because the construct of attention is such an integral component of our cognitive
abilities, there are a variety of possibilities for future directions in research and the list
presented here is by no means considered exhaustive. As the findings on the TAIS short
form are not particularly promising, no suggestions are made for its future use in applied
settings. However, replication studies may allow for a more viable argument regarding
the TAIS short form’s utility. Furthermore, measuring the relationship between the TAIS
short form and similar self-report measures may lend valuable information to such an
argument.
Future directions with the SCAN may include further development of the
measure. Minor adaptations of the task involved, the stimuli, and/or the auditory
distracter may prove to make it a more effective measure of attentional skills. A study
that incorporates the SCAN and measures of memory could also help clarify the attention
and memory process components of the SCAN. Other possible directions may be more
55
applied. For example, a study could be designed to determine whether preliminary
administration of the SCAN predicts the effects of subsequently administered relaxation
techniques, such as progressive muscle relaxation or meditation. Conversely, a study
could be devised to determine if relaxation techniques functioned as effective
interventions to improve attention, as measured by the SCAN. It would also be
interesting to determine whether or not performance on the SCAN is associated with
performance on a sport related task requiring a great deal of concentration, such as
balancing on a beam. Other studies could use the SCAN to measure the degree to which
performance anxiety effects attentional skills. Lastly, it would be interesting to determine
if those psychiatric patients suffering from depression performed differently on the
SCAN as compared to those suffering from schizophrenia, given that schizophrenia is
typically associated with a higher level of distractibility (Mialet, Pope, & Yurgelun-Todd,
1996).
While the construct of attention is complex and difficult to operationalize, it
remains a process central to our daily functioning. Consequently, it is essential to
continue to scientifically investigate attention in order to promote new understanding and
further development of theories which can then hopefully be applied in a meaningful
way. Only through the development of psychometrically sound measures of attention is
such research possible. The present study was devoted to the development and
evaluation of such measures and the data are particularly interesting due to their
exploratory nature. Despite some methodological limitations, sound evidence in the
56
present study questions the utility of the TAIS short form. Concrete data suggest that the
use of the SCAN as an attentional measure warrants further examination.

57
APPENDIX A
The Sign-up Notice

58
Extra Credit?
If you are interested in receiving 2 extra credit for your undergraduate psychologycourses, this may be a good opportunity for you. Get a taste of what it’s like to doresearch by becoming a participant in a study on concentration and attention. Thewhole process takes less than an hour! In order to qualify for the study, you must:
-be between the ages of 20 and 29
-be right-handed
-consider English your first language
-not have a history of hearing problems, neurological difficulties, or physicalhandicaps
-not have received a diagnosis of a learning disability, attentiondeficit/hyperactivity disorder, or psychiatric illnesses
If you are interested, please write your name and phone number, or your name ande-mail address, on the following sheet of rowed lines. You will be contacted forscheduling a time to participate.

59
APPENDIX B
Informed Consent
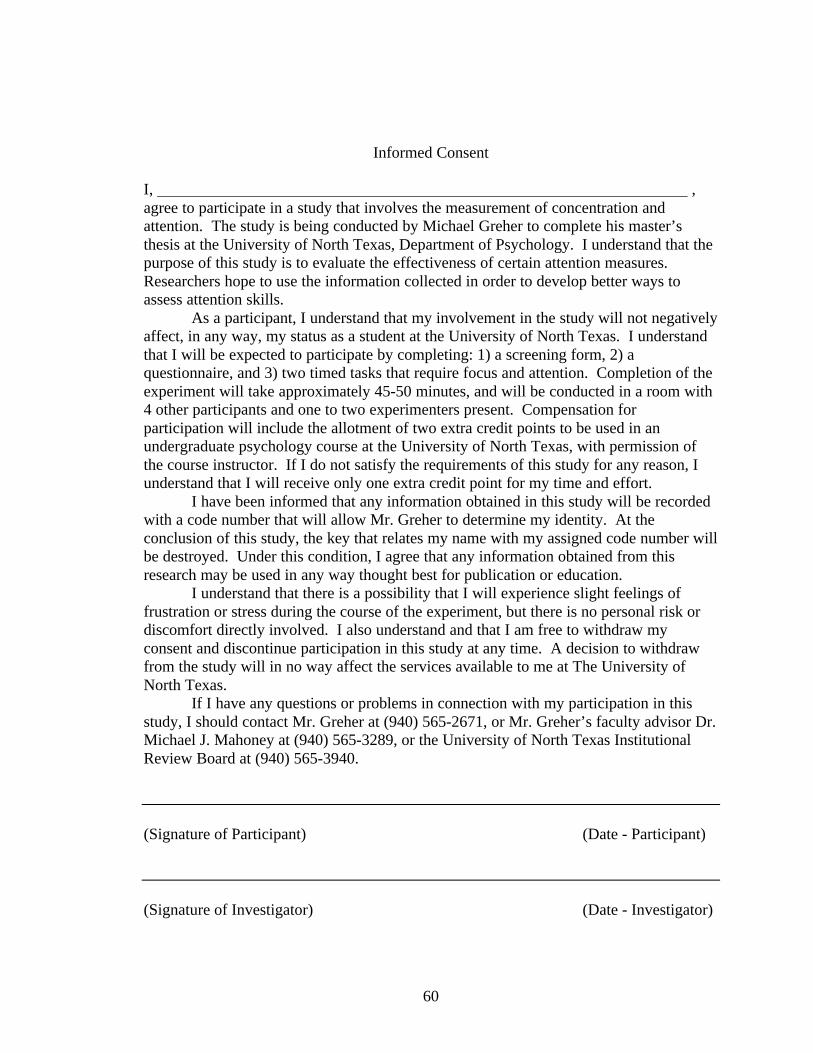
60
Informed Consent
I, ,agree to participate in a study that involves the measurement of concentration andattention. The study is being conducted by Michael Greher to complete his master’sthesis at the University of North Texas, Department of Psychology. I understand that thepurpose of this study is to evaluate the effectiveness of certain attention measures.Researchers hope to use the information collected in order to develop better ways toassess attention skills.
As a participant, I understand that my involvement in the study will not negativelyaffect, in any way, my status as a student at the University of North Texas. I understandthat I will be expected to participate by completing: 1) a screening form, 2) aquestionnaire, and 3) two timed tasks that require focus and attention. Completion of theexperiment will take approximately 45-50 minutes, and will be conducted in a room with4 other participants and one to two experimenters present. Compensation forparticipation will include the allotment of two extra credit points to be used in anundergraduate psychology course at the University of North Texas, with permission ofthe course instructor. If I do not satisfy the requirements of this study for any reason, Iunderstand that I will receive only one extra credit point for my time and effort.
I have been informed that any information obtained in this study will be recordedwith a code number that will allow Mr. Greher to determine my identity. At theconclusion of this study, the key that relates my name with my assigned code number willbe destroyed. Under this condition, I agree that any information obtained from thisresearch may be used in any way thought best for publication or education.
I understand that there is a possibility that I will experience slight feelings offrustration or stress during the course of the experiment, but there is no personal risk ordiscomfort directly involved. I also understand and that I am free to withdraw myconsent and discontinue participation in this study at any time. A decision to withdrawfrom the study will in no way affect the services available to me at The University ofNorth Texas.
If I have any questions or problems in connection with my participation in thisstudy, I should contact Mr. Greher at (940) 565-2671, or Mr. Greher’s faculty advisor Dr.Michael J. Mahoney at (940) 565-3289, or the University of North Texas InstitutionalReview Board at (940) 565-3940.
(Signature of Participant) (Date - Participant)
(Signature of Investigator) (Date - Investigator)

61
APPENDIX C
Screening Form
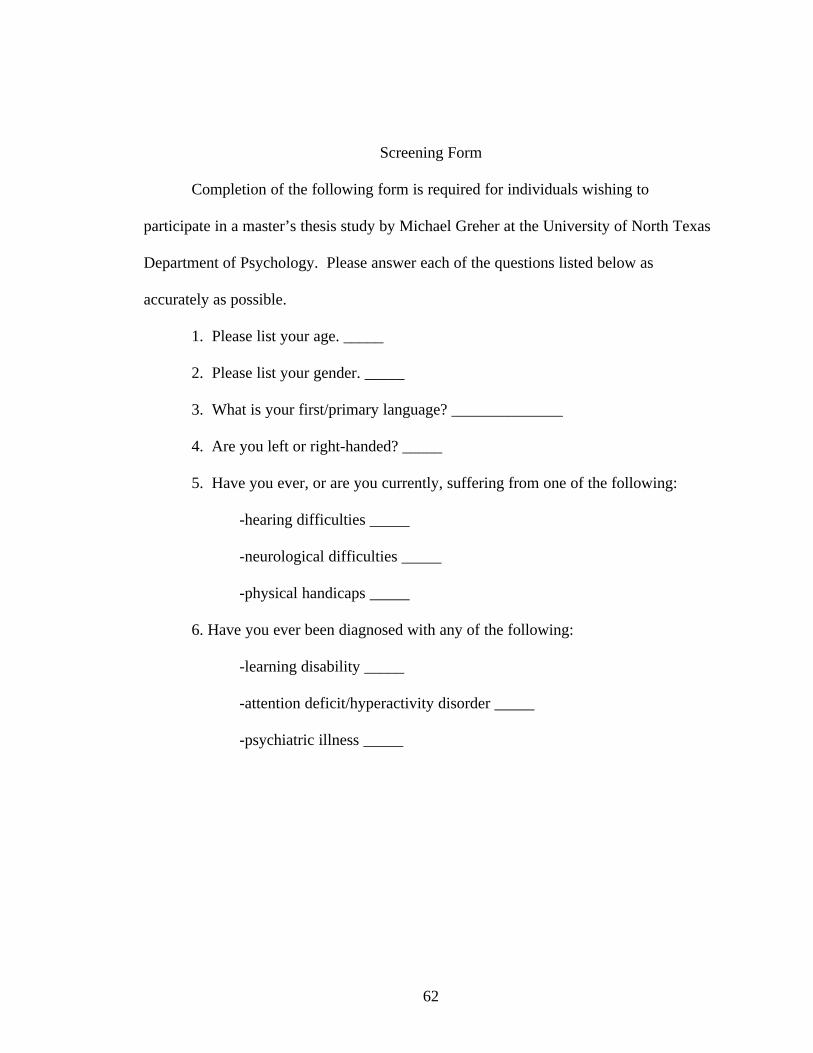
62
Screening Form
Completion of the following form is required for individuals wishing to
participate in a master’s thesis study by Michael Greher at the University of North Texas
Department of Psychology. Please answer each of the questions listed below as
accurately as possible.
1. Please list your age. _____
2. Please list your gender. _____
3. What is your first/primary language? ______________
4. Are you left or right-handed? _____
5. Have you ever, or are you currently, suffering from one of the following:
-hearing difficulties _____
-neurological difficulties _____
-physical handicaps _____
6. Have you ever been diagnosed with any of the following:
-learning disability _____
-attention deficit/hyperactivity disorder _____
-psychiatric illness _____
63
APPENDIX D
Test of Attentional and Interpersonal Style (Short Form)
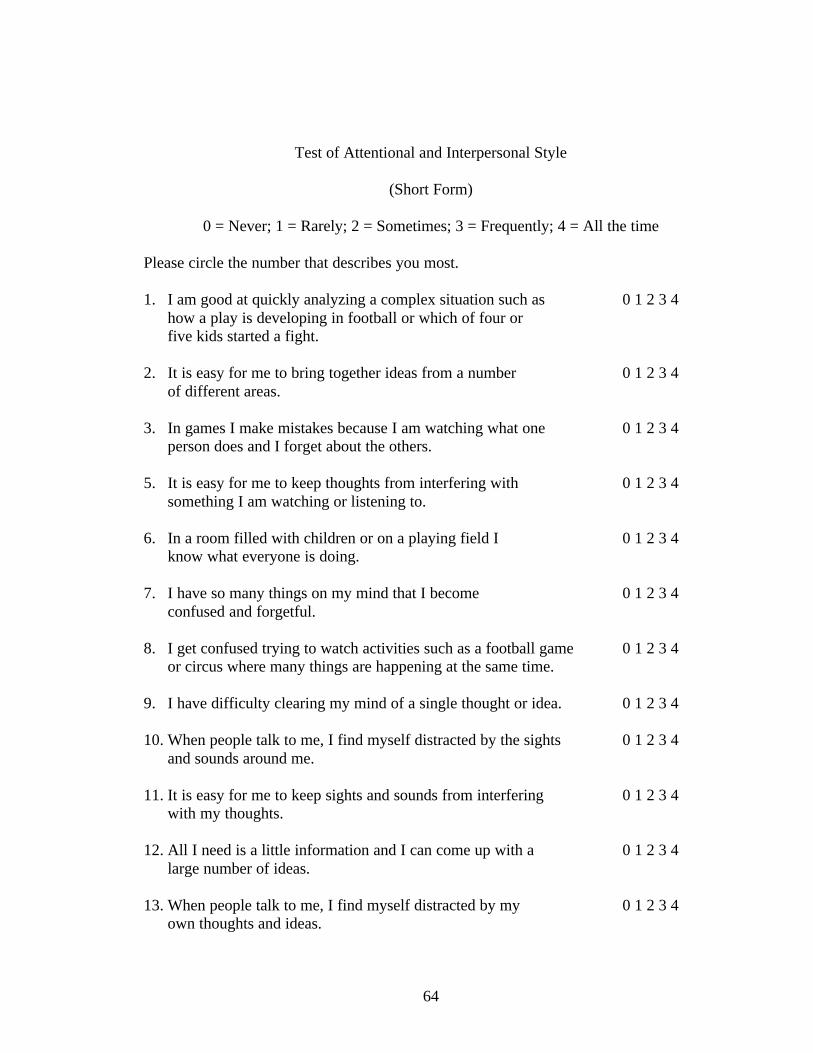
64
Test of Attentional and Interpersonal Style
(Short Form)
0 = Never; 1 = Rarely; 2 = Sometimes; 3 = Frequently; 4 = All the time
Please circle the number that describes you most.
1. I am good at quickly analyzing a complex situation such as 0 1 2 3 4how a play is developing in football or which of four orfive kids started a fight.
2. It is easy for me to bring together ideas from a number 0 1 2 3 4of different areas.
3. In games I make mistakes because I am watching what one 0 1 2 3 4
person does and I forget about the others. 5. It is easy for me to keep thoughts from interfering with 0 1 2 3 4
something I am watching or listening to. 6. In a room filled with children or on a playing field I 0 1 2 3 4
know what everyone is doing. 7. I have so many things on my mind that I become 0 1 2 3 4
confused and forgetful. 8. I get confused trying to watch activities such as a football game 0 1 2 3 4
or circus where many things are happening at the same time. 9. I have difficulty clearing my mind of a single thought or idea. 0 1 2 3 4 10. When people talk to me, I find myself distracted by the sights 0 1 2 3 4
and sounds around me. 11. It is easy for me to keep sights and sounds from interfering 0 1 2 3 4
with my thoughts. 12. All I need is a little information and I can come up with a 0 1 2 3 4
large number of ideas. 13. When people talk to me, I find myself distracted by my 0 1 2 3 4
own thoughts and ideas.

65
APPENDIX E
The Anticipatory Performance Scale
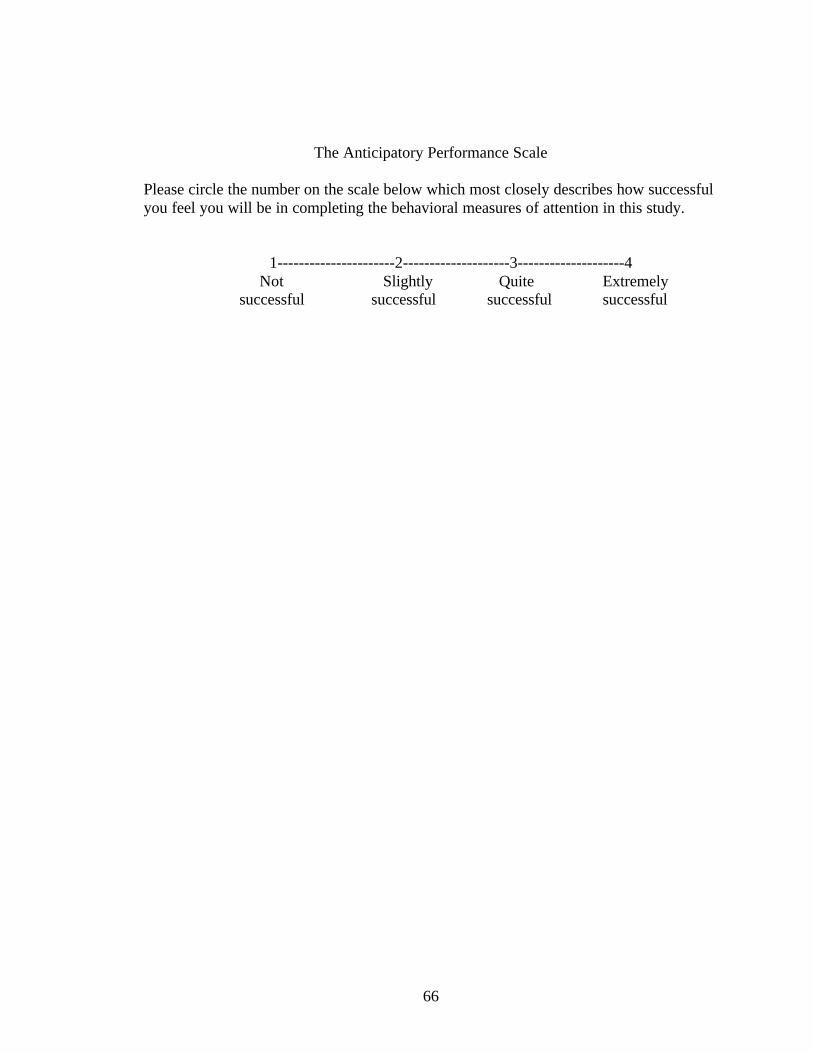
66
The Anticipatory Performance Scale
Please circle the number on the scale below which most closely describes how successfulyou feel you will be in completing the behavioral measures of attention in this study.
1----------------------2--------------------3--------------------4 Not Slightly Quite Extremely
successful successful successful successful

67
APPENDIX F
The Auditory Distraction Scale
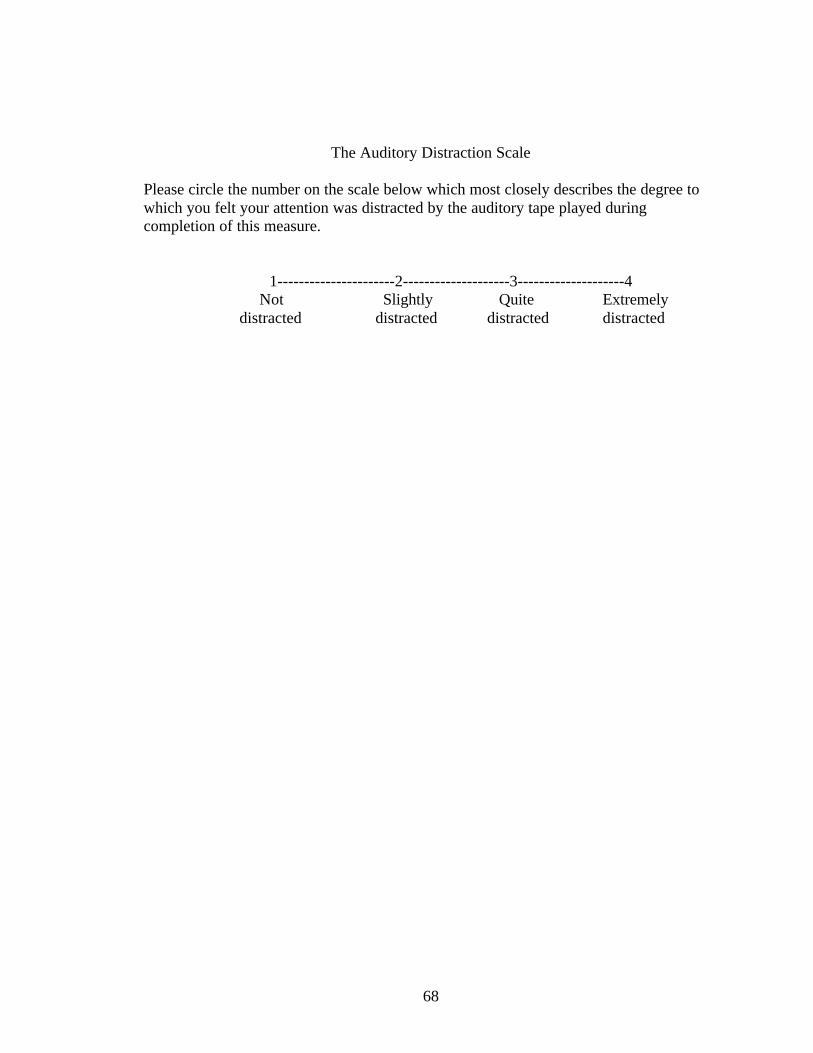
68
The Auditory Distraction Scale
Please circle the number on the scale below which most closely describes the degree towhich you felt your attention was distracted by the auditory tape played duringcompletion of this measure.
1----------------------2--------------------3--------------------4 Not Slightly Quite Extremely
distracted distracted distracted distracted

69
APPENDIX G
Experimental Tape Transcript

70
Experimental Tape Transcript
Form order: The Consent FormThe Screening FormThe Handedness ScaleThe PANASThe Test of Attentional and Interpersonal Style short formThe Anticipatory Performance ScaleThe Digit Span Answer sheets (Part 1 and 2)The VSATThe SCAN (forms A and B)The Auditory Distraction Scale
Introduction
Thank you for coming today. Please open your folders. The first page you see should bea consent form.
Please read this over and if you agree to all the terms, as explained, please sign the format the bottom.
As you know, you will be participating in an experiment that involves measuringattention. The experiment will take close to an hour and you will receive 2 extra creditpoints. Please note that because the experiment requires a lot of concentration, you mayexperience a small amount of psychological stress as a result.
Although we do encourage you to try your best to complete this experiment, you maydiscontinue at any time. If you do, please do not disturb those around you. Please sit inyour seat quietly until everyone else is finished.
Please remember that because this experiment involves the measuring of attention, wewould like you to treat this as if you were taking a real test, such as a college exam. Ourgoal is to have as much silence as possible.
The Screening Form
Please place the consent form under the folder. The next form is a screening form. Theinformation you provide on the form is strictly confidential, so please be as honest aspossible when filling it out. When you are finished, place the forms under the folder.

71
The Hand Preference Questionnaire
The next form in front of you is called The Handedness Preference Questionnaire. Thismeasure gives us an idea as to what degree each of you is right handed. Please read thedirections and fill out the form as accurately as possible.
When you are finished, place the form under the folder.
The PANAS
The next form in front of you is the PANAS. This is a measure used to gain informationregarding your feelings and emotions at the present moment. Please read the directionsand fill out the form as accurately as possible.
When you are finished, place the forms under the folder
Are there any questions before we begin?
The TAIS (Short Form)
The next page you will see is labeled as the Test of Attentional and Interpersonal StyleShort Form. This test is composed of 12 questions concerning your ability to useattentional skills.
The test asks you to evaluate yourself on different areas. Please be as honest as possible.
When marking your answers, note that:1 stands for never2 stands for rarely3 stands for sometimes4 stands for frequently5 stands for all of the time.If you forget what these numbers stand for they are printed on your test.
This test is not timed, so when you're finished put your pencil down to let us know thatyou are done.
Everyone ready, begin.
The duration of your participation in this experiment will require you to perform severaldifferent tasks which require a high level of concentration. Now that we are going tobegin the attention exercises, please remember to be as quiet and as courteous as possible.

72
The Anticipatory of Performance Scale (APS)
Before you begin, we would like you to rate how well you think you will perform onthese tasks. Please read the directions to the Anticipatory Performance Scale andcomplete the form to the best of your ability.
When you are finished please place the form under your folder.
The Digit Span
Part 1—Digits Forward:
The next form you should see in front of you is labeled Digit Span - Part 1 Answer Sheet.For each item I am going to read a series of numbers. Once I have finished reading thelast of each series, you are to write down the numbers from that series in the order I readthem. For example, if I said 1-2-3 for the first item, you would write down 1-2-3 in thefirst long box next to 1A.
Please use the appropriate space on the answer to record this information. Do not concernyourself with the Item numbers (such as Item 1A, or Item 2B). Simply record the firststring of numbers in the first long blank space available, and the second string of numbersin the next space available, and so on. I will give you a 10-15 second break between eachstring of numbers in order to give you time to recall the numbers and write them down.
Are there any questions before we begin? Please make sure that you are looking at theform Digit Span, Part 1.
Ready, here we go.
1. A: 1-7B: 6-3
2. A: 5-8-2B: 6-9-4
3. A: 6-4-3-9B: 7-2-8-6
4. A: 4-2-7-3-1B: 7-5-8-3-6
5. A: 6-1-9-4-7-3B: 3-9-2-4-8-7

73
6. A: 5-9-1-7-4-2-8B: 4-1-7-9-3-8-6
7. A: 5-8-1-9-2-6-4-7B: 3-8-2-9-5-1-7-4
8. A: 2-7-5-8-6-2-5-8-4B: 7-1-3-9-4-2-5-6-8
Please place the sheet labeled Digit Span: Part 1 under your folder. The next form shouldbe Digit Span: Part 2.
Part 2—Digits Backward:
Now I am going to say some more numbers. But this time when I stop, I want you towrite them backward.
For example, if I say 7-1-9, you would write, 9-1-7.
Are there any questions before I begin?
Ready, let’s begin.
1. A: 2-4B: 5-7
2. A: 6-2-9B: 4-1-5
3. A: 3-2-7-9B: 4-9-6-8
4. A: 1-5-2-8-6B: 6-1-8-4-3
5. A: 5-3-9-4-1-8B: 7-2-4-8-5-6
6. A: 8-1-2-9-3-6-5B: 4-7-3-9-1-2-8
7. A: 9-4-3-7-6-2-5-8B: 7-2-8-1-9-6-5-3
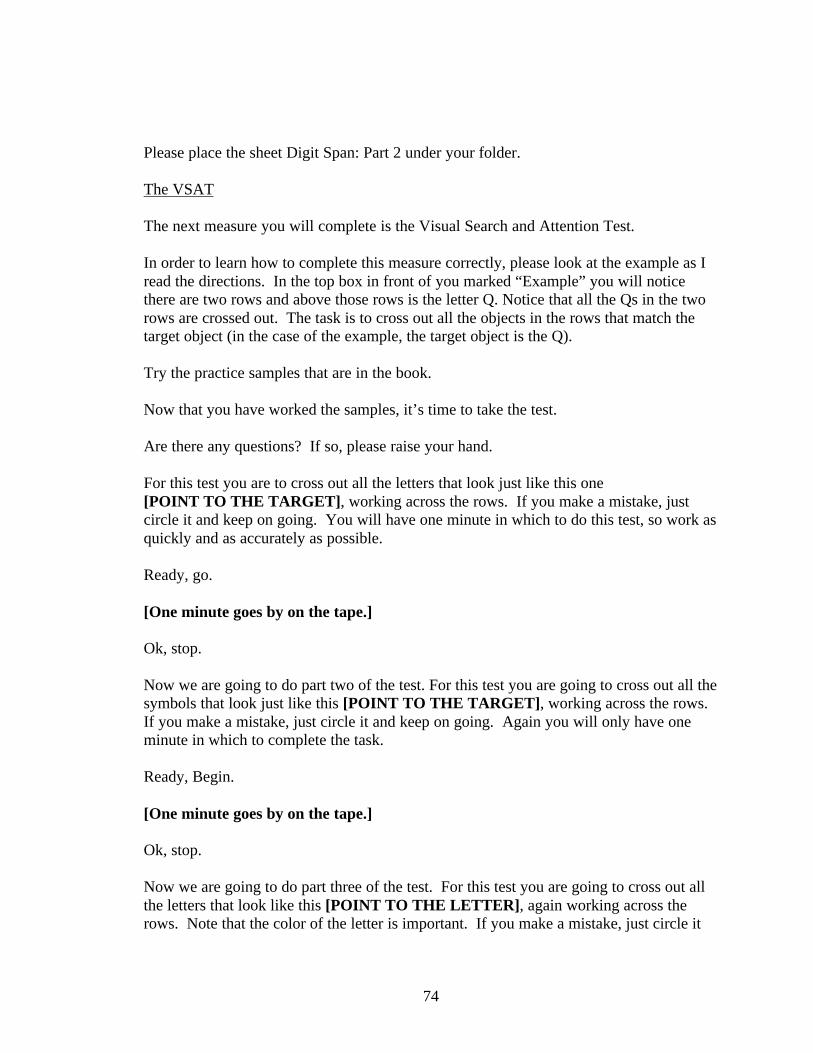
74
Please place the sheet Digit Span: Part 2 under your folder.
The VSAT
The next measure you will complete is the Visual Search and Attention Test.
In order to learn how to complete this measure correctly, please look at the example as Iread the directions. In the top box in front of you marked “Example” you will noticethere are two rows and above those rows is the letter Q. Notice that all the Qs in the tworows are crossed out. The task is to cross out all the objects in the rows that match thetarget object (in the case of the example, the target object is the Q).
Try the practice samples that are in the book.
Now that you have worked the samples, it’s time to take the test.
Are there any questions? If so, please raise your hand.
For this test you are to cross out all the letters that look just like this one[POINT TO THE TARGET], working across the rows. If you make a mistake, justcircle it and keep on going. You will have one minute in which to do this test, so work asquickly and as accurately as possible.
Ready, go.
[One minute goes by on the tape.]
Ok, stop.
Now we are going to do part two of the test. For this test you are going to cross out all thesymbols that look just like this [POINT TO THE TARGET], working across the rows.If you make a mistake, just circle it and keep on going. Again you will only have oneminute in which to complete the task.
Ready, Begin.
[One minute goes by on the tape.]
Ok, stop.
Now we are going to do part three of the test. For this test you are going to cross out allthe letters that look like this [POINT TO THE LETTER], again working across therows. Note that the color of the letter is important. If you make a mistake, just circle it

75
and keep on going. Again, you will have one minute. Work as quickly and as accuratelyas possible.
Ready, Begin.
[One minute goes by on the tape.]
Ok, stop.
Now we are going to do part four of the test. For this test you are to cross out all thesymbols that look just like this [POINT TO THE SYMBOL], working across the rows.Again, color is important. If you make a mistake, just circle it and keep on going. Youwill have one minute in which to complete the test.
Ready, begin.
[One minute goes by on the tape.]
Ok, stop.
That completes the VSAT. Please place the VSAT booklet under your folder.
The SCAN
The next exercise allows you to practice your ability to alternately expand and contractthe band or focal area of your attention. Accompanying this exercise are 2 pages ofnumbers. Each page is given a label of either A or B because the digits on each form arein different positions.
The first form you are to complete is already in front of you. Do not study the page ofnumbers you will be working with. In a moment I will ask you to mark off some of thedigits on it by putting a slash mark through them. Now turn away from the page, get yourpencil ready and listen closely to my instructions. Each page contains ten rows and tencolumns of numbers from 00 through 99. The position of the numbers is randomized andchanges from one form to the next. For this first part of the exercise, I will ask you tosimply begin with the number 00, cross it off, then find and cross off 01, 02, and so onfor as many numbers as you can in sequence. When I tell you to begin, you will havetwo minutes to see how high you can get in the sequence from 00 to 99. Try not to skipany numbers. Also, there will be distractions. Voices will be played announcingnumbers and talking during the two minute interval. If you need to hear theseinstructions again, please request the tape to be rewound. Otherwise, get ready for mysignal to begin the exercise.
76
Ready, begin
[Two minutes go by on the tape.]
Stop. Take a deep breath and relax.
For the second part of this exercise, you will need to place the form that you justcompleted under your folder. Be sure to sure to turn away from the next form as soon asyou have positioned it in front of you. This will prevent you from unconsciously notingthe position of the numbers. You will have 2 minutes to mark off as many numbers asyou can in sequence from 00 to 99. This time however, there will be no distractions. Getready to begin the exercise.
Ready, begin.
[Two minutes go by on the tape.]
Stop. Relax.
Auditory Distraction Scale
We would like to know the degree to which you felt your attention was distracted by thetape that was played during completion of this last measure. Please read the followingform and complete it as accurately as possible.
Once you are done, please place the form under your folder.
Conclusion
The experiment is now over. Please leave your folders where they are and we will comeby and collect them. Thank you for participating.

77
APPENDIX H
Tables

78
Table 1
Descriptive Statistics for the TAIS, Digit Span, VSAT, and SCAN: Subsections,
Subscales, and Totals
N M SD
Digits Forward 84 11.39 2.43
Digits Backward 84 9.05 2.72
Digit Span Total 84 20.44 4.45
VSAT Left 105 81.67 11.48
VSAT Right 105 78.70 11.87
VSAT Total 105 160.13 22.98
SCAN-W 104 18.23 5.68
SCAN-W/O 104 18.18 6.45
SCAN Total 104 36.43 10.36
TAIS-BET 105 4.83 1.35
TAIS-BIT 105 5.15 1.34
TAIS-NAR 104 4.18 1.47
TAIS-OET 105 2.68 1.33
TAIS-OIT 105 3.43 1.36
TAIS-RED 105 3.16 1.35
TAIS Total 104 28.83 5.41
Note. SCAN-W = SCAN With Distracter; SCAN-W/O = SCAN Without Distracter;
TAIS-BET = TAIS Broad External; TAIS-BIT = TAIS Broad Internal; TAIS-NAR =
TAIS Narrow Effective Focus; TAIS-OET = TAIS External Overload; TAIS-OIT =
TAIS Internal Overload; TAIS-RED = TAIS Errors of Underinclusion.

79
Table 2
Descriptive Statistics for Covariates
N M SD
PANAS-PA 105 26.98 7.40
PANAS-NA 105 13.29 3.51
APS 105 2.81 .64
ADS 104 2.31 .76
Note. PANAS-PA = PANAS Positive Affect; PANAS-NA = PANAS Negative Affect;
APS = Anticipatory Performance Scale; ADS = Auditory Distracter Scale.
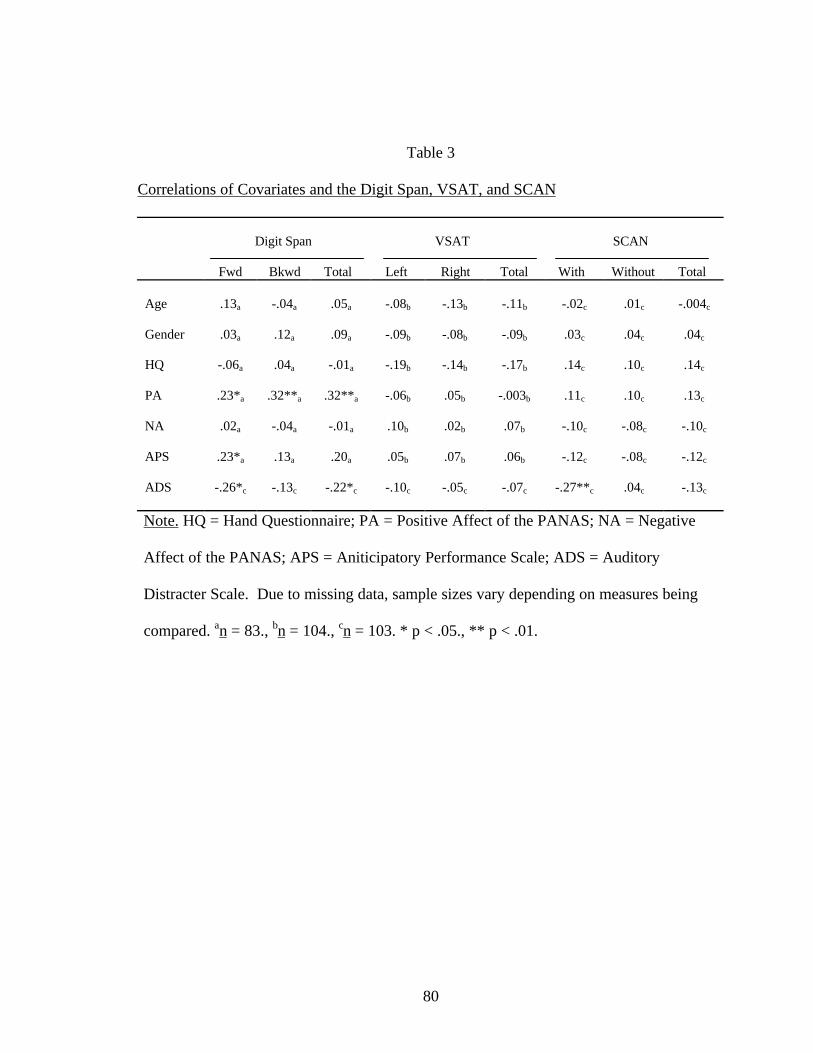
80
Table 3
Correlations of Covariates and the Digit Span, VSAT, and SCAN
Digit Span VSAT SCAN
Fwd Bkwd Total Left Right Total With Without Total
Age .13a -.04a .05a -.08b -.13b -.11b -.02c .01c -.004c
Gender .03a .12a .09a -.09b -.08b -.09b .03c .04c .04c
HQ -.06a .04a -.01a -.19b -.14b -.17b .14c .10c .14c
PA .23*a .32**a .32**a -.06b .05b -.003b .11c .10c .13c
NA .02a -.04a -.01a .10b .02b .07b -.10c -.08c -.10c
APS .23*a .13a .20a .05b .07b .06b -.12c -.08c -.12c
ADS -.26*c -.13c -.22*c -.10c -.05c -.07c -.27**c .04c -.13c
Note. HQ = Hand Questionnaire; PA = Positive Affect of the PANAS; NA = Negative
Affect of the PANAS; APS = Aniticipatory Performance Scale; ADS = Auditory
Distracter Scale. Due to missing data, sample sizes vary depending on measures being
compared. an = 83., bn = 104., cn = 103. * p < .05., ** p < .01.
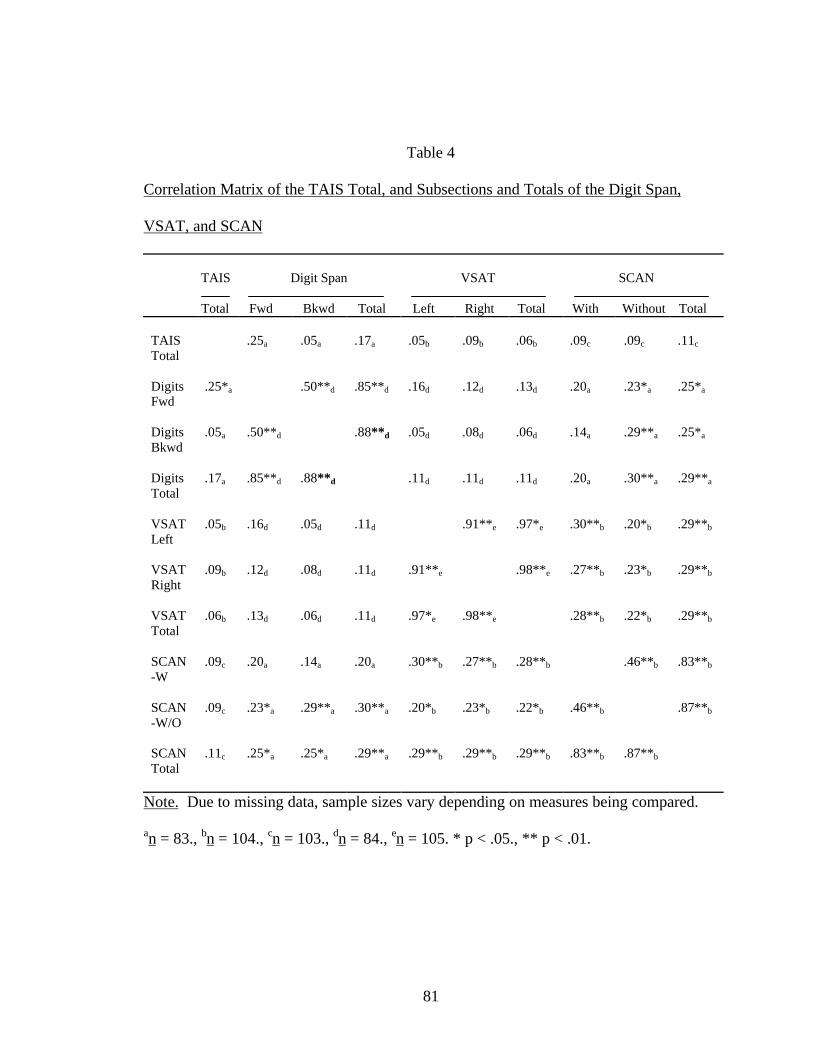
81
Table 4
Correlation Matrix of the TAIS Total, and Subsections and Totals of the Digit Span,
VSAT, and SCAN
TAIS Digit Span VSAT SCAN
Total Fwd Bkwd Total Left Right Total With Without Total
TAISTotal
.25a .05a .17a .05b .09b .06b .09c .09c .11c
DigitsFwd
.25*a .50**d .85**d .16d .12d .13d .20a .23*a .25*a
DigitsBkwd
.05a .50**d .88**d .05d .08d .06d .14a .29**a .25*a
DigitsTotal
.17a .85**d .88**d .11d .11d .11d .20a .30**a .29**a
VSATLeft
.05b .16d .05d .11d .91**e .97*e .30**b .20*b .29**b
VSATRight
.09b .12d .08d .11d .91**e .98**e .27**b .23*b .29**b
VSATTotal
.06b .13d .06d .11d .97*e .98**e .28**b .22*b .29**b
SCAN-W
.09c .20a .14a .20a .30**b .27**b .28**b .46**b .83**b
SCAN-W/O
.09c .23*a .29**a .30**a .20*b .23*b .22*b .46**b .87**b
SCANTotal
.11c .25*a .25*a .29**a .29**b .29**b .29**b .83**b .87**b
Note. Due to missing data, sample sizes vary depending on measures being compared.
an = 83., bn = 104., cn = 103., dn = 84., en = 105. * p < .05., ** p < .01.
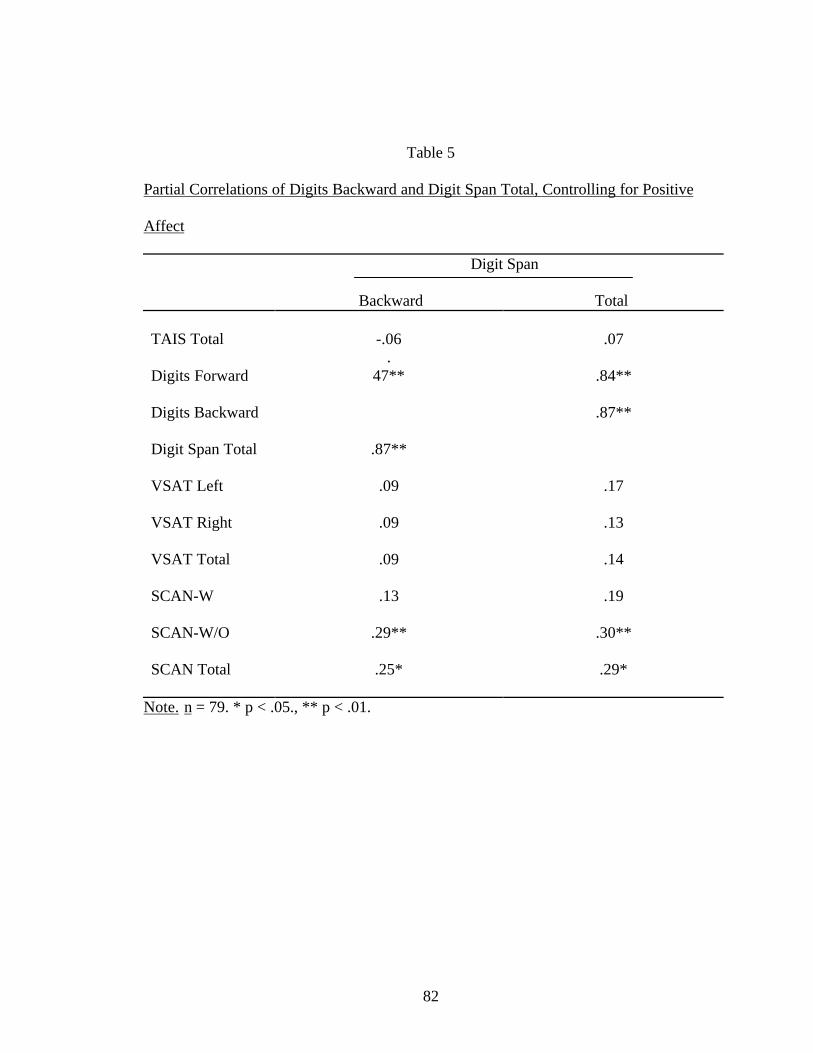
82
Table 5
Partial Correlations of Digits Backward and Digit Span Total, Controlling for Positive
Affect
Digit Span
Backward Total
TAIS Total -.06 .07
Digits Forward.
47** .84**
Digits Backward .87**
Digit Span Total .87**
VSAT Left .09 .17
VSAT Right .09 .13
VSAT Total .09 .14
SCAN-W .13 .19
SCAN-W/O .29** .30**
SCAN Total .25* .29*
Note. n = 79. * p < .05., ** p < .01.
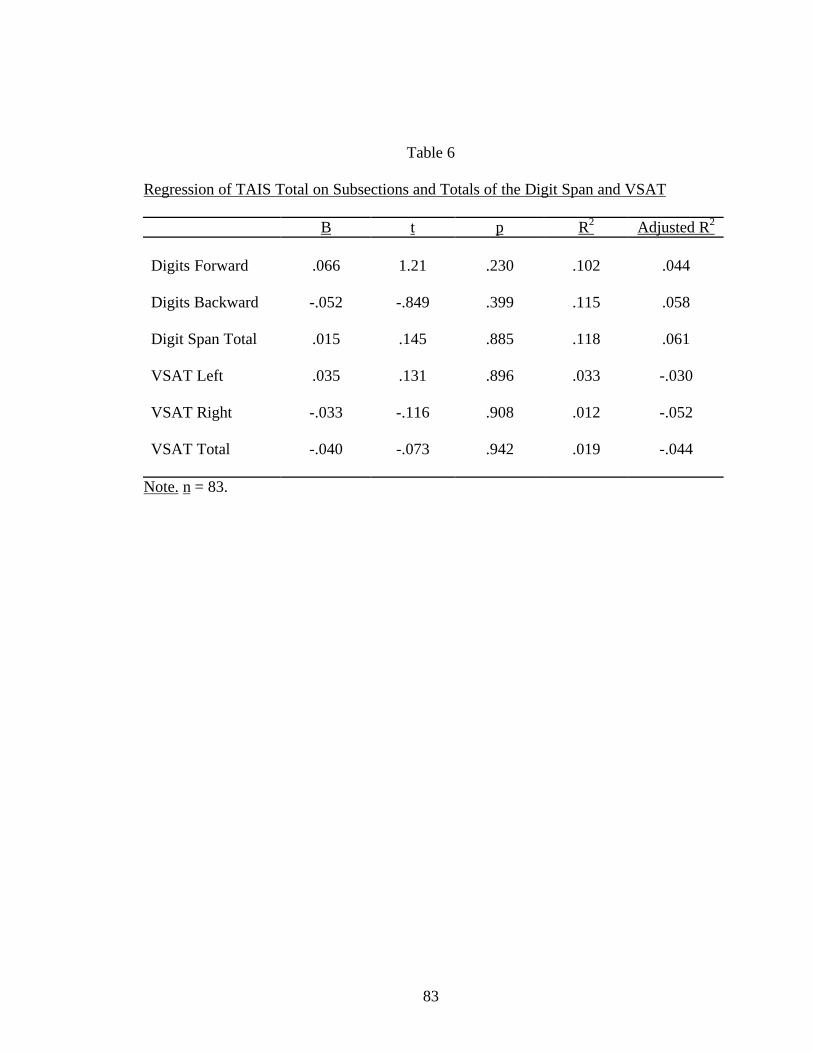
83
Table 6
Regression of TAIS Total on Subsections and Totals of the Digit Span and VSAT
B t p R2 Adjusted R2
Digits Forward .066 1.21 .230 .102 .044
Digits Backward -.052 -.849 .399 .115 .058
Digit Span Total .015 .145 .885 .118 .061
VSAT Left .035 .131 .896 .033 -.030
VSAT Right -.033 -.116 .908 .012 -.052
VSAT Total -.040 -.073 .942 .019 -.044
Note. n = 83.
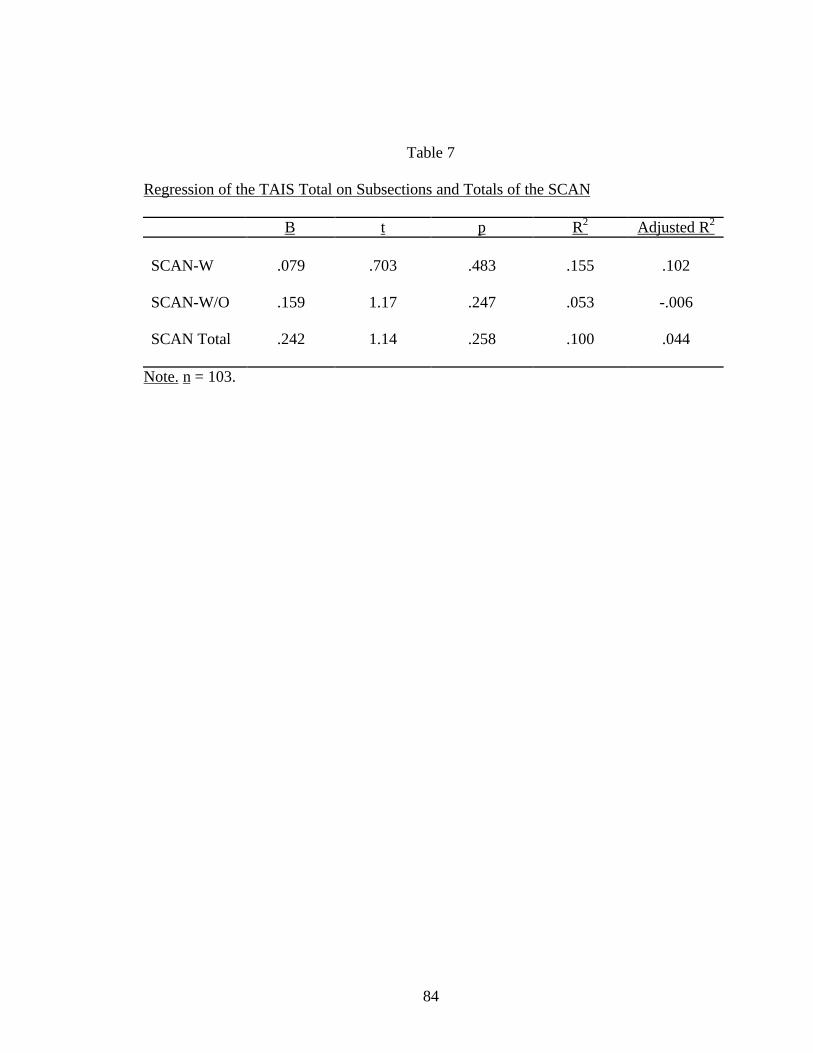
84
Table 7
Regression of the TAIS Total on Subsections and Totals of the SCAN
B t p R2 Adjusted R2
SCAN-W .079 .703 .483 .155 .102
SCAN-W/O .159 1.17 .247 .053 -.006
SCAN Total .242 1.14 .258 .100 .044
Note. n = 103.

85
Table 8
Internal Consistency Reliability of the TAIS Short Form
Item
1 2 3 4 5 6 7 8 9 10 11
Item 1
Item 2 .26
Item 3 -.02 .05
Item 4 .13 .28 .16
Item 5 .21 .19 .02 .27
Item 6 .17 .15 .32 .27 .36
Item 7 .11 .08 .36 .16 -.04 .43
Item 8 .16 .16 .20 .21 .08 .32 .26
Item 9 .08 .17 .29 .34 .12 .42 .38 .40
Item 10 .19 .29 .05 .38 .30 .34 .17 .31 .51
Item 11 .28 .49 .15 .15 .24 .12 .31 .13 .06 .27
Item 12 -.07 .15 .14 .27 .18 .26 .12 .39 .41 .30 .07
Note. α = .77. n = 104.
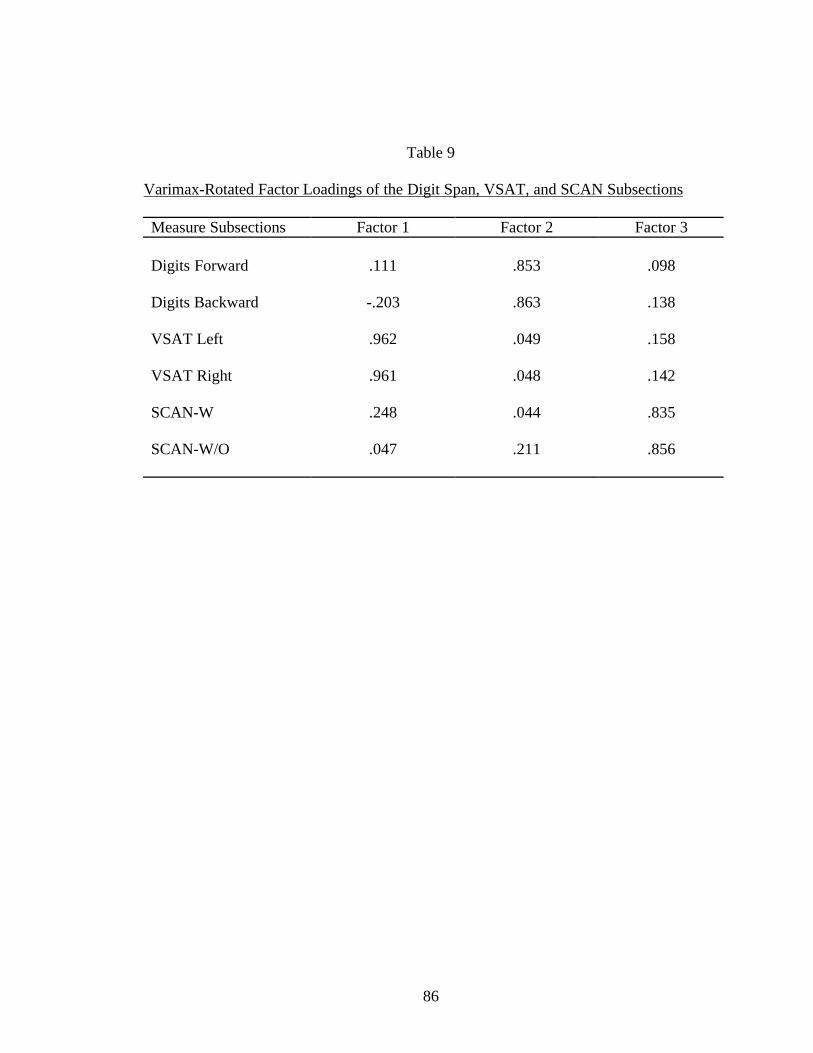
86
Table 9
Varimax-Rotated Factor Loadings of the Digit Span, VSAT, and SCAN Subsections
Measure Subsections Factor 1 Factor 2 Factor 3
Digits Forward .111 .853 .098
Digits Backward -.203 .863 .138
VSAT Left .962 .049 .158
VSAT Right .961 .048 .142
SCAN-W .248 .044 .835
SCAN-W/O .047 .211 .856
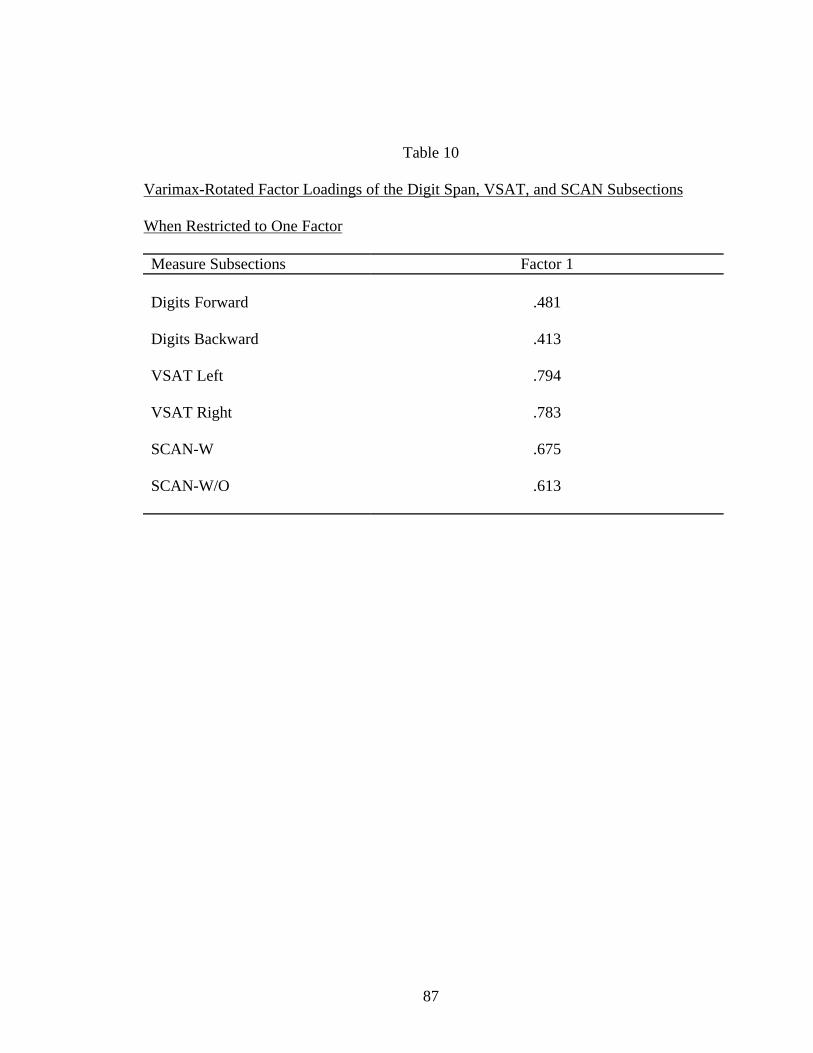
87
Table 10
Varimax-Rotated Factor Loadings of the Digit Span, VSAT, and SCAN Subsections
When Restricted to One Factor
Measure Subsections Factor 1
Digits Forward .481
Digits Backward .413
VSAT Left .794
VSAT Right .783
SCAN-W .675
SCAN-W/O .613

88
Table 11
Descriptive Statistics of the SCAN-W and SCAN-W/O
N M SD ŝ2
SCAN-W 104 18.23 5.68 32.24
SCAN-W/O 104 18.18 6.45 41.55
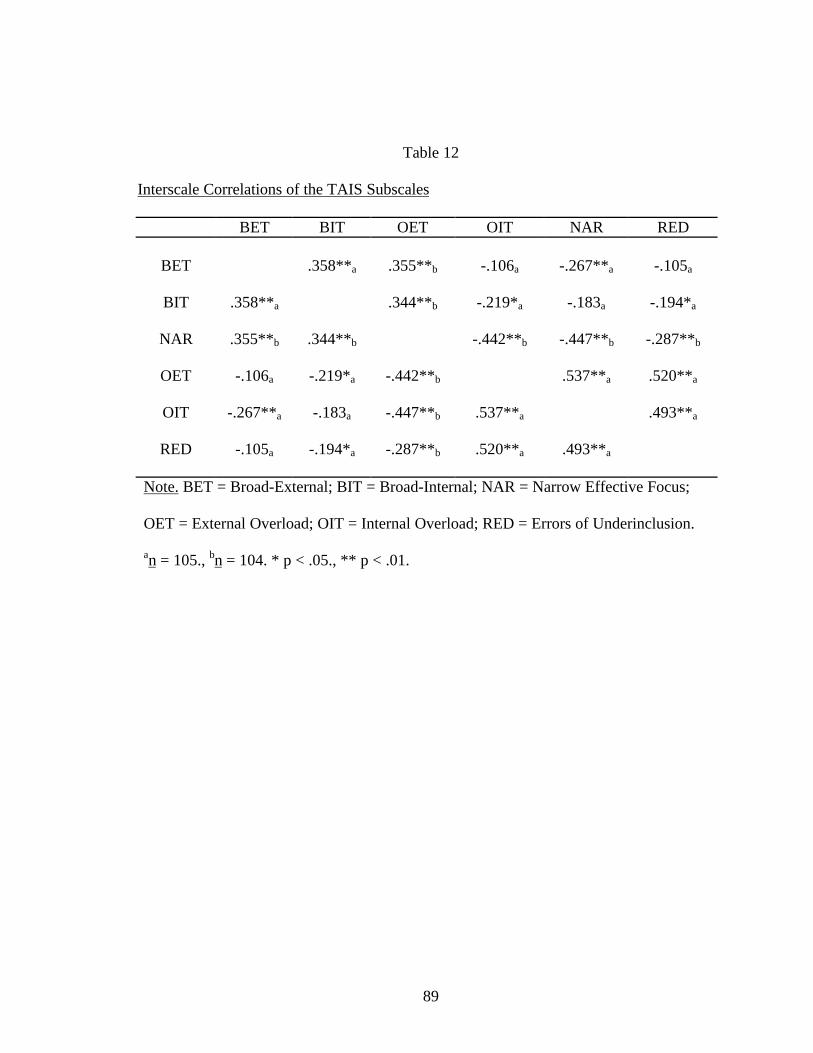
89
Table 12
Interscale Correlations of the TAIS Subscales
BET BIT OET OIT NAR RED
BET .358**a .355**b -.106a -.267**a -.105a
BIT .358**a .344**b -.219*a -.183a -.194*a
NAR .355**b .344**b -.442**b -.447**b -.287**b
OET -.106a -.219*a -.442**b .537**a .520**a
OIT -.267**a -.183a -.447**b .537**a .493**a
RED -.105a -.194*a -.287**b .520**a .493**a
Note. BET = Broad-External; BIT = Broad-Internal; NAR = Narrow Effective Focus;
OET = External Overload; OIT = Internal Overload; RED = Errors of Underinclusion.
an = 105., bn = 104. * p < .05., ** p < .01.
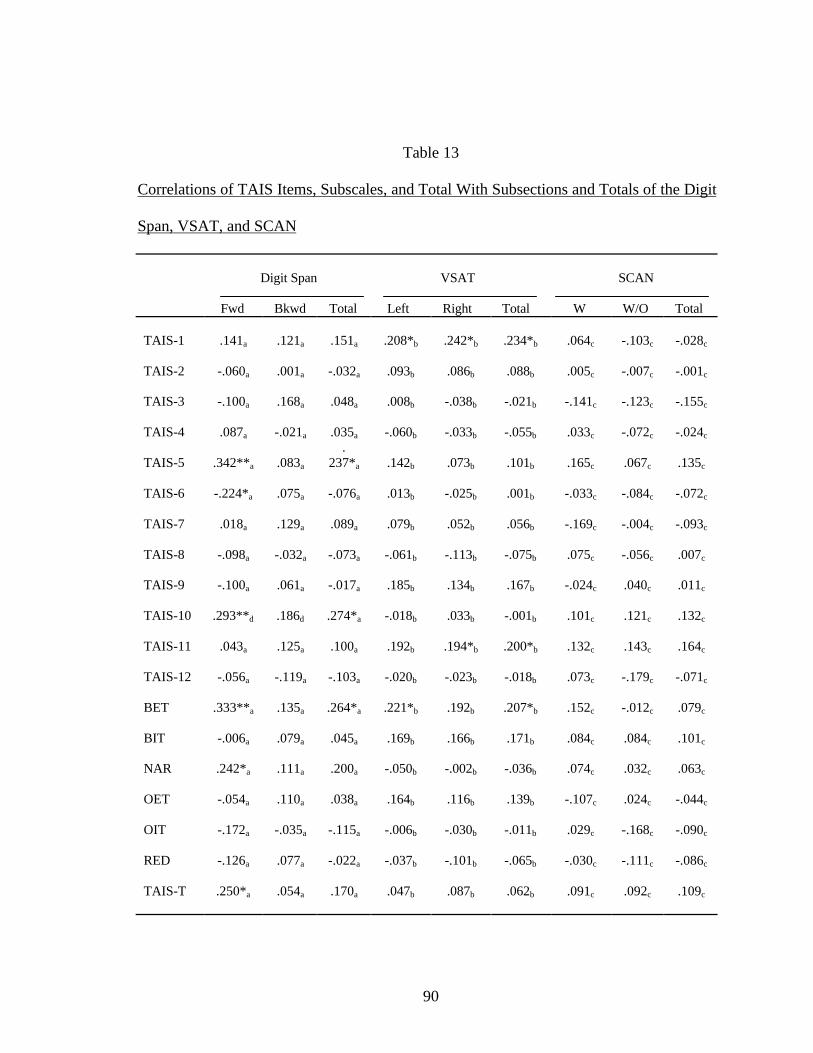
90
Table 13
Correlations of TAIS Items, Subscales, and Total With Subsections and Totals of the Digit
Span, VSAT, and SCAN
Digit Span VSAT SCAN
Fwd Bkwd Total Left Right Total W W/O Total
TAIS-1 .141a .121a .151a .208*b .242*b .234*b .064c -.103c -.028c
TAIS-2 -.060a .001a -.032a .093b .086b .088b .005c -.007c -.001c
TAIS-3 -.100a .168a .048a .008b -.038b -.021b -.141c -.123c -.155c
TAIS-4 .087a -.021a .035a -.060b -.033b -.055b .033c -.072c -.024c
TAIS-5 .342**a .083a
.237*a .142b .073b .101b .165c .067c .135c
TAIS-6 -.224*a .075a -.076a .013b -.025b .001b -.033c -.084c -.072c
TAIS-7 .018a .129a .089a .079b .052b .056b -.169c -.004c -.093c
TAIS-8 -.098a -.032a -.073a -.061b -.113b -.075b .075c -.056c .007c
TAIS-9 -.100a .061a -.017a .185b .134b .167b -.024c .040c .011c
TAIS-10 .293**d .186d .274*a -.018b .033b -.001b .101c .121c .132c
TAIS-11 .043a .125a .100a .192b .194*b .200*b .132c .143c .164c
TAIS-12 -.056a -.119a -.103a -.020b -.023b -.018b .073c -.179c -.071c
BET .333**a .135a .264*a .221*b .192b .207*b .152c -.012c .079c
BIT -.006a .079a .045a .169b .166b .171b .084c .084c .101c
NAR .242*a .111a .200a -.050b -.002b -.036b .074c .032c .063c
OET -.054a .110a .038a .164b .116b .139b -.107c .024c -.044c
OIT -.172a -.035a -.115a -.006b -.030b -.011b .029c -.168c -.090c
RED -.126a .077a -.022a -.037b -.101b -.065b -.030c -.111c -.086c
TAIS-T .250*a .054a .170a .047b .087b .062b .091c .092c .109c

91
Note. TAIS 1 – TAIS 12 = TAIS short form individual items 1 – 12; BET = Broad-
External; BIT = Broad-Internal; NAR = Narrow Effective Focus; OET = External
Overload; OIT = Internal Overload; RED = Errors of Underinclusion; TAIS-T = TAIS
Total. an = 84., bn = 105., cn = 104., dn = 83. * p < .05., ** p < .01.
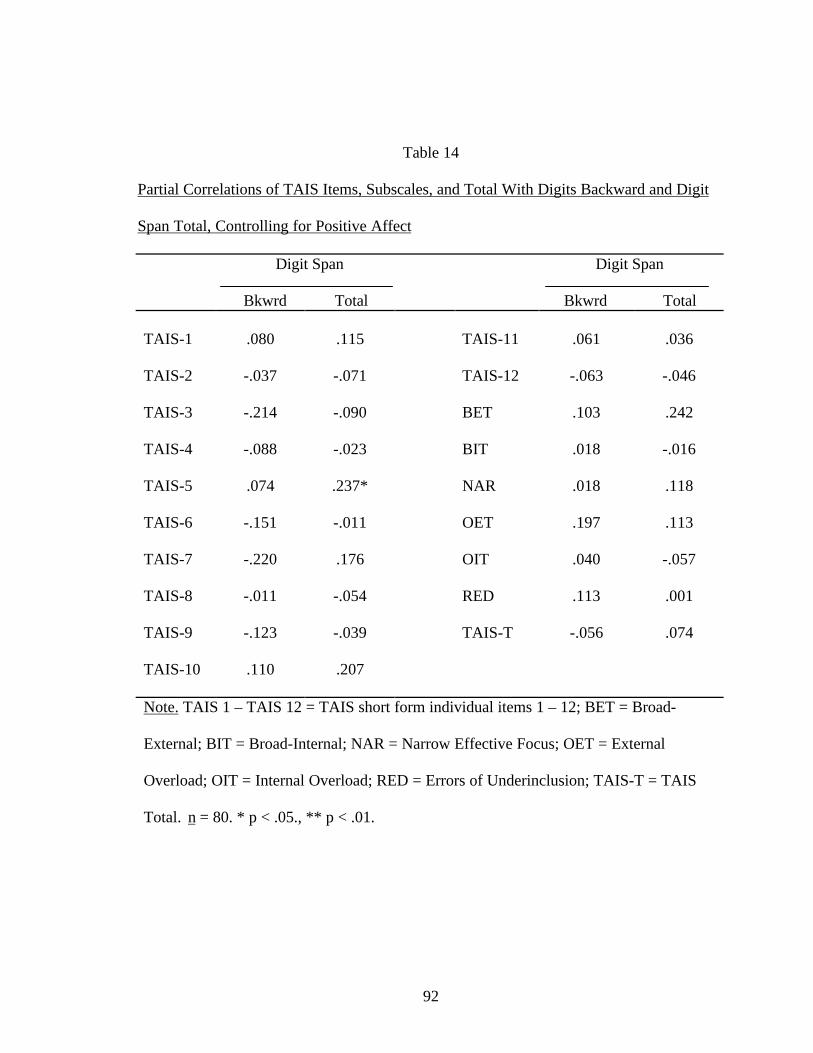
92
Table 14
Partial Correlations of TAIS Items, Subscales, and Total With Digits Backward and Digit
Span Total, Controlling for Positive Affect
Digit Span Digit Span
Bkwrd Total Bkwrd Total
TAIS-1 .080 .115 TAIS-11 .061 .036
TAIS-2 -.037 -.071 TAIS-12 -.063 -.046
TAIS-3 -.214 -.090 BET .103 .242
TAIS-4 -.088 -.023 BIT .018 -.016
TAIS-5 .074 .237* NAR .018 .118
TAIS-6 -.151 -.011 OET .197 .113
TAIS-7 -.220 .176 OIT .040 -.057
TAIS-8 -.011 -.054 RED .113 .001
TAIS-9 -.123 -.039 TAIS-T -.056 .074
TAIS-10 .110 .207
Note. TAIS 1 – TAIS 12 = TAIS short form individual items 1 – 12; BET = Broad-
External; BIT = Broad-Internal; NAR = Narrow Effective Focus; OET = External
Overload; OIT = Internal Overload; RED = Errors of Underinclusion; TAIS-T = TAIS
Total. n = 80. * p < .05., ** p < .01.
93
REFERENCES
Arthur, W., Jr., Strong, M. H., Jordan, J. A., Williamson, J. E., Shebilske, W. L.,
& Regian, J. W. (1995). Visual attention: Individual differences in training and predicting
complex task performances. Acta psychologica, 88, 3-23.
Best, J. B. (1995). Cognitive psychology. (4th ed.). St. Paul, MN: West.
Broadbent, D. E. (1958). Perception and communication. Oxford: Pergamon.
Brown, R. G., Scott, L. C., Bench, C. J., & Dolan, R. J. (1994). Cognitive
function in depression: Its relationship to the presence and severity of intellectual decline.
Psychological Medicine, 24, 829-847.
Cave, K. R., & Zimmerman, J. M. (1997). Flexibility in spatial attention before
and after practice. Psychological Science, 8 (5), 399-403.
Cherry, C. (1953). Some experiments on the recognition of speech with one and
with two ears. Journal of Acoustical Society of America, 25, 975-979.
Cratty, B. J. (1983). Psychology in contemporary sport. Englewood Cliffs, NJ:
Prentice-Hall.
Eysenck, M. W., & Keane, M. T. (1990). Cognitive psychology: A student’s
handbook. London: Lawrence Earlbaum Associates Ltd.
Ford, S. K., & Summers, J. J. (1992). The factorial validity of the TAIS
attentional-style subscales. Journal of Sport and Exercise Psychology, 14, 283-297.
Hertel, P. T. (1997). On the contributions of deficient cognitive control to
memory impairments in depression. Cognition and Emotion, 11 (5/6), 569-583.
94
James, W. (1890). The principles of psychology. New York: Henry Holt and Co.
Knott, V., Lapierre, Y., Griffiths, L., de Lugt, D., & Bakish, D. (1991). Event-
related potentials and selective attention in major depressive illness. Journal of Affective
Disorders, 23, 43-48.
Kramer, A. F., & Hahn, S. (1995). Splitting the beam: Distribution of attention
over noncontiguous regions of the visual field. Psychological Science, 6 (6), 381-386.
Lavie, N., & Cox, S. (1997). On the efficiency of visual selective attention:
Efficient visual search leads to inefficient distractor rejection. Psychological Science, 8
(5), 395-398.
Lezak, M. D. (1983). Neuropsychological assessment (2nd ed.). New York:
Oxford University Press.
Mahoney, M. J. (1979). Cognitive skills and athletic performance. In R. M.
Nideffer (Ed.). Cognitive-behavioral interventions: Theory, research, and procedures.
(pp.423-443). New York: Academic.
Mahoney, M. J., Gabriel, T. J., & Perkins, T. S. (1987). Psychological skills and
exceptional athletic performance. Sport Psychologist, 1 (3), 181-199.
Mahoney, M. J. (1989). Sport Psychology. In I. S. Cohen (Ed.). The G. Stanley
Hall Lecture Series (Vol. 9) (pp. 97-134). Washington, DC: American Psychological
Association.
Matlin, M. W. (1994). Cognition. (3rd ed.). Orlando, FL: Harcourt Brace
Jovanovich.
95
Mialet, J-P., Pope, M. G., & Yurgelun-Todd, D. (1996). Impaired attention in
depressive states: A non-specific deficit? Psychological Medicine, 26, 1009-1020.
Moran, A. P. (1996). The psychology of concentration in sport. East Sussex:
Taylor and Francis.
Nideffer, R. M. (1976a). Test of Attentional and Interpersonal Style. Journal of
Personality and Social Psychology, 34, 394-404.
Nideffer, R. M. (1976b). The inner athlete: Mind plus muscle for winning. New
York: Thomas Crowell.
Nougier, V., Stein, J. F., & Bonnel, A. M. (1991). Information processing in
sport and “orienting of attention.” International Journal of Sport Psychology, 22, 307-
327.
O’Donnel, J. P., MacGregor, L. A., Dabrowski, J. J., Oestreicher, J. M., &
Romero, J. J. (1994). Construct validity of neuropsychological tests of conceptual and
attentional abilities. Journal of Clinical Psychology, 50 (4), 596-600.
Ostrow, A. C. (Ed.). (1990). Directory of psychological tests in the sport and
exercise sciences. Morgantown, WV: Fitness Information Technology, Inc.
Palmer, J. (1995). Attention in visual search: Distinguishing four causes of a set-
size effect. Current Directions in Psychological Science, 4 (4), 118-123.
Parasuraman, R., & Davies, D. R. (1984). Varieties of attention. New York:
Academic Press.
Peters, M., & Servos, P. (1989). Performance of subgroups of left-handers and
right-handers. Canadian Journal of Psychology, 43 (3), 341-358.
96
Pitman, E. J. G. (1939). A note on normal correlation. Biometrika, 31, 9-12.
Posner, M. I. (1980). Orienting of attention. Quarterly Journal of Experimental
Psychology, 32, 3-21.
Reisberg, D., & McLean, J. (1985). Meta-attention: Do we know when we are
being distracted? Journal of General Psychology, 112 (3), 291-306.
Rosenthal, R., & Rosnow, R. L. (1991). Essentials of behavioral research:
Methods and data analysis. New York: McGraw Hill.
Sattler, J. M. (1988). Assessment of children. San Diego: Jerome M. Sattler.
Singer, R. N., Cauraugh, J. H., Tennant, L. K., & Murphey, M. (1991). Attention
and distracters: Considerations for enhancing sport performances. International Journal
of Sport Psychology, 22, 95-114.
Summers, J. J., & Ford, S. K. (1990). The Test of Attentional and Interpersonal
Style: An evaluation. International Journal of Sport Psychology, 21, 102-111.
Treisman, A. M. (1960). Contextual cues in selective listening. Quarterly Journal
of Experimental Psychology, 12, 242-248.
Trenerry, M. R., Crosson, B., DeBoe, J., & Leber, W. R. (1990). Visual search
and attention test. Odessa, FL: Psychological Assessment Resources, Inc.
Turner, R. G., & Gilliland, L. (1977). Comparison of self-report and performance
measures of attention. Perceptual and Motor Skills, 45, 409-410.
Watson, D., Clark, L. A., & Tellegen, A. (1988). Development and validation of
brief measures of positive and negative affect: The PANAS scales. Journal of Personality
and Social Psychology, 54 (6), 1063-1070.

97
Wechsler, D. (1997). Manual for the Wechsler Adult Intelligence Scale. (3rd ed.).
San Antonio, TX: The Psychological Corporation.
Westra, H. A., & Stewart, S. H. (1998). Cognitive behavioral therapy and
pharmacotherapy: Complementary or contradictory approaches to the treatment of
anxiety? Clinical Psychology Review, 18 (3), 307-340.