measuring agile maturity: zooming in on performance of ... · 2.2. patel agile maturity model there...
TRANSCRIPT

MEASURING AGILE MATURITY: ZOOMING
IN ON PERFORMANCE OF INDIVIDUALS
Report type: Master theses
Project group: is1022f17
Participant(s): Roberts Rakvics
Supervisor(s) Peter Axel Nielsen
Page count: 29
Date of completion: June 8, 2017
Abstract
This research is aiming to develop a concept to measure agile maturity of individual employees
in a software development company. In order to do so, it is necessary to know which agile
maturity models exist and how they are used. A main focus is on how to assess agility and agile
maturity. The concept was tested by participants from two software development companies in
Midtjylland, Denmark. Testing was done on the web based tool, which was developed as part of
this research. It concluded that such a tool would be beneficial and attractive for both small and
large-scale companies, but further research and testing is needed to validate the concept
1 | P a g e
Summary
This research was done in the spring months of the 2017. It was a part of the master education
program in IT design and Application Development at Aalborg University.
The aim of this research was to investigate methods and tools useful to measure agile maturity
in software development companies.
For this research Design Science Research method was chosen to answer the research
question, as the nature of this research was to develop a concept that could be used in the context
of the companies. The purpose of the tool is to indicate problem areas for the company where
improvement is needed to reach a higher agile maturity level. The research was also aiming to
contribute to the knowledge base by developing a framework that would represent how individual
employees’ maturity levels could be assessed.
A literature review was conducted to investigate which agile maturity models exist and how
they are categorized. The review indicated that there is no one commonly accepted Agile maturity
model. Another focus of the literature review was to explore how agility is measured. Data
collection was done through interviews with employees of two software development companies.
This data was then analyzed with a notion of the Grounded Theory.
Patel & Ramachandran’s Agile Maturity Model was used as an inspiration in the development
of the concept. To test the concept, a web based prototype tool was build. It contained an
embedded questionnaire to evaluate the individual employee’s agile maturity level. These
questions were part of the Goal/Question/Metric paradigm, which was adopted to define the goals
that have to be reached, and metrics that make the answers measurable were chosen. The results
of the questionnaire is presented to the users through 3 types of charts. The tool also includes
functions to test the setup of the project team based on Scrum values and practices.
The concept was tested by software development companies in Midtjylland, Denmark. Two
semi-structured interviews with open-end questions were conducted in which respondents were
evaluating the concept. The responses were analyzed and 5 themes emerged: Questionnaire
structure and questions; Anonymity of the questionnaire; Who would use this kind of tool;
Usefulness of this concept; Educative aspect of the concept.
The results indicated, that this concept would be useful for the small companies that are
adopting the Scrum framework in their software development process and for the large companies
that are looking for ways to increase the agile maturity level of their company. These results have
to be further validated, followed by refinement of the tool and additional testing needs to be done
on a larger and preferably more diverse sample group.
2 | P a g e
Abstract
This research is aiming to develop a concept to measure agile maturity of individual employees
in a software development company. In order to do so, it is necessary to know which agile maturity
models exist and how they are used. A main focus is on how to assess agility and agile maturity.
The concept was tested by participants from two software development companies in Midtjylland,
Denmark. Testing was done on the web based tool, which was developed as part of this research.
It concluded that such a tool would be beneficial and attractive for both small and large-scale
companies, but further research and testing is needed to validate the concept.
1. Introduction
In the literature about Agile Maturity
Models it is possible to find more than 40
models (Schweigert, et al., 2013) This
indicates that there is not one commonly
accepted Agile maturity model (Henriques
and Tanner 2017; Schweigert, Vohwinkel, et
al. 2013; Schweigert, Nevalainen, et al.
2012). Morover, these models are focusing
on the Agile process implementation in
software development (Schweigert, et al.,
2013).
The purpose of this study is to develop
concept to measure agile maturity of the
individual employees within a software
development company. This results in the
following research question: With what
methods and tools is it possible to
measure agile maturity of the individuals
in the company and diagnose the areas
where improvements are necessary?
The results of this study can be used for
further development of the concept, which
would include more tests on a larger scale
and the commercialization of the tool.
This paper is organized into 6 sections.
Related research and its relevance for this
research is discussed in Section 2. In Section
3 the methods used in this research are
explained and discussed. Section 4 presents
the experiment that was conducted, how the
tool is build and what results were obtained
during the testing. The paper ends with a
discussion in Section 5 and conclusion in
Section 6.
2. Related research
review
First of all, Stalhane and Hanssen
describe maturity as “the state of being
complete, perfect or ready” (Stålhane &
Hanssen, 2008)

3 | P a g e
A maturity model presents “an
evolutionary progress in the demonstration
of a specific ability or in the accomplishment
of a target from an initial to a desired or
normally occurring end stage” (Mettler &
Rohner, 2009).
2.1. Current discussions about
Agile maturity models
What is CMMI (Capability maturity
Model Integration)? It is a “process
improvement maturity model for the
development of products and services”
CMMI has five levels – 1. Initial; 2. Managed;
3. Defined; 4. Quantitatively Managed; 5.
Optimize (CMMI Product, 2010)
At this time and space there is no one
commonly used agile maturity model that
would be accepted (Henriques and Tanner
2017; Schweigert, Vohwinkel, et al. 2013;
Schweigert, Nevalainen, et al. 2012) But
there is a need for these kinds of models, as
companies are looking for ways to cut the
costs of development, to stay ahead of their
competitors, and to develop high quality
software in shorter periods of time. (
Leppanen, 2013)
In his research, Leppanen (2013) divides
agile models into four categories. These
categories are based on model use and
purpose: Road maps that support adoption
of agile approaches; frameworks guiding the
agile practices; frameworks for assessing the
current state in adoption; frameworks for
furthering the development of agile values
and principles ( Leppanen, 2013).
Schweigert et al. (2013) identified 40 Agile
Maturity models, mapped them in ISO/IEC
15504 Part5, which is a Process assessment
model, analyzed them and presented issues
with these models (Schweigert, et al., 2013)
Schweigert et al. (2012) argue, that agile
maturity deals with the process and practice
implementation in the agile style. Schweigert
et al. (2013) separate current maturity
models into three groups – those, which in
one or another way resemble Capability
Maturity Model Integration (CMMI). They
have a similar level structure and might have
similar naming. However, the content in the
levels is different (Schweigert, et al., 2013) In
another group Schweigert (2013) place
those which do not have a distinct structure.
They deal with scaling factors, features,
recommendations, management principles,
enablers or key questions. And in the last
group there are models that have level
structure. Most common is the 5 level
structure, but they all have different level
naming. Schweigert (2013) conclude, that
there is no one generally accepted model for
agile maturity. To reach one, extensive
research has to be done. Current agile
maturity models focus on several maturity
dimensional scales, which results in the
scales resembling a spider web. Several of

4 | P a g e
these axes are taken form the traditional
capability models. Others are related to
organizational issues, software
implementation issues, project issues,
technical system implementation issues
(Schweigert, et al., 2013).
There have been even more research in
the field of agile maturity in the last years.
Henriques and Tanner (2017), in their non-
empirical study, did a systematic literature
review, which included 531 articles that were
filtered to 39 articles. After reviewing the
articles Henriques and Tanner (2017)
categorized the themes. Two major themes
emerged: one being about “how to make
agile methods coexist with CMMI
environment” (Theme 1) and the other about
“how to best define an agile improvement
path focussed on agility and aligning to agile
principles” (Theme 2). They also established
that more research has been conducted in
Theme 2 field of study in past 5 years. The
peaks for Theme 1 were in 2008 and 2010,
when new versions of the CMMI model were
released (Henriques & Tanner, 2017) The
authors divided the first theme in sub
themes; one being about CMMI and agile
usage simultaneously and another about
how to map CMMI levels and agile practices.
They conclude that the majority (61%) of
articles are in the first subtheme and these
articles conclude that CMMI and Agile are
complementary approaches. Articles in the
second theme provided agile maturity
models to improve existing software
development, based on agile principles and
practices. However, it is necessary to
investigate how agile maturity relates to
project success (Henriques & Tanner, 2017)
Henriques and Tanner (2017) concluded
that “agile and CMMI can successfully
coexist”. This can happen if the environment
where agile is introduced is already a highly
matured environment. The authors also
suggest that agile cannot be used without
non-agile methods to reach high level CMMI
maturity. (Henriques & Tanner, 2017)
2.2. Patel Agile Maturity Model
There is always a need to monitor how
well one performs when introduced to new
development practices. This is the role of
agile maturity models.
One of the most discussed and cited
models is the 5 level Agile Maturity Models
introduced by Patel and Ramachandran in
2009. They developed the model “to improve
and enhance the agile software development
methodology” (Patel & Ramachandran,
2009)
As a base of this model are agile software
development values, practices and principles
(Patel & Ramachandran, 2009). For each
level they developed goals that have to be
reached, Key Process areas that have to be
investigated in order to achieve the goal, and

5 | P a g e
questions for the questionnaire to assess the
Key process areas success.
Companies at Level 1 (Initial) do not have
a stable environment for development and
are close to not using any agile software
development practices. Software
development depends on individuals, rather
than on whole teams. There are a lot of
overtime work, schedule slips,
communication, software quality and high
development cost problems (Patel &
Ramachandran, 2009)
At Level 2 (Explored) companies are
focusing on the project planning and on
improving agile requirement engineering.
They are trying to enhance Agile values and
collaboration in the development process, as
well as focusing on costumer oriented
practices. If a company is at this level, it is
most likely practicing Story card driven
development and has established an on-site
customer. This level is associated with trying
to and improve problems that are related to
planning, requirement engineering and on-
site customers. This is done through the
Figure 1 Agile Maturity Model (Patel and Ramachandran 2009)

6 | P a g e
identifying and assessing problem areas.
Usually there are still problems with
communication, coding and integration
practices. (Patel & Ramachandran, 2009)
Companies at Level 3 (Defined Level)
focus on practices related to customer
relationship management, frequent
deliveries, pair programming, coding,
communication, testing and quality of
software. Most of the technical problems
should be solved at this level. However, there
can still be many issues related to risk
assessment, code optimization and
organizational problems related to the team
work.
Level 4 (Improved) goals are to improve
project management, self-organizing team,
risk assessment, working hours. Companies
at this level have already learned how to
collect detailed measures of the software
development process or practices and
ensure product quality. At this level, more
active and mandatory examination of risk is
required. Furthermore, team responsibility is
very important and teams considerations
regarding most of the things that might work
to self-organize the team are taken into the
account This Level aims to help developers
or project managers to respect their co-
workers, Identify and improve problems
related to the teams’ self-organization. This
is all achieved through frequent self-
assessment processes.
At Level 5 (Mature level) companies
continue to improve their processes through
data and feedback on the process. They
focus on Performance Management and
Defect prevention practices (Patel &
Ramachandran, 2009)
2.3. Measuring agility
When the agile maturity model is chosen,
it is necessary to measure where the teams
stand according to the model. Several
approaches can be found in the literature.
2.3.1. The Nokia Test
The Nokia test was first created by Bas
Vodde in 2005. It is a test that helps to
assess whether teams are doing the basics
of the SCRUM (Vodde, 2006) In the first part
of the test there is a questionnaire with 3
questions seeking answers about how much
of Iterative Development the teams practice.
The second part consists of the 5 questions,
that check whether the team is actually using
SCRUM. (Ramires, et al., 2016) In 2008, Jeff
Sutherland further contributed to the Nokia
test. He developed a scoring system where
each person has to evaluate all questions on
a scale from 1-10. At the same time
questions regarding the teams were added
to this test. Sutherland also added four
categories to average score results of the
test and linked it to the revenues. The
categories are as follows: (Sutherland, 2008)

7 | P a g e
• ScrumBut (Average < 8.0) -
revenue up 0-35%
• Pretty Good Scrum (8.0 <=
Average > 9.0) – revenue up 150%
- 200
• Good Scrum (9.0 <= Average >
10.0) - revenue up 300%
• Great Scrum (Average = 10) -
annual revenue up 400%
2.3.2. Agile Evolution framework
(Agile:EF)
This framework was developed by Krebs,
Kroll and Richard (2008), and with this
framework the authors emphasize team
ownership rather than control form the
outside. They argue that it is better to have a
short questionnere which questions are
shorter and that they could be evaluated
ranging from 1 to 10 and that it is better to
have a short questionnaire rather than a long
one (Krebs, et al., 2008) This questionaire
should be a trigger for the discussion and
evaluation of current situations in the team
(Cohn, 2010)
They argue that frequent and short
reflection sessions, e.g. after every sprint,
allow for teams to diagnose problems before
they become a common practice. These
reflections should be held in small groups, up
to 10 people, as people will feel more
ownership and have more opportunities to
speak. If changes are to be made, these
have to be done only one or two actions at
the time.
More actions would harm the coding,
testing and engineering work and should be
in focus of their work. (Krebs, et al., 2008)
As the result, the authors suggest a
formula of 15 questions, 2 actions, 2 weeks,
which can be adjusted by the teams (Krebs,
et al., 2008).
2.3.3. Comparative Agility
Assessment (CA)
CA is a framework developed by Kenny
Rubin and Mike Cohn in 2010. The
development of this framework was triggered
by the companies’ needs to compare their
agile maturity to their competitors.
CA assessment is based on individual
responses to a survey. These surveys are
saved in an online database and can be
compared to the results of other companies.
In their framework, Cohn and Rubin
assess agility on seven dimensions:
teamwork, requirements, planning, technical
practices, quality, culture and knowledge
creation (Cohn, 2010). This survey is
designed in a manner that it has to be
completed by an experienced SCRUM
master, coach, or consultant. The survey is
free and available online. It consists of more
than 125 questions, therefore it is suggested
to complete the full survey only once every
year, or complete one section of the survey
each month (Cohn, 2010).

8 | P a g e
2.4. Goal, Question, Metrics
Any software development process in
necessary to measure. In this case, we are
going to measure how well agile practices
are performed and understood by the project
team. To do so, we will use the
Goal/Question/Metric (GQM) paradigm.
GQM is a mechanism that allows us to
define and evaluate an operational goal
using measurements. Its defined operational
goal is refined into sets of questions to obtain
the right information from the software
process model. Metrics are defined based on
the questions and the software process
model (Basili, 1992). By using this
framework, one can collect data that can be
interpreted and evaluated in order to
measure the software development
processes.
3. Research methods
In the following section the Design
Science Research method, which is used to
answer the research question will be
explained. Likewise, the data collection and
method of analysis that will be adopted to
analyze collected data are both explained.
3.1. Design Science Research
To answer the research question of this
study, the Design Science research method
Figure 2 Relevance and Rigor in Design science research. Source Adapted from van Aken (2005)

9 | P a g e
was chosen. It is a method that “establishes
and operationalizes research when the
desired goal is an artefact or a
recommendation” (Dresch, et al., 2015).
This method is useful when attempting to
solve specific problems in the environment
where it exists. Solutions can be generalized
to some extent, though additional research is
necessary to generate more knowledge
about the problem and possible solutions
(Dresch, et al., 2015).
Another focus of this method is knowledge
generation. The knowledge generated can
help to reduce gap between practice and
theory, thereby this knowledge can be used
to evaluate and improve theories (van Aken,
2005).
Figure 2 shows a representation of the
Design science reserach method outline. It
also visualizes the two most important
factors – rigor and relevance. The relevance
should be considered when this type of
research is done, as the knowledge
generated might be used to solve problems
by other professionals. Rigor has the same
importance as relevance, as these are the
factors that determine how successful and
valid the research is and how it contributes to
generating new knowledge in the field of
study. (van Aken, 2005)
The knowledge base is a theoretical
background, a foundation for the research. It
combines research, theories and methods,
which previously have been used in the
same field of study. This knowledge is also
supplemented with the researchers’ own
experience if the available knowledge is not
sufficient (van Aken, 2005).
The problem is observed in its
environment. This environment consists of
technology, organization and people.
Information obtained from both the
knowledge base and environment is
constantly evaluated and changes are made
to the developed theory or artefact (van
Aken, 2005).
This research approach was chosen, as
the aim of this research is to develop a
concept, based on the knowledge available
in existing literature and the knowledge
obtained through an experiment conducted
in the field to test the concept. All these
factors influence the final concept, which will
be discussed in the Discussion section.
3.2. Data collection
In order to validate the need for a such
concept, it was necessary to test it with
companies that are working with software
development and are practicing Scrum.
To do so a tool was developed that had an
embedded questionnaire for the Scrum roles
and possible solutions for the visual data
representation of the self-assessment
results.
Two semi-structured interviews with open-
end questions were conducted where
respondents were evaluating the concept.

10 | P a g e
Testing was conducted in the May 2017.
Companies were approached through
several channels – email, phone calls,
through LinkedIn and onsite visits. The
companies were chosen by their size – small
size companies, up to 15-20 employees, and
their business area – IT companies, that are
practicing the Scrum framework in their
development process. The companies were
all located in Midtjylland, Denmark. Two
companies were willing to participate in
testing of the concept. The testing was audio
recorded and the recorded audio were
analyzed afterwards.
3.3. Data analysis
For the data analysis the Grounded theory
inductive principles were adopted. This
allows researchers to obtain knowledge and
understanding about research topic from the
data. (Lazar, et al., 2009)
However, due to the time and scope of this
project, a more relaxed approach was
chosen, compared to Glaser’s sequential
process. (Walsh, et al., 2015). The data was
collected and grouped with the notion of
Grounded Theory. This grouped data could
be then analyzed.
First, groups for the data were defined
before the testing, as the key themes where
evaluation of the concept was needed.
During the analysis based on the nature of
the semi-structured interview, several new
themes emerged.
4. Experiment
The following section shows how a
prototype was designed (Section 4.1), how
the concept was tested (Section 4.2.) and
results analyzed (Section 4.3.). The
experiment was conducted in order to
investigate the usability and necessity of
such concept. The concept was tested and
companies assessed whether the concept
was useful for them to monitor their agile
maturity.
4.1. Prototype
4.1.1. Conceptual framework
The conceptual framework is represented
in Figure 3.
The level of how well project members are
executing their agile practices is the factor
that influences the Agile Maturity Level of the
company. To measure this, the embedded
questionnaire can be used, were members
are assessing their own execution of agile
practices. Therefore, it is necessary to
measure how well do they follow agile
practices. The measurement will be done
through the embedded questionnaire of the
tool where project members are self-
assessing their performance. The questions
are based on the Scrum theory.
The acquired data has to be presented to
the company. A visual representation will be
used to present quantitative data from the

11 | P a g e
questionnaire. This will help to the company
to analyze and diagnose the areas where
there is a need for action to improve agile
performance.
After changes have been done, the
measuring of the Agile maturity can be done
again to see how well the changes have
been implemented.
4.1.2. Setting up the team
One part of the tool allows companies to
set up their own project teams.
The company can choose the agile roles
that are assigned to the individual members,
but they can also choose non-agile roles, if
such exist in their project. After the roles are
assigned to the member, the next step is to
add attributes: tasks, responsibilities and
deliverables, to the member (See figure 4.)
The tool does not restrict the user on how
attributes are set to the member. However,
there is a possibility to test whether attributes
are set correctly based on the Scrum theory
Figure 3 Conceptual framework
Figure 4 Add a role

12 | P a g e
(See figure 5)
Figure 5 Check the roles
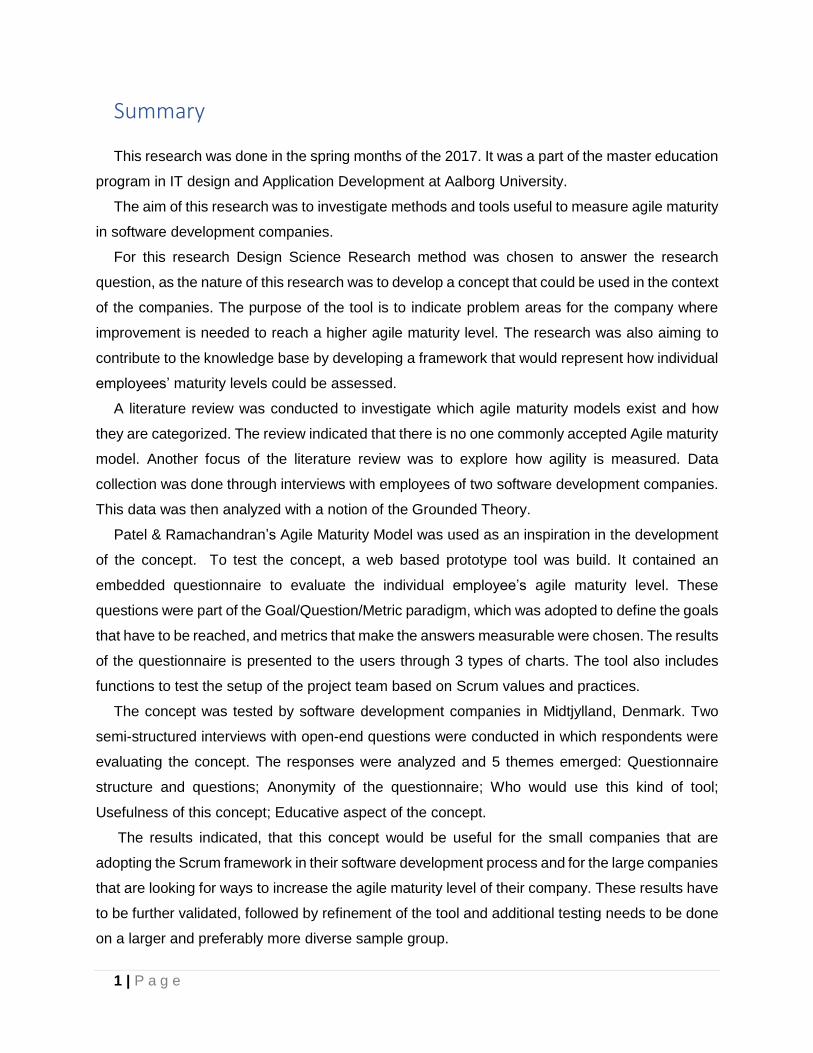
4.1.3. GQM adoption
GQM was used to define the individual
goals (Agile role practices) that were based
on the SCRUM theory. Afterwards, a set of
questions (Measure) were defined to answer
the successful achievement of the goals. As
a metric (Measure) Likert’s scale was used.
It is used to measure individuals’ attitudes
towards a specific topic ( Chandler &
Munday, 2011)
The values of the scale were changed to
better fit the questions and to get more
precise results. The goals were divided into
three major themes: Tasks, Responsibilities,
and Deliverables. Each of these themes
have several subthemes – goals. Each goal
has two questions. And all of the questions
are measured by the same metric – 5-point
scale.
The questions in the tool helps to answer
the goal achievement success. These goals
were collected through the systematic review
of sources, that are defining SCRUM
practices, values, and roles. Goals were
collected through the literature review.
Afterwards they were defined and reviewed,
and mapped to the Agile Maturity Model by
Patel & Ramachandran. The next step was
to make two questions for each goal. These
questions were made in a way in which they
could be evaluated and assessed by the
respondent.
The example of the set of goals and
questions for the Scrum Master role can be
seen in Appendix 1.
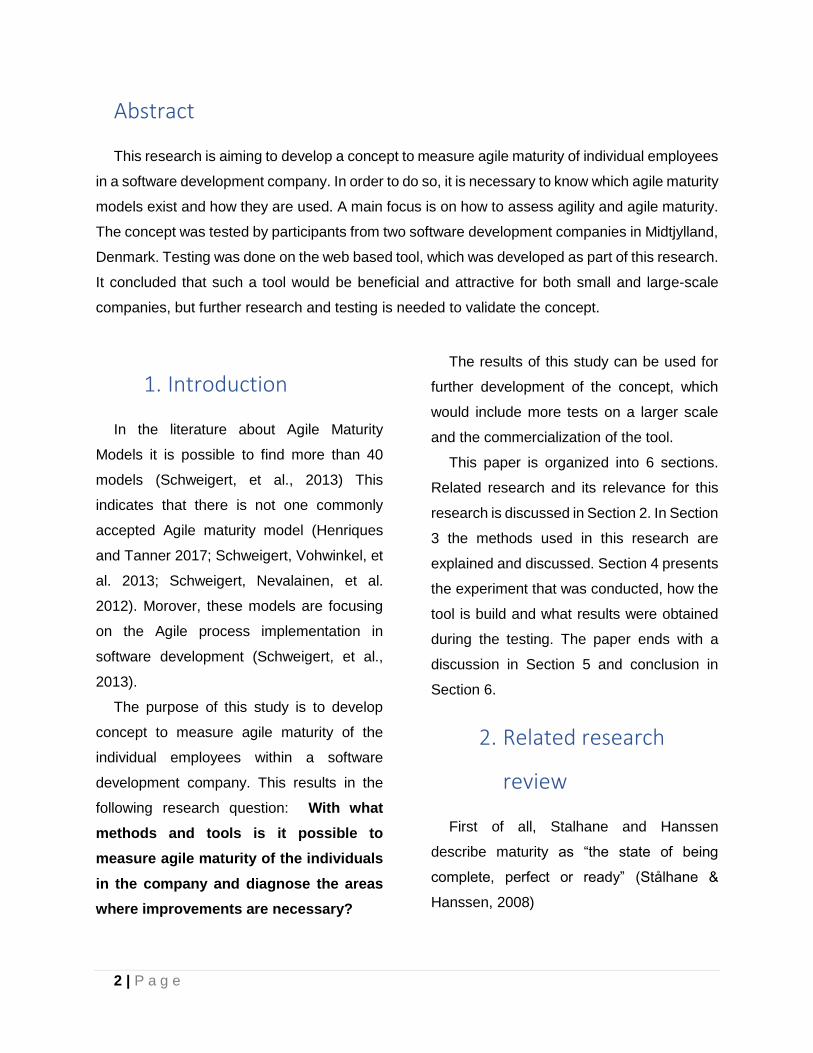
4.1.1. Questionnaire
The prototype has an embedded
questionnaire that is designed for individual
Scrum roles. The questionnaire in this
concept is used for evaluating the maturity
level of the team members. They individually
have to self-assess how well they have
followed the Scrum practices. Figure 4
represents the part of the questionnaire for
the Scrum Master role, which focuses on the
tasks that have to be performed by him.
The questions are distributed between the
levels as a result of mapping goals to AMM.
Therefore, it was possible to make charts for
each level with its questions and see the
average score of each level (Appendix 2,
Figure 4) Each question’s metric was also
defined, as metric values could differ from
question to question.
13 | P a g e
Figure 6 GQM adoption
Figure 7 Scrum Master Questions

14 | P a g e
4.1.2. Visual representation of the
data
Another part of the tool concerns the
analysis of the collected data and visual
representation of the results to the user.
There are 3 types of charts in the tool:
A. Project member average maturity
level.
This chart is visible in the user’s dashboard.
It represents the average maturity level
across the whole project team in Level 2,
Level 3, and Level 4. The average maturity
level among the project members is
calculated using formula:
100
5∗∑𝑦
where ∑𝑦 is the average score of
respondent answers on the specific Level
questions. According to Patel and
Ramachandran (2009) companies at Level
1 do not have agile practices in their
software development processes.
Therefore there are no goals that could be
meassured and thereby no data that could
be represented in this chart. Level 5 is also
excluded from this chart. At this level
companies are continuing to improve the
agile practices (Patel & Ramachandran,
2009). Therefore one could argue that
companies at this level are strengthening
the practices of the Level 2, Level 3 and
Level 4 and reach a near 100 % maturity in
these levels. Patel and Ramachandran
(2009) argue that it is neccesarry to score at
least 86% to say that one has reached the
level’s maturity. Other authors argue that it
is neccasrry to reach around 80 %
(Schweigert, et al., 2013). In this concept it
is set to be 80 %. The remaining 20 %
represents the Level 5 goals, where
companies are strengthening their practices
till near perfection.
B. Each maturity level individual
question average score.
In the tool, there are charts for each level
of maturity representing the average
scores in the question that are set for
particular level.

15 | P a g e
C. Individual responder answer
results
To address individual responses a chart
was developed, which represents the results
of the individual respondents, in such a way
that gives the possibility to address very
specific problems of individuals in the
company.
4.2. Setup
In order to validate the need of such
concept, it was necessary to test it with the
companies that are working with software
development and are practicing Scrum.
The tool was developed on the local
machine, which represents the possible Web
based commercial tool. This tool included the
embedded questionnaire, visual data
representation function, interactive team set
up function and other functions, which would
all be in the commercialized tool.
The testing of the concept was divided
into three parts: Firstly, presentation of the
tool was given to the test subjects. Secondly,
questioner of the Scrum Masters self-
assessment was answered by the test
subjects. Thirdly, results of the last
questioner were presented with the charts in
the tool.
After the third part, a semi-structured
interview with open-end questions were
conducted to find out the respondents’
opinions about following themes: how
appropriate they find the concept to evaluate
agile maturity of the person; how much
information about project member’s agile
maturity they would get using this tool; what
information they are lacking in this tool; and
whether they would find this tool helpful in the
agile transformation phase or in improving
their agile practices.
4.3. Results
Testing was conducted in late May of
2017. The companies were approached
through several channels – email, phone
call, through LinkedIn, onsite visits. The
Figure 8 Test subjects

16 | P a g e
companies were chosen by their size – small
size companies, up to 15-20 employees, and
their business area – IT companies, that are
practicing Scrum framework in their
development process. All the companies
were located in Midtjylland, Denmark. Two
companies were willing to participate in
testing of the concept. The testing was audio
recorded and the recorded audio was
analyzed afterwards.
The responses were analyzed using the
Grounded theory notion. During the analysis
two new themes emerged, which were not
considered beforehand. This resulted in the
following themes:
• Questionnaire structure and
questions
• Anonymity of the questionnaire
• Who would use this kind of tool?
• Usefulness of this concept
• Educative aspect of the concept
In the following subsections, the results of
the separate themes will be described.
4.3.1. Questionnaire structure and
questions
During the testing, most for the test
subjects time took answering the
questionnaire. During that test, subjects
were encouraged to evaluate the questions,
structure of the questionnaire and how well
metrics are defined.
One of the issues that was faced was the
formulation of the questions. These
questions were created based on the goal,
that needed to be evaluated. However, in the
real-life situation might be different. Some of
the agile practices (Goals) might be tailored
to fit company needs, therefore questions
like “To what degree Scrum Board is updated
when there are changes in board items?” can
bring negative results for the Agile maturity
score, if company is practicing otherwise.
[…] you need to agree when you are
moving tasks in the Scrum board (02:50,
First interview)
Another issue observed regarding
question formulation indicates that the
formulation of certain questions might have
been biased by the researcher and the
literature that was used to make questions.
[...] when you say every morning... there is a
lot of assumptions regards timing of the
daily Scrum meetings. Because if you are
working in distributed it could be different
times of day. (04:00, interview 1)
Some questions needed a clearer
formulation to make it clear what has to be
assessed
It depends which planning sessions. If it is
Sprint planning session, then SM is very
involved, but if there are other […] (14:50,
Interview 1)

17 | P a g e
or it was considered that they cannot be
assessed, because of the human factors that
influence the goal achievement:
(refers to the Sprint Backlog maintenance)
you cannot answer clearly 5 on that
question, because who will do it, if SM is
sick (34:40, Interview 1)
Another observation was that some of the
questions do not encourage the respondents
to self-assess and evaluate their own
performance, but is representing the
statement that they are not involved. This
was due to the fact that some questions were
evaluating the performance of the team and
their agile maturity. However, one of the
Scrum master’s responsibilities is to ensure
that team adhere to Scrum practices, values
and principles:
[…] this is a statement how well do team
collaborate. But it should be something
closer to how well do you as a SM work with
teams collaborating (18:00, Interview 2)
All the test subjects admitted that some of
the questions are constructed in the way in
which they are revealing what could be
considered the right answer. Therefore, the
result of the questionnaire might not
represent the actual situation.
Questions are a bit leading. I would sense
which way it is going. [...] It is human nature
to please. (07:30, Interview 1)
Over the time tool should get more
adaptive, so you cannot cheat (49:20,
Interview 1)
4.3.2. Anonymity of the
questionnaire
Another theme that was observed during
the testing and also analysis was anonymity
of the questionnaire. At the present time, the
questionnaires are designed for the specific
Scrum role. They are then intended to be
sent out to the employees according to their
Scrum roles. There are no requirements for
the employees to fill in their name when they
are answering the questions.
Opinions about this theme were different
between the test subjects. One was that
based on the results the company might
threat employees different.
Individual is exposed. [...] It could be
dangerous. because how should you decide
if team member is not a good team
member? Is it because he is not producing
as many points as other? (38:30, Interview
1)
Another was that these questionnaires
should not be anonymized, as this is not in
accordance with agile values
Transparency is one of the values of agile,
so it is good to have it non-anonymous.
(35:50, Interview 2)

18 | P a g e
4.3.3. Who would use this kind of
tool?
During the testing of the concept, it was
important to find out whether the companies
would be interested in using such a tool.
Test subjects in the First interview
admitted that in their opinion on this tool
could be used in large scale companies, if it
would be finalized and commercialized.
If the tool should be implemented, then it
should be for the large companies, because
small companies can overview their process
(41:20 Interview 1)
[…] smaller companies are more chaotic.
They do not have resources enough and
one person has to do several roles at the
daily bases (31:10, Interview 1)
In contrast, other test subjects were very
reluctant into use such a tool in their
company.
I am not even sure that I would use this to
talk to my Scrum masters. If I was the coach
I would already know the answers (37:30,
Interview 2)
4.3.4. Usefulness of this concept
When discussing the concept with the test
subjects, an important theme was the
usefulness of this concept.
The upper management was mentioned
as one of the main parties whom would
benefit from using this tool and whom would
be interested in monitoring the performance
of the Scrum teams.
[...] company's hierarchy from the top part,
they want to see how well do R&D is doing
to reach our goals, so it could be useful
(29:50, Interview 2)
This concept could help companies to
address the issues that they are facing while
also using proper terminology.
It is a good tool to get discussion going on
[in the meetings] and that is also why it
should not be anonymous (39:40, Interview
2)
It gives some words to talk about. If you
want to do something, and you do not have
a word for it, you cannot discuss it. (41:30,
Interview 2)
Another test subject was stressing out the
need and usefulness of such a tool in large-
scale companies, where they have many
Scrum teams that are distributed
geographically.
[…] tool that would help to assess how well
Scrum is done in large scale would be very
useful (13:20 Interview 2)
Large companies would be more
interested in reaching a higher maturity level
in their company, and would have more
resources to do it.

19 | P a g e
The larger companies would benefit from
this tool if they are climbing up the leather.
(46:30 Interview 1)
Mostly reliability of the data was
discussed when visual representation of the
data in the 3 types of the charts were
discussed.
It was mentioned by the test subjects in
the Interview 1, that “[…] charts that would
represent how you were doing over the time”
would be beneficial in this tool. (49:20,
Interview 1)
4.3.5. Educative aspect of the
concept
The concept is intended to be used to
monitor and asses the agile maturity level in
the companies that are using the Scrum
framework.
However, all the test subjects admitted
that a large part of this tool is the educational
aspect.
One of the aspects that were mentioned
was that it can be used as guidance for
adopting Scrum framework.
[] if you are new company and need to get
all the concepts right, this tool could be an
excellent guidance (46:40 Interview 1)
Another aspect was individual learning. If
an employee is consistently scoring a low
grade on a specific question, it might be an
indication that there are areas in his work that
needs improvement.
24:40 I see this tool as the work to do, if I
score it low, I see that there is something
that I have to do to score better (24:40,
Interview 2)
[…] there is an educative aspect in how you
are asking the questions. If I score low
several times, i have to do something better
next time (47:20, Interview 1)
5. Discussion
In the following section, the results of the
testing that was described in the Section 4.3.
will be discussed.
5.1. About questionnaire
An essential part of the concept is the
questionnaire. This is used for the Scrum
roles to self-assess their performance of the
tasks, following the responsibilities and
delivering qualitative deliverables. Therefore,
it is important to articulate the questions
correctly so that the data obtained will
represent the accurate situation.
Most of the test subjects were admitting
that the presented questions felt very
intuitive and that the respondent had a clear
idea of what would be the “right “answer that
have to be given to obtain a high score. This
should be addressed and “over the time tool
should get more adaptive, so you cannot
cheat.” (Interview 1) This problem could be
addressed by adding more questions to the

20 | P a g e
questionnaire. As it is now in GQM model
(See Figure 6) for each goal there are two
questions. The amount of the questions
could be increased. This, however, would
result in an increase in the required amount
of time for answering the questionnaire.
Some of the companies that the tool could
help reach a higher maturity level, might not
be willing to invest more time in having
employees answer so many questions
because it would take away from time that
could be used to develop their products.
Anonymity of the questionnaire was also
discussed while testing. As of now, the
respondent is not required to submit their
name to the questionnaire, because the
questionnaire is designed for specific Scrum
role. There are pros and cons of making the
respondents identifiable. Companies’
management might use data from the
questionnaire to evaluate the employees’
performance, thereby deciding his/her
suitability for the position. It is possible that
employees might give false answers in
questionnaire in order to reach a higher
score. Therefore, the company’s
management should clearly state to their
reasons for using such a tool and which
goals they hope to achieve. The goals could
for instance be to increase the agile maturity
of the company or to improve Scrum
practices. A clear set of goal would
encourage employees to assess the actual
situation as it is.
A positive aspect of making the
questionnaire non-anonymous is that the
companies would be able to directly address
the cause of low maturity, therefore changes
can be implemented in the right place.
In the companies, where there are only
one or two Scrum teams, it would very hard
to hide identity of the respondents. It will be
easy to point out the Scrum master who was
answering the questionnaire if there is only
one Scrum master in the company.
5.2. About the tool and concept
The participants’ overall opinion on the
concept was positive. The test subjects
recognized the potential of such a tool in their
companies. The environment and reasoning
of why such a tool would be used in the
company to get more precise assessment of
the maturity is however very important for the
employees to know.
This concept and tool was designed to
address small sized companies that are in
the transformation phase to adopt the Scrum
framework or are looking for ways to assess
and improve their agile maturity. According
to Interview 1, there is also a need for such a
tool in large-scale companies. It could help
them to raise the maturity level of the
company, monitor the maturity across the
projects and teams and assess the problem
areas where improvement, such as
coaching, is necessary.

21 | P a g e
Small companies, on the other hand,
might not need the capability of the tool to
measure agile maturity cross-teams or
cross-project. They would be more
interested in using this tool as a guidance
when implementing the Scrum framework in
their software development.
Both large and small companies could
benefit from using this concept when there is
a need to address the issues with their agile
maturity. Team members would become
familiar with agile and Scrum terminology
through using the questionnaire from the tool
across the team. The terminology used in the
tool can be used as catalyst for discussion
and looking for possible solutions to raise the
agile maturity with the project team members
(39:40, Interview 2).
The test results show that besides the
maturity assessment and monitoring, there is
also educative aspect of the tool. The initial
intention was not to make tool that educates
the team on how to make changes or how to
implement them. However, all test subjects
stated that the educational aspect is a large
and important part of the tool. When further
developing the tool, it has to be taken into
account that information entered in the tool
has to be evaluated to give the content based
on the Scrum framework and not mislead
companies in their agile processes.
This tool provides an overview of a
situation in the company regarding agile
maturity. It is not proposing or providing the
solutions on how to address the issues or
how to implement the related changes.
Therefore, it is the companies’ own
responsibility to seek the guidance or
solution elsewhere.
This concept could possibly be used in
both small and large-scale companies. When
considering future design of the tool, the
different needs of both types of businesses
should be taken into consideration. Small
sized companies, most likely would use this
tool for its maturity model for guidance and to
monitor the implementations of the Scrum
framework. Large companies, on the other
hand, would likely use this tool more to raise
their maturity level (Interview 1).
5.3. Further perspective for the
concept
At this moment, there is a very limited
amount of data to validate the concept.
There are several paths that could be taken
from here on. One of them is to use this
collected data to improve the tool and
concept. Some of the questions need to be
reformulated and more questions for each
goal has to be considered to get more
precise results. This would result in a new
version of the tool which then could be
tested.
Testing could be conducted on the same
role – Scrum master. However, during
testing it was observed, that Scrum masters

22 | P a g e
are looking at this tool from its own point of
view, to use it to test his team (37:20,
Interview2). Therefore, it is suggested to test
this tool on the companies’ representatives,
which would be or already is in charge of the
agile transformation or agile maturity
improvement. Changing the test subject
would be beneficial in order to see the
opinions about the concept from different
organisational levels.
Another perspective is to test the tools
analytical aspect -how precise the results of
the agile maturity level are in a company
when it is facing a large amount of data that
has to be analysed.
5.4. Limitation
One of the limitations for this research is
time. The research was conducted
throughout 4 months. The first steps were to
gather information about the research field
and then to develop the concept. The tool
was then built in order to test the concept.
This resulted in a very short period of time
where actual testing could happen.
The major limitation to validate this
research is the amount of the test subjects. It
is possible that other themes might emerge if
more test subjects would participate.
6. Conclusion
The aim of this research was to find out
which methods and tools are useful to
measure agile maturity of the individuals in a
software development company. The
research also was focusing on how to
diagnose the areas where improvement is
necessary.
Patel & Ramachandran’s Agile Maturity
Model was used in the development of this
concept. It has 5 level sturcture, similar to
CMMI (Schweigert, et al., 2013), which help
to asses the stage of the maturity.
To measure how well agile practices are
performed and understood by the project
team, the Goal/Question/Metric (GQM)
paradigm was used. This paradigm was also
used when the tool was developed to test the
concept. It resulted in an embedded
questionnaire in the tool for the Scrum role
and a visual representation of the collected
data from the questionnaire.
Results show, that this type of concept
would be useful for small and possibly for
large-scale companies. There is a need to
adjust questions so that they would be more
disguised and would not suggest the “right”
answer. The learning aspect was not taken
into consideration when the tool was
developed. However, according to the test
results, it is a large part of this tool. This
aspect has to be addressed in the future
development of the tool.
Based on the DSR, an artefact has been
built and evaluated in the experiment. Now
the following step is to refine it and if possible
to evaluate it more to give adequate

23 | P a g e
contribution to the knowledge base and
environment where this concept is
applicable. There are three further
perspectives for this concept: use the
obtained data to refine the tool; test the tool
on a larger and more diverse sample group;
investigate the tool’s performance on a larger
amount of data.

24 | P a g e
Bibliography
Chandler, D. & Munday, R., 2011. A Dictionary of Media and Communication. s.l.:Oxford
University Press.
Leppanen, M., 2013. A Comparative Analysis of Agile Maturity models. s.l., Springer
Science+Business Media, pp. 327- 341.
Basili, V. R., 1992. Software Modeling and Measurement: The Goal/Question/metric
Paradigms.
CMMI Product, T., 2010. CMMI for Development, version 1.2.
Cohn, M., 2010. Succeeding with agile: Software Development Using Scrum. s.l.:Addison-
Wesley.
Dresch, A., Lacerda, D. P. & Antunes Jr., J. A. V., 2015. Chapter 4 Design Science Research
. In: Design Science Research: A method for Science and Technology Advancment. s.l.:Springer,
pp. 67-102.
Henriques, V. & Tanner, M., 2017. A Systematic Literature Review of Agile and Maturity Models
research. Interdisciplinary Journal of Information, Knowledge, and Management, Vol 12, pp. 53-
73.
Kniberg, H., 2007. Scrum and XP from the Trenches. s.l.:InfoQ.
Krebs, W., Kroll, P. & Richard, E., 2008. Un-assessments – reflections by the team, for the
team. s.l., IBM Corporation.
Lazar, J., Feng, J. F. & Hochheiser, H., 2009. Research Methods in Human-Computer
interaction. s.l.:John Wiely & Sons Ltd..
Marchenko, A. & Abrahamsson, P., 2008. Scrum in a Multiproject Environment: An
Ethnographically-Inspired Case Study on the Adoption Challenges. s.l., IEEE, pp. 15-26.
Mathiassen, L., Pries-Heje, J. & Ngwenyama, O., 2002. Improving Software Organzations:
from principles to practices. s.l.:Addison-Wesley.
Mettler, T. & Rohner, P., 2009. Situational maturity models as instrumental artifacts for
organizational design. Malvern,PA, USA, s.n.
Patel, C. & Ramachandran, M., 2009. Agile Maturity Model (AMM): A Software Process
Improvement framework for Agile Software Development Practices. Int.J. of Software Engineering
Vol.2 No.1.

25 | P a g e
Ramires, S., Santana, C., Queiroz, F. & Nunes, A., 2016. Investigating the Relationship
between Nokia Test Scores Investigating the Relationship between Nokia Test Scores
Environments. Lecture Notes on Software Engineering, Vol. 4, No. 2, May, pp. 133-139.
Schwaber, K. & Beedle, M., 2002. Agile Software Development with Scrum. s.l.:Prentice Hall.
Schweigert, T. et al., 2012. Agile Maturity Model: Oxymoron or the Next Level. Palma, Spain,
Springer, p. 289–294.
Schweigert, T. et al., 2013. Agile Maturity Model: A synopsis as a First Step to Synthesis.
EuroSPI 2013, CCIS 364, pp. 214-227.
Sommerville, I., 2011. Software Engineering: 9th edition. s.l.:Pearson.
Stålhane, T. & Hanssen, G. K., 2008. The application of ISO 2001 to agile software
development. s.l., s.n., p. 371–385.
Sutherland, J., 2008. Agile Contracts: Money for nothing and your change. Haettu, s.n.
van Aken, J. E., 2005. Management research as a dign science: Articulating the research
products of mode 2 knowledge production in management. Journal of Management Studies 41,
pp. 219-246.
Vodde, B., 2006. Nokia networks and agile development. Euro Micro Conference.
Walsh, I. et al., 2015. What grounded Theory is... A critically Reflective Conversation Among
Scholars. Organizational Research Methods, pp. 581-599.
26 | P a g e
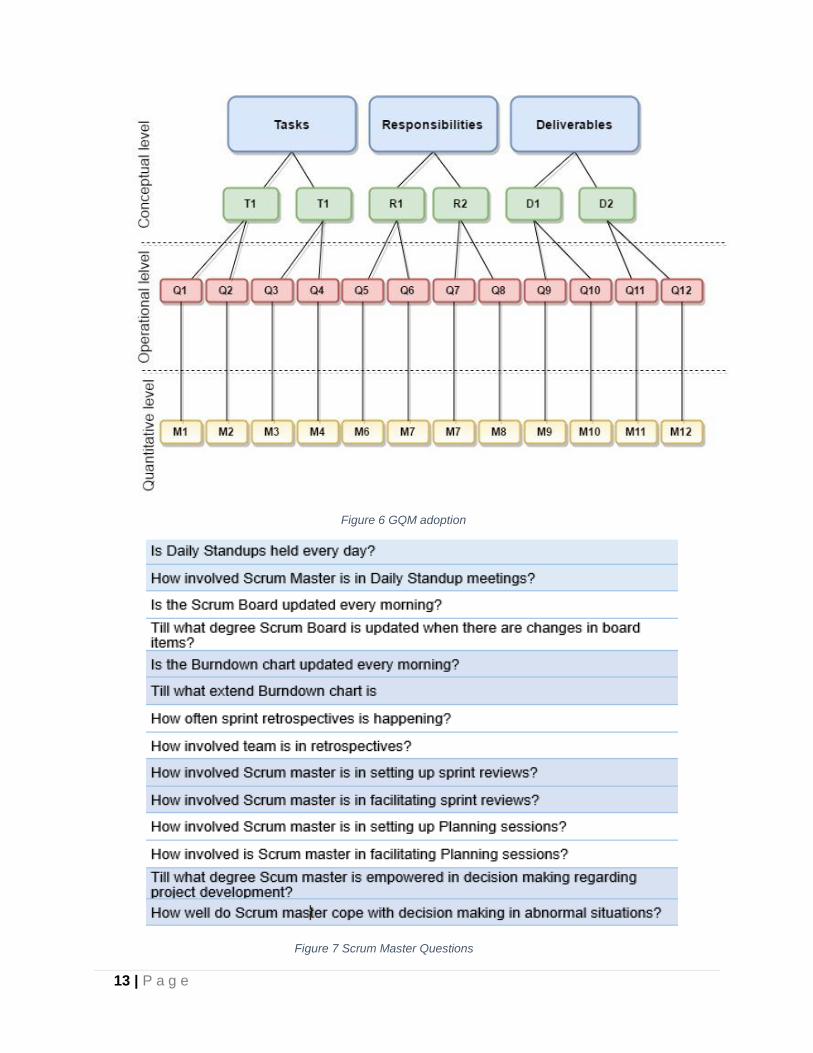
Appendix
Appendix 1. Table of questions for the Scrum Master
The questions goals for the Scrum master were collected from the different sources defining SCRUM practices (Kniberg, 2007),
(Sommerville, 2011), (Schwaber & Beedle, 2002) (Marchenko & Abrahamsson, 2008).
Goal name Level of
maturity Associated question Metrics
Tasks
Facilitating the Daily Scrums Level 2 Is Daily Standups held every day?
Lev
els
(1-5
)
How involved Scrum Master is in Daily Standup meetings?
Maintaining Scrum board Level 2 Is the Scrum Board updated every morning?
Till what degree Scrum Board is updated when there are changes in board items?
Maintaining burndown chart Level 2 Is the Burndown chart updated every morning?
Till what extend Burndown chart is
Sprint retrospectives Level 2 How often sprint retrospectives is happening?
How involved team is in retrospectives?
Sprint review Level 2 How involved Scrum master is in setting up sprint reviews?
How involved Scrum master is in facilitating sprint reviews?
Planning sessions Level 2 How involved Scrum master is in setting up Planning sessions?
How involved is Scrum master in facilitating Planning sessions?
Re
s
po
nsib
ilit
ies
Decision making Level 3
Till what degree Scum master is empowered in decision making regarding project development?
How well do Scrum master cope with decision making in abnormal situations?

27 | P a g e
Fostering the developer team’s self-organization
Level 4 How well do the team collaborate between the team members?
How often team members discuss problems if such occurs?
Shield the team from interruptions during sprints
Level 3 How often are team members taken out from the sprint?
How often sprints are disturbed or interrupted?
Ensuring that the Team adheres to Scrum values, practices, and rules.
Level 3 How well do team members understand the Scrum values, practices and rules?
Do team follow the Scrum values, practices and rules?
Dealing with impediments Level 4
How successfully Scrum master is ensuring that team can focus only on the sprint?
How well do Scrum master deals with impediments?
De
liv
era
ble
s
The Product backlog Level 2 Till what degree product backlog is maintained by Scrum Master.
How well Product backlog is maintained?
User stories Level 2 How well user stories are written?
Are all the requirements gathered with user stories?
Release planning Level 2 Till what degree Scrum master is involved in release planning?
The Sprint backlog Level 2 How well Sprint Backlog is maintained?
Till what degree Sprint Backlog maintenance is Scrum Master responsibility?

28 | P a g e
Appendix 2. Charts in the tool
Figure 9 Project member maturity
Figure 10 Level 2 question average score

29 | P a g e
Figure 11 Individual responded answers