measures to utilize real-time gas quality analyses for
TRANSCRIPT

Measures to utilize real-time gas quality analyses
for engine control
Dennis Högberg
Master’s thesis
Supervisor: M. Sc. Kaj Portin, Wärtsilä
Supervisor: Cataldo De Blasio, Åbo Akademi University
Examinator: Prof. Margareta Björklund-Sänkiaho
Energy Technology, Vasa
Study programme in Chemical Engineering
Faculty of Science and Engineering
Åbo Akademi University
October 1, 2018

I
ABSTRAKT
Intresset för att använda naturgas som bränsle i förbränningsmotorer har växt
de senaste åren. Fördelarna med att använda naturgas kan ses i ekonomi och
miljöaspekterna. Däremot varierar naturgasens komposition mycket över hela
världen och ändrar även med tiden. Detta medför utmaningar för
motortillverkare med tanke på designen och optimeringen av motorerna
gällande bränsleförbrukning, pålitlighet och utsläppskrav.
I normala fall optimeras en motor utgående från vad kunden har specificerat
gällande det bränsle motorn är tänkt att köras på. Detta arbete grundar sig i hur
naturgasens kvalitet, som mäts i ett så kallat metantal, kan användas för att styra
motorns förbränning i realtid. Med en kontrollfunktion baserad på gaskvalitet
elimineras behovet att låsa motorns prestanda till en viss typ av gas. Målet med
föreliggande examensarbetet var att undersöka hur gasens kvalitet inverkar på
förbränningen, och med denna information bestämma med vilken
kontrollfunktion gaskvalitetens iverkan kan motverkas.
Utvecklingen av kontrollfunktionen gjordes i form av studier av data från en
testinstallation i Danmark samt genom motortester i laboratoriemiljö. Som
bistudier undersöktes en ny typ av gassensorteknologi, och samtidigt gjordes en
prestandaberäkningsstudie för ett referensgasprojekt.
Dataanalysen visade att den elektriska verkningsgraden påverkas negativt av
högre metantal än vad motorn är optimerad till. Å andra sidan påverkades
verkningsgraden positivt av lägre metantal, och hade då högre knacknivåer och
förhöjda kväveoxidutsläpp. Den testade kontrollfunktionen visade sig vara
lämplig för att förhindra problem med knackförbränning vid sämre gaskvalitet
samt höja verkningsgraden vid högre metantal.
Nyckelord: Gasmotor, naturgas, metantal, gaskvalitet, motorstyrning

II
ABSTRACT
The interest to use natural gas as fuel in internal combustion engines has grown
in recent years. The benefits of using gas as a fuel can be seen both in the
economic aspects and in the environmental aspects. However, the composition of
natural gas differs considerably around the world and changes with time. This
brings challenges for engine producers regarding design and optimisation of
engines for lower fuel consumption, reliability and emission regulations.
In normal cases, an engine is optimised according to what fuel the engine will be
operating on. This thesis focuses on how the quality of natural gas, measured in
a so-called methane number, can be used to tune the engine in real time. With a
control function based on gas quality the need to lock engine performance to a
set gas is eliminated. The main goal of the work is to evaluate how the gas quality
affects the combustion, and with this information determine what kind of control
function would be suitable to counteract the quality impacts.
The development work was done in the form of data analysis from a test
installation in Denmark and engine experiments in laboratory environment. As
side studies a new type of gas sensor was tested and evaluated, while a
performance calculation for a reference gas project was made as another part
study.
The results from the data analysis showed that the electrical efficiency is lower
when the engine is operating on a higher methane number than compared to
what methane number it is tuned to. However, the efficiency is higher at lower
methane numbers, with higher knocking levels and higher nitrous oxide emission
levels. The control function that was tested proved to be suitable for preventing
knocking combustion with lower methane numbers and increase the efficiency at
higher values.
Key words: Gas engine, natural gas, methane number, gas quality, engine control

III

IV
TABLE OF CONTENTS
ABSTRAKT I
ABSTRACT II
PREFACE VI
LIST OF SYMBOLS AND ABBREVIATIONS VIII
1 INTRODUCTION 1
2 LITERATURE REVIEW 3
2.1 Gas engine fundamentals 3
2.1.1 Combustion technologies 4
2.1.2 Operating parameters 7
2.2 Gaseous fuel characteristics 12
2.2.1 Natural gas 12
2.2.2 Fuel properties 14
2.2.3 Gas production and availability 15
2.2.4 Development of Wärtsilä Methane Number 16
2.3 Engine knocking 19
2.3.1 Knock tendency factors 20
2.3.2 Operating window 21
2.4 Gas quality measurement system at Toftlund Fjernvarme 23
2.4.1 MKS Precisive® Gas Analyser 23
2.4.2 Gas sensor- and communication setup 24
2.5 MEMS Qs Flonic sensor function and measurement principle 26
2.6 Earlier research: “Online gas quality measurement and engine control” 28
3 MATERIAL AND METHODS 29
3.1 Follow-up of Toftlund Fjernvarme measurements 29
3.1.1 Smart NOx sensor 30
3.1.2 Performance analysis based on methane number 31
3.2 50SG Methane number-based control tests 32

V
3.2.1 Communication and sensor setup 32
3.2.2 Engine mapping 34
3.2.3 Test program for gas transfers 35
3.3 Testing and evaluation of MEMS QS Flonic sensor 36
3.3.1 Fuel laboratory tests 37
3.3.2 Engine laboratory installation and testing 38
3.4 Reference gas and correction factors 39
3.4.1 G-LNG reference gas 40
3.4.2 Efficiency, NOx and THC correction factors 41
4 RESULTS 43
4.1 Toftlund 18V34SG case 43
4.1.1 Toftlund site updates 44
4.2 50SG Methane number-based control tests 44
4.2.1 20% Propane transfer on 30% load, first start with application enabled 44
4.2.2 Propane transfer on 30% load 44
4.2.3 Propane transfer on 50% load, shutdown from heavy knock 45
4.2.4 Propane transfer on 50% load 46
4.2.5 Propane transfer on 70% load 47
4.2.6 Ethane transfer on 70% load 48
4.2.7 Ethane transfer on 100% load 48
4.2.8 Other findings 49
4.3 MEMS QS Flonic gas sensor initial test results 49
4.3.1 Methane number 50
4.3.2 Lower heating value 51
4.4 Results from the correction factor study 52
5 ASSESSMENT OF RESULTS 54
6 CONCLUSION AND FUTURE DEVELOPMENT 56
SVENSK SAMMANFATTNING 58
REFERENCES 63
APPENDICES 65

VI
PREFACE
This thesis work was conducted within a research and development project for
Wärtsilä Finland Oy during 2018, a quite challenging task regarding a very
interesting subject.
With these words I would like to thank those who have been part of this project
and providing support, your help has been very valuable. A special thanks to Kaj
Portin for giving me the opportunity to work with this subject. Also, I would like
to thank Cataldo De Blasio and Margareta Björklund-Sänkiaho at Åbo Akademi
Univeristy for giving me valuable feedback about the writing and thesis
structure.
Vasa 12.9.2018
Dennis Högberg

VII

VIII
LIST OF SYMBOLS AND ABBREVIATIONS
𝑚𝑎 Air mass flow
𝑚𝑓 Fuel mass flow
𝐼𝑀𝐸𝑃𝑔 Gross indicated mean effective pressure
𝐼𝑀𝐸𝑃𝑛 Net indicated mean effective pressure
𝑅𝑏𝑠 Bore to stroke ratio
�� Volume flow
𝑉𝑐 Clearance volume
𝑉𝑑 Swept volume
𝑊𝑐,𝑖𝑔 Gross indicated work per cycle
𝑊𝑝 Pumped work per cycle
𝑐𝑝 Heat capacity
𝑔𝑠 Specific gravity
𝑛𝑟 Number of crank revolutions per power stroke
𝑟𝑐 Compression ratio
A/F Air to fuel ratio
B Piston bore
BDC Bottom dead centre
CAN Controller area network
DF Dual fuel
L Piston stroke length
LHV Lower Heating Value
MN Methane Number
N Rotational speed
P Power
PCC Pre-combustion chamber
PLC Programmable logic controller
RCM Rapid compression machine
SG Spark-ignition gas
T Torque
TDC Top dead center

IX
WI Wobbe index
WKI Wärtsilä knocking index
WMN Wärtsilä Methane Number
η Efficiency factor
Θ Temperature
λ Relative air to fuel ratio
𝐵𝑀𝐸𝑃 Break mean effective pressure
𝑃𝑀𝐸𝑃 Pumped mean effective pressure
𝑉 Volume
𝑏𝑠𝑓𝑐 Break specific fuel consumption
𝑝 Pressure
𝜅 Thermal conductivity

1
1 INTRODUCTION
In the current, rapidly growing world, emphasis is being placed on sustainable
and new, greener technologies. Among these, emission-free ways to produce
electricity, solar, wind and water power are perhaps seen as the most promising
ones. However, the road to a totally emission-free power generation is long, and
the conventional production methods will be present for some time still.
Research is therefore not only focused on renewable energy sources, it is also
directed at improving the ones that are already available. At Wärtsilä, gas-fired
engines have been produced for over 20 years and they will not be phased out
anytime soon. Reliability is of key importance in an engine i.e. the reliability to
run the engine continuously without interruption, and in an efficient way. To
remain reliable and efficient, the possibility to handle changes in incoming gas
quality is essential for a gas engine, and with the growing fuel market, and larger
diversity in gas distribution, the importance of reliability grows even stronger.
This thesis project revolves around these earlier mentioned gas engines, the fuel
they operate on, how the engines react to different fuels and, most importantly,
how they can be controlled effectively regarding changes in the incoming fuel
quality.
The benefits of using real-time readings of gas quality for engine control can
basically be divided into two topics. With a well-functioning control, the engine
should be able to handle lower-quality gas without the need to decrease the load
because of knocking combustion. Secondly, engine parameters should always be
optimised to the best possible efficiency, which means running just below
knocking limits. With this control function, the operating area would be widened
with improved efficiency. In addition, the measuring of the incoming gas could
also be of interest for the operator from an informational perspective.
The scope of the project is divided into two main topics that are treated in this
thesis. To start, gas- and engine data are studied to determine how gas quality
affects engine efficiency, knocking behaviour and emissions. Based on these

2
results a control functionality is tested on a laboratory engine with a parameter
tuning based on changing gas quality, in this case between pre-determined
compositions.
As a side study, a new gas-sensing technology is studied and tested both at a fuel
and an engine laboratory. Another side study is also conducted on engine test
data, to investigate the idea of a possible reference gas and how it could be
utilised as a standard to which engine makers would report their engine
performance.
Although Wärtsilä manufactures engines that can operate on both diesel and
gaseous fuels, this project has been limited to the pure gas, spark-ignited engines,
since almost all previous development within the internal project revolves
around this kind of engine. It is, however, not limited to one engine model, design
stage or size.

3
2 LITERATURE REVIEW
Engine performance is highly connected to the quality of the fuel and the way it
is combusted within the cylinder. To ensure a reliable operation, these should be
known and preferably also counteracted. To obtain a better understanding of
how different fuel properties affect the behaviour of a gas-fuelled engine, this
chapter will cover the working principle-, combustion process- and parameters
of gas-fuelled engines. Gaseous fuel properties and qualities, how they affect the
combustion, will be reviewed. Lastly, a previous study on the subject will be
presented to provide some background to the internal project.
2.1 Gas engine fundamentals
The gas engine operates by a series of operations, called the Otto cycle. Premixed
air and fuel enter the combustion chamber through an inlet port, where the
mixture is compressed to a higher pressure and temperature. A heat source,
spark ignition, or pilot injection ignites the mixture. After the combustion, the
exhaust gases leave the cylinder through an exhaust port. These steps occur
during four so called strokes, described below and shown in Figure 1.
1. Intake stroke. The intake stroke starts with the piston at the top dead centre
(TDC), as the piston moves downwards, the fuel/air mixture enters the cylinder.
The inlet valve that controls the inflow of gases opens as the stroke starts and
closes at the end of the stroke.
2. Compression stroke. With all valves shut, the piston starts moving upwards
from the bottom dead centre (BDC), compressing the fuel/air mixture. Just before
the end of the compression stroke the gas mixture is ignited, increasing the
cylinder pressure rapidly.
3. Power stroke. The high pressure formed by the expanded gases pushes the
piston and connecting rod down, forcing the crank to rotate. When the piston
reaches the BDC, the exhaust valve opens, decreasing the cylinder pressure and

4
beginning the exhaust process.
4. Exhaust stroke. Some of the gases are forced out of the cylinder due to the
temporary pressure difference between the cylinder and exhaust pressure. The
remaining gases are pushed out as the piston starts moving upwards again. As
the piston approaches the TDC, both inlet and exhaust valves are open, and the
rest of the burned gases are forced out by the incoming mixture.
Figure 1 Otto engine working cycles (Fallah, Khajepour & Goodarzi, 2016)
2.1.1 Combustion technologies
In theory, the fuel and air mixture will be ignited at the top dead centre and
combust instantaneously, or in other words at a constant volume. In reality this
is not true, since ignition is typically initiated around 15 crank angle degrees
(CA°) before TDC and combustion lasts about 25 CA°, Figure 2, for Wärtsilä gas-
fired engines. This makes the curve of the real cycle look slightly different at the
point of peak pressure, as seen in Figure 2.

5
Figure 2 Ignition timing and combustion duration (Heywood, 1988)
In comparasion to the Otto cycle, the Diesel cycle operates in a slightly different
way. In the ideal case, the diesel injected at the TDC will ignite and combust at a
constant pressure as the piston starts moving downwards. Again, the real case
does not resemble the ideal principle, which can be seen in Figure, 3, where a
clear pressure rise can be seen as the first fuel is ignited (Hattar, 2005).
Figure 3 pV-diagram of an ideal and real Otto cycle (Hattar, 2005)

6
Figure 4 pV-diagram of an ideal and real Diesel cycle (Hattar, 2005)
In Wärtsilä engines, two different techniques are used for fuel ignition. For spark
ignited engines (SG), the combustion is initiated by a sparkplug. This sparkplug
is placed inside a pre-combustion chamber (PCC), which holds a richer, more
easily ignitable mixture of fuel and air, Figure 5. The pre-combusted gases act as
the heat source for the process and are directed from the PCC, through a nozzle,
to the main combustion chamber (Hattar, 2005).
Figure 5 Precombustion and main combustion chamber for a lean burn engine (F1i magazine,
2016) see also (Slefarski, Golebiewski, Czyewski, Gizymislawski, & Wawrzyniak, 2018)

7
The second method of igniting the gas/air mixture is called compression ignition.
This is used in Wärtsilä dual fuel engines (DF) and pure diesel engines. In this
case a fuel injector injects a small amount of diesel fuel into the gas filled
combustion chamber. As the temperature inside the cylinder is higher than the
auto-ignition temperature of the diesel fuel, it ignites, starting the combustion.
The same fuel injector is also used when the engine is operating in diesel mode
and using liquid fuel (Heywood, 1988).
2.1.2 Operating parameters
Engine parameters are quantities that tell the characteristics of an engine. Rated
power, P (kW) and torque, T (Nm) are perhaps the most common ones. Torque is
usually measured using a dynamometer and rated power is calculated as
Pb = 2πNT, (1)
where N is the rotational speed (1/s) of the engine (Heywood, 1988). Comparing
different engines using these is not fair in the sense that they do not reveal
anything linked to the engine’s performance, as bigger engines produce more
power than smaller ones, but not necessarily at a lower fuel consumption per
output.
From an operational point of view the fuel consumption is probably of interest.
This may be defined directly as a mass-flow per time unit, ��𝑓 (kg/h), but more
often it is normalised to engine power output. This is called specific fuel
consumption, or brake specific fuel consumption, bsfc, and is normally expressed
as g/kWh and defined as
𝑏𝑠𝑓𝑐 = ��𝑓
𝑃𝑏
(2)
(Heywood, 1988). Some of the parameters are so-called geometrical properties
and are directly connected to the engine design. The first one is called

8
compression ratio 𝑟𝑐 . This indicates the volume ratio to which the air-fuel mixture
is compressed, calculated according to Eq.(3), where 𝑉𝑑 is the swept volume, and
𝑉𝑐 is the clearance volume. Another term that is related to the general measures
of the engine components is bore to stroke ratio, 𝑅𝑏𝑠 , calculated according to
Eq.(4), where B represents the piston diameter and L the piston stroke length.
Figure 6 illustrates the positions of the geometrical properties used in the
calculations (Heywood, 1988).
𝑟𝑐 =𝑉𝑑 + 𝑉𝑐
𝑉𝑐 , 𝑅𝑏𝑠 =
𝐵
𝐿(3,4)
Figure 6 Visualisation of geometric engine parameters (J&P Cycles, 2018) see also (Heywood, 1988)
A good way to determine the performance of an engine is to look at the brake
mean effective pressure, BMEP (kPa), but usually converted to (bar). this
indicates how much work is done by the cylinder volume per cycle.
𝐵𝑀𝐸𝑃 =𝑃𝑏𝑛𝑟
𝑉𝑑𝑁(5)
𝑛𝑟 tells the number of crank revolutions per each power stroke, two for four
stroke engines. Since BMEP is obtained using the power output from the engine,
it takes all the frictional and auxiliary losses into account. If the losses related to

9
power transmission and auxiliary equipment of the engine are disregarded, there
is another way to gain an understanding of how efficient the combustion itself is.
The volume and pressure changes inside the cylinder can be plotted into a 𝑝, 𝑉-
diagram, Figure 7.
Figure 7 p,V diagram for a four-stroke cycle (Engine knowhow, 2018)
By integrating these two curves from top dead centre to bottom dead centre, two
parameters can be obtained. The first one is gross indicated work per cycle, 𝑊𝑐,𝑖𝑔 .
This, upper, dashed area in Figure 7 represents the compression and expansion
stroke, i.e. work delivered to the piston.
𝑊𝑐,𝑖𝑔 = ∫ 𝑝 𝑝𝑜𝑠𝑖𝑡𝑖𝑣𝑒−𝑤𝑜𝑟𝑘 𝑐𝑢𝑟𝑣𝑒 𝑑𝑉𝑇𝐷𝐶
𝐵𝐷𝐶
(6)
By integrating the low-pressure, curve, 𝑊𝑝 , pumping work is acquired,
represented by the lower, dashed area. This is work done by the piston during
gas exchange in the inlet and exhaust strokes:
𝑊𝑝 = ∫ 𝑝 𝑛𝑒𝑔𝑎𝑡𝑖𝑣𝑒−𝑤𝑜𝑟𝑘 𝑐𝑢𝑟𝑣𝑒 𝑑𝑉𝑇𝐷𝐶
𝐵𝐷𝐶
(7)

10
Dividing these two (6,7) with the swept cylinder volume gives corresponding
mean effective pressures, 𝐼𝑀𝐸𝑃𝑔 and 𝑃𝑀𝐸𝑃.
𝐼𝑀𝐸𝑃𝑔 =𝑊𝑐,𝑖𝑔
𝑉𝑑 , 𝑃𝑀𝐸𝑃 =
𝑊𝑝
𝑉𝑑
(8,9)
Subtracting the pumped pressure from the gross indicated pressure gives the net
indicated mean effective pressure as result (10). 𝐼𝑀𝐸𝑃𝑛 express the net amount
of work that is transferred from the gases to the piston, and in that sense how
efficient the combustion is:
𝐼𝑀𝐸𝑃𝑛 = 𝐼𝑀𝐸𝑃𝑔 − 𝑃𝑀𝐸𝑃 (10)
In normal operation mean effective pressures are not that interesting, but for an
engine developer these are thought of every day. In laboratory environments
external hard and software are used to determine for instance IMEP, combustion
duration using pressure sensors and angular position of the engine.
A more direct, and very common approach to engine efficiency is to simply study
the rated output and the amount of energy that is delivered to the engine by the
fuel. This gives a unit-less value called efficiency factor
𝜂 =𝑃𝑏
��𝑓𝑄𝐿𝐻𝑉
(11)
with 𝑄𝐿𝐻𝑉 as the lower heating value which expresses the energy content of a fuel
on mass basis (kJ/kg), ��𝑓 as mass flow (kg/s) and 𝑃𝑏 power output in kW
(Heywood, 1988). Normally, in daily talk, heating values are referred to as LHV
and HHV. The difference between higher and lower calorific values of a fuel is
whether the energy needed for water vaporisation is considered or not.
Regarding engine technology, the fuel energy that is “stolen” to vaporise the
water contents of the fuel cannot be used to drive the engine, and therefore LHV
is almost excludingly used.

11
As stated earlier, fuel and air enter the cylinder pre-mixed. The ratio between the
two components is a relevant operating parameter. Normally both air mass flow
and fuel mass flow are measured, and the air/fuel ratio is calculated on a mass
basis as:
𝐴 𝐹⁄ =𝑚𝑎
𝑚𝑓
(12)
The ideal mix is achieved when all the available fuel reacts with all the available
oxygen, leaving no excess air, referred to as a stochiometric ratio. For natural gas
the ratio is about 17:1. In engine applications the A/F ratio is usually expressed
as a factor lambda, (λ), describing the relation between the actual versus the
stochiometric A/F-ratio, which better indicates the state of the mixture than the
actual air to fuel ratio (Heywood, 1988):
λ =𝐴 𝐹⁄
𝑎𝑐𝑡𝑢𝑎𝑙
𝐴 𝐹⁄𝑠
(13)
For an ideal mixture, λ is equal to 1. With λ higher than 1 the mixture is lean,
and with λ lower than 1 the mixture is referred to as rich, meaning that there
will be unburned fuel left in the exhaust gases. Automotive engines operating on
gasoline traditionally use a feedback control on the lambda value to keep it at 1
(Korakianitis;Namasivayam;& Crookes, 2011).
Lean-burn engines, like Wärtsilä gas engines, run at a higher value, around 2.1.
This allows for a more complete combustion at a lower temperature, which
increases efficiency while decreasing NOx emission, since the combustion
temperature will be kept lower. In addition, hydrocarbon and carbon monoxide
emission formed by incomplete combustion are reduced. In Figure 8, it is shown
that the operating window, limited by the misfiring and knocking regions, grows
narrower when going towards higher BMEP (load) and efficiencies (Heisler,
1995).

12
Figure 8 Operating window of a leanburn gas engine (Hattar, 2005)
2.2 Gaseous fuel characteristics
Since gaseous fuels are produced worldwide, at different locations and using
different methods, they vary in composition and quality. As new technologies
drive the market into more sustainable fuels and unconventional sources, these
variations increase further.
2.2.1 Natural gas
Currently, natural gas is by far the most used type of gas in combustion engines.
In land-based installations, gas is usually transported using pipelines and for
marine applications, it is stored as liquified natural gas (LNG), compressed to
around 1/600 of its original volume at normal temperature and pressure. The
majority, 70-95% of the natural gas is composed of methane (CH4). While some
smaller quantities of the heavier hydrocarbons can be found, usually in the form
of ethane (C2H6), propane (C3H8), butane (C4H10) and penthane (C5H12). The
rest of the composition is usually made up of inert gases, like carbondioxide (CO2)
and nitrogen (N2). Common ranges can be seen in Table 1.

13
Table 1 Natural gas components and typical ranges in vol-% (Speight, 2008)
Gas Formula Range
Methane CH4 70-90%
Ethane C2H6
0-20% Propane C3H8
Butane C4H10
Pentane and higher hydrocarbons C5H12 0-10%
Carbon dioxide CO2 0-8%
Oxygen O2 0-0.2%
Nitrogen N2 0-5%
Hydrogen sulphide H2S 0-5%
Rare gases A, He, Ne, Xe trace
One of the main drivers for the increased use of natural gas would be the low
emissions. Natural gas has the lowest CO2 footprint of all the fossil fuels
(Demirbas, 2010). This is mainly because it, on a mass basis, contains the lowest
amount of carbon, compared to traditional fuels. This can be explained by
studying the governing chemical formula for alkanes, Figure 9, and the ratio
between carbon and hydrogen molecules. In general, natural gas consists of
alkanes up to 𝐶6, which gives it a low carbon mass percentage compared to
petroleum fuels.
Figure 9 Carbon-to-Hydrogen Ratios of Alkanes
0,20
0,25
0,30
0,35
0,40
0,45
0,50
0,55
C1
C2
C3
C4
C5
C6
C7
C8
C9
C1
0
C1
1
C1
2
C1
3
C1
4
C1
5
C1
6
C1
7
C1
8
C1
9
C2
0
C2
1
C2
2
C2
3
C2
4
C/H
Rat
io
Carbon molecules
Carbon-Hydrogen Ratio of Alkanes
𝐶𝑛𝐻2𝑛+2

14
Regarding the low nitrogen content of the fuel, fuel-NOx formations become
insignificant. This combined with lean-burn technologies, result in significantly
lower NOx emission levels compared to diesel engines, because of the lower
compression ratio and therefore lower combustion temperature. Sulphur oxide
emissions, (SOx), are at the same time reduced to zero, since natural gas does not
consist of any sulphur (Demirbas, 2010).
2.2.2 Fuel properties
The main property for a fuel in general is the energy content, this includes gases
as well. But what differentiates gases from liquid fuels, is that instead of
comparing the fuel according to ignitability, it is measured in knock resistance.
Knocking will be described in the following chapters, but in principle knock
resistance is the inverse of ignitability.
For the energy content, the lower heating value, LHV, is usually used to indicate
how much heat is released per mass or volume unit during the combustion, often
expressed as MJ/kg or MJ/m3. In opposition to the higher heating value, HHV, this
calculation assumes that the heat used to vaporise water formations is not
recovered. Heating values can either be measured or calculated from the gas
composition, if its known.
To characterise knock resistance a methane number is used. There are several
different calculation methods available, most of them based on the AVL
methodology. In this project, the Wärtsilä Methane Number (WMN) will
primarily be used. The WMN was developed in cooperation with DNV GL, to
enable better knock predictions for modern engines, and new fuels. The
development of this calculation tool will be described in more detail further on
(van Essen & Gersen, 2018).
A parameter often used by gas suppliers to define interchangeability of fuel gases
is the Wobbe index (WI), which is related to the heating value and specific gravity.
In principle, two gases with identical Wobbe indices, with set pressure and valve

15
settings, will give identical energy output. This information is useful, to minimize
the impact of gas supply fluctuations. Since heating values can be expressed as
either lower or higher, the Wobbe index can also be presented as either high or
low. In general, WI is most commonly calculated with LHV and specific gravity,
𝑔𝑠, according to Eq.(14) (Demirbas, 2010).
𝑊𝐼 =𝐿𝐻𝑉
√𝑔𝑠
(14)
Some other properties that might be of interest from a combustion point of view
are:
- Ignition point – at what temperature the gas auto ignites at normal
pressure.
- Flammability limits – expressed as volume percentage in air, at which the
mixture is ignitable.
- Theoretical flame temperature – the temperature that would be achieved
if all available energy would be used to heat up the flame.
- Maximum flame velocity – the highest velocity the expanding flame front
of a specified gas can achieve. (Demirbas, 2010)
2.2.3 Gas production and availability
As the economy is growing and the interest in natural gas also increases, new and
more unconventional sources of natural gas will be introduced. With the LNG
infrastructure expanding globally, new suppliers will enter the market, bringing
on new challenges. At the same time, end users of pipeline gas will experience
larger numbers of suppliers feeding the pipeline system, all of which differ in
quality and properties. Figure 10 shows that on a global level, the Middle East is
the largest producer of LNG and that Russia the biggest pipeline gas exporting
country. This will probably be the case also in the future. But with more
producers entering the market, variations in quality are predicted to increase.

16
Figure 10 P Natural gas infrastructure (Statistical Review of World Energy, 2017)
Regarding methane number, the overall LNG volume will shift towards higher
numbers, with a mean value over 80 by 2027. Mainly contributed by new sources
in the US, Canada, Middle East and Africa. The share of low methane number gas
is however expected to remain significant in Australia and Southeast Asia.
Increasing methane numbers is mainly considered a good thing, but as the
engines are tuned towards higher efficiency and outputs, it makes them more
sensitive to “bad” gas. Today, gas engines are often sold and optimised to the
worst possible gas quality the customer has stated, independent of, how many
days per year it will operate on the mentioned quality. This is where the
advantages with real-time gas measurements shines the brightest, allowing the
engine to adapt to changes in the incoming gas (Koot, Future LNG Quality Study,
2018).
2.2.4 Development of Wärtsilä Methane Number
Ranking of natural gas according to its ignitability using a methane number has
been the practice since the 1970’s. Most of the gas suppliers as well as engine
manufacturers use their own adaptions, based on the final work and data
published by AVL in 1971. This old method uses a methane-hydrogen scale, with
number 100 being the knock equivalent of pure methane, and 0 assigned to

17
hydrogen. The scale is based on a complex interpolation procedure, using ternary
diagrams, which makes it a bit outdated for modern technologies. Another
disadvantage with the AVL method, is the uncertainty around the handling of
sustainable fuels containing CO2, CO, H2 and higher hydrocarbons, C4+
(Andersen, 1999).
The main motives for the development of a new tool were the trending towards
higher break mean effective pressures, ultra-lean burn engines and higher
performance, which knocking puts a limit on, because of the higher firing
pressures. A better method was needed for these modern engines and ‘new’ fuels
that allows for higher performance on a broader range of fuels. One key
requirement was to have a straightforward algorithm, that could easily be
integrated for fuel-adaptive control systems. Based on these requirements, a
decision to develop a gas rating tool ‘calibrated’ to the latest engine technologies
was made. For this purpose, tests were conducted on a W34SG engine, with
340mm bore and 400mm stroke, to deliver specific data on the relations between
fuel gas composition and knocking behaviour. By request, DNV GL was the
partner assigned to build the calculation tool. The approach was to develop a
combustion phasing model, using engine specific details, thermodynamics and
chemical kinetics to get corresponding pressure profiles for the simulation and
measured pressures for different gas compositions. The next step was to develop
an ignition model with the correct autoignition chemistry, where a Rapid
Compression Machine (RCM) was used. With an accurate simulation, end-gas
auto ignition could be modelled by increasing the intake air manifold
temperature.

18
Figure 11 Modelling process of knock characterization (van Essen & Gersen, 2018)
To compare the knock resistance of a gas mixture, a n-Pentane scale was used,
referred to as Wärtsilä Knocking Index (WKI). This index expresses the
equivalent fraction of n-Pentane in Methane under the same engine conditions,
and is a straight forward polynomial equation. The WKI was further-on converted
to a 0-100 methane number scale (van Essen & Gersen, 2018).
𝑊𝐾𝐼 = ∑ 𝛼𝑖,𝑛 𝑥𝑖𝑛 + ∑ 𝛽𝑖,𝑛 𝑥𝑖
𝑛𝑥𝑗𝑚 (15)
𝛼𝑖,𝑛 = Binary coefficient for component 𝑖 and exponent 𝑛.
𝑥𝑖 = Share of component 𝑖, 0 to 1.
𝑛 = Binary exponents = 1, 2, 3 and 4.
𝛽𝑖,𝑗,𝑛 = Ternary coefficient for components 𝑖 and 𝑗, and exponent 𝑛.
𝑥𝑗 = Share of the second component 𝑗 in the ternary mix.
𝑚 = Ternary exponents = 1, 2 and 3.
where the binary part states how much an individual gas, for instance methane,
contributes to the methane number. The ternary coefficients states how the
reaction between two gases, for instance methane and ethane, contributes to the

19
overall methane number.
2.3 Engine knocking
Abnormal combustion events, such as knocking, can have severe effect on engine
performance, and even lead to potential damage if not controlled correctly.
Knocking is the name given for the noise that is transmitted through the engine
structure, when a spontaneous combustion ahead of the flame front occurs. When
this happens, there is a rapid release of chemical energy in the end gases, which
leads to substantially higher, local, pressure pikes, and propagation of pressure
waves throughout the combustion chamber. In normal operation, end gases
inside the combustion chamber will be consumed by the propagating flame front,
and the fuel air mixture will be burned as it moves outwards from the ignition
point. In this case, the end gas temperature is lower than the temperature at
which the gas blend auto ignites. The risk of end gas knocking increases with the
rising temperatures inside the combustion chamber.
Knocking is best illustrated in form of a pressure-crank angle diagram. In Figure
12.a normal combustion, 12.b light knock, and 12.c heavy knocking is shown.
These curves are taken from a real engine test, and show the characteristic
pressure waves that occur when knocking takes place. As expressed in these
pictures, heavy knocking occurs closer to the top dead centre, which is the
vertical line in Figure 10, and result in larger amplitude fluctuations. If knocking
is left unattended, even for a shorter period, it can lead to severe engine damages.
To prevent seizures, engines are usually equipped with safety systems, that shuts
the engine down when heavy knocking occurs.

20
Figure 12 Pressure pikes from knocking events (Heywood, 1988)
Even if an engine can withstand the pressure pikes of lighter knock, it is not
desirable to operate the engine in this state, since the abnormal combustion
behavior will affect the heat release negatively. Leading to higher component
temperatures, and higher NOx emissions. Furthermore, the higher temperatures
inside the cylinder might escalate the knocking into higher amplitudes and a so-
called snowball effect is introduced, leading to higher levels of knocking
(Heywood, 1988).
2.3.1 Knock tendency factors
Since knocking is linked to the temperature of the end gas zone within the
combustion chamber, factors that impact those conditions are of interest, where
compression ratio plays an important role. With higher compression ratios, the
end pressure before combustion is higher, and therefore temperatures rise as
well. However, engines run at a fixed compression ratio and from a control point
of view, it is not possible to alter this parameter while the engine is running.
One of the main controllable factors is the point of ignition, referred to as ignition
angle or ignition timing. Usually, engines are sold at a fixed engine NOx output,
and by seeking the optimal efficiency the ignition angle is tuned. By advancing the
ignition timing, the combustion is phased closer to TDC, increasing the burned
gas temperature. This will also pro-long the period at which the end gases are
exposed to high temperatures, therefore decreasing the knock margin. It is not

21
only knocking that becomes a problem with higher temperatures, but thermal
NOx formations as well. To meet the set emission levels, combustion
temperatures must be kept at certain points, according to the regulations at the
location where the engine will be used.
Boost pressure is another engine parameter that can easily be controlled. By
controlling how much air is entering the cylinder, the end pressure before the
combustion can be altered, and therefore also temperature and knock limits. One
obvious and effective way to cool down the gases, is to lower the charge air
temperature, but again, the cooling is usually set to a specific point and not used
as a controllable parameter. Also, the humidity of the incoming air is a factor that
influences the knock sensitivity, since some of the heat released during the
combustion will be used to vaporise the water content of the charge air.
Another factor that influences the knocking behavior is the air to fuel ratio. A
leaner mixture of air and fuel will combust at a slower speed than a richer one,
therefore lowering the risk of knock. This is also controlled by altering boost
pressure. The risk with running on an ultra-lean mixture, is if the mixture fails to
ignite, so-called misfire. Modern engines, using exhaust gas circulation, can also
experience this problem if too much of the inert gases are circulated back into the
combustion chamber. Under misfiring conditions, the hydrocarbon emissions
will increase, since there are unburned gases that leave the engine (Hiltner &
Fiveland, 2006).
2.3.2 Operating window
The operating window, is the area or space in which an engine can operate
normally. The window is constrained by factors that are either fixed, or changing
over time, such as the ambient pressure and temperature. For a gas engine, the
operating area can be visualised by using ignition timing and lambda value as the
degrees of freedom, as these are the primary control parameters for a gas engine.
In Figure 13, the area in which the engine operates is limited in the upper right
side by the turbocharger´s capability to supply the engine with more air when the

22
wastegate, which regulates how much of the exhaust gases are by-passed and not
lead through the turbocharger, is fully closed. This is mainly influencing the
maximum possible lambda ratio, air to fuel ratio, since the turbocharger operates
at its maximum capability when the wastegate is fully closed. In the other end,
high exhaust gas temperature limits the engine to run on lower lambda ratios,
since the combustion will be later and more of the burned fuel will leave the
engine as heat, in other words, lower efficiency. In the upper and lower parts of
the figure, knocking combustion and misfiring are the limiting factors, mostly by
the ignition timing. In Figure 13, the operating point is set a few timing degrees
below the knocking curve, the space in between is the earlier mentioned knock
margin. The placing of the point is mainly based on the NOx tuning of the engine.
Higher allowed NOx levels move the point closer to knocking limits, and wise
versa. A smaller knock margin will also result in higher efficiency, because of a
faster combustion.
Figure 13 Typical operating window for a Wärtsilä SG engine (Hattar, 2005)
This kind of figure is only valid for a fixed set of parameters, load, methane
number and charger air temperature for example. If these values change, the
window will move within the timing-lambda diagram. This would require the
operating point to move as well, to obtain the same knocking margin. Regarding

23
gas quality and methane number, the knocking line will move downwards with
lower MN and upwards with higher MN values. Lower methane numbers might
cause the engine to knock, which is countered by a knock detection system, that
in first hand tunes the ignition timing closer to the top dead centre, or in the
diagram, down, and into the operating window again. The system will afterwards
try to tune the timing back to the initial point. However, if the methane number
rises, there is currently no control function for the window moving upwards.
Which will increase the knock margin at the cost of efficiency (Hattar, 2005).
2.4 Gas quality measurement system at Toftlund Fjernvarme
A few months prior to the start of the thesis, measurements of the incoming gas
quality were commenced in a test installation, Toftlund Fjernvarme, located in
Denmark. Where incoming gas quality is monitored continuously as their
W1834SG engine is running. Gas composition is measured using an MKS
Precisive® Gas Analyser, which is connected to the facility’s gas piping. Using the
measured values, the methane number and heating value are calculated by the
system setup. These measurements, along with engine data are logged to an
online application and are accessible from any computer or mobile unit. The main
objective of this trial, is to test the sensors capability of measuring rapid changes
in gas quality, and by evaluating logged data, find a correlation between changing
gas composition, engine parameters and knocking levels within the engine.
2.4.1 MKS Precisive® Gas Analyser
The MKS sensor works by a principle where radiation from a broadband light
source is partially absorbed by the different gas species present in the sensor cell.
Since the light absorption occurs at specific wavelengths and magnitudes,
depending on the gas compound and concentration, these can be measured with
a spectrometer. In principle, each compound has its own unique absorption
spectrum, which can be used to determine the species. Furthermore, the
magnitude of the absorbed light, is a function of the number of molecules in the

24
gas. Using this kind of technology, the MKS sensor gives an output in form of a gas
composition, which in this case is further used as input for the MN and LHV
calculations (MKS Instruments, 2018).
2.4.2 Gas sensor- and communication setup
At Toftlund, the measuring equipment is located next to the gas piping in the
engine cell. Incoming gas is lead and controlled by a valve to the MKS sensor,
through a piping system with a pressure reducer and flow controller, where
pressure is lowered to 0,5 bar and gas flow set to around 0,4 l/min. Since the
distance between the sampling point and engine is quite short, the gas has likely
entered the engine at the time of a confirmed measurement. However, the gas lag
between a confirmed measurement and when the fuel is burned, is dependent on
the gas flow to the engine, which is affected by the engine output and energy
content of the gas. Measured gas samples are ventilated from the measuring
device to the atmosphere, which might seem controversial when trying to
improve on hydro carbon emissions. The amounts are anyhow much lower than
the blow by emissions that the engine produces, and considering the whole
system, the benefits from an engine controller based on real-time gas quality
would reduce the overall emissions.

25
Figure 14 MKS installation with piping, valves, pressure and flow controllers.
The MKS unit is controlled by the engine control system, which activates the
sensor and open the gas valves at the sensor piping. Measured data is transmitted
from the sensor to the automation system via Modbus communication. Due to
different communication protocols between MKS and the rest of the system, the
measured gas composition data is first sent to a Programmable Logic Controller
(PLC) unit, which decodes the Modbus signal to a 16-bit from 32-bit floating
value. The PLC communicates with a COM-10 unit, that runs on the same
software as modern Wärtsilä engines, UNIC, which performs the MN and LHV
calculations, Figure 15. From here on, the measured values and calculated results
are communicated via Modbus, to the Wärtsilä Operating Interface Software,
WOIS. Which is run on the control room computer, from where the engine is being
monitored.

26
Figure 15 MKS communication setup at Toftlund.
From WOIS, which is the main monitoring system for engine data, these values
can be seen in real-time. The same data is also logged to and accessible from an
online web interface, called Wonderware. From here, measured values can be
observed as the engine is operating, and via this software, the raw data is
downloaded for analysis as well.
2.5 MEMS Qs Flonic sensor function and measurement
principle
Traditionally, gas analysers measure compositions in gas mixtures. However,
MEMS use a different approach to their measurements. The QS Flonic relies on a
micro-thermal sensor, based on a complementary metal oxide semiconductor,
CMOS. This allows the sensor to measure a mixture for its thermal conductivity,
κ, heat capacity, 𝑐𝑝, and from a pressure sensor- and sonic nozzle setup also
density, ρ. These parameters are governed by the one-dimensional heat
conduction Eq.(16).
𝑐𝑝
𝜅𝜌��
𝑑
𝑑𝑥Θ = ∇2Θ +
1
𝜅Q (16)
where 𝜌�� is the mass flow across the sensing element, Θ temperature, 𝑑
𝑑𝑥Θ
temperature gradient, ∇2Θ Laplace operator on the temperature and Q states
the heat input from the hot wire used to determine thermal conductivity. The
other physical components in the sensor consists of: a thermopile, critical

27
nozzle, gas reservoir, regulating valve and a hotwire heating element as shown
in Figure 16.
Figure 16 MEMS Qs Flonic gas sensor (Soltic, Biffiger, Prêtre & Kempe, 2016)
One measurement cycle consists of two steps. A magnetic valve is opened to
allow the gas to enter a small chamber in front of the critical nozzle. This nozzle
is used to create a flow through the sensor, and in that way, also a pressure
decay inside the sensor. Which follows an exponential decay law, with the decay
time being a function of the molecular mass of the gas. Since molar volume is
near identical for most gases, density is inversely proportional to the molecular
mass under normal conditions, giving the first parameter
𝜏 ∝ √𝑀 (17)
where 𝜏 is the decay time which is caused by the mass flow rate and M is the
molar mass of the gas (Zajc & Ryll, 2017). When the pressure before the sonic
nozzle equals the back pressure after the sensor chip, flow stops, and the second
part of the cycle takes place. Thermal conductivity is derived using a thermopile,
located on the CMOS chip. Since mass flow is well defined due to the sonic flow

28
conditions, the third parameter, heat capacity, can be solved from Eq.(16) (Zajc
& Ryll, 2017).
These physical parameters 𝑆 ∶= 𝑓(𝜅, 𝑐𝑝, 𝜌), can be used as input to correlate gas
properties, G, including calorific value and methane number. By stating a
correlation function 𝑓𝑐𝑜𝑟𝑟(𝑆), describing the relation between the measured
parameters and the desired output values, a connection can be found. The
correlation schemes are pre-programmed in to the sensor and all the calculations
are done within the device. Data is further transferred to a logging program via
CAN communication (Soltic, Biffiger, Prêtre & Kempe, 2016).
2.6 Earlier research: “Online gas quality measurement and
engine control”
Wärtsilä’s internal development project for gas quality measurements was
kicked off back in the last months of 2015. During 2016, a master’s thesis
regarding the subject was written by Jacob Grönroos at Aalto University, where
the practical work was done within the development project. The focus of his
research was placed on newer and faster gas sensing technologies, compared to
traditional gas chromatographs. Mainly by testing the MKS Precisive gas analyser,
which was new for Wärtsilä at that time. Apart from the tests with the MKS, he
also proposed a communication setup to the engine control system, and showed
that the control system can calculate MN according to the new model. As one of
the results he listed a few possible ways on how to make an engine control
function based on methane number, by for example changing engine timing and
boost pressure. Finally, a simulation with a real time engine load derating
function was conducted, to prove that a control application with MKS readings is
possible. In the conclusions, the MKS sensor was found to be accurate enough for
the intended purpose.
As recommendations for future development (Grönroos, 2016) stated, “Engine
derating avoidance by changing charge air and ignition timing” and “Engine
optimisation for changing LHV and MN” as the most important ones.

29
3 MATERIAL AND METHODS
This chapter will explain the work process and different steps of the Thesis. In
the beginning of the project a decision to divide it into four different topics was
made, these will be presented in detail here.
3.1 Follow-up of Toftlund Fjernvarme measurements
Regarding the communication setup, some small updates were finished during a
visit to the site. Mainly considering the channels that the MKS uses to transmit
data and how the software’s handle them as inputs. As earlier mentioned, the
output from the sensor is a total gas composition. The sensor measures hydro-
carbons and carbon dioxide contents of the gas and balances the remaining part
with nitrogen up to 100%. In Table 2 the channels that are being used for the
communication can be seen. Channel 6, that transmits the pentane reading,
reports the two isomers lumped together, since the MKS cannot differentiate
them. A bug in how the UNIC software handled them as inputs was discovered,
more specifically how the signal was treated as ratios of the two isomers, i-
pentane and n-pentane. For some reason the channel value was not divided, but
only separated to two different inputs. Meaning that the total amount of pentane
present in the calculation doubled. The problem was solved by making the ratio
a changeable parameter in the software, which can be altered using a UNITool
software. The values were set according to what is normally an average in the
distributed gas, 80% n- and 20% i-Pentane, these are however quite small
quantities and their knock behaviour are very similar.
Table 2. MKS MODBUS output registers at Toftlund
EC_General_01.Value Methane reading %
EC_General_02.Value Ethane reading %
EC_General_03.Value Propane reading %
EC_General_04.Value i-Butane reading %
EC_General_05.Value n-Butane reading %

30
EC_General_06.Value i-Pentane and n-Pentane reading %
EC_General_07.Value Carbon dioxide reading %
EC_General_08.Value Nitrogen balance reading %
3.1.1 Smart 𝐍𝐎𝐱 sensor
In addition to the earlier mentioned gas quality measurements, the installation is
also equipped with a Siemens Smart NOx sensor. Which measures nitrogen oxide
and oxygen contents of the exhaust gas, as the engine is running. With this sensor,
the purpose is to see how the NOx emissions change in relation to gas quality. It
is already known that the emissions are linked to end gas temperatures inside the
cylinder, and therefore also to the efficiency of the engine. The real objective is,
however, to study at what rate, and how much the NOx formations are affected.
With this data, it could also be possible to deduct how the engine would behave
if adjusted to the same NOx levels over the whole MN span.
However, some setbacks were encountered with the NOx measurements. After
the tests had been going on for a few months with this setup, the sensor failed. It
was returning false values, if any at all, from time to time. During the mentioned
site visit it was replaced to a new one, with limited success. It was concluded that
a possible root cause for the failure could be thermal overheating of the wiring
harness. Due to the exhaust gas heat recovery system that the installation is using,
the piping is heavily insulated for maximal effect.

31
Figure 17 Smart NOx sensor placement (Photo: D Högberg)
As the sensor is placed inside the exhaust pipe, most of the wiring is lead through
the insulation material, therefore it is constantly exposed to high temperature,
with very poor cooling from the ambient air, Figure 17. This is believed to be the
cause of the fouling sensor. An idea to construct a funnel around the wiring for
better cooling was proposed and approved by the plant owner.
3.1.2 Performance analysis based on methane number
The focus of this analysis was put on events where rapid variations in MN could
be seen, as well as other interesting behaviours. In practice, the monitoring was
done on a daily and weekly basis by following the operation of the engine through
Wonderware Online. As a special case study, an incident where the MN dropped
from around 90 to 70 in about 45 minutes was chosen. In this study, the
calculations made, were based on the performance- and gas composition data
acquired from Toftlund as a five-minute average (Appendix 1).
Here it could be observed that the way the engine is tuned, efficiency along with
knocking values decreases when the incoming gas is changing from a high
methane number to a gas with higher contents of ethane and propane. At this
point the NOx sensor was not reporting any values anymore, therefore they could
32
not be compared here. However, from a similar calculation created by Jenny
Jansson at Energy Solutions, NOx values were also shown to decrease with the
lower efficiency, which is expected.
3.2 50SG Methane number-based control tests
Apart from the Online gas quality measurements project, the automation
department was also investigating in how to utilise methane number and gas
quality for fuel transfers between ethane, propane and natural gas, for a low
methane number version of the 50SG engine. On their behalf a decision to test
engine tuning with the MKS readings as input was made. These tests were
decided to include into this thesis as well, as they fall within the scope of the
project. The practical testing was made together with experts from different
departments within Wärtsilä, on the 6L50SG engine located at the engine
laboratory in Bermeo, Spain, over the course of one week.
3.2.1 Communication and sensor setup
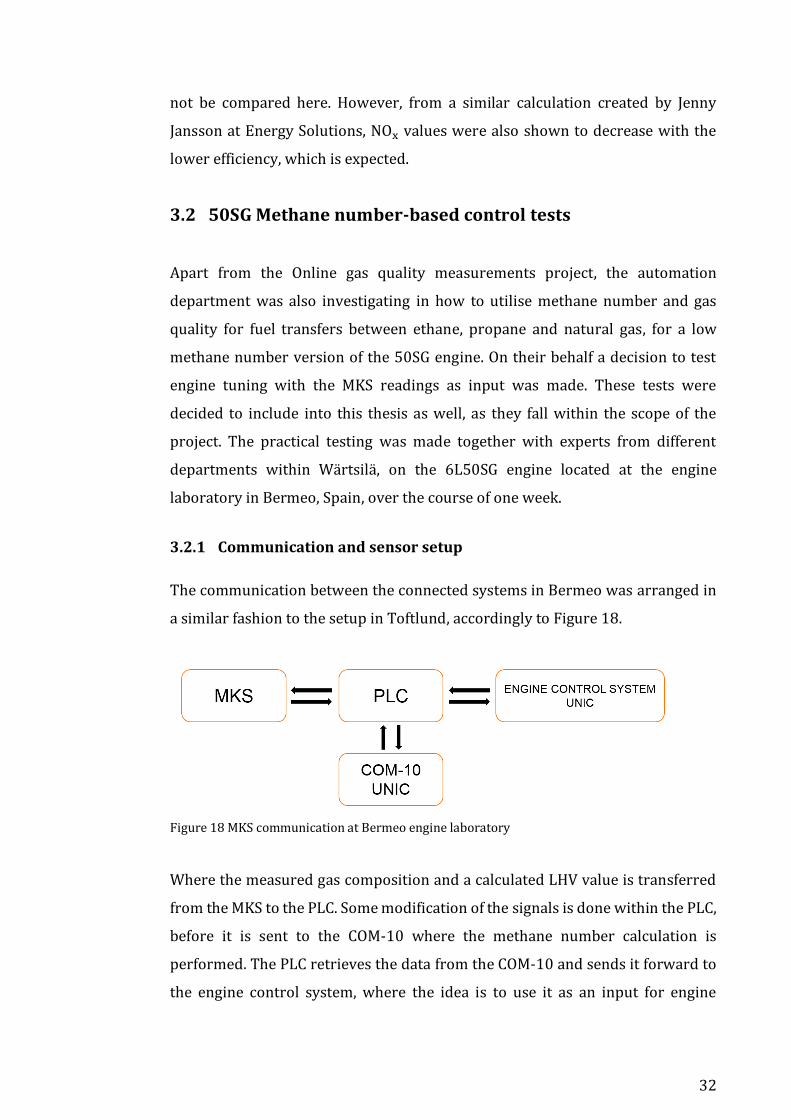
The communication between the connected systems in Bermeo was arranged in
a similar fashion to the setup in Toftlund, accordingly to Figure 18.
Figure 18 MKS communication at Bermeo engine laboratory
Where the measured gas composition and a calculated LHV value is transferred
from the MKS to the PLC. Some modification of the signals is done within the PLC,
before it is sent to the COM-10 where the methane number calculation is
performed. The PLC retrieves the data from the COM-10 and sends it forward to
the engine control system, where the idea is to use it as an input for engine

33
parameter tuning. The Modbus list, stating which compositions are sent over
which channels, is however slightly different compared to the one in Toftlund.
This is because the current recipe is calibrated to measure higher ranges of
ethane and propane, and therefore some of the lumped compositions differ from
the old recipe. For this reason, it was decided to move the rationing part of the
channels, from the COM-10, to the PLC. In order to have a standardised UNIC
software in the future. With the new setup, all the modification, normalisation
and dividing of channels into different isomers of a composition is done within
the PLC, and as such, the COM-10 will only handle one isomer of one composition
per channel.
Table 4. MKS MODBUS output registers at Bermeo
EC_General_01.Value Methane reading %
EC_General_02.Value Ethane reading %
EC_General_03.Value Propane reading %
EC_General_04.Value i-Butane reading %
EC_General_05.Value n-Butane and n-Pentane reading %
EC_General_06.Value i-Pentane, neo-Pentane and n-
Hexane reading %
EC_General_07.Value Carbon dioxide reading %
EC_General_08.Value Nitrogen balance reading %
By studying the gas chromatograph readings for the incoming natural gas,
channel five is divided into 90% n-Butane and 10% n-Pentane. Likewise, channel
6 is divided into 100% i-Pentane, leaving neo-Pentane and n-Hexane at 0%,
simply because they are not shown to be present in the gas supplied to engine
laboratory. These rationings were as earlier described included in the PLC unit.
In the engine cell, the sensor itself was connected prior to the arrival at Bermeo
and placed next to the engine gas ramp. The sampling point is placed 12 meters
away from the first engine cylinder inlet, from where it is lead to the MKS sensor
in a four-meter-long pipe. In addition, the flow can only be regulated by a hand
operated shut-off valve, with no pressure- or flow regulator, which would be very

34
useful, since the MKS is somewhat sensitive to pressure pikes. The knowledge
about the flow thru the sensor is also valuable, regarding gas lag between the
sensor and the engine.
3.2.2 Engine mapping
The parameters for engine tuning are usually determined by so called maps. A
map consists of two input parameters that function as x and y axes in a diagram.
The controlled output will then be a function of these two inputs. In practice the
engine control system will use these maps to determine what values to give as
output to the engine. For these tests an existing, not normally in use, application
for engine tuning based on calorific value of incoming gas was used. With the
input on the y axis changed from calorific value to methane number. From the
mentioned application, two different maps were used for controlling the engine
during the transfers between different gases: an ignition-timing map and a boost-
pressure map. As input values for the control, methane number and engine load,
defined as break mean effective pressure, were used. For the different pure gases,
methane numbers were 35 for propane, 51 for ethane and 75 for natural gas. In
the maps these values were set as specific points, and as the methane number or
load (electrical output) changes either down or up, the control function will
interpolate between the nearest values.
Figure 19 Ignition timing map with MN with a factor of 100 and BMEP in mbar as inputs.

35
Figure 20 Boost pressure map with MN with a factor of 100 and BMEP in mbar as inputs.
The functionality of the tuning was to reduce the ignition timing and increase
boost pressure when the methane number would decrease, and vice versa. In
basic, the engine is tuned according to the ignitability of the gas (MN), where
natural gas parameters will have an earlier ignition timing and lower A/F ratio
compared to Ethane and Propane. Even if the engine that was tested is running
on relatively low compression ratio, to be able to handle low methane number
gases, the tuning needs to be correct to operate the engine, especially on higher
loads. If there would be any issues with the control, leading to wrong ignition
timing, the engine could possibly either knock or misfire due to the large variety
in MN. The exact values for timing and boost pressure for the specific gases were
taken from performance tests that had been performed on the engine earlier. In
practice this means that the maps do not consider changes in natural gas quality
above MN 75, since the supplied gas at the laboratory had a methane number at
around 75. So therefore, any tests with higher methane number could not be
performed. However, as they do interpolate between values and the switches
between gas types, and as the transfers between gases are completed in a slow,
ramping manner, it can be seen as a typical gas quality change. Noticeable aspects
in Figures 19 and 20 are that the MN has a factor of 100, BMEP and boost pressure
values are in mbar and ignition timing is expressed as crank angle degrees before
TDC.
3.2.3 Test program for gas transfers
Since these tests were the first ones performed with a methane number-based

36
engine control the focus was primarily placed on the functionality of the control
and the communication between all the different components present in the
system. With the whole chain of communication working, the target was to enable
transfers between natural gas and the lower methane number associated gases,
propane and ethane at the maximum possible load for each. Among initial testing
with the application enabled and other parameter tunings, the more interesting
points run that are covered in this thesis are listed below.
1. First start with application enabled. The first transfer was performed from
natural gas, to mixing in 20% propane, and after running a while at 80% natural
gas, 20% propane, switching back to pure natural gas. This was done at an engine
load of 30% out of maximum output
2. Transfer from NG to pure propane and back to NG at 30% output
3. Transfer from NG to pure propane and back to NG at 50% engine load,
shutdown from heavy knock
4. Transfer from NG to pure propane and back to NG at 50% engine load
5. Transfer from NG to pure propane and back to NG at 70% engine load
6. Transfer from NG to pure ethane and back to NG at 70% engine load
7. Transfer from NG to pure ethane and back to NG at 100% engine load
8. Immediate, fast transfer from NG to ethane at 30% out of maximum engine
output
Engine load and maximum output is defined as percentages of what the highest
allowed power output is when the engine is operating on natural gas. The results
from these test points are covered in the results chapter, along with other
findings and problems related to the control functions.
3.3 Testing and evaluation of MEMS QS Flonic sensor
As earlier described, an MKS Precisive sensor has been tested within Wärtsilä and
installed to the mentioned powerplant in Toftlund. In this part of the project a
sensor with a different technology was tested, the MEMS QS Flonic sensor. The

37
purpose of this study, was to determine what types of measures it can handle,
where it can be used, and if this device could be used for quality measurements
regarding engine control. Initial tests with the new sensor, alongside with the
MKS for comparison were carried out at Wärtsilä’s fuel laboratory. For long term
testing, the MEMS sensor is to be placed in the engine laboratory, measuring gas
properties continuously as the laboratory engines are running. Evaluations of the
test results were carried out all along the way.
3.3.1 Fuel laboratory tests
Initial testing of the sensor’s function and usability was done in Wärtsilä’s fuel
laboratory in Vaasa together with Andreas Kempe from MEMS AG and in-house
personnel. For these measurements, a test plan was made with different
compositions that were going to be measured with the sensor. Using a
comprehensive list of gas compositions and corresponding methane numbers,
MEMS prepared a suitable correlation for WMN and LHV. The testing was done
over the course of two full days. A mixing station was used to achieve the desired
compositions, using differential pressures to determine right amounts of pure
gases (Appendix 2). In addition, the MKS Precisive was used to log data for
reference, and result comparison.
Measurements are setup in a way that the MEMS and MKS sensor are placed in
series, with the gas entering the MEMS first. In this way corresponding
measurements from both analysers are achieved. The period for measuring is set
to around 20 minutes, resulting in about 35 MEMS readings for each composition.
After each test, a new composition is mixed in the mixing station and the system
is purged out from old gases
Logging of the measurements were done with a MEMS implementation of a
program called LABView. Through this software the sensor can be controlled
manually, and measurements started and stopped. Analysed data that the MEMS
QS Flonic returns as output is: LHV (kWh/m3), Wobbe Index (kWh/m3), WMN,
AVL MN, Density (kg/m3). In addition to these, there are also some sensor

38
specific parameters regarding the nozzle- and flow saved into the same file. The
logging program also saves the raw data from the measurements, which gives the
opportunity to “tune” the sensor afterwards. With the access to the direct signals,
better correlation schemes can be fitted for example to the Wärtsilä methane
number, which probably is the biggest challenge with the MEMS sensor.
The results from the initial testing is gathered together with corresponding
results from the MKS. A comparison with the both sensors and the actual
parameters of the mixed gas is made and will be presented in the next chapter.
3.3.2 Engine laboratory installation and testing
For long term testing of the sensor’s robustness and drifting, it was decided to be
installed in the Wärtsilä City engine laboratory. According to the plan, the sensor
will be placed outside, next to the LNG tanks and set up to communicate with the
facility’s automation system. The sensor would be left to measure gas
composition and be monitored by the engine lab personnel for about four
months, where after further actions would be decided, based upon the results of
the tests.
To begin with, an initial test was done together with Guy Hägglund, chief
automation engineer at the lab to test the communication and see if the sensor
can be fitted to the lab system. Since the current version of the sensor
communicates over CAN protocol, a CAN to Modbus RTU converter was used to
connect it to a desktop computer via ethernet. Connection towards the sensor
was successful in the sense that a line of communication was open, however, the
sensor was not returning any values when requested to. Considering that the
sensor needs to be pressurised to perform measurements, it was tested with
compressed air, with no further success. According to Hägglund, the problem was
related to the conversion between CAN and Modbus communication. MEMS AG
was contacted about the problem and offered to supply a separate CAN to
Modbus converter of a different make, configured and tested by them.

39
At this time, the sensor being tested was a rented Qs Flonic V1, with a rent to
purchase contract. As MEMS were currently at the stage of launching the newer
version of the sensor, an agreement to switch the rented V1 to a purchase of the
V2 was made. As the newer version is an ATEX certified sensor, there would be
no need of an extra ATEX approved casing when installing the sensor at the gas
field, which solved a major problem. The newer version also uses Modbus RTU
communication, so the need for a converter was also eliminated.
3.4 Reference gas and correction factors
This part of the thesis work is primarily a theoretical study on engine
performance data from Wärtsilä´s laboratory engines. The basic idea of a
reference gas coefficient is that whatever gas you operate your engine on at the
factory test run, efficiency and emissions could be estimated for another type of
gas by using compensating factors, if operating conditions and tuning is alike. A
new reference gas, G-LNG was also proposed within a joint project between
Wärtsilä and other parties in the industry. For instance, an engine maker can at
their factory test use a methane number 75 gas, and by applying the mentioned
correction factors, accurate values for emission and electrical efficiency can be
provided to the customer, who will operate with a methane number 90 gas.
As seen in Toftlund, efficiency and NOx emissions variations are significant in
relation to the gas quality. This is however quite an extreme case, but it does
illustrate the need. The benefits of the correction factors for gas quality are many.
For instance, the possibility to more accurately estimate the impact of operating
on different gases for customers, especially as many ship operators bunker LNG
at different locations over the world. In the future, engines could be tested and
sold according to one gas, with correction factors for MN variations. If the new
reference gas would be implemented as a new standard, and widely accepted, it
would bring transparency to the competition between engine makers as
everyone would be required to test their engine according to the standard. This
is however both good and bad, as it might be beneficial for some to show their
performance according to a standard, and not for others.

40
As input for the study, W31SG performance data and corresponding gas
composition was used to make the numerical calculation. The selected points
were taken from earlier load derating tests done at the Bermeo- and Vaasa city
laboratory. When performing the experiments to determine the load derating
points, engines are operated with fixed tuning over a span of different methane
numbers to check where the engine starts to knock. Lowering of the methane
number is done by mixing in propane into the supplied LNG or pipeline gas. It
was decided that these results would be suitable as input for this part, and that
no separate testing would be needed.
3.4.1 G-LNG reference gas
For the moment being, there are a couple of different test gases defined in the EN-
437 standard, most of which are pure methane diluted with either nitrogen or
hydrogen. There is however one essential problem with these. Their similarities
with any real-world existing fuel is next to none. Only one of these gases seemed
to be comparable with market gases. This test gas is named GR, and achieved by
adding 13% ethane into methane, giving it somewhat similar properties to what
a typical LNG could have. However, it doesn’t quite reassemble the typical
properties of a gas containing propane (Nicotra, 2012).
And with the knowledge about what the future LNG market will look like, a
suitable composition for the, G-LNG, was nominated by the project core team. One
of the criteria for the gas was to ensure that the blending of the gas will not be too
expensive and complicated, therefore it was decided that the mixture should not
contain hydrocarbons above propane. The gas composition should also be close
to what is seen as the optimum performance point of engines in general, to
prevent over conservative designs. Lastly and most importantly, the reference
gas should resemble the gases that are available in the market. What they studied,
was the global average- and most common mixture of LNG that is present on the
recent market.

41
Table 4. G-LNG compared to global average and most common LNG (Koot, Future LNG
Quality Study, 2018)
Global Average
(Weigt & Norm)
Most Common
(Qatar Lean)
Proposed
(G-LNG)
Methane 92.9 93.3 92.5
Ethane 5.2 6.3 6.0
Propane 1.2 0.1 1.5
iso-Butane 0.2 0.0 0.0
n-Butane 0.2 0.0 0.0
C4+ 0.0 0.0 0.0
Nitrogen 0.2 0.4 0.0
PKI 79 88.0 82.0
AVL 78.9 84.00 79.9
Wartsila MN 78 86.00 80
Gas density (kg/m3) 0.73 0.72 0.73
LNG density (kg/m3) 445 439 445
HHV (HHV. MJ/kg) 54.8 54.8 55
The proposed G-LNG that can be seen from Table 4 correlates very well with both
the global average-, as well as the most common, Qatar Lean LNG. Another
advantage with having only hydro carbons up to propane, is that all the MN
calculation methods align with each other. The actual value is 80 on the WMN
scale and is also something that is considered a middle point, or a number to
which most engines are optimised to (Koot, Reference gas proposal - G-LNG,
2018).
3.4.2 Efficiency, 𝐍𝐎𝐱 and THC correction factors
Using the test points described in the beginning of this chapter, a comparison
between consecutive tests is performed and plotted as electrical efficiency in
regard to methane number. As input for the emission factors, measured values
are used. For the MN and LHV calculation, the measured, natural gas composition

42
and re-calculated, blended gas composition is utilised. The different tests are
plotted as their own series in the same diagrams, and the idea is to derive one
factor for each test series and afterwards calculate a mean factor and study how
well it would fit overall. The actual work is done with Microsoft Excel’s inbuilt
trendline function and normal mean value calculations.
Eq.(17) expresses how a linear function would look like for correcting the
electrical efficiency according to methane number.
𝑒𝑓𝑓𝑖𝑐𝑖𝑒𝑛𝑐𝑦𝑐𝑜𝑟𝑟 = 𝑒𝑓𝑓𝑖𝑐𝑖𝑒𝑛𝑐𝑦𝑟𝑒𝑓 + (𝑀𝑁𝑟𝑒𝑓 − 𝑀𝑁𝑛𝑒𝑤) . 𝐶𝑒𝑓𝑓 (17)
𝑒𝑓𝑓𝑖𝑐𝑖𝑒𝑛𝑐𝑦𝑐𝑜𝑟𝑟 = Corrected electrical efficiency
𝑒𝑓𝑓𝑖𝑐𝑖𝑒𝑛𝑐𝑦𝑟𝑒𝑓 = Measured reference efficiency
𝑀𝑁𝑟𝑒𝑓 = Reference methane number
𝑀𝑁𝑛𝑒𝑤 = The new methane number which the engine will run at
𝐶𝑒𝑓𝑓 = Correcting factor

43
4 RESULTS
This chapter will present the results and findings that were discovered during the
tests, calculations and overall work process. The subchapters are ordered in the
same way that they were presented in the previous chapter.
4.1 Toftlund 18V34SG case
From the data acquired at Toftlund (Appendix 1) the efficiency is calculated
according to Eq.(11), and is shown to increase with lower methane numbers.
Figure 15 shows the change rate in efficiency versus MN, where numerical values
are hidden for confidentiality reasons. The actual difference is 1.5 %-units higher
efficiency per 10 MN units.
Figure 21 Efficiency and MN changes at Toflund Fjernvarme 21.3.2018. (Appendix 1)
The change in methane number seen in Figure 21, is due to the contents changing
in the incoming natural gas, in form of ethane -6.7 %-units, ethane +2.8%-units,
propane +2.2%-units and some minor increases i- and n-butane and pentane
(Appendix 1). Some small amounts of inert gases, in form of nitrogen is present
in the gas at Toftlund, they will increase the MN, but as the quantity is very small
and so are the variations, they do not have any bigger impact for this study.
50
55
60
65
70
75
80
85
90
95
36,00
36,50
37,00
37,50
38,00
38,50
39,00
39,50
40,00
40,50
41,00
19:40 19:55 20:09 20:24 20:38
Met
han
e n
um
ber
Elec
tric
al e
ffic
ien
cy %
Time
Eff. %
MN

44
4.1.1 Toftlund site updates
The updates that were carried out during the site visit was for the larger part
successful. Updates to the UNIC calculation for the MN were carried out and as a
result it is now showing correct values. The failure of the Smart NOx sensor was
fixed by changing the sensor itself. As a result, it gives measurements, but not any
reliable values. Overall the gas measurements with the MKS sensor and
communication between the different system works reliably, as well as the
remote monitoring with Wonderware Online.
4.2 50SG Methane number-based control tests
4.2.1 20% Propane transfer on 30% load, first start with application
enabled
As a first functionality test of the methane number controller, a transfer was done
at 30% engine load and with the gas valve positions set at 80% natural gas and
20% propane, which gave an MN deviation from 75 to 46, and back to 75. During
the transfer, the controller reacted as it should to the changing gas quality,
without disturbing the combustion. No knocking or misfiring was observed
either. However, the engine was configured with a quite low compression ratio
of 9.5 and since it was not loaded that much, there should not be any problems
when switching over at this point, regarding knocking.
4.2.2 Propane transfer on 30% load
Secondly, a transfer between natural gas and pure propane was made at engine
load of 30% out of maximum output, with a methane number changing from 75
down to 36 in about 60 seconds. As a feedback of how well the engine was
running, IMEP trends for all cylinders, numbered A1 to A6 was used. IMEP is
described in the theory chapter as indicated mean pressure and in practice it
increases with engine output. For this project it is interesting to examine the
differences in actual values when the engine is operating in steady state on
different types of gases, this is related to how well the maps are tuned for the

45
different methane numbers. But it is also used to investigate how each cylinder
reacts to the methane number-based control function. Some disturbances can be
seen during the shifting between gases and parameters change, but in steady
state operation the trends look normal, Figure 22. No knocking problems were
observed during this transfer either.
Figure 22 IMEP of all cylinders during transfer from NG to Propane and back.
4.2.3 Propane transfer on 50% load, shutdown from heavy knock
The next point was a transfer to propane and back to natural gas on 50% engine
load. During the ramping back to natural gas the engine shut down from heavy
knocking, probably due to a too fast switch and therefore the MKS sensor did not
have time to react to the sudden jump in methane number. Most probably, the
engine was operating on natural gas with propane parameters for a moment,
which lead to poor combustion on some cylinders, increasing the work load for
others, which can be seen in Figure 23. Since some cylinders are working harder,
they are the ones starting to knock and eventually causing the shutdown.
0
5
10
15
20
25
30
0
10
20
30
40
50
60
70
80
500 600 700 800 900 1000 1100
IME
P (b
ar)
Met
han
e n
um
ber
Time (s)
Methane number and IMEP
MN
A1 IMEP
A2 IMEP
A3 IMEP
A4 IMEP
A5 IMEP
A6 IMEP

46
Figure 23 IMEP (bar) trends for all six cylinders labelled A1 to A6 during the shutdown.
In Figure 23 it can also be observed that the lowest lines are represented by the
cylinders closest to the gas pipe inlet on the engine. These cylinders are also the
ones starting to misfire first, strengthening the theory of natural gas present in
the engine before the sensor and control has reacted to the change.
4.2.4 Propane transfer on 50% load
After some tuning of the parameter in the software, another attempt to transfer
between gases at 50% load was made. This time with a slower ramp rate, about
5 minutes from natural gas to pure propane. The transfer was successful and
repeated once, also successfully. However, the IMEP trends showed similarities
to the previous attempt when going back to a higher methane number, the engine
was not knocking though.
The opposite trend could also be seen when going down in methane number,
where the cylinders further away from the gas inlet would start to misfire slightly,
and the ones closer to the incoming gas would go higher in IMEP. This confirms
that there is some flow that is not homogeneously mixed when entering the
engine. This can be seen in Figure 24 which shows the methane number, IMEP for
cylinder A1, furthest away from the engines gas inlet and IMEP for cylinder A6,

47
which is closest to the incoming gas pipe.
Figure 24 MN and IMEP for cylinders A1 and A6
4.2.5 Propane transfer on 70% load
The main goal of these tests was as earlier said, to enable transfers between
different gases at the maximum rated power. For pure propane, the output is set
at 70% of the maximum power allowed when running on natural gas. Also, during
this test point, the switch between natural gas and propane was done in a
relatively slow manner to avoid sudden peaks or drops in methane number. This
transfer succeeded without any problems, even though the IMEP trends show
some small deviations.
Figure 25 MN and IMEP for transfer between NG and Propane at 70% load.
0
10
20
30
40
50
60
70
80
9
11
13
15
17
19
900 1000 1100 1200 1300 1400 1500 1600
Me
than
e n
um
ber
IME
P (b
ar)
Time (s)
Methane number and and IMEP
A1
A6
MN
10
15
20
25
30
35
0
10
20
30
40
50
60
70
80
90
0 500 1000 1500 2000 2500 3000
IMEP
(bar
)
Met
han
e n
um
ber
Time (s)
Methane number and IMEP
MNA1A2A3A4A5A6

48
From Figure 25 it can be observed that the engine was running well on all
cylinders during the transfer. All and all the control function enables transfers on
full rated output for Propane. However, some tuning would be required to get to
the same level of stability as on natural gas, which can be seen from the
fluctuations in IMEP during steady state operation at full load on the two different
gases.
4.2.6 Ethane transfer on 70% load
As there was some time and possibility to run tests on ethane at the engine
laboratory, a few transfers were tried to further test the control function. Since
ethane is more knock resistant than propane, it is possible to operate at
maximum rated output with the current setup of the 50SG engine. The first point
was although done at 70% engine load, which went by with ease. In a way this
was expected, since the methane number changes less, only about 25 units.
4.2.7 Ethane transfer on 100% load
As with the 70% load tests, the full load transfer went very well. IMEP trends
showed little to no deviation during the transfer and remained stable over the
whole period, going both up and down in Methane number. At this load, the
engine was running well on all cylinders, which in a way proves the accuracy of
the MKS sensor, since the mapping of boost and ignition is based on its readings.
Figure 26 MN and IMEP for transfer between NG and Ethane at 100% load.
0
10
20
30
40
50
60
70
80
90
15
17
19
21
23
25
27
29
31
33
35
0 200 400 600 800 1000
Met
han
e n
um
ber
IME
P (b
ar)
Time (s)
Methane number and IMEP
A1A2A3A4A5A6MN

49
4.2.8 Other findings
During the start-up of the engine on the second day of testing, it was found that
the MKS showed some incorrect values. The sensor gave an output of methane
number 48, even though the engine was stopped on natural gas the day before.
After some minutes of fluctuating, the readings finally stabilised at MN 75.
Because of this problem, the first start of the engine failed. It was thought that
some propane could still have been present in the pipe, which would have
condensated during the night, eventually causing the problem.
Also, during the transfers from lower methane number gases back to natural gas,
a small bump was observed in the methane number readings before the actual
increase was measured. This might be caused by a pressure pike inside the gas
pipe as the different valves in the system are actuated. The MKS is quite sensitive
to pressure deviations and this sort of problem could easily have been solved by
using a pressure regulator.
One of the main concerns with these measurements and the functionality of the
control is the lag between measurements and the gas entering the cylinders.
From these tests it was difficult to discern any type of lag between these two.
However, the lag is related to the piping length from the sampling point to the
sensor and engine and related to the current gas flow to the engine. This is
something that should be evaluated further and considered when developing a
real application. As the rate at which the methane number was changing during
these tests was quite slow it did not cause any trouble, except for the “fast” 50%
load transfer on propane.
4.3 MEMS QS Flonic gas sensor initial test results
The initial testing revealed a lot about the capabilities of the sensor that was
tested. Both practical, and measurement related issues were encountered. As the
version that was tested used CAN communication protocol, there was some
connectivity issues from time to time during the testing. Another problem was

50
the time to blend the different mixtures in the mixing station, which decreased
the number of blends that was able to measure. Aside from the communication
issues with the CAN to USB converter the device seemed quite easy to use, and it
would not require much attention if left to measure continuously for a longer
time.
Initially, the plan was to use a gas chromatograph that would measure the
composition exactly as reference. However, there was not enough piping and
connecting pieces to have it connected. Due to time shortage, running out of
ethane and other smaller problems, only half of the planned compositions were
carried out.
4.3.1 Methane number
In Figure 27, the methane number measurement of one of the tested
compositions is plotted. For this composition the MEMS reported a MN about 2
units higher than the reference value. The measurements are anyhow quite
stable, and the different points do not deviate very much from each other. This
proves that the measuring part of the sensor is reliable. In the end, where the
values have flatlined, the gas pressure has been cut off and the sensor will return
the latest value until the measurement has been stopped manually.
Figure 27 Measured methane number over time for test id N8, with reference MN 70.
70
70,5
71
71,5
72
72,5
73
09:12:58 09:15:50 09:18:43 09:21:36 09:24:29 09:27:22 09:30:14 09:33:07 09:36:00 09:38:53
Me
than
e n
um
ber
Time

51
Looking at all the test compositions plotted into a diagram with the mixed values
on the x-axis and measured methane numbers on the y-axis, more variation
between the two can be seen. Figure 28 shows the deviation between the MEMS
and MKS measured methane numbers compared to the linear, actual value line.
This graph shows that there are uncertainties in the measurements, both with the
MEMS and with MKS as well.
Figure 28 MEMS and MKS measured MN compared to actual values.
A few points do correlate very well with both the sensors and the actual value,
some only with MKS and one of the points where only MEMS is close to the linear
line. The average error for the MKS measurements were 5.4 units of MN and for
the MEMS sensor the average error was 9.1 units.
4.3.2 Lower heating value
Measurements of energy content in the gases were more consistent than those of
MN. Figure 29 shows that both the MKS and MEMS correlates very well with the
LHV that was calculated based on the mixed composition. At the same time, it
shows that the MEMS sensor is very well capable of correlating thermal
conductivity, heat capacity and density to the heating value. Even if the MKS
reported false values for the butane isomers, the low quantities do not affect the
50
60
70
80
90
100
110
120
50 60 70 80 90 100 110 120
MEM
S Q
s Fl
on
ic W
MN
WMN Based on mixture
MEMS
Mixed
MKS

52
LHV calculation that much and therefore it follows the line quite nicely as well.
The average errors for lower heating value was 0.57 MJ/m3 for the MKS sensor,
and 0.51 MJ/m3 for the MEMS sensor.
Figure 29 MEMS and MKS measured LHV compared to actual values
4.4 Results from the correction factor study
In Figure 30, the test points that were selected for this study are plotted against
corresponding methane numbers, where each line represents a different test
series. Although the variations are not near the same magnitude as seen in
Toftlund, they are still quite parallel to each other, proving that the efficiency
could be corrected according to what gas, the engine will be running on.
One of the drawbacks with this data, is the low amount of points per series. A
series is a set of experiments with test points that has run consecutively.
Preferably each series should contain of more than two points to see the real
trend of change, as see in the series 1189-1192 and 1683-1685 where the
efficiency is an exponential function of MN. To make an accurate prediction, more
25
27
29
31
33
35
37
39
41
43
45
25 27 29 31 33 35 37 39 41 43 45
MEM
S Q
s Fl
on
ic L
HV
MJ/
m3
LHV Based on mixture MJ/m3
LHV MJ/m3 Fuel lab test
MEMS
Mixed
MKS
Linear (Mixed)

53
points per series would be needed, but for this study a simple linear equation was
applied to the collected data to prove the idea. Actual values are hidden because
of confidentiality reasons.
Figure 30 Electrical efficiency calculated according to Equation 11 vs MN for 10V31SG lab engine
For the 10V31SG lab engine from which the data was gathered, the mean value
𝐶𝑒𝑓𝑓 calculated according to Eq.(17) from the test points above 0.015. Which can
be translated to 0.45% electrical efficiency loss or gain if the methane number
would change by 30 units.
48
48,2
48,4
48,6
48,8
49
49,2
49,4
49,6
49,8
50
50 55 60 65 70 75 80 85 90 95 100
Elec
tric
al e
ffic
ien
cy
MN
Efficiency vs MN
1189-1192
1658-1660
1661-1662
1681-1682
1683-1685
1692-1693

54
5 ASSESSMENT OF RESULTS
The purpose of this thesis was to study how natural gas quality influences a gas-
fired engine’s performance, and how it could possibly be counteracted by an
engine control function.
Looking at the results from Toftlund, Figure 21, the efficiency changes are quite
large. However, it is expected, according to the operating window theory, since
the operating point does not move with the moving window. Since the supplied
gas at the site does vary from time to time, a function to compensate for engine
performance would be beneficial here. If a control function were to be
implemented, an upgrade to the newer UNIC control system would be required.
This opens for a business opportunity to sell such an upgrade, not only for this
installation but for other, new builds and older ones as well. This is, however,
quite and old engine and the variations are supposedly more noticeable for older
engines compared to engines with newer technologies. As seen in the reference
gas study, the 31SG laboratory engine did not show considerable differences in
efficiency or NOx emissions with different methane number gases. However, a
typical trend with different settings could be noticed, proving the possibility to
“recalculate” emissions and efficiency for changing gas qualities. All in all, the
concept of the installation created at Toftlund is working in a satisfactory manner
and could very well be used as a standard setup for the gas sampling and
measurements.
Currently, the first choice for gas analysers is still the MKS. Initial testing with the
MEMS Qs Flonic at the fuel laboratory showed quite promising values for the
lower heating value, but for the methane number some improvements are still
needed for correlating the measured parameters to the methane number. With
the current accuracy it is not suitable for engine control use, but if the correlation
could be improved for methane number it could be used as an alternative sensor
to the MKS. Therefore, the tests with the newer version of the sensor will continue
at the engine laboratory to gain a better picture of what its capabilities are.

55
The low methane number concept testing performed at Bermeo with the gas
quality control enabled was shown to be useful for this project as well, even if
there was no focus set on the performance of the engine in regard to methane
number. The functionality testing was successful, and much of knowledge was
gained about the challenges with sensor placement, mapping and the
communication side. As such, the control function with ignition timing and
boost pressure worked very well, and those aspects are probably the ones to
focus on in the future regarding these kinds of controls.
To summarise the results according to the aim, a fully implemented engine
control based on methane number is not finalised yet. However, the system using
the MKS sensor for measurements and the said parameters for engine tuning is
clear, as is the link between the sensor and engine control system. However, it is
quite difficult to make any kind of “standardised” control function since the
possibilities and needs are practically endless depending on the individual
customer’s needs. Regarding the market, this subject has received more attention
and customers have also started to show interest in gas quality and how it affects
the performance and reliability of their equipment. With the current setup used
at the engine laboratory in Bermeo, tailored solutions based on the needs of a
powerplant- or ship operator could be offered.

56
6 CONCLUSION AND FUTURE DEVELOPMENT
As the current setup with gas measurement, communication and control function
is clear, further focus of the development work should be placed on more field
tests, preferably with control applications in function. At the later part of this
project, it was also revealed that all the future sold powerplant projects will
include a gas quality sensor, which means that the only work required to get
tuning based on methane number is software based. A strong candidate to push
for is obviously the pilot installation in Toftlund, who already have been
approached for a UNIC upgrade and are aware of the benefit it would bring. This
would also require some parameter tuning and testing at the site to find the
optimal settings for the ignition timing and boost pressure maps. The sensor in
Toftlund is already installed, but for upcoming projects the placement of the
sensor and gas lag issues should be further evaluated to ensure the reliability of
the controller.
The internal project at Wärtsilä will continue to further develop the concept.
Some of the primary things ongoing there is the follow up and testing of the
second version of the MEMS Qs Flonic sensor, further development of the
Wärtsilä Methane Number calculator and, of course, the implementation of the
control function. Also, the work to drive the reference gas and correction factor
idea forward will continue. Some other topics that might be of interest to
investigate in the future are: (i) How the charge air humidity influences knock
sensitivity and performance, (ii) Possible condensation problems with higher
hydrocarbons, for this purpose a dewpoint calculation could be added to the
methane number calculator, (iii) methane number and possible control function
for dual fuel engines.
From the automation side, more tests will most likely be done within the 50SG
low methane version project in the next few years. These should also be followed
up and participated in, if possible, since considerable knowledge was received
about what needs to be studied and what to test further.

57

58
SVENSK SAMMANFATTNING
Utveckling av en gaskvalitetsbaserad
motorstyrningsapplikation
Inledning
I dagens läge koncentreras mycket av den energirelaterade forskningen till
miljövänliga energikällor och skonsammare sätt att producera energi. För
förbränningsmotorer innebär detta utmaningar med att utveckla nya teknologier
för att minska på utsläppen, både i form av nya bränslen och förbättringar av
nuvarande koncept. Gällande ottomotorer, som använder gas som bränsle, är det
främst utsläppen av kväveoxider, koldioxid och oförbrända kolväten som
undersöks och regleras.
Gasmotorerna drivs främst av naturgas som utvinns enligt samma metoder som
råolja. Naturgas består främst av metan, men också av etan, propan, butan och i
vissa fall även pentan och hexan. Naturgasens kvalitet beräknas enligt ett
metantal som beskriver gasens antändlighet. Metantalet beräknas enligt gasens
komposition och tilldelas ett värde mellan 0 och 100. I regel ligger metantalet för
naturgas mellan 70 och 95.
Gasmotorerna optimeras under utvecklings- och produktionsskedet för att
säkerställa pålitligheten, prestandan och utsläppskraven. I nuläget säljs
motorerna som optimerade till en viss sorts gas (metantal), och därefter används
den gas som finns att tillgå där motorerna placeras. Eftersom naturgas
produceras över hela världen och utvecklingen driver nyare och ovanligare
gastyper framåt, varierar kvaliteten mycket beroende på produktionsort och typ
av gas. Det är i vissa fall problematiskt om gaskvaliteten inte motsvarar motorns
inställningar, om metantalet är antingen lägre eller högre.

59
Med hjälp av nya mätteknologier kan gasens kvalitet analyseras tillräckligt
snabbt och noggrant, för att i realtid utnyttja denna information för att styra
motorn enligt kvaliteten på den gas som motorn då använder som bränsle.
Genom att använda gaskvaliteten som en parameter i motorns styrsystem kan
man säkerställa att motorn alltid är optimerad enligt det rådande metantalet.
Syfte
Syftet med detta arbete var att vidareutveckla det koncept som redan finns för
realtidsmätningar av gaskvalitet till en fungerade kontrollfunktion med metantal
som parameter. Forskningsfrågan delades in i två frågeställningar:
- Hur inverkar gasens kvalitet på en gasmotors verkningsgrad,
knackegenskaper och kväveoxidutsläpp?
- Vilka parametrar ska ingå i en eventuell kontrolfunktion och hur ska den
fungera?
Studien genomfördes med hjälp av dataanalyser, prestandaberäkningar samt
gassensor- och motortester. Som sidostudie ingår även testandet av en ny
gassensor som använder sig av fysikaliska storheter för att beräkna metantal, i
motsats till traditionella sensorer som mäter gasens komposition. Även en
referensgasstudie som baserar sig på kompensationsfaktorer för utsläpp och
verkningsgraden i motsats till en kontrollfunktion ingår. Arbetet avgränsas till att
endast omfatta Wärtsiläs gnisttända gasmotorer.
Metod och material
För att undersöka hur den inkommande gaskvaliteten påverkar
förbränningsegenskaper hos en gasmotor studeras motordata och gaskvaliteten
i en testinstallation i Danmark. I testinstallationen finns en gassensor som mäter
den inkommande naturgasens metantal och värmevärde vid den inkommande
gasledningen. Med hjälp av data från motorns styrsystem beräknas den

60
elektriska verkningsgraden för olika metantal. Samtidigt studeras även knack-
och utsläppsnivåer av kväveoxider från samma tidpunkter för att kunna avgöra
hur väl motorn fungerar med olika gaskvalitéer. Dessa data används därefter som
grund för att förstå hur en kontrollfunktion skulle behöva fungera för att
kompensera för varierande metantal.
Utgående från dataanalysen från Tofltund utförs en serie motortester vid
Wärtsiläs motorlaboratorium i Spanien. I dessa tester används en
kontrollfunktion som justerar motorns förtändning och laddluftstryck enligt
rådande metantal. Genom att blanda in propan i den naturgas som leds till
laboratoriet sänks metantalet, och därigenom kan funktionens duglighet
valideras. Testerna ingår delvis i ett annat projekt som automationsavdelningen
utvecklat för ett lågmetantalskoncept för Wärtsiläs gasmotorer. Syftet med dessa
tester är att möjliggöra övergången från naturgas till ren propan och etan.
Spannet i metantal sträcker sig från 75 för naturgas till 35 för ren propan.
Testerna innefattar inte finjustering för optimal prestanda, utan koncentreras
främst till att testa kontrollfunktionens funktionalitet.
Som en sidostudie testas en gassensor, MEMS Qs Flonic. Denna givare utför sina
metantalsberäkningar genom att först mäta gasens densitet,
värmeledningsförmåga och värmekapacitet i jämförelse med den normala
givaren som mäter gaskomposition med spektroskopi. Målet med dessa
experiment är att studera om det finns ett sambad mellan gasens fysiska
egenskaped och metantalet. Grundläggande tester görs i ett bränslelaboratorium
för att testa sensorns funktion. Därefter installeras givaren i Wärtsiläs
motorlaboratorium för att testas på längre sikt.
En annan sidostudie utgår från en teori att beräkna utsläppsnivåer och
verkningsgrader enligt olika metantal som ett alternativ till att styra motorn. På
så sätt skulle referensgasen vara en standard med vilken tillverkare skulle
fabrikstesta sina motorer. Prestanda och utsläpp korrigeras med
kompensationsfaktorer, enligt den gas kunden har specificerat. Beräkningarna

61
görs enligt prestandapunkter för Wärtsiläs 31-motor och är relativt enkla, tanken
är att endast bevisa att idéen kunde fungera.
Resultat och diskussion
De beräkningar som baserades på data från testinstallationen i Danmark visade
att gaskvaliteten har stor inverkan på en motors verkningsgrad och
kväveoxidutsläpp. I regel steg verkningsgraden med 1,5 procentenheter per 10
enheter lägre metantal. Motorn hade en lägre verknigsgrad vid högre metantal.
Samtidigt som verkningsgraden ökar så stiger även NOx-utsläppen och
knacknivåerna. Detta är dock förväntat och vållar endast problem när motorn
knackar för mycket och stannar på grund av säkerhetsskäl eller om
kväveoxidvärdena överstiger det tillåtna. Å andra sidan lider motorn av
försämrad verkningsgrad när gaskvaliteten är högre än vad motorn är optimerad
till. Här skulle en kontrollfunktion kompensera för förhöjda värden av metantal
och spara bränslekostnader.
Motortesterna med metantalsbaserad kontrollfunktion visade sig vara lyckade i
den mån att funktionen gör de parameterändringar den ska när metantalet
sjunker. Med denna funktion kan motorn köras på full effekt samtidigt som
bränslet varieras fritt mellan naturgas, etan och propan. Detta är endast möjligt
utan funktionen när motorn går på tomgång. Samtidigt gav testerna mer insikt i
hur kommunikationen mellan motorns styrsystem, gassensorn,
beräkningsmodellen och andra enheter borde utföras i framtiden. Ett av målen
med testerna var att undersöka om det finns en fördröjning mellan det att
sensorn läst av ett värde och att gasen leds in i förbränningsrummet. Någon
större eftersläpning i tid mellan gasmätningen och när gasen verkligen förbränns
kunde inte noteras under dessa tester.
Det visade sig inte vara möjligt att använda den testade MEMS Qs Flonic-givaren
för motorstyrning. Sensorn klarade av att noggrant mäta de tre fysikaliska
värdena samt att bestämma värmevärdet på utgående från dessa. För

62
metantalets del var sambandet inte tillräckligt tydligen för att kunna utnyttja den
i motorstyrapplikationer. Om beräkningsmodellen för gaskvalitet kunde
vidareutvecklas vore denna typ av givare ett lämpligt alternativ till den
nuvarande lösningen.
Från referensgasstudien kunde ett linjärt samband mellan metantal och
verkningsgrad observeras. Ökningen och minskningen i verkningsgrad var dock
mycket mindre än den som noterats i Danmark. Troligen beror detta på att de
data som använts till denna studie kommer från en nyare motor med nyare
teknologier och bättre kontrollsystem. Trots detta så kunde en
kompenseringsfunktion härledas för verkningsgraden, även om skillnaderna var
väldigt små.
Med tanke på forskningsfrågan uppnåddes målen till en viss del. Resultaten från
Danmark gav mera insikt i hur naturgasens kvalitet inverkar på en motors
prestanda och utsläpp. Kontrollfunktionen som testades i Spanien fungerade
planenligt och möjliggjorde byten till gaser med lågt metantal, men kräver ändå
vidareutveckling innan den kan implementeras i kommersiellt syfte.

63
REFERENCES
Turbulent Jet Ignition (2016). Retrieved from F1i magazine:
http://www.f1i.com/magazine/76167-tji-antechamber-f1-power.html/2
[Webpage]
Andersen, P. (1999). Algorithm for methane number determination for natural
gases. Dansk Gasteksik Center .
Demirbas, A. (2010). Methane Gas Hydrate. Springer.
J&P Cycles (2018). Engine Compression Ratios: What They Are, How They Work.
(2018, 5 30). Retrieved from http://blog.jpcycles.com/engine-
compression-ratios-what-they-are-how-they-work/ [Webpage]
Engine knowhow (2018) Retrieved from http://www.engineknowhow.com/the-
engine-thermodynamic-cycles/mean-effective-pressures/ [Webpage]
Fallah, S., Khajepour, A., & Goodarzi, A. (2016). Electric and Hybrid Vehicles -
Technologies, Modeling and Control: A Mechatronic Approach. John Wiley
& Sons, Ltd.
Grönroos, J. (2016). Online gas quality measurement and engine control. Helsinki:
Aalto University. [Master´s thesis]
Hattar, C. (2005). Otto engine performance. Wärtsilä. [Wärtsilä internal
document]
Heisler, H. (1995). Advanced engine technology. London: Arnold (Holder headline
group).
Heywood, J. B. (1988). Internal Combustion Engine Fundamentals. Singapore:
McGraw-Hill.
Hiltner, J., & Fiveland, S. (2006). Fundamentals of Engine Knock in Heavy Duty
Natural Gas Engines. Klopfregelung für Ottomotoren II, 37-53.
Koot, M. (2018). Future LNG Quality Study. [Wärtsilä internal document]
Koot, M. (2018). Reference gas proposal - G-LNG. [Wärtsilä internal document]

64
Korakianitis, T., Namasivayam, A., & Crookes, R. (2011). Natural-gas fueled spark-
ignition (SI) and compression-ignition (CI) engine. Progress in Energy and
Combustion Science 37, 89-112.
MKS Instruments. (2018, 06 13). Retrieved from
https://www.mksinst.com/docs/UR/PrecisiveTechnique.aspx.
[Brochure]
Nicotra, A. (2012). NGVA Europe’s LNG Position Paper.
Slefarski, R., Golebiewski, M., Czyewski, P., Gizymislawski, P., & Wawrzyniak, J.
(2018). Analysis of Combustion Process in Industrial Gas Engine with
Prechamber-Based Ingition System. MDPI.
Soltic, P., Biffiger, H., Prêtre, P., & Kempe, A. (2016). Micro-thermal CMOS-based
gas quality sensing for control of spark. Elsevier: Measurement 91, 661-
679.
Speight, J. (2008). Natural Gas - A Basic Handbook. Gulf Publishing Company.
(2017). Statistical Review of World Energy. BP.
van Essen, M., & Gersen, S. (2018). Next generation knock characterization. DNV
GL. [Conference proceedings]
Zajc, A., & Ryll, T. (2017). Rapid determination of the calorific value by means of a
novel gas quality sensor. Measuring & Process control.

65
APPENDICES
Appendix 1. Toftlund data obtained from Wonerware Online application and
used for performance calculations.
Appendix 2. Test compositions used for MEMS fuel laboratory tests. Internal
document.
Methane Ethane Propane n-Butane
N2 CO2 n-Pentane
MN LHV
Volume-% - MJ/m3
N3 0.8 0 0 0 0.2 0 0 107 26,7
N4 0.9 0 0 0 0 0.1 0 107 30,1
N5 0.8 0.1 0 0 0 0.1 0 84 32,7
N8 0.7 0.05 0.05 0 0.1 0.1 0 70 30,7
N10 0.7 0.02 0.02 0.02 0.2 0.04 0 66 28,6
N14 0.950 0.013 0.013 0.013 0 0 0.013 63 36,4
N15 0.777 0.059 0.029 0.013 0.072 0.043 0.007 62 35,0
N18 0.902 0.006 0.085 0.003 0.005 0 0 67 38,7
Start time
19:45 19:50 19:55 20:00 20:05 20:10 20:15 20:20 20:25 20:30 20:35
Filtered load signal
kW 5302 5300 5302 5300 5301 5305 5300 5302 5306 5300 5304
Gas flow Nm3/h Confidential
Methane Number
WMN 88.9 88.4 85.2 80.5 77.3 74.7 73.2 72.5 72.5 71.5 71.5
Ignition
angle
ddeg 123 123 123 123 123 123 123 123 123 123 123
Gas
analysis
[vol-%]
Methane CH4 96.2 96.2 95.3 94.1 92.8 91.5 90.7 90 89.6 89.5 89.5
Ethane C2H6 2.8 2.8 3.1 3.7 4.2 4.7 5.1 5.4 5.5 5.6 5.6
Propane C3H8 0.1 0.1 0.3 0.8 1.2 1.6 1.9 2.1 2.2 2.3 2.3
i-butane i-C4H10 0.1 0.1 0.2 0.2 0.3 0.4 0.4 0.4 0.5 0.5 0.5
n-butane n-C4H10 0 0 0.1 0.2 0.2 0.2 0.3 0.3 0.3 0.3 0.3
C5 lumped n-C5H12 0 0 0 0.1 0.1 0.1 0.1 0.2 0.2 0.2 0.2
Carbon Dioxide
CO2 0 0 0 0 0 0 0 0 0 0 0
Nitrogen N2 0.5 0.6 0.7 0.7 0.8 1 1 1.1 1.1 1.2 1.2