measures of food used and food eaten in u.s. households ... may not be entlrely the case....
TRANSCRIPT

OV
J
CND(Adm.)369
FILE
MEASURES OF FOOD USED AND FOOD EATEN IN U.S. HOUSEHOLDS
Consumer Nutrition Division Human Nutrition Information Service
U.S. Department of AEriculture Hyattsville, Maryland 20782
May 1983
MEASURES OF FOOD USED AND FOOD EATEN IN U.S. HOUSEHOLDS I 2
INTRODUCTION
Nationwide surveys of food consumption provide nutritional measures of U.S. diets at two levels--household food consumption (food brought into the household and used) and food intake (food actually eaten) by indlvlduals in the household. Hegsted (I) noted a large difference in the average energy value of food as determined by the two measures and speculated about the reason for the disparity. Some investigators suggest the difference between the amount of food that disappears from household food supplies and amount of food that individuals report they consume is food waste or loss within the home (2,3). This may not be entlrely the case. Differences may also be attributable to methodology.
It is important to examine the differences between household food con- sumption and individual food intakes becausethe information gleaned may lead to improved methodology for household and indlvldual surveys and may suggest ways in which food loss might be reduced.
The purpose of this study is to describe the differences in quantities, energy, and nutrient content of food used in the househol~ and indlvldual food intakes of household members. The differences are discussed in rela- tion to household size, family composition, money value of food per person, region, urbanization, and race.
SU/~L%RY OF RESULTS
Findings on the differences in estimates of food consumption, food energy, and nutrients, as measured from reported food disappearance from household supplles and from reported food eaten from household supplies by household members, show that--
o The average sum of food eaten by household members was substantially less than the total food used from household supplies. The magnitude of the difference varied with the unit being compared--quantlty of food, food energy, or nutrient.
Many factors inherent in the survey methodology contributed to the differences in food used and food eaten. Caution should be exercised in associating the differences with a single factor.
iReport prepared by Olive M. Batcher, Consumer Nutrition Division, Ruman Nutrition Information Service, U.S. Department of Agriculture, Hyattsville, Maryland 20782. The assistance of Alvin Nowverl, computer programmer, is gratefully acknowledged.
2This study was conducted in part to provide background information for a project on "Evaluation of methods for estimating household food losses" now in progress at University of Arizona under a grant from USDA.

-3-
consumed from household supplies in the two periods represented the usualconsumption patterns of the households.
Data from 2,520 housekeeping households in which each household memberprovided food intake records for three days were used in this study. House-keeping households are those in which at least one member had 10 or moremeals from household supplies during the 7-day report period. The average
household consisted of 2.9 members.
FOOD USED
In the survey, household food use, as reported by the household food
manager, was defined as all foods and beverages (except water) consumed at
home by household members, boarders, roomers, employees, and guests; all
foods and beverages carried from the household and eaten elsewhere by house-
hold members; food fed to pets or birds, or thrown away; and food brought
into the household for consumption by household members but thrown away
before, during, or after preparation due to spoilage or other causes. The
following were not recorded in the survey as food used: Food given away or
sold to people outside the household, food fed to animals raised for
commercial purposes, and food bought or prepared but not yet consumed.r
Households with roomers, boarders, and employees are not included in
the study since food intake records are not available for these persons.
To exclude household food used by guests, a ratio of the number of meals
consumed at home by the household members and the number of meals consumed
by household members and guests was applied to the food use data. (Guest
snacks were counted as partial meals depending on the number of items
served.) In this adjustment, guest meals and snacks are assumed to be like
those of household members in quantity of food, cost, and nutrient content.
The data (quantities, costs, and nutrient values of foods used from
household supplies) are reported on a per-household-per-day basis. To
obtain the mean values for food used per household per day, the data for
each household were multiplied by the weighting factor (to make the samples
more representative of the distribution of the U.S. population) and the
adjustment factor (to remove food consumed by guests), totaled for a group
of households, and divided by seven (days in a week) and the number of
households in the group. Standard deviations were also computed.
FOOD EATEN
Food eaten includes all foods and beverages reported as consumed by the
household members from household supplies. Household members ate some foods
and beverages that were not from household supplies on the days reported;
the data on such items are not included in this report. It is not the
intent of this study to determine individual food and nutrient intakes; but
to examine the differences between what is reported as used and what is
reported as consumed from home food supplies.
The quantities of foods and nutrient values are reported on a per-
household-per-day basis. To obtain the mean quantities (or nutrients) of
food eaten per household per day, the sum of the food or nutrient intakes

-4-
of all members in a household over a 3-day period was multiplied by the
weighting factor (to make the sample more representative of the distribution
of the U.S. population). These sums were totaled for a group of households
and divided by three (days) and the number of households in the groups.
Standard deviations were also computed.
PREPARED EDIBLE FOOD
Many foods are not eaten in the form in which they are brought into the
kitchen from the store or garden. Food may be in the form of basic commod-
ities (such as flour) or ready-to-eat (loaf of bread) or a stage in between
(bread mix). Before the quantity of household food (as purchased) could be
compared with the quantity of food eaten, an adjustment was made by applying
a yield factor3 to each food item used from household supplies. The yield
factor adjusts the quantity of food used to exclude inedible portions (such
as bone and gristle and some peelings) and to allow for changes in weight
during preparation and cooking. Loss in weight occurs when preparing (peel-
ing, removal of trimmable fat from meat, and discard of liquid from canned
vegetables) and cooking many foods. Other foods may require the addition
of water during preparation resulting in a gain in weight. Such foodsinclude: Rice, pasta, oatmeal, dried vegetables, and powdered or concen-trated beverages. Yield factors adjust quantities for both the losses andgains in weight.
Information on the food preparation and handling practices of households
from which differences in yields could be estimated was not collected in the
survey. Therefore, a single yield factor for each food used was applied. In
selecting these yield factors, commonly used preparation, cooking, and serving
techniques were assumed as follows:
o All inedible portions are removed.
o All food is of good quality when used; no allowance is made for food
discarded because of spoilage and only usual amounts of food are
trimmed away during preparation.
o All prepared food is acceptable in appearance and quality; there are
no recipe failures.
o All cooked and canned vegetables are drained.
o All canned and cooked fruits are served with syrup or juice.
o Some of certain foods, such as carrots and cabbage, are served raw
and some cooked (proportions based on those reported in survey).
o No evaporation occurs when foods, such as canned vegetables, soups,
and rolls, are heated to serving temperature. Exceptions are some
frozen food combinations, such as casseroles and pot pies.
3Yield factors were based primarily on data published in USDA Agricultural
Handbooks and reports and from laboratory determinations.

-5-
o No loss of weight occurs when fats and oils, sugars and sweets, andmilk are used in food preparation.
o Trimmable fat is removed from all meat cuts, except bacon, salt pork,fat back, and similar fatty cuts.
o Skin and fat are removed from poultry.
o Skin is removed from fish.
o Drippings from meat and poultry are discarded.
The quantities of prepared edible food are presented on a per-household-
per-day basis. To obtain the mean quantity of prepared edible food used per
household per day, the quantity of each food item reported as used in a
household was first multiplied by its yield factor to obtain the quantity ofprepared edible food. The sum of these quantities for all items in a foodgroup was then multiplied by the weighting factor (to make the sample morerepresentatibe of the distribution of the U.S. population) and the adjustmentfactor (to remove food consumed by guests), totaled for a group of households,and divided by seven (days in a week) and the number of households in thegroup. Standard deviations were also computed. Costs of, prepared ediblefood and food used in a household are the same. They are the costs reportedby households for bought foods plus the money value of home-produced food andfood received as gift or pay.
FOOD GROUPS
Any study of the differences in quantities of food used by householdsand food eaten by household members is complicated by the myriad forms inwhich food is purchased and/or used in households and the infinite numberof foods people prepare and eat in the home. In large surveys of foodconsumption, it is not feasible to trace the use of each item brought intothe household to its ultimate end. Even so, food items disappearing fromhousehold food supplies and foods reported as eaten by household memberswere aggregated into 15 groups for comparisons in this study. Fresh,frozen, canned, dried, partially prepared, and ready-to-eat forms of a foodor beverage were placed in the same group. The predominant ingredient(except water) in the food mixtures governed their placement.
The food groups are:
Vegetables: Vegetables, vegetable juices, soups and other mixturesthat are mostly vegetables.
Fruit: Fruits, fruit juices.
Grain products: Bread, rolls, cakes, cereals (includes flour, rice,
and pasta), soups and other mixtures that are mostly grains or
cereals.
Milk: Milk, cream, cheese, ice cream, milk desserts, cocoa mixtures,
soups, and other mixtures that are mostly milk or milk products.
-6-
Meat: Beef, lamb, pork, veal, game, variety and luncheon meats, soups
and mixtures that are mostly meat.
Poultry: Chicken, turkey, goose, duck, soups and other mixtures that
are mostly poultry.
Seafood: Fish, shellfish, soups and other mixtures that are mostly
fish and shellfish.
Eggs: Eggs and mixtures that are mostly eggs.
Legumes: Dry beans, peas, lentils, soups and other mixtures that are
mostly legumes.
Nuts and seeds: Nuts, nut butters, seeds.
Fats and oils: Butter, margarine, lard, oils, salad dressings,vegetable shortening.
Sweets: Sugar, jellies, candies, gelatin desserts.
Nonalcoholic beverages: Coffee, tea, soft drinks, fruit ades, punches.
Alcoholic beverages : Beer, wine, other alcoholic beverages.
Baby food: Meat, cereal, vegetable, fruit, all baby food mixtures.
In this study, only eight of the groups--those used in at least 90 per-
cent of the households--were considered. They are: Vegetables, fruit,
grain products, milk, meat, poultry, seafood, and nonalcoholic beverages.
The meat, poultry, and seafood groups were combined. Ultimately, quantities
and costs of nonalcoholic beverages were excluded from this study because
the large quantity of water added during preparation of coffee, tea, and
powdered ades distorted the prepared edible food data.
NUTRITIVE VALUE OF FOOD
Nutritive value of all food used (including nonalcoholic beverages) by
each household during the 7-day report period was estimated using a special
nutrient data base (7). Values are for the edible portion of food as brought
into the household except that vitamin values were adjusted for losses during
cooking. The estimates do not include nutrients from parts of food usually
considered to be inedible (such as bone and egg shells) or from parts usually
trimmed away and discarded in the preparation of food. However, they do
include nutrients from some parts of food that many people consider inedible
and discard, such as drippings and fat trimmed from meat and poultry, and
cooking fat used in pan or deep-fat frying.` For each household, the amount
of the nutrient per gram of a food item was multiplied by the number of grams
`'Different parts of the survey data were used for quantity and nutrient
phases in this study. Drippings and fat could be readily omitted from the
quantity phase but not from the nutrient phase. Therefore, they were
retained only in the nutrient phase.

-7-
of the food item and totaled for all food items used during the 7-dayreport period. The data are reported on a per-household-per-day basis.
(See page 3.)
Nutritive value of food intake (including nonalcoholic beverages) was
estimated from information collected on kinds and amounts of all food eatenby individual household members from home supplies during the 3-day reportperiod and a special nutrient data base (8). For each household, the amountof the nutrient per gram of food was multiplied by the grams of food eatenand totaled for all food items reported eaten by household members duringthe 3-day period. The data are reported on a per-household-per-day basis.
(See page 3.)
Nutrient values of food used in households and food eaten by household
members were estimated for food energy and the following nutrients: Pro-
tein, fat, calcium, iron, vitamin A value, thiamin, riboflavin, niacin, and
vitamin C.
DIFFERENCES IN QUANTITIES OF FOOD, COSTS, AND NUTRIENT VALUES
The differences in quantities of food used and food eaten for groups of
households were estimated by subtracting the mean quantity of food eaten per
household per day from the mean quantity of prepared edible food per house
hold per day. These differences are reported as percentages of the mean
quantity of prepared edible food per household per day. To convert the group
data to a per member per day basis, the difference-per-household-per-day data
were divided (before rounding) by the mean number of members in a group of
households. The percentage contributions of each food group to the total
quantities of food used and the total difference between the quantities of
prepared edible food and food eaten were also computed.
The money value (cost) of a difference for groups of households wascomputed by multiplying the difference in quantity of food in a group by themean cost per gram of the food for that group. The percentage contributionsof each food group to the total costs of food used and the difference in foodused and food eaten were also computed.
The differences in nutrient values for groups of households were esti-
mated by subtracting the mean nutritive value for food eaten per household
per day from the mean nutritive value for food used per household per day.
This difference is reported as a percent of the mean nutritive value for
food used per household per day. To express the data on a per-member-.per-
day basis, the mean nutritive value of food used per household per day was
divided (before rounding) by the mean number of members in a group of
households.
Computations of the data were determined for households grouped by
number of members, family composition, money value of food per person, race,
household location (region and urbanization), and household income before
taxes in 1976.

-8-
FAMILY COMPOSITION
The two family composition groups were households with at least one member under 18 years of age and households composed of all adults (18 years and older).
MONEY VALUE OF FOOD
Money value of food per person was derived from information collected in the survey on the costs of foods used from household supplies in a week. Money value of household food included the reported cost of food that was purchased, and the imputed value of food used that was home produced, and received as gift or pay. The value of food received without direct expense to the household was based on average prices per pound paid for that food by other households in the same region. The value of food per equivalent per- son was then deter~ned. An equivalent person, counted as one having 21 meals at home (based on three meals each day for a week), was used as an attemgt to adjust for the variation among households in the proportion of meals eaten from home supplies.
HOUSEHOLD LOCATION
f
The areas in which the households were located are identified by region and urbanization. The four regions, as defined by U.S. Department of Coam~erce for 1970 Census of Population, are:
Northeast--New England states, New York, New Jersey, and Pennsylvania.
North Central--States north of Ohio River, Arkansas, and Oklahoma.
South--States south of Mason-Dixon Line and Ohio River plus Arkansas, Louisiana, Oklahoma, and Texas.
West--Remaining conterminous States.
The three urbanizations, based on the standard metropolitan statistical area (SMSA) used in the 1970 Census of Population, are:
Central city--Area with a population of 50,000 or more and the main city within SMSA.
Suburban--Area generally within boundaries of SMSA but not within the legal limits of the central city.
Nonmetropolitan--All areas not within SMSA.
HOUSEHOLD INCOME
Household food managers estimated the total income in 1976 for all household members from all sources before income tax deductions.

-9-
RESULTS AND DISCUSSION
QUANTITY AND COST OF FOOD
On the a v e r a g e , about 1,600 grams or 3-1/2 pounds of food ( a s - p u r c h a s e d w e i g h t ) pe r househo ld member per day were used from househo ld s u p p l i e s . This q u a n t i t y e x c l u d e s n o n a l c o h o l i c b e v e r a g e s . Milk a c c o u n t e d f o r about 24 p e r - c en t of t h i s q u a n t i t y ( t a b l e 1) . The f i v e o t h e r food g r o u p s - - v e g e t a b l e s ; f r u i t ; g r a i n p r o d u c t s ; meat , p o u l t r y , and sea food ; and o t h e r f o o d - - e a c h a c c o u n t e d f o r 12 to 19 p e r c e n t of the q u a n t i t y of food used .
In this report, the average money value of food used in spring 1977 was estimated at $2.02 per household member per day. This estimate of the money value of food per household member differs slightly from that reported previously (4) because the value of guest meals and cost of nonalcoholic beverages (17 cents) are excluded, and not all housekeeping households in the NFCS survey, spring 1977, are included. Foods in the meat, poultry, and seafood group accounted for 38 percent of the value. Fruits accounted for 8 percent, and vegetables, grain products, and milk each contributed 13 percent to the total value of food used.
f
PREPARED EDIBLE FOOD ESTIMATES
Overall, a I percent net loss in the "as purchased" weight of food used resulted when the standard yields were applied (data not shown). Estimates of the weight of prepared edible food were greater than food used for two food groups--graln products (56% more) and milk products (7% more). This result was probably due to added liquid to flour, rice, pasta, other cereals, and to dry and evaporated milks.
Estimates of prepared edible food were smaller than food used for two food groups--vegetables (16% less), and meat, poultry, and seafood (40% less) primarily due to inedible parts, fat, and moisture loss during cooking. Overall, there was no change in weight of foods in the fruit group with preparation. Apparently the loss of weight of inedible parts of fruit was counterbalanced by increases from addition of water to concentrated juices.
On the average, about 1,600 grams of prepared edible food per household member per day were estimated to be available (eaten or otherwise disposed of) from household supplies. Milk accounted for about 26 percent of this quantity (table I). Foods in the remaining groups each contributed ii percent or more to the total estimated quantity of prepared edible food.
Yields for meat, poultry, and seafood assumed that all trimmable fat, skin, and drippings were inedible discard. This yield averaged 8 percent trimmable fat for all meat, poultry, and seafood items. If the trimmable fat and skin from meat, poultry, and seafood had been treated as edible, the mean quantity of all prepared edible food per household member would increase 23 grams and the meat, poultry, and seafood group would have added i percent to the total quantity of prepared edible food. Comparable estimates for retaining drippings and broth from meat, poultry, and seafood cannot be made.

-i0-
DIFFERENCES IN QUANTITY AND COST OF FOOD
Overall, the difference in edible food used and food eaten was estimated to be about 564 grams or I-I/4 pounds of prepared edible food per household member per day, valued at about 72 cents in spring 1977. Foods in the meat, poultry, and seafood group accounted for only 2 percent of the estimated dif- ferences in weights of prepared edible food used from household supplies and food eaten by household members and 7 percent of the money value (table i). Although over a third of the total money value of food was spent for meat, poultry, and seafood items, most of these foods were reported to have been consumed by household members. Therefore, the difference in weight of pre- pared edible meat, poultry, and seafood was small and represented only a small portion of the weight and money value of the "all foods" difference in edible food used and food eaten. Differences in weight and value for milk, grain products, vegetable, and fruit groups were much larger~ About 25 per- cent of the difference in weight of prepared edible food and food eaten and 44 percent of its money value were for items in the other food groups listed on pages 5 and 6 (nonalcohollc beverages excluded). These percentages for the "other foods" groups were calculated by subtracting the sum of the five groups from the total.
Gains in weight generally occurred when yleld factors were applied to certain foods used from the milk and grain product groups. These weight gains were attributed to water used in reconstituting dry milk and in pre- paring puddings and cereal products, such as rice and pasta. The difference in weights of prepared edible food and food eaten depends on the appropriate- ness of these yield factors as well as those that assumed losses of weight in preparation. Admittedly, some of the differences may have been due also to the grouping of noncomparable foods reported as mixtures, such as stews and casseroles, and to inaccuracies in reporting quantities of foods used by households and eaten by individuals.
Several other factors may have contributed to the differences in quantities of food used and food eaten.
o The two sets of data cover different time periods. The 3-day period for which household members reported food intakes included only one of the seven days for which household food used was reported. Food used on that day was not identified separately in the 7-day report period for the household.
o Because information on food used was for seven days, it might be expected to represent the usual practices of households more fairly than information on food intake for three days. Although individual intakes were collected on all days of the week, weekenddays, which are generally relatively high consumption days, are less frequently reported than the other days of the week.
o Household food use represents a larger number of meals per day than do food intakes of household members. About 8 percent more meals per day from household food supplies were reported during the 7-day report period than during the 3-day report period. Thus, differences
°

.o
-II-
may be abnormally high because household members consumed more of their food from home suppl~es during the 7-day report period than during the 3-day report period. Differences are probably magnified because adult males, relatively large eaters, generally ate more of their meals away from home than women and children (5).
o Survey data rely on the memory and accuracy of the household respond- ents and indlvidual household members in recalling food used and food eaten, respectively. Household respondents, aided by the food list, may have overreported consumption of some foods, perhaps by including food used prior to the 7-day report period. On the other hand, indi- viduals had no food list to prompt them and may have forgotten to report some foods eaten. A/so~ they may have overreported consump- tion of some foods they perceived as being nutritionally good to eat (milk) and underreported food they perceived otherwise (alcoholic beverages). The individual data also rely on abilities to estimate portion sizes. Other investigators have also noted apparent underreporting of foods on individual diet records (9).
!
o Respondents completed food intake forms for young children and others who were unable to complete the forms themselves. Foods consumed may have been omitted or quantities underestimated through ignorance or forgetfulness.
DIFFERENCES IN NUTRITIVE VALUES
The mean differences in nutrient values of food used and food eaten are shown in table 3. In addition to the factors given above, another factor may have contributed to differences between nutrient levels of food used and food eaten.
o Nutritive values of food used and food eaten are calculated from two different sets of food composition data, one for foods as purchased and the other for food as eaten. These values are derived from anal- yses of nutrient content of foods and estimates of edible portions of foods available in the literature and from special studies. Although the values used are the best available, they may not be strictly comparable because of the limitations of analytical procedures and available data for foods and nutrients.
Average differences in the two measures of nutrient levels per household ranged from 31 percent (protein and vitamin A) to 45 percent (fat) of the level in food used (table 4). A/most one-half of the 42 percent difference in food energy was due to differences in fat, II percent to differences in protein, and the remainder to carbohydrate. Large difference~ in fat and related energy estimates would be expected because nutrients in food used by the household include those in all of the fat on meat as purchased (even though some households customarily discard this fat), and all meat drippings and frying fat (some of which may have been thrown away). Fat in food eaten represents only fat in foods reported as consumed by household members. For example, if meat was trimmed of fat, only the dietary fat in the lean of the
meat was counted.

o'
-12-
Differences in some nutrients, such as vitamins A and C, are particu- larly dependent on food choices because some foods are especially rich in these nutrients. Differences in reporting periods for the two measures are especially trDublesome for these nutrients. For example, if intakes of foods rich in these nutrients during the 3-day period were higher than for the average week, differences between levels of these nutrients in food use and food eaten would be reduced.
Although the magnitude of the differences is in question, many relationships anon E the households are evident.
DIFFERENCES BY HOUSEHOLD CHARACTERISTICS
Differences in food and nutrient consumption from measures of food used and food eaten were compared for groups of households by selected character- istics. It was hoped that these comparisons would help explain the wide variation in percent differences among households.
Size of Household
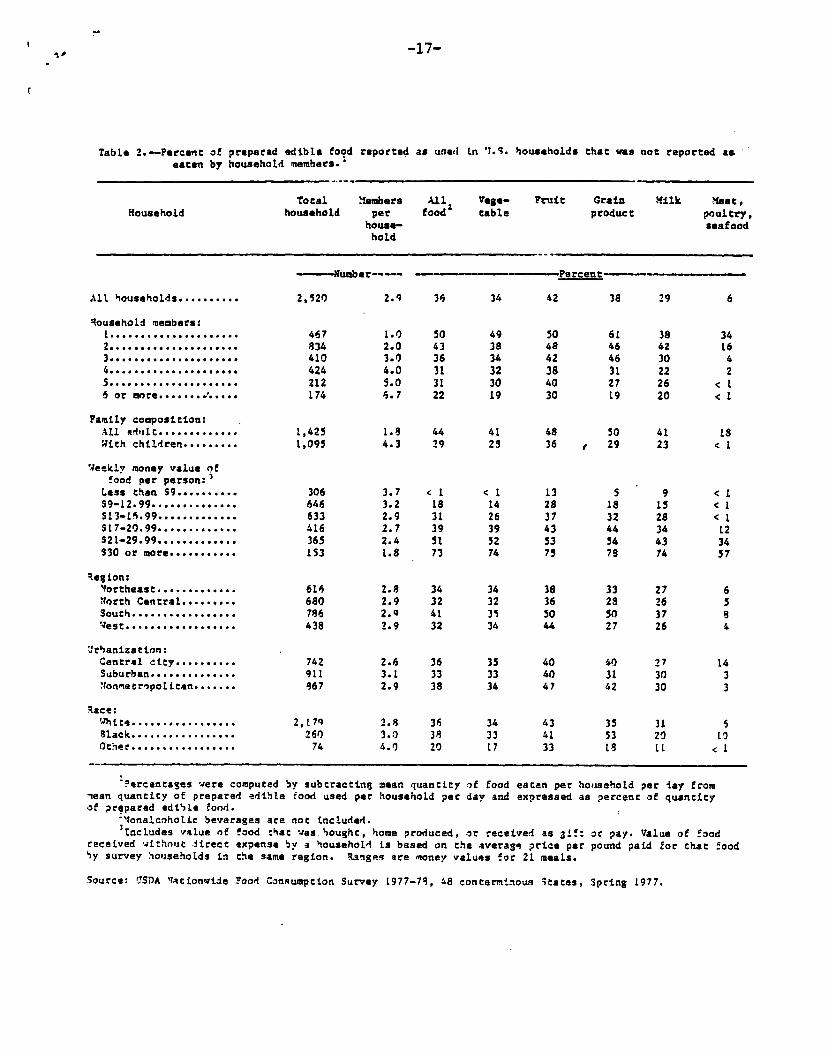
Differences in estimates of quantities, food e n e r g y , and nutrients for food disappearing from household supplies and food consumed by household mem- bers decreased as household size increased (tables 2 and 49. The largest differences often occurred between I- and 2-member households. Part of the decrease may be due to the difficulty that small households have in utilizing foods as marketed before they spoil.
Quantities of prepared edible food used per household member generally decreased with increase in household size, yet mean quantities of food in- takes per household member were similar among all households grouped by size. These trends were noted for each of the food groups except grain products and milk. With increases in household size, household members consumed more grain products. Milk intake per household member was not related to household size.
Family Composition
Average differences in quantities of food used from household supplies and in food eaten were substantially less in households with children than in all adult households (table 2). Similar results were noted between levels of food energy and nutrients in food used from household supplies and in food consumed by household members (table 4).
A part of the lower difference for households with children undoubtedly was associated with the size of the household. Households with children (households with at least one member under 18 years of age) had more members, on the average, than all adult households.
Money Value of Food Per Person in a Week
As money value of food per person increased, differences in quantities of edible foods used from household supplies and foods reported eaten by the members increased substantially (table 2). A part of the increase is probably associated with size of household, which decreased with increase in money
r
-13-
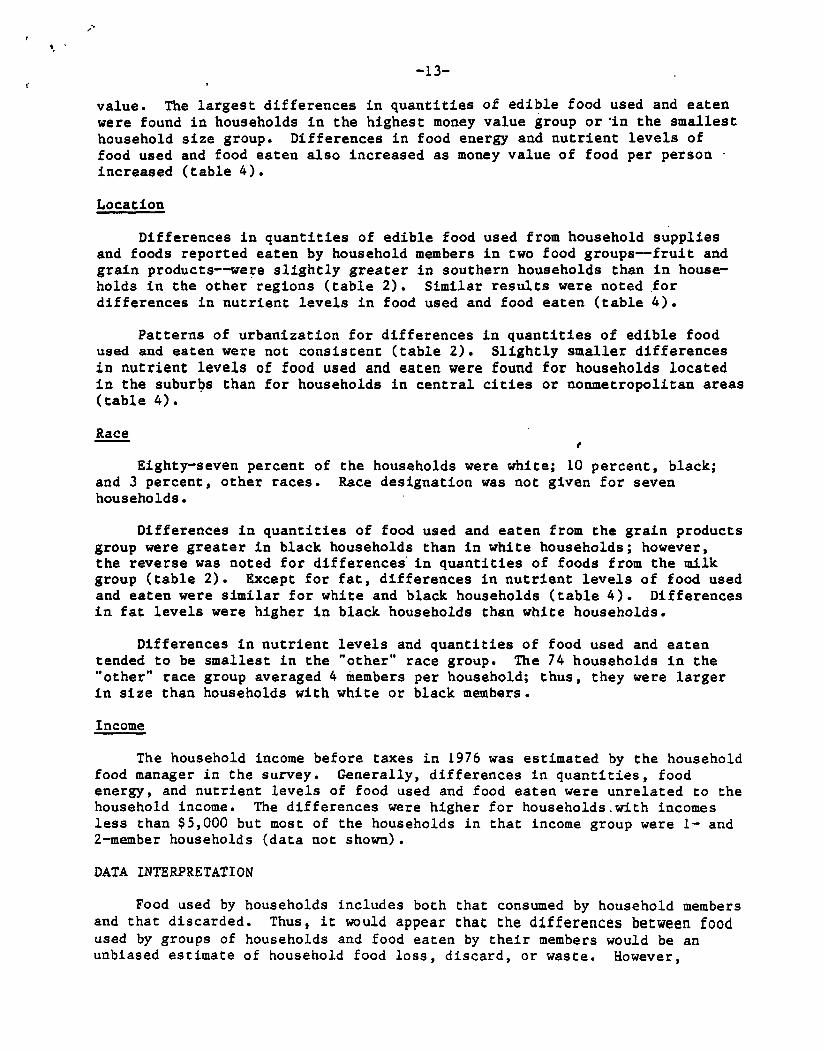
value. The largest differences in quantities of edible food used and eaten were found in households in the highest money value group or "in the smallest household size group. Differences in food energy and nutrient levels of food used and food eaten also increased as money value of food per person increased (table 4).
Location
Differences in quantities of edible food used from household supplies and foods reported eaten by household members in two food groups--frult and grain products--were slightly greater in southern households than in house- holds in the other regions (table 2). Similar results were noted for differences in nutrient levels in food used and food eaten (table 4).
Patterns of urbanization for differences in quantities of edible food used and eaten were not consistent (table 2). Slightly smaller differences in nutrien~ levels of food used and eaten were found for households located in the suburbs than for households in central cities or nonmetropolitan areas ( table 4).
Race ,n
f
Eighty-seven percent of the households were white; I0 percent, black; and 3 percent, other races. Race designation was not given for seven households •
Differences in quantities of food used and eaten from the grain products group were greater in black households than in white households; however, the reverse was noted for differences in quantities of foods from the milk group (table 2). Except for fat, differences in nutrient levels of food used and eaten were similar for white and black households (table 4). Differences in fat levels were higher in black households than white households.
Differences in nutrient levels and quantities of food used and eaten tended to be smallest in the "other" race group. The 74 households in the "other" race group averaged 4 members per household; thus, they were larger in size than households with white or black members.
Income
The household income before taxes in 1976 was estimated by the household food manager in the survey. Generally, differences in quantities, food energy, and nutrient levels of food used and food eaten were unrelated to the household income. The differences were higher for households with incomes less than $5,000 but most of the households in that income group were I- and 2-member households (data not shown).
DATA INTERPRETATION
Food used by households includes both that consumed by household members and that discarded. Thus, it would appear ~ha~ the differences between food used by groups of households and food eaten by their members would be an unbiased estimate of household food loss, discard, or waste. However,
-14-
caution must be used in making such an assumption. The factors mentioned earlier, which are inherent in the methodologies for the two measures used in the survey, must be recognized. Unfor~unately~ determination of the proportion of the difference due to the various factors is not possible..
Comparisons of the differences between the household and individual measures of energy, nutrient levels, and quantity of food would have more validity as indicators of household food loss, if data for both food used and eaten had been collected for the same time period. Data collection for the two measures during the same period ~uld also eliminate the problem of differences in number of meals and differences in the selection of food items eaten by individuals from home supplies.
The magnitude of the difference in food used and food eaten depends, in part, on the unit of measure used--quantity of food, energy, nutrient levels, or cost. Whether it is appropriate to define total differences by weight, giving a pound of cheese equal importance to a pound of candy, is question- able. Dollar differences may be appropriate as an overall measure but are of little value in defining specific differences between food used and food eaten.

-15-
LITERATURE CITED
(i)
(2)
(3)
(4)
(5)
(6)
(7)
(8)
(9)
Hegsted~ D.M. 1979. Nationwide Food Consumption Survey -- Implications:
U.S. Dept. Agr. Proc. Agr. Outlook Conference. 1980:539-542
Gallo, A.E. 1980. Consumer food waste in the United States.
Fall 1980. NFS-12: 13-16. National Food Review
Controller General of the United States 1977. Food Waste: An Opportunity to Improve Resource Use. U.S.
General Accounting Office. CED-77-I18, 75 pp.
Consumer Nutrition Center 1979. Money Value of Food Used by Households in the United States,
Spring 1977. U.S. Dept. Agr. Prelim. Rpt. No. I, 17 pp. ?
1980. Food and Nutrient Intakes of Individuals in 1 Day in the United States, Spring 1977. U.S. Dept. AEr.,Prelim. Rpt. No. 2, 121 pp.
1982. Food Consumption: Households in the United States, Spring 1977. U.S. Dept. Agr. NFCS 1977-78. P, pt. No. H-I, 296 pp.
U.S. Department of Agriculture 1982. Nutrient Data Base for Household Surveys. Accession
No. PB 82 138496. Tape is available from U.S. Dept. Commerce, National Technical Information Service, 5285 Fort Royal Road, Springfield, Virginia 22161.
1980. Nutritive Values Used in Individual Survey, 1977-78. Accession No. PB 80 197403. See No. 6 for source.
Halfrisch, J., P. Steele, and L. Cohen 1982. Comparison of seven-day diet record with measured food intake of
twenty-four subjects. Nutrition Res. 2: 263-273.

-16-
Table l.--Contribution of food groups to total weights and money values of food used and difference in food used and eaten
Food used per da 7 Food group I Quantity Quantity Money
as purchased prepared value edible food
Difference in food used and food eaten per day Quantity Money prepared value
edible food
All food ................ Vegetable ............... Fruit ................... Grain product ...........
?
Milk product ............ Meat, poultry, s~afood.. Other food 3 .............
. P e r c e n t 2 ..........................
I00 i00 I00 I00 100 19 16 13 15 12 14 14 8 17 I0 12 18 13 20 14 24 26 13 21 II 18 II 38 2 7 13 15 15 25 46
IFood groups used by at least 90 percent of the 2,520 housekeeping households in the study. Table does not include nonalcoholic beverages.
2Percent of all food, calculated prior to rounding. 3Values by difference.
Source: USDA Nationwlde Food Consumption Survey 1977-78, 48 conterminous States, Spring 1977.
- 1 7 -
T a b l e 2 . - - P e r c e n t OE p r e p a r e d e d i b l e ~o?d r e p o r t e d a s uned Ln ' t . q . h o u s e h o l d s Char mms noc r e p o r t e d a s e a t e n by h o u s e h o l d m e m b e r s . "
T o t a l : fembers 411 VeSS- ?~-uic G r a i n M i l k v a s e , H o u s e h o l d h o u s e h o l d p e r f o o d z Cab le p r o d u c t p o u l t r y ,
house-, s e a f o o d h o l d
AL~ h o u s e h o l d s . . . . . . . . . .
~ousehoL~ members: ~,~emoeeeeeeeee~eeeeee ~ee4eeee4eeeee~ee~e.~ ~eomee~eeemoeeeeeeeeee ~eee*eeoee~eeeeeeeo,o4 ~veeeeee~eeeeeeeeeveee 6 Or ~ " J r e , . . , . , , d , . , , ,
PamtZy c o m p o s i t i o n : AL l ~d,sLC . . . . . . . . . . . . . ~ i t h c h i l d r e n . . . . . . . . .
~ e e k l 7 money v a l u e O~ ~ood pe r p e r s o n : ]
Less t han S9 . . . . . . . . . . 5 9 - L 2 , 9 9 . . . . . . . . . . . . . . $ 1 3 - l ~ . 9 9 . . . . . . . . . . . . . $ L 7 - 2 0 , 9 9 . . . . . . . . . . . . . 8 2 1 - 2 9 . 9 9 . . . . . . . . . . . . . $30 o r more. . . . . . . . . . .
~ e a t o n : ~ o r c h e a s c . . . . . . . . . . . . . ~orch C e n t r a l . . . . . . . . . South . . . . . . . . . . . . . . . . .
~ r h a n i z s c t o n : C e n t r a l c~cy . . . . . . . . . . Suburban . . . . . . . . . . . . . . ~ n ~ e c ~ p o L l c a n . . . . . . .
~ace: '~'ti~e . . . . . . • . . . . . . . . . . ~Lack . . . . . . . . . . . . . . . . . Ocher .................
- - - - - - N u m b e r . . . . . P e r c e n t
2,520 2 ,q 3G 34 ~2 38 29 6
467 l.O 50 49 50 61 38 34 834 2o0 43 38 48 46 42 L6 410 3.0 36 34 42 ~6 30 4 424 4 . 0 31 32 38 3L 22 2 212 ~.0 31 30 ~0 27 28 < 1 LT~ ~ .7 22 19 30 L9 20 < 1
1,425 1.8 44 41 &8 50 41 18 1,095 4.3 29 28 36 ~ 29 23 < L
308 3 .7 < 1 < I L3 ~ 9 < L 846 3.2 18 14 Z$ 18 l $ < 1 633 2 .9 31 25 37 32 28 < L ~ t6 2 .7 39 39 43 44 34 L2 385 2 .4 St ~2 ~3 54 63 34 153 1.8 73 74 75 79 74 57
~18 2.~ 34 34 38 33 27 6 680 2.9 32 32 ~6 28 26 786 2 .0 61 3~ ~0 ~0 37 8 438 2 ,9 32 3~ 64 27 26
742 2.8 36 35 40 ~0 27 L4 911 3.1 33 33 40 31 30 3 q67 Z.9 38 34 47 42 30 3
2,tTq 2.8 38 34 43 35 3L 2~0 3.0 38 33 il ~3 20 ~0 74 4.0 20 17 33 lB II < I
! Pe rcencases ~e re computed by s u b c r e c c t n 8 mean quancLcy oE Eood e a t e n pe r ho,asehoLd pe r 4ay ~:om
Mean q u a n t i t y o~ p r e p a r e d e d i b l e Food used pe r househo ld pec daF end e x p r e s s e d as p e r c e n t o~ q u a n t i t y o~ ~cgpa red e d i b l e ~ond.
"~ona l c~hoL£c b e v e r a g e s a re ~oc tncLuded . l~ncLudes ~ L u e oE ~ood char yes ~oughc , home p r o d u c e d , o r ~ e c e i v e d as ~ ! ~ : ~c pay . Va lue o~ ~:od
~ece~ved ~:hn~aC ~ c e c c expense by • househoL~ Ls based on the a v e r a s ~ ~ r l c e pe r pound pa id ~or chac ~ood 4y su t 'vey hxasehoLds in the same r e g i o n . ~.. t~g~ a re money v a l u e s ~or 21 mea ls .
~ou rce : 9SDA ~fac lonv t~e Food Consumpt ion S u ~ e y 1977-7q , ~8 c o n c e v ~ n o u ~ ~ a c e s , 3prOng 1977.

-18-
Table 3.--Nutritive values of food reported as used in U.S. households I that was not reported as eaten by household members.
Nutrient Mean difference per member per day 2
Food energy ..................... kcal ........... 1,094
Protein..................................... 29 . . . . . 57
Calcium .......................... mE ............ 339 Iron ............................. m_~ ............ 7.1 Vitamin A value .................. IU ............ 2,086 Thiamin .......................... mg ............ 0.59 Riboflavin ....................... mg ............ 0.82 Preformed niacin ................. m_~ ............ 8.4
Vitamin C ........................ mE ............ 45
12,520 housekeeping households (households in which at least one
member had I0 or more meals from household supplies during the 7-day report period).
2Mean difference per household member per day was computed by dividing mean difference per household per day by mean number of household members, computations made with unfounded data.
Source: USDA Nationwide Food Consumption Survey 1977-78, 48 conterminous States, spring 1977.

- - 1 9 -
q*,
TabZe 4 . ~ P e r c e n c o f food energy and n u t r i t i v e v a l u e o f Good repor=ed as used Ln ~ .S. househo lds ~hac ;rag noC r e p o r t e d as eaten by househo ld members, t
R o ~ e e h o l d Food P ~o~e£n Fe~ C a l c i u m ~ r o n V tCamin T ~ i a - R i b o - P r e - e n e r g y A v a l ~ e ~£n f l a v i n f o c ' ~ l
n isc 'La
ViCa- min
C
All h o u s e h o l d s . . . . . . . . . . 42 31 ~5 35 3q 31 35 36 35
~ousehold members: 1 . . . . . . . . . . . . . . . . . . . . . 57 51 ~0 51 55 ;8 53 52 53 2 . . . . . . . . . . . . . . . . . . . . . 48 39 51 45 45 32 41 42 ~0 3 . . . . . . . . . . . . . . . . . . . . . 44 32 47 36 40 36 37 37 35 4 . . . . . . . . . . . . . . . . . . . . . 38 27 41 29 37 30 31 32 32 5 . . . . . . . . . . . . . . . . . . . . . 36 25 40 30 32 20 27 29 2~
o r more . . . . . . . . . . . . . 31 18 33 26 30 18 25 26 24
Family composition: A11 edu~c . . . . . . . . . . . . . 50 4t ~3 S6 47 38 ~4 44 ~3 W~ch ch£1dren . . . . . . . . . 36 25 40 28 34 24 2~ 30 29
~ e e k l v ~one7 t e l l s o f food per p e r s o n : :
L e s s than ~q . . . . . . . . . . ~ < I 12 < t 7 < L 2 t < I $ 9 - / 2 . 9 9 . . . . . . . . . . . . . . 25 12 29 19 22 13 19 19 16 q 1 3 - t ~ . 9 9 . . . . . . . . . . . . . 37 26 40 32 34 27 29 32 28 $ 1 7 - 2 0 . 9 9 . . . . . . . . . . . . . 45 35 47 39 43 35 39 39 40 $ 2 1 - 2 9 . 9 9 . . . . . . . . . . . . . 59 50 61 St 57 47 53 53 55 S30 o r ~ o r s . . . . . . . . . . . 76 71 77 75 75 70 73 73 72
Re$£on : ~ o r c h e a s ¢ . . . . . . . . . . . . . 42 31 44 34 3q 3 t 34 36 36 ~ o r c h C e n t r a l . . . . . . . . . 3q 29 41 31 37 30 32 33 33 South . . . . . . . . . . . . . . . . . 46 34 50 62 42 34 38 40 38 ~ e s c . . . . . . . . . . . . . . . . . . 39 29 ~2 33 37 27 33 32 30
~ r b e n £ z a e £ o n : C e n c r e t c i t y . . . . . . . . . . 43 33 48 36 t l 30 35 35 35 S u b u r b a n . . . . . . . . . . . . . . 39 30 42 33 37 2~ 32 34 33 ~ o n n e c r o p o t t : ~ n . . . . . . . 43 32 46 38 41 35 38 38 37
~&Ce: ' ~ t [ e . . . . . . . . . . . . . . . . . 42 32 44 36 39 31 35 36 35 3 l a c k . . . . . . . . . . . . . . . . . ~6 32 52 37 ~4 35 37 37 36 O ~ e : . . . . . . . . . . . . . . . . . 32 20 3q 21 28 tO 21 24 23
37
51 43 38 33 31 22
45 30
I 21 31 40 52 73
36 32 43 35
3q 34 38
37 41 22
:Popu la~ ton r a t i o s f o r &roups o f househo lds ve re med £n the c a l c u l a t i o n s . " I n c l u d e s , ,a lue o f food chat ~as boush~, home produced , o r r e c e i v e d as 3 t f ~ o r pay . Value o f
~ood r e c e i v e d ~ lc~ouc d~recC expense b 7 a househo ld Ls based on the average p r i c e per=~ound pa id ~or chac food by sur~ey househo lds in the same r e g i o n . Ranges ace ~one7 ~a lues ~or 21 = e e l s .
5ouree: USDA ~ac£onvtde ?ood Consumpt ion Survey 1977-7~, 48 conce r= inous 3cares, s p r y & ; t977.