measures of dispersion · dispersion is the range. for ungrouped data, the range is the difference...
TRANSCRIPT
Measures of Dispersion
Quantitative Aptitude & Business Statistics

Quantitative Aptitude & Business Statistics: Measures of Dispersion 2
Why Study Dispersion? An average, such as the mean
or the median only locates the centre of the data.
An average does not tell us anything about the spread of the data.

Quantitative Aptitude & Business Statistics: Measures of Dispersion 3
What is Dispersion
Dispersion ( also known as Scatter ,spread or variation ) measures the items vary from some central value .
It measures the degree of variation.

Quantitative Aptitude & Business Statistics: Measures of Dispersion 4
Significance of Measuring Dispersion
To determine the reliability of an average.
To facilitate comparison. To facilitate control. To facilitate the use of other
statistical measures.
Quantitative Aptitude & Business Statistics: Measures of Dispersion 5
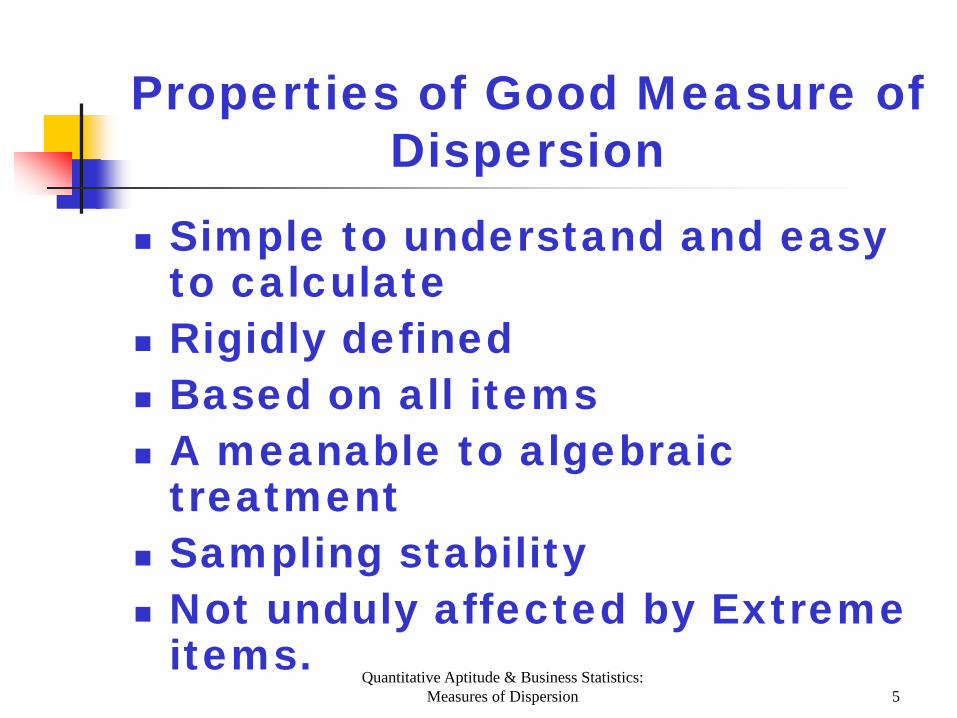
Properties of Good Measure of Dispersion
Simple to understand and easy to calculate
Rigidly defined Based on all items A meanable to algebraic
treatment Sampling stability Not unduly affected by Extreme
items.
Quantitative Aptitude & Business Statistics: Measures of Dispersion 6
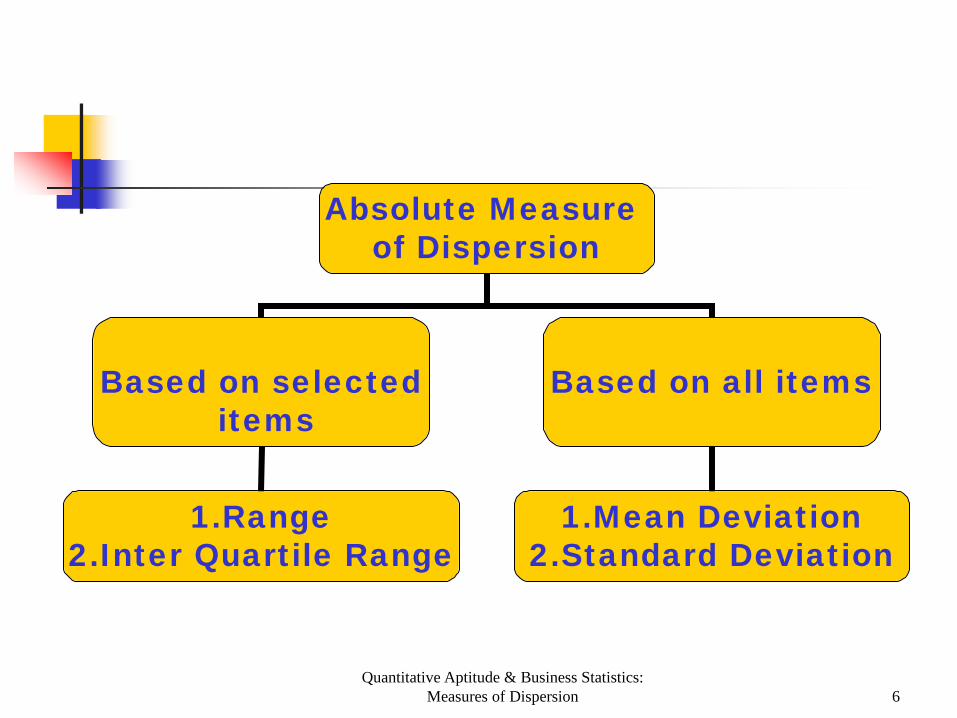
Absolute Measure of Dispersion
Based on selected
items Based on all items
1.Range 2.Inter Quartile Range
1.Mean Deviation 2.Standard Deviation

Quantitative Aptitude & Business Statistics: Measures of Dispersion 7
Relative measures of Dispersion
Based on Selected items
Based on all items
1.Coefficient of Range 2.Coefficient of QD
1.Coefficient of MD 2.Coefficient of SD & Coefficient of Variation
Quantitative Aptitude & Business Statistics: Measures of Dispersion 8
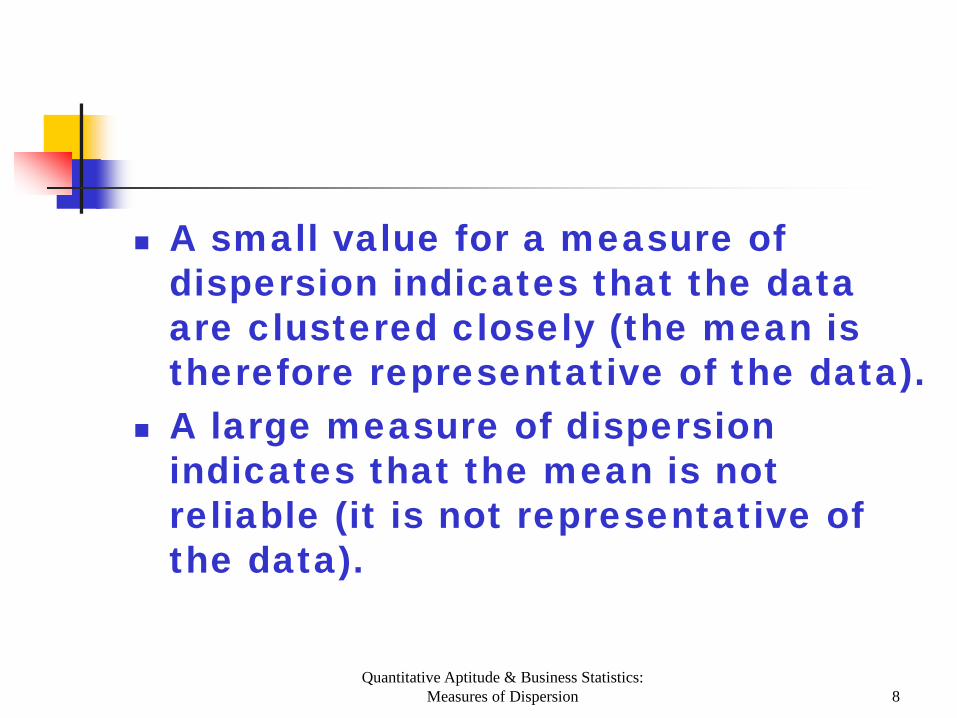
A small value for a measure of dispersion indicates that the data are clustered closely (the mean is therefore representative of the data).
A large measure of dispersion indicates that the mean is not reliable (it is not representative of the data).
Quantitative Aptitude & Business Statistics: Measures of Dispersion 9
The Range The simplest measure of
dispersion is the range. For ungrouped data, the
range is the difference between the highest and lowest values in a set of data.
Quantitative Aptitude & Business Statistics: Measures of Dispersion 10
RANGE = Highest Value - Lowest Value
Quantitative Aptitude & Business Statistics: Measures of Dispersion 11
The range only takes into account the most extreme values.
This may not be representative of the population.
Quantitative Aptitude & Business Statistics: Measures of Dispersion 12
The Range Example
A sample of five accounting graduates revealed the following starting salaries: 22,000,28,000, 31,000, 23,000, 24,000.
The range is 31,000 - 22,000 = 9,000.
Quantitative Aptitude & Business Statistics: Measures of Dispersion 13
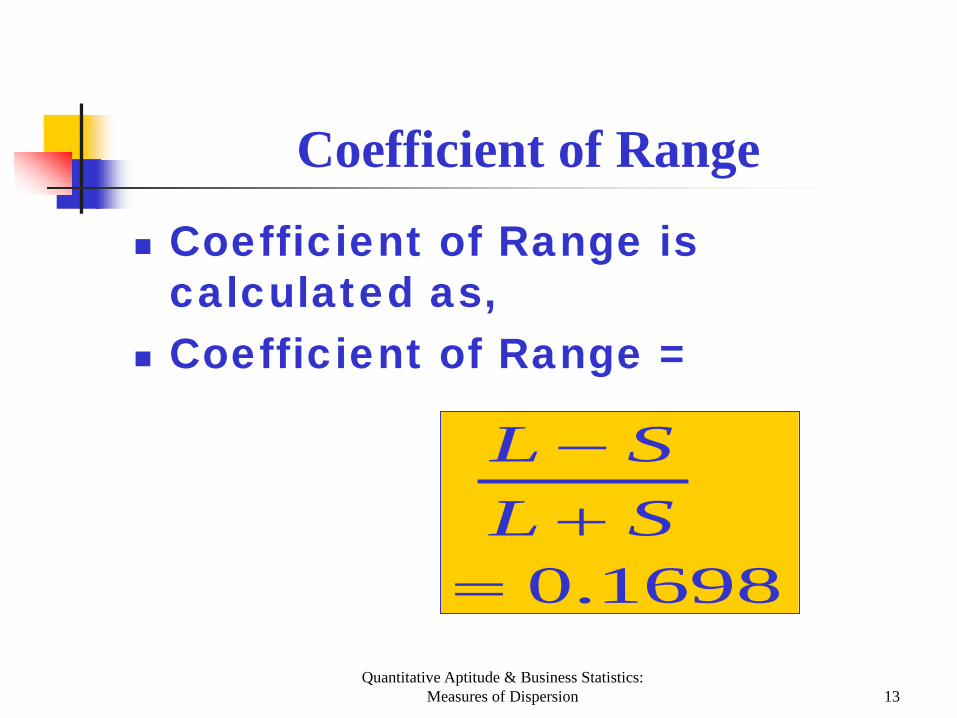
Coefficient of Range
Coefficient of Range is calculated as,
Coefficient of Range =
1698.0=+−
SLSL
Quantitative Aptitude & Business Statistics: Measures of Dispersion 14
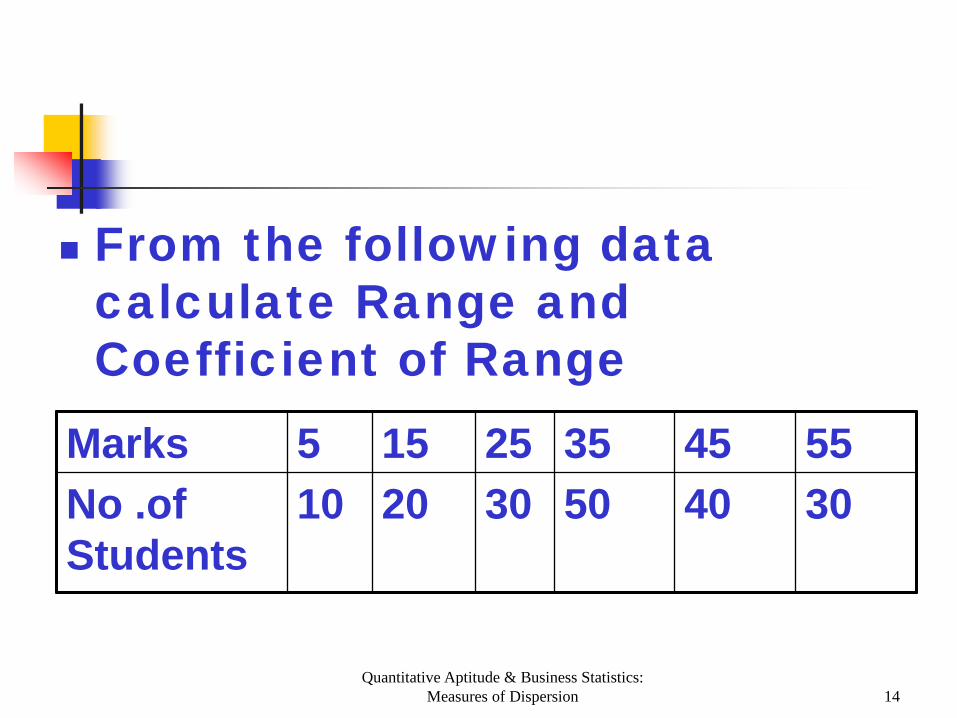
From the following data calculate Range and Coefficient of Range
Marks 5 15 25 35 45 55 No .of Students
10 20 30 50 40 30
Quantitative Aptitude & Business Statistics: Measures of Dispersion 15
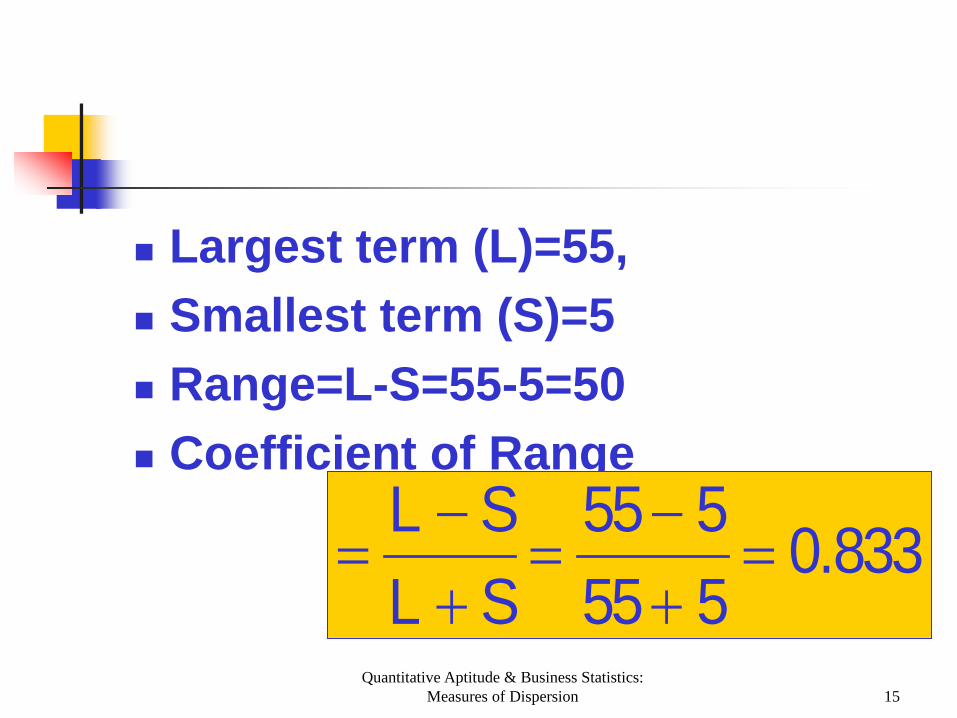
Largest term (L)=55, Smallest term (S)=5 Range=L-S=55-5=50 Coefficient of Range
833.0555555
SLSL
=+−
=+−
=
Quantitative Aptitude & Business Statistics: Measures of Dispersion 16
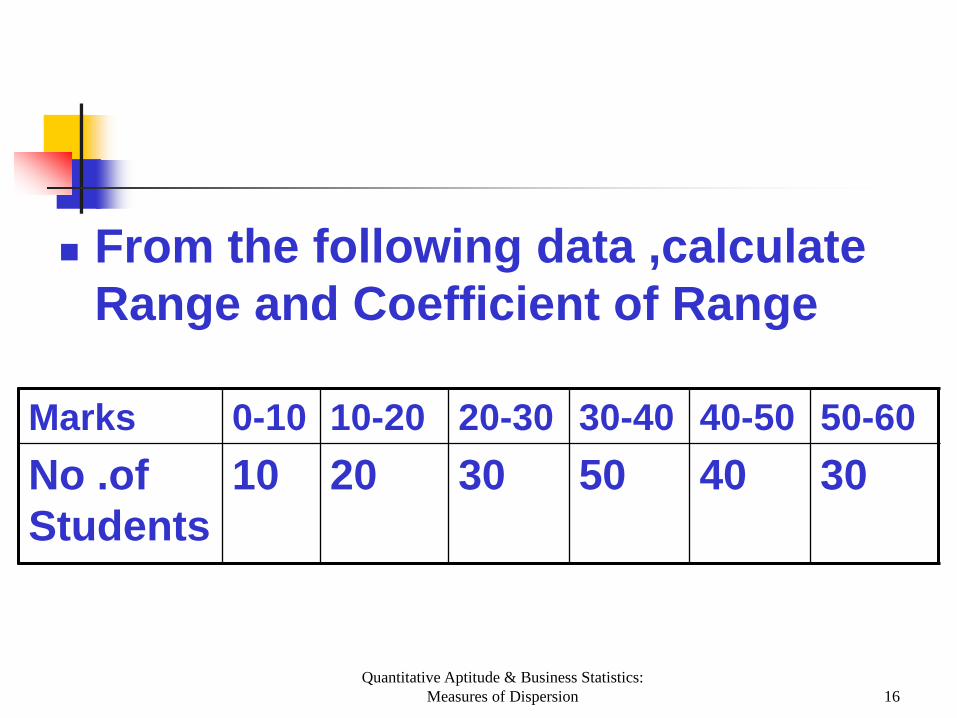
From the following data ,calculate Range and Coefficient of Range
Marks 0-10 10-20 20-30 30-40 40-50 50-60 No .of Students
10 20 30 50 40 30
Quantitative Aptitude & Business Statistics: Measures of Dispersion 17
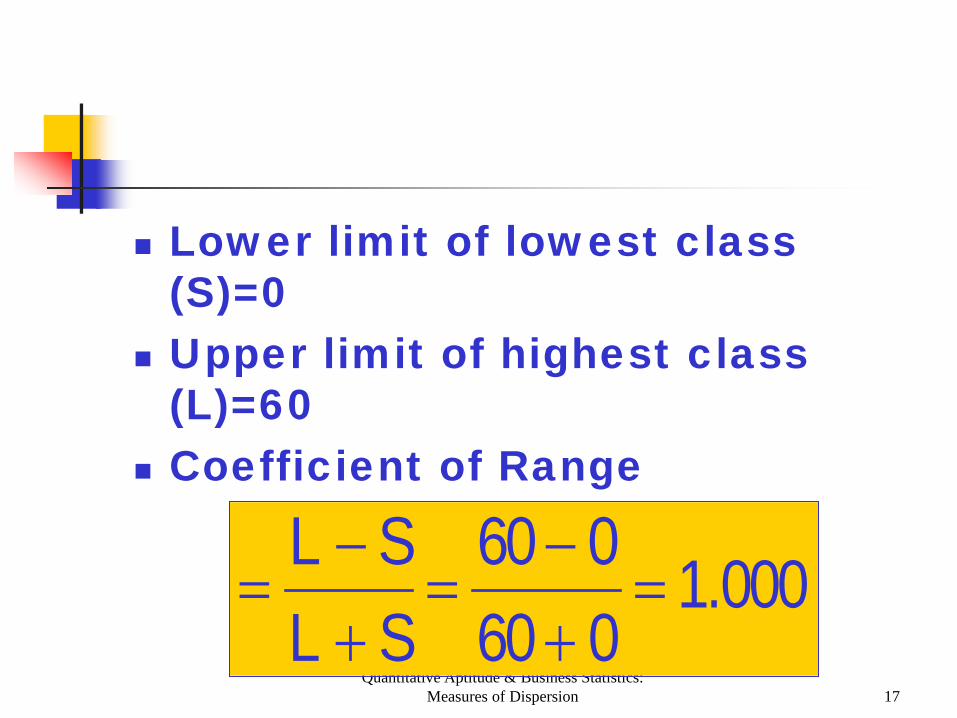
Lower limit of lowest class (S)=0
Upper limit of highest class (L)=60
Coefficient of Range
000.1060060
SLSL
=+−
=+−
=
Quantitative Aptitude & Business Statistics: Measures of Dispersion 18
Merits Of Range 1.Its easy to understand and
easy to calculate. 2.It does not require any
special knowledge. 3.It takes minimum time to
calculate the value of Range.
Quantitative Aptitude & Business Statistics: Measures of Dispersion 19
Limitations of Range
It does not take into account of all items of distribution.
Only two extreme values are taken into consideration.
It is affected by extreme values.

Quantitative Aptitude & Business Statistics: Measures of Dispersion 20
Limitations of Range
It does not indicate the direction of variability.
It does not present very accurate picture of the variability.
Quantitative Aptitude & Business Statistics: Measures of Dispersion 21
Uses of Range It facilitates to study quality
control. It facilitates to study variations
of prices on shares ,debentures, bonds and agricultural commodities.
It facilitates weather forecasts.
Quantitative Aptitude & Business Statistics: Measures of Dispersion 22
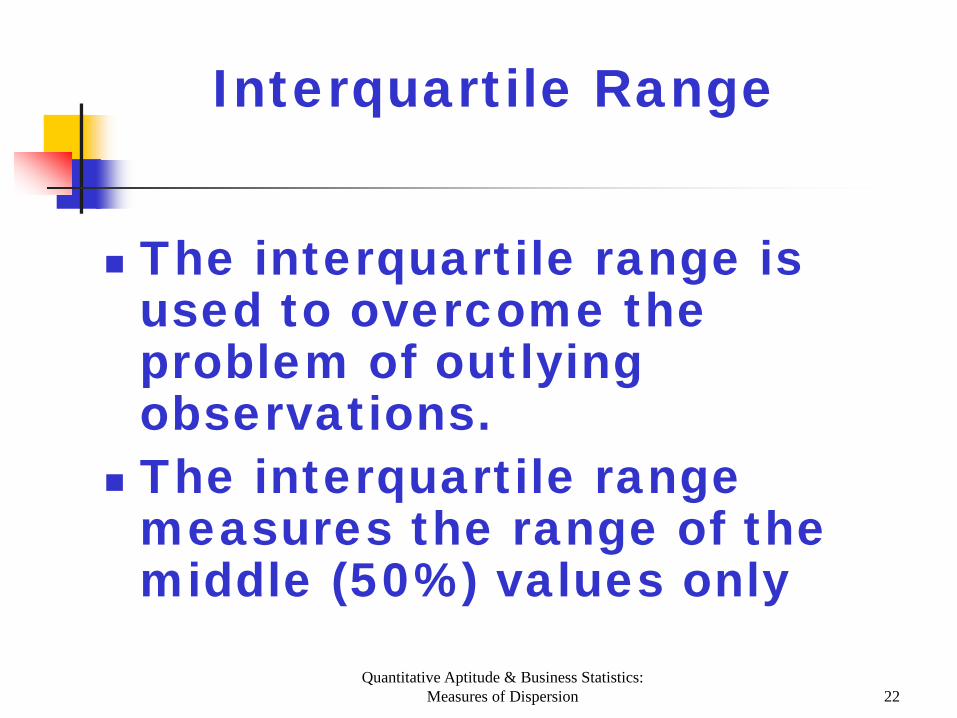
Interquartile Range
The interquartile range is used to overcome the problem of outlying observations.
The interquartile range measures the range of the middle (50%) values only
Quantitative Aptitude & Business Statistics: Measures of Dispersion 23
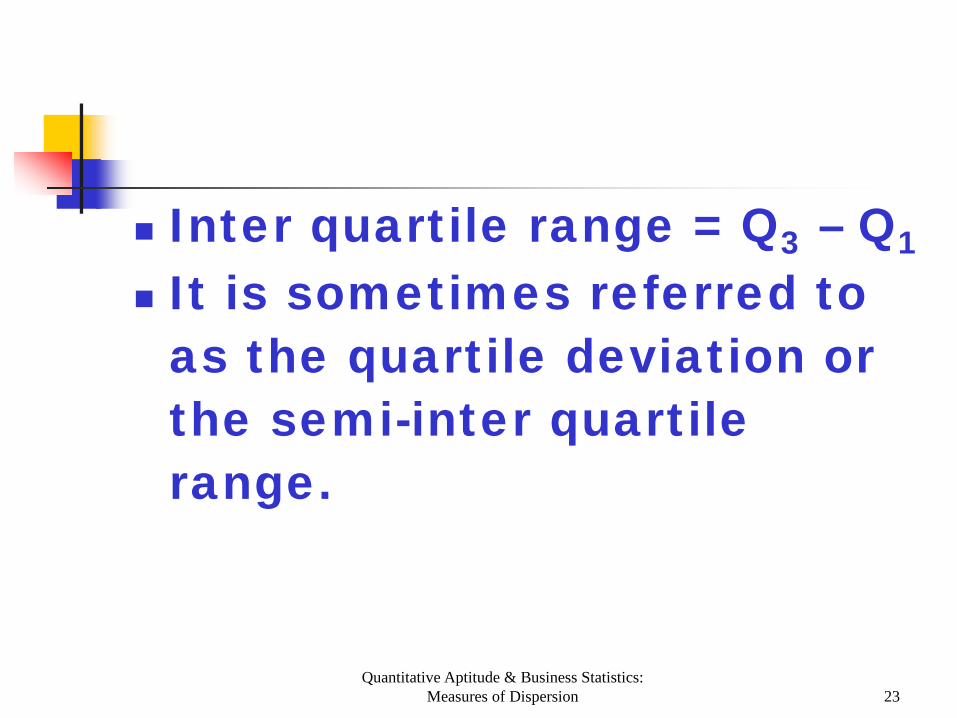
Inter quartile range = Q3 – Q1 It is sometimes referred to
as the quartile deviation or the semi-inter quartile range.
Quantitative Aptitude & Business Statistics: Measures of Dispersion 24
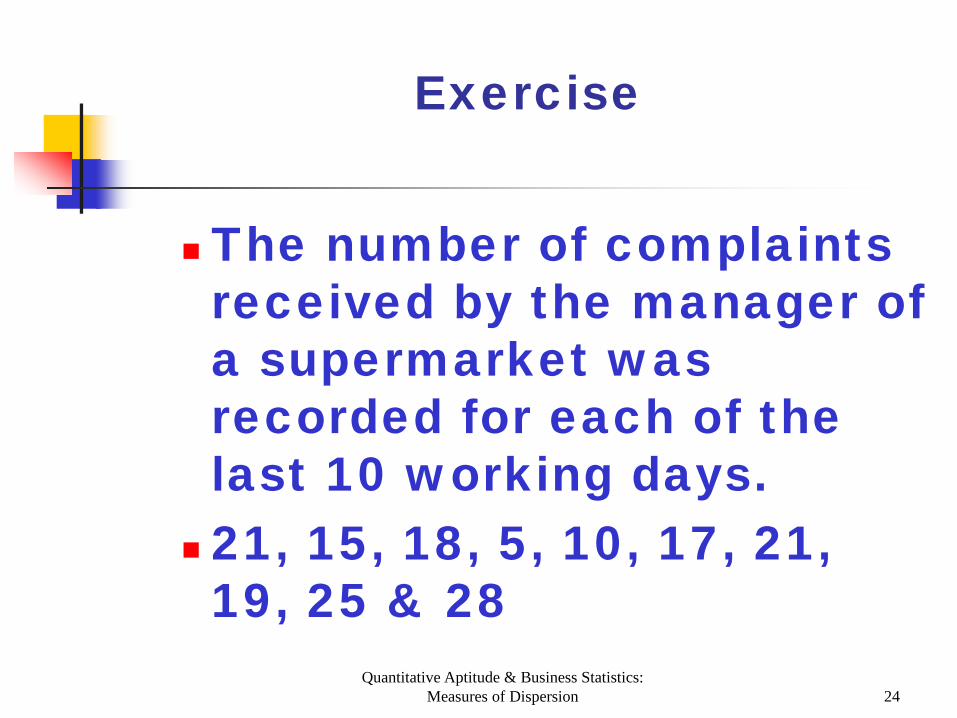
Exercise
The number of complaints received by the manager of a supermarket was recorded for each of the last 10 working days.
21, 15, 18, 5, 10, 17, 21, 19, 25 & 28

Quantitative Aptitude & Business Statistics: Measures of Dispersion 25
Interquartile Range Example
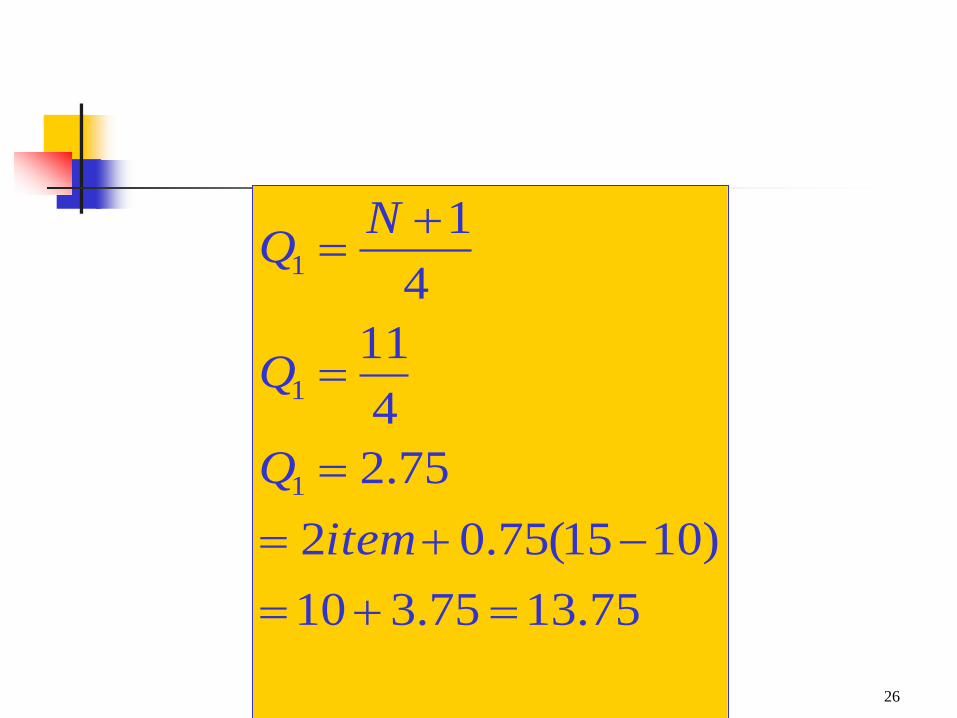
Sorted data 5, 10, 15, 17, 18, 19, 21, 21, 25 & 28
Quantitative Aptitude & Business Statistics: Measures of Dispersion 26
75.1375.310)1015(75.02
75.24
114
1
1
1
1
=+=−+=
=
=
+=
itemQ
Q
NQ
Quantitative Aptitude & Business Statistics: Measures of Dispersion 27
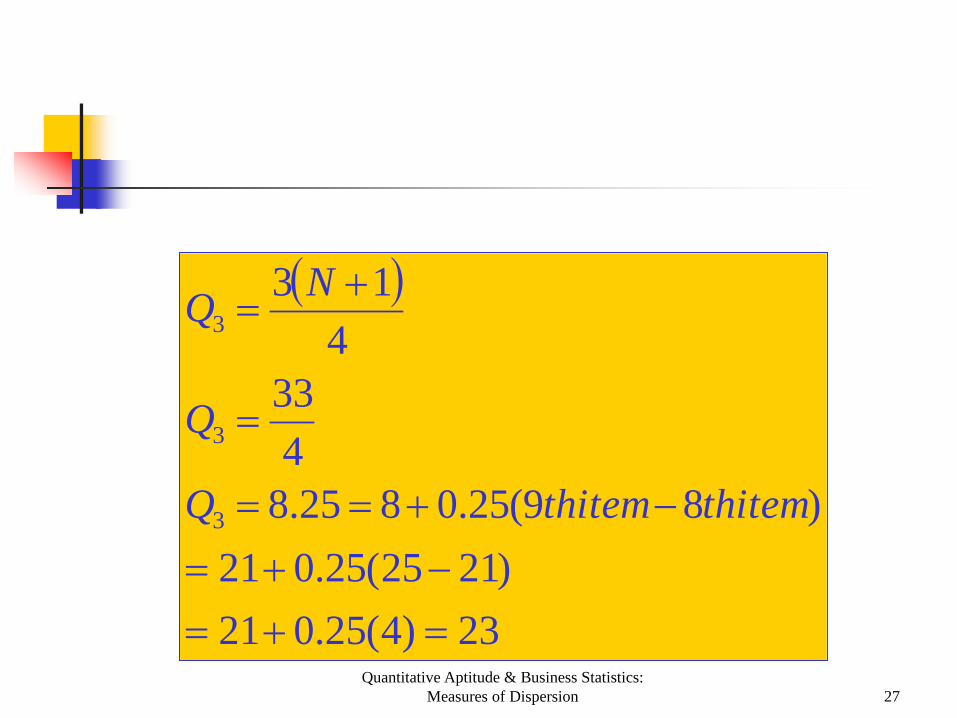
( )
23)4(25.021)2125(25.021
)89(25.0825.84
334
13
3
3
3
=+=−+=
−+==
=
+=
thitemthitemQ
Q
NQ
Quantitative Aptitude & Business Statistics: Measures of Dispersion 28
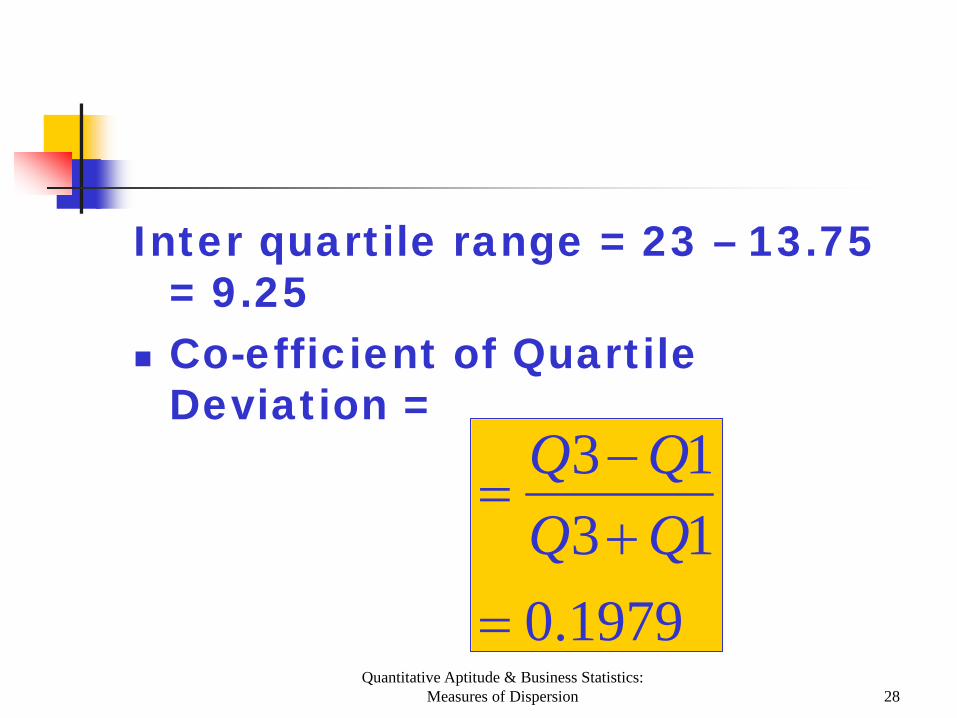
Inter quartile range = 23 – 13.75 = 9.25
Co-efficient of Quartile Deviation =
1979.01313
=+−
=QQQQ
Quantitative Aptitude & Business Statistics: Measures of Dispersion 29
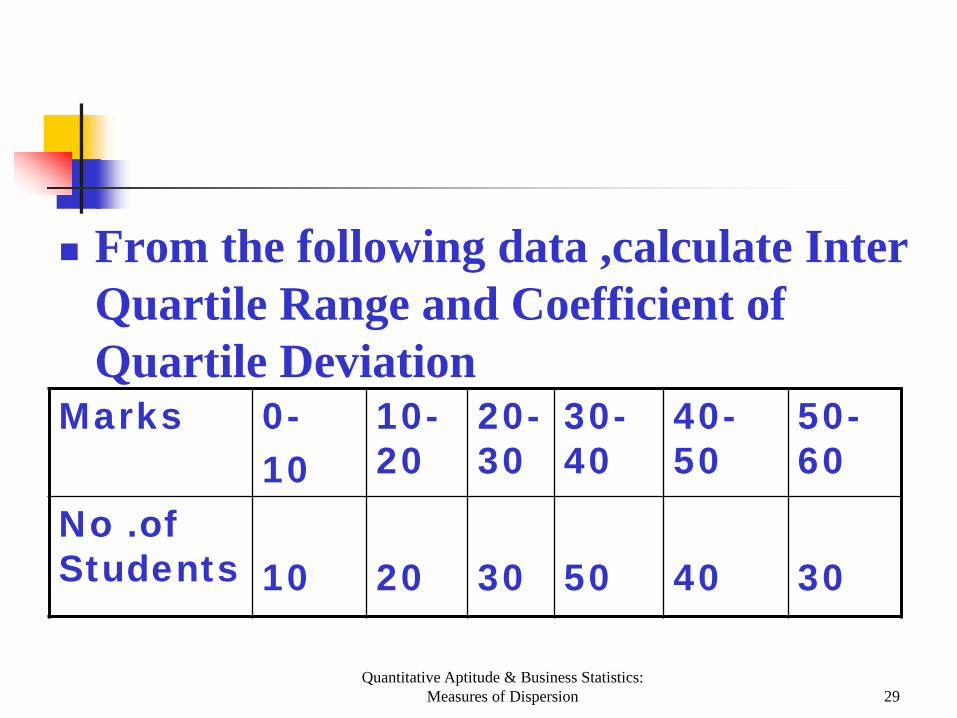
From the following data ,calculate Inter Quartile Range and Coefficient of Quartile Deviation
Marks 0- 10
10-20
20-30
30-40
40-50
50-60
No .of Students
10
20
30
50
40
30

Quantitative Aptitude & Business Statistics: Measures of Dispersion 30
Calculation of Cumulative frequencies Marks No. of
Students Cumulative Frequencies
0-10 10-20 20-30 30-40 40-50 50-60
10 20 30f 50 40 f 30
10 30 cf 60Q1 Class 110 cf 150Q3Class 180
180
L1
L3

Quantitative Aptitude & Business Statistics: Measures of Dispersion 31
Q1= Size of N/4th item = Size of 180/4th item = 45th item
There fore Q1 lies in the Class 20-30
Cf
f.c4N
LQ1 ×
−+=

Quantitative Aptitude & Business Statistics: Measures of Dispersion 32
25
10301520
1030
304
180
20Q1
=
×
+=
×
−+=
Quantitative Aptitude & Business Statistics: Measures of Dispersion 33
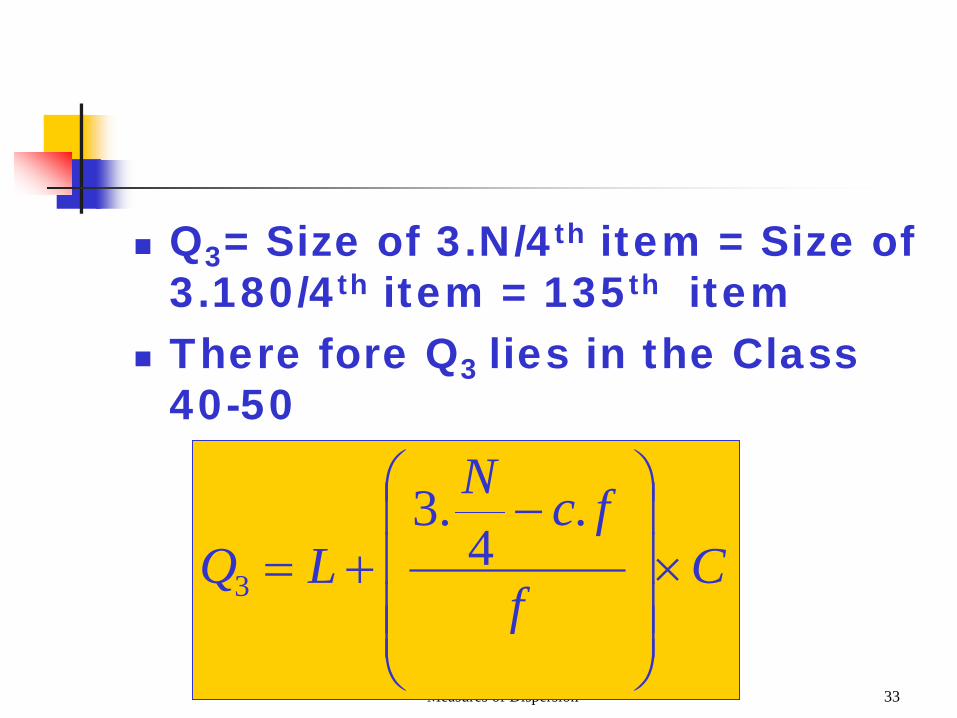
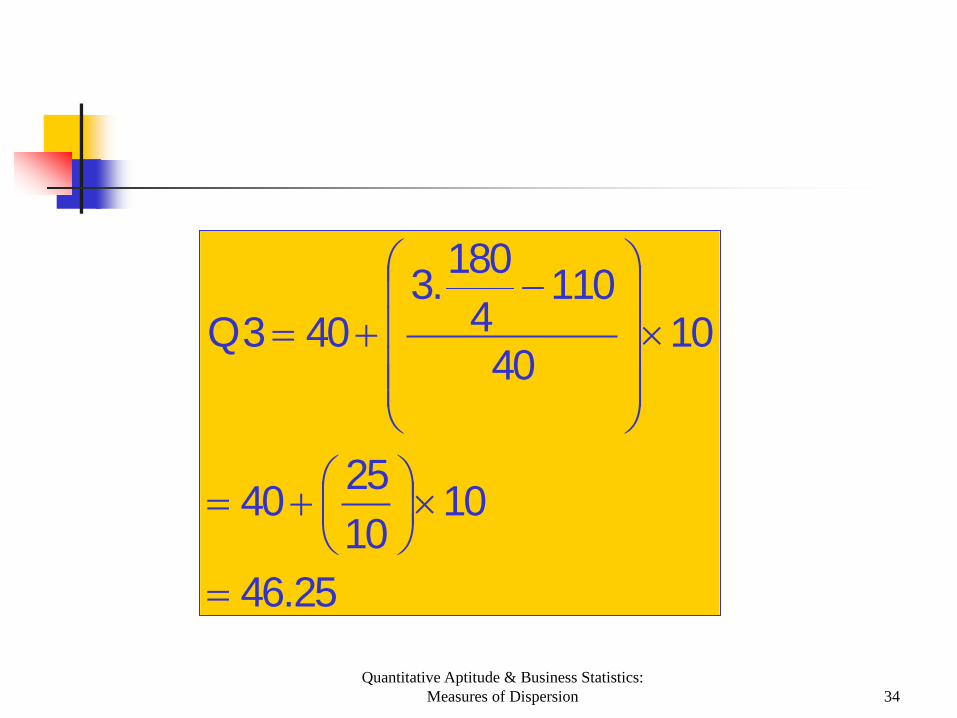
Q3= Size of 3.N/4th item = Size of 3.180/4th item = 135th item
There fore Q3 lies in the Class 40-50
Cf
fcN
LQ ×
−+=
.4
.33
Quantitative Aptitude & Business Statistics: Measures of Dispersion 34
25.46
10102540
1040
1104
180.3403Q
=
×
+=
×
−+=
Quantitative Aptitude & Business Statistics: Measures of Dispersion 35
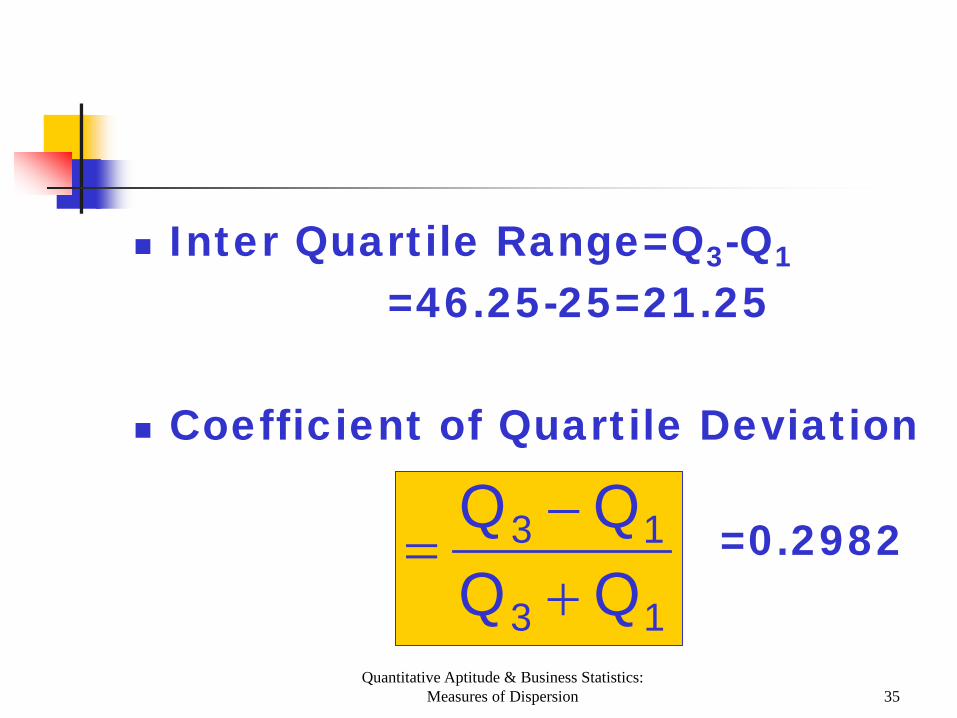
Inter Quartile Range=Q3-Q1
=46.25-25=21.25
Coefficient of Quartile Deviation
13
13
QQQQ
+−
= =0.2982

Quantitative Aptitude & Business Statistics: Measures of Dispersion 36
Merits Of Quartile Deviation Its easy to understand and easy
to calculate. It is least affected by extreme
values. It can be used in open-end
frequency distribution.

Quantitative Aptitude & Business Statistics: Measures of Dispersion 37
Limitations of Quartile Deviation It is not suited to algebraic
treatment It is very much affected by sampling
fluctuations The method of Dispersion is not
based on all the items of the series . It ignores the 50% of the
distribution.
Quantitative Aptitude & Business Statistics: Measures of Dispersion 38
Mean Deviation
The mean deviation takes into consideration all of the values
Mean Deviation: The arithmetic mean of the absolute values of the deviations from the arithmetic mean

Quantitative Aptitude & Business Statistics: Measures of Dispersion 39
n
xxMD
∑ −=
Where: X = the value of each observation X = the arithmetic mean of the values
n = the number of observations
|| = the absolute value (the signs of the deviations are disregarded)
Quantitative Aptitude & Business Statistics: Measures of Dispersion 40
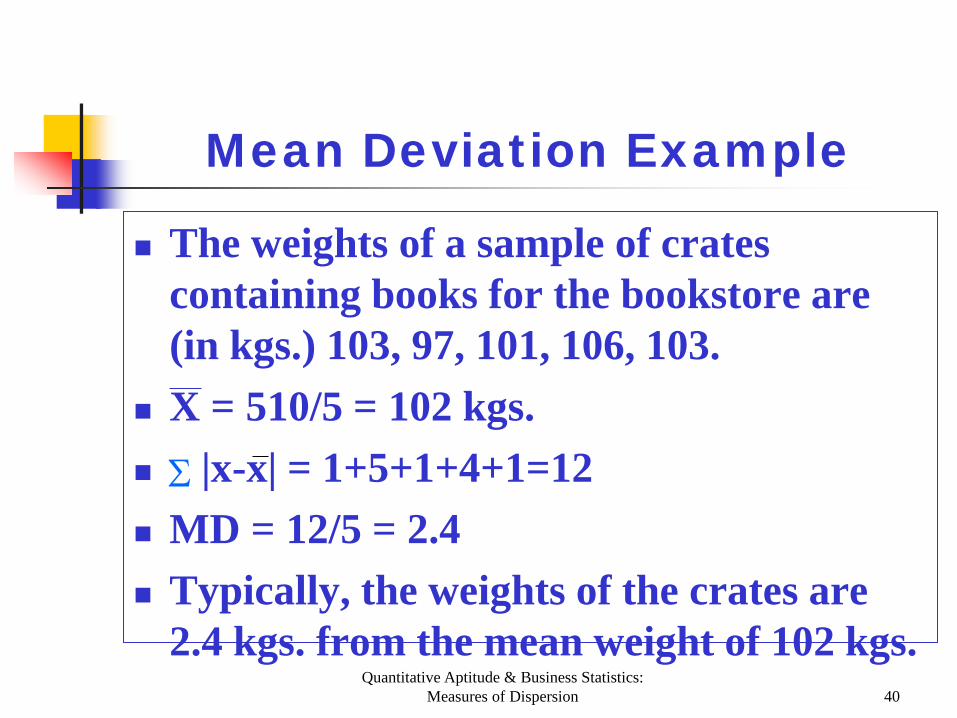
Mean Deviation Example
The weights of a sample of crates containing books for the bookstore are (in kgs.) 103, 97, 101, 106, 103.
X = 510/5 = 102 kgs. |x-x| = 1+5+1+4+1=12 MD = 12/5 = 2.4 Typically, the weights of the crates are
2.4 kgs. from the mean weight of 102 kgs.
Σ
Quantitative Aptitude & Business Statistics: Measures of Dispersion 41
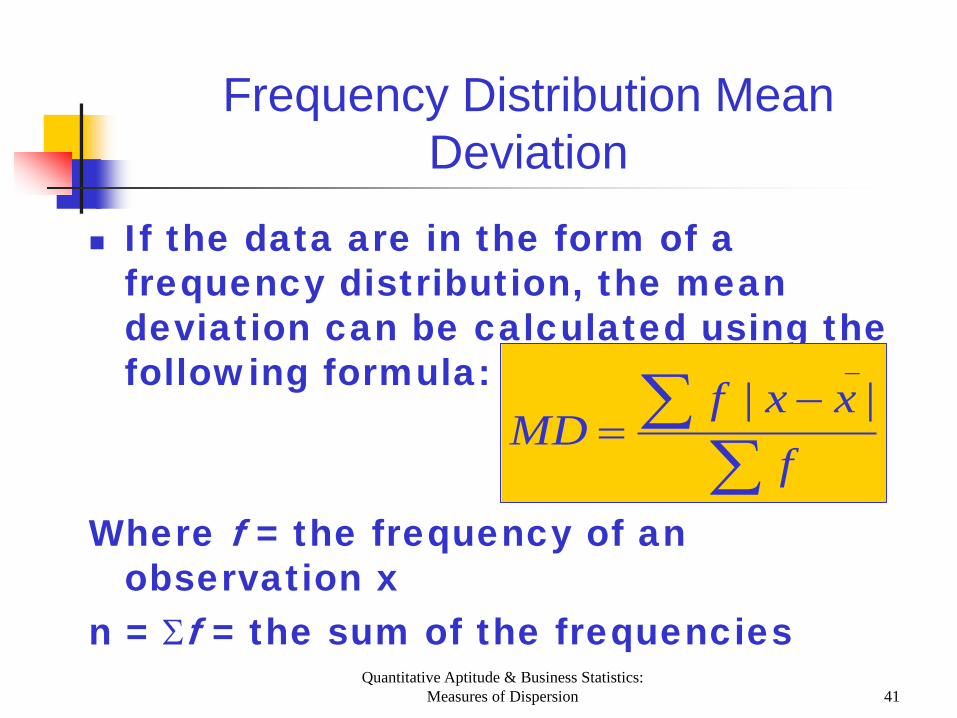
If the data are in the form of a frequency distribution, the mean deviation can be calculated using the following formula:
Where f = the frequency of an observation x
n = Σf = the sum of the frequencies
Frequency Distribution Mean Deviation
∑∑ −
=f
xxfMD
_||

Quantitative Aptitude & Business Statistics: Measures of Dispersion 42
Frequency Distribution MD Example
Number of outstanding
accounts
Frequency
fx
|x-x|
f|x-x|
0 1 0 2 2 1 9 9 1 9 2 7 14 0 0 3 3 9 1 3 4 4 16 2 8
Total: 24 Σfx = 48
Σ f|x-x| = 22

Quantitative Aptitude & Business Statistics: Measures of Dispersion 43
∑∑=
ffx
x_
∑∑ −
=f
xxfMD
_||
MD = 22/24 = 0.92
mean = 48/24 = 2
Quantitative Aptitude & Business Statistics: Measures of Dispersion 44
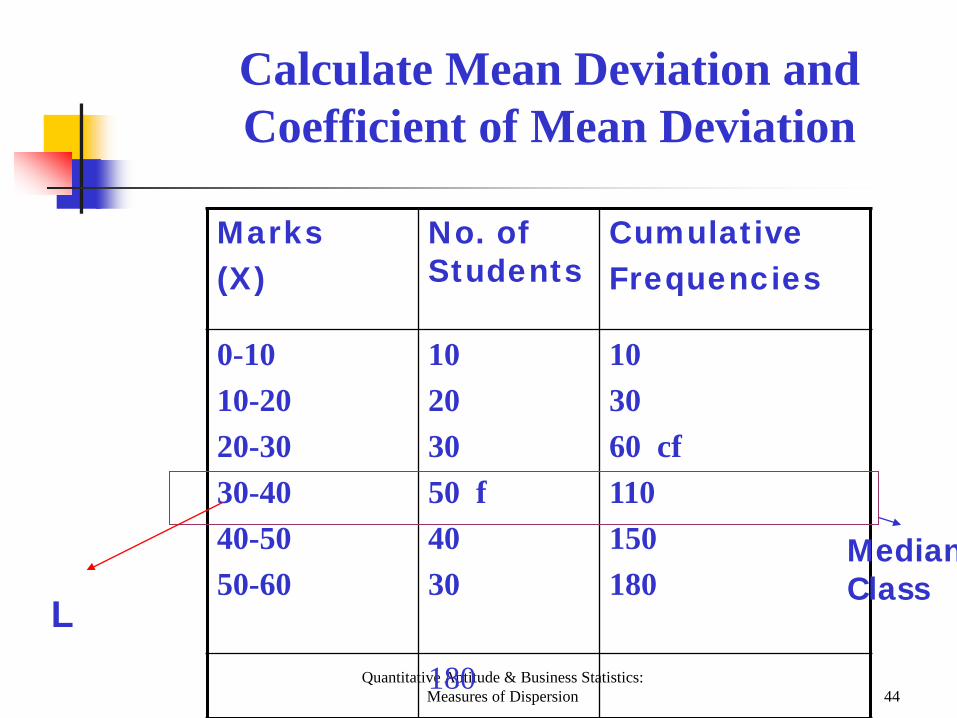
Calculate Mean Deviation and Coefficient of Mean Deviation
Marks (X)
No. of Students
Cumulative Frequencies
0-10 10-20 20-30 30-40 40-50 50-60
10 20 30 50 f 40 30
10 30 60 cf 110 150 180
180
L
Median Class
Quantitative Aptitude & Business Statistics: Measures of Dispersion 45
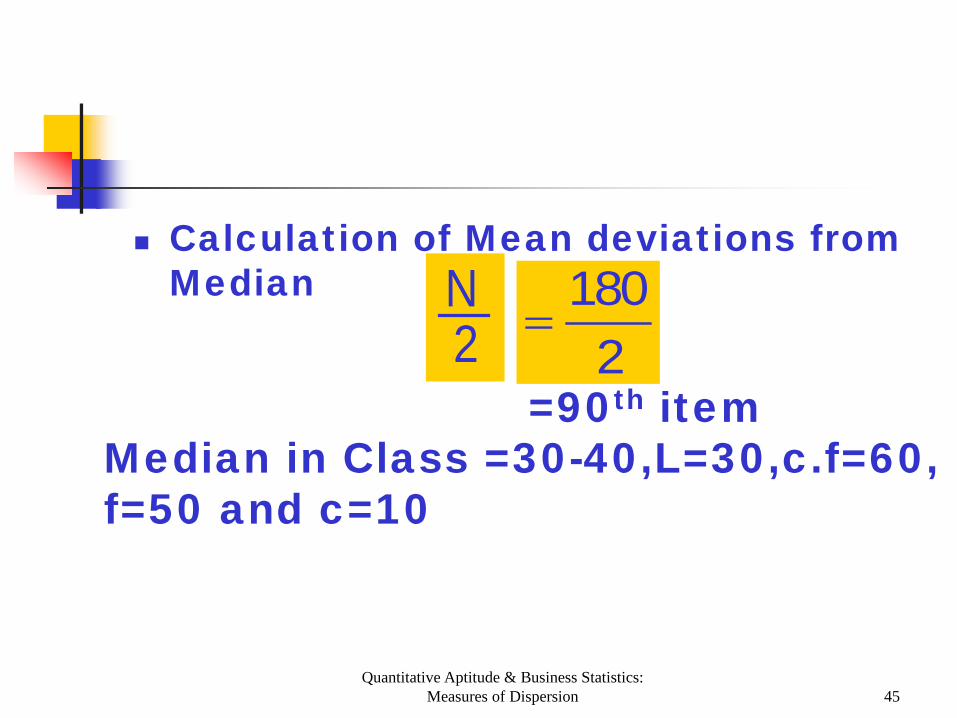
Calculation of Mean deviations from Median
2N
2180
=
=90th item Median in Class =30-40,L=30,c.f=60, f=50 and c=10
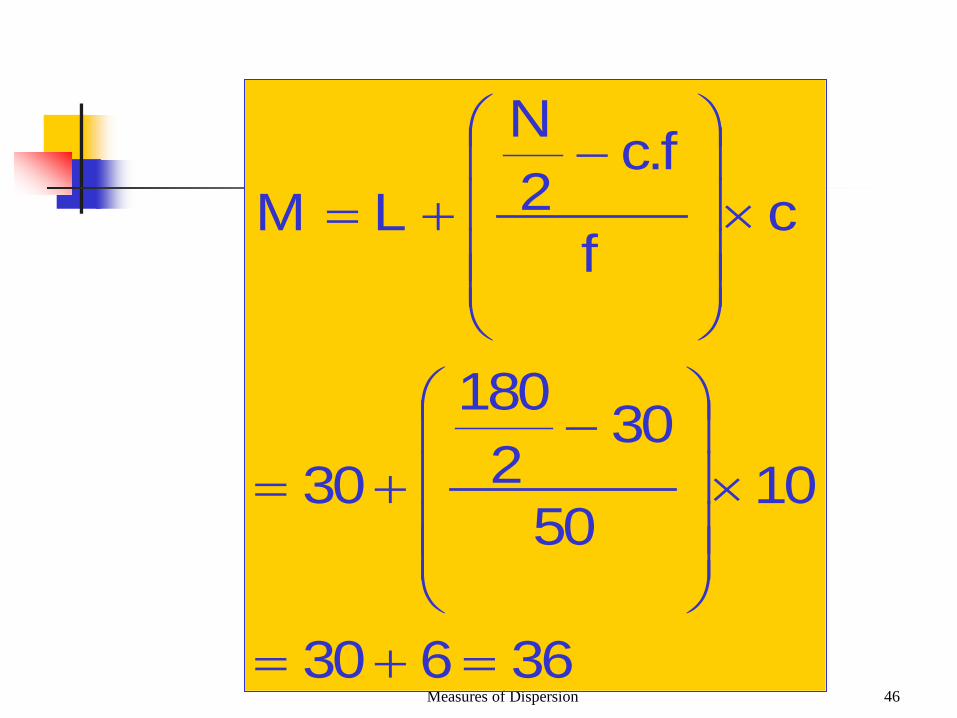
Quantitative Aptitude & Business Statistics: Measures of Dispersion 46
36630
1050
302
180
30
cf
f.c2N
LM
=+=
×
−+=
×
−+=
Quantitative Aptitude & Business Statistics: Measures of Dispersion 47
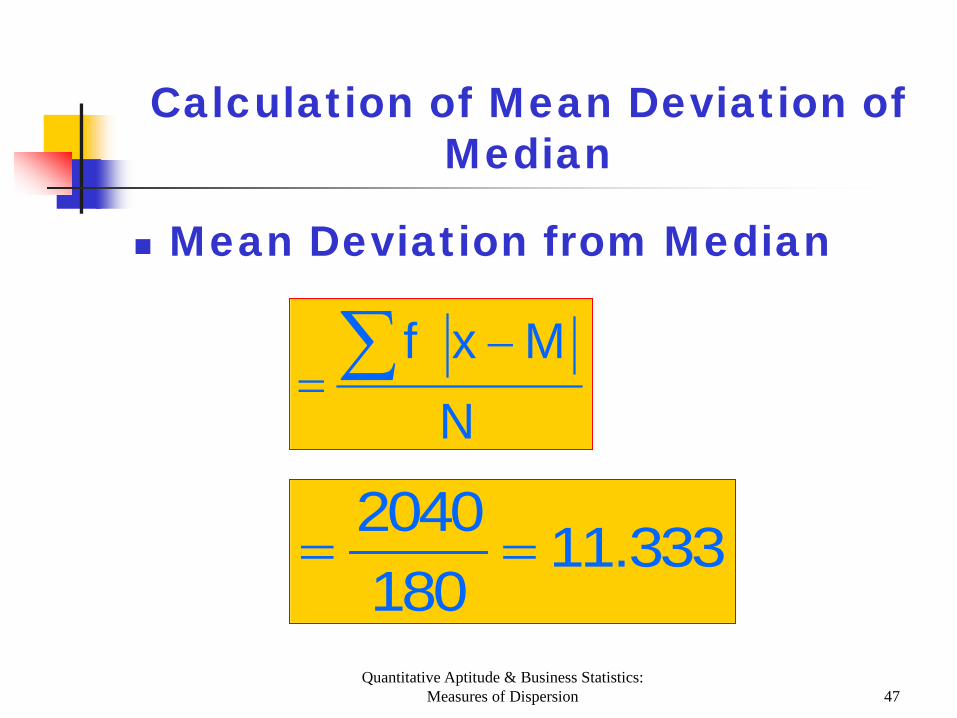
Calculation of Mean Deviation of Median
Mean Deviation from Median
NMxf∑ −
=
333.111802040
==
Quantitative Aptitude & Business Statistics: Measures of Dispersion 48
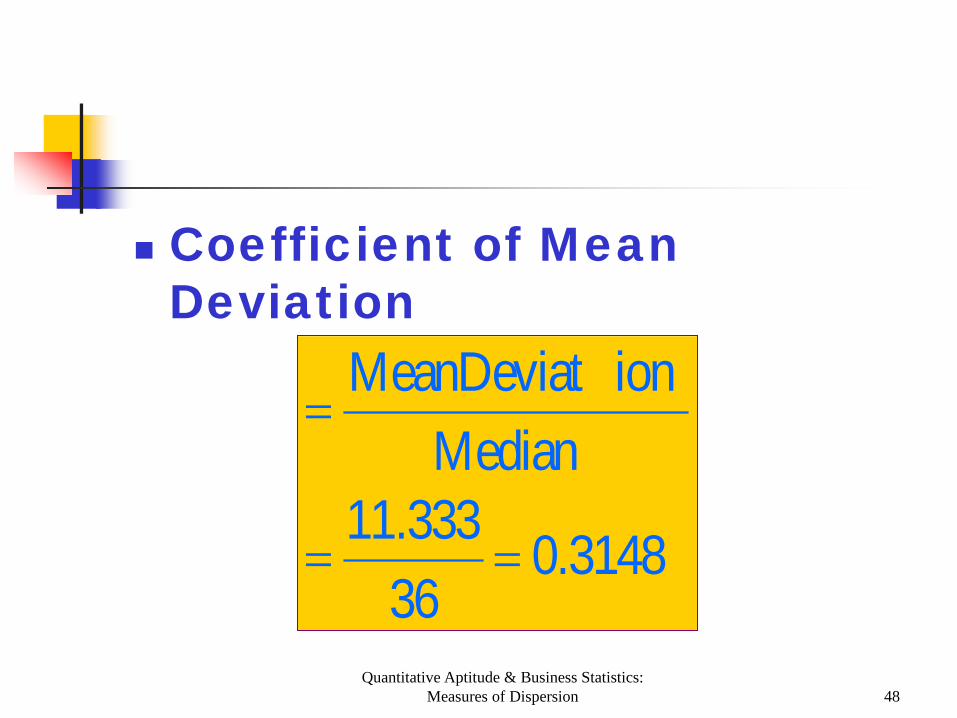
Coefficient of Mean Deviation
3148.036333.11Median
ionMeanDeviat
==
=

Quantitative Aptitude & Business Statistics: Measures of Dispersion 49
Merits of Mean Deviation
It is easy to understand It is based on all items of the
series It is less affected by extreme
values It is useful small samples when
no detailed analysis is required.

Quantitative Aptitude & Business Statistics: Measures of Dispersion 50
Limitations of Mean Deviation
It lacks properties such that (+) and(-)signs which are not taken into consideration.
It is not suitable for mathematical treatment.
Quantitative Aptitude & Business Statistics: Measures of Dispersion 51
It may not give accurate results when the degree of variability in a series is very high.
Quantitative Aptitude & Business Statistics: Measures of Dispersion 52
Standard Deviation
Standard deviation is the most commonly used measure of dispersion
Similar to the mean deviation, the standard deviation takes into account the value of every observation

Quantitative Aptitude & Business Statistics: Measures of Dispersion 53
The values of the mean deviation and the standard deviation should be relatively similar.

Quantitative Aptitude & Business Statistics: Measures of Dispersion 54
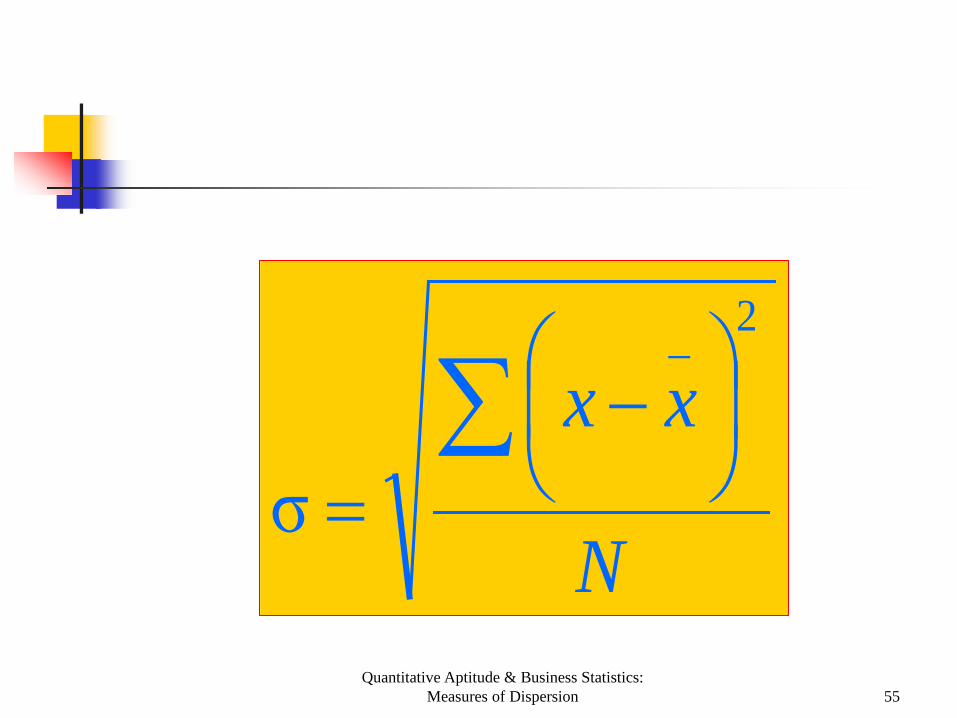
Standard Deviation The standard deviation uses the
squares of the residuals Steps;
Find the sum of the squares of the residuals
Find the mean Then take the square root of
the mean
Quantitative Aptitude & Business Statistics: Measures of Dispersion 55
N
xx∑
−
=
2_
σ
Quantitative Aptitude & Business Statistics: Measures of Dispersion 56
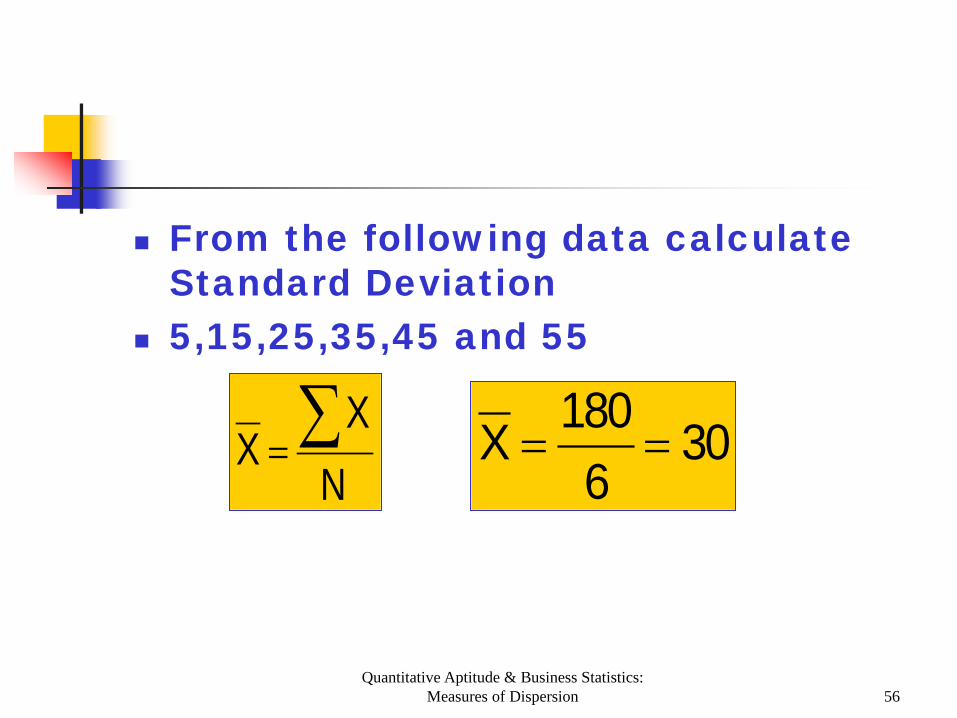
From the following data calculate Standard Deviation
5,15,25,35,45 and 55
NX
X ∑= 306
180X ==

Quantitative Aptitude & Business Statistics: Measures of Dispersion 57
078.176
1750N
)XX( 2
==
−=σ ∑
Quantitative Aptitude & Business Statistics: Measures of Dispersion 58
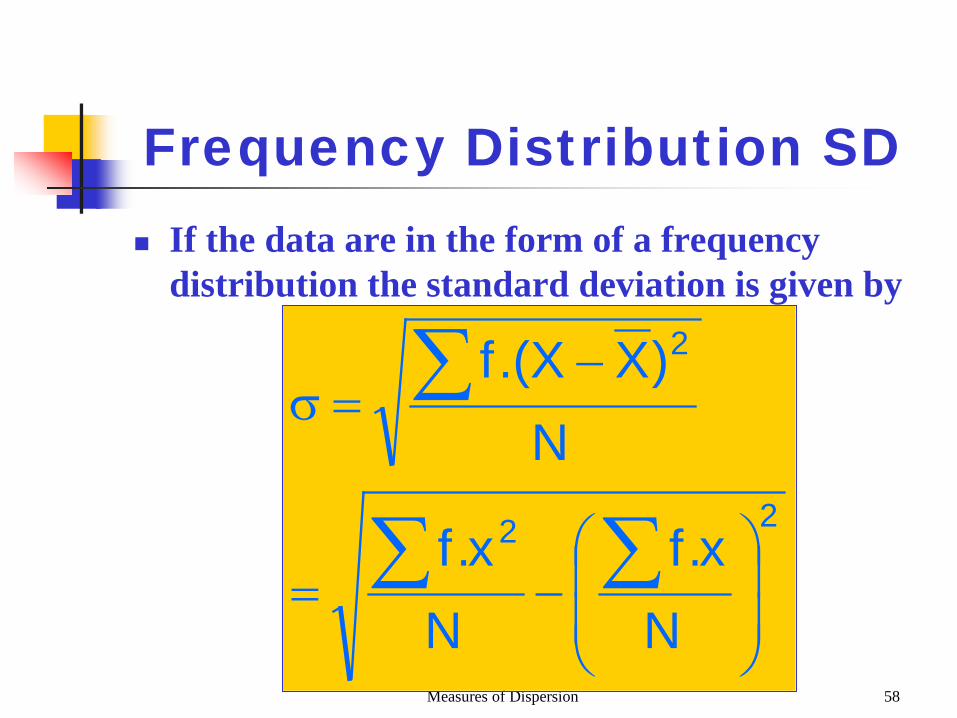
Frequency Distribution SD If the data are in the form of a frequency
distribution the standard deviation is given by
22
2
Nx.f
Nx.f
N)XX.(f
−=
−=σ
∑∑
∑
Quantitative Aptitude & Business Statistics: Measures of Dispersion 59
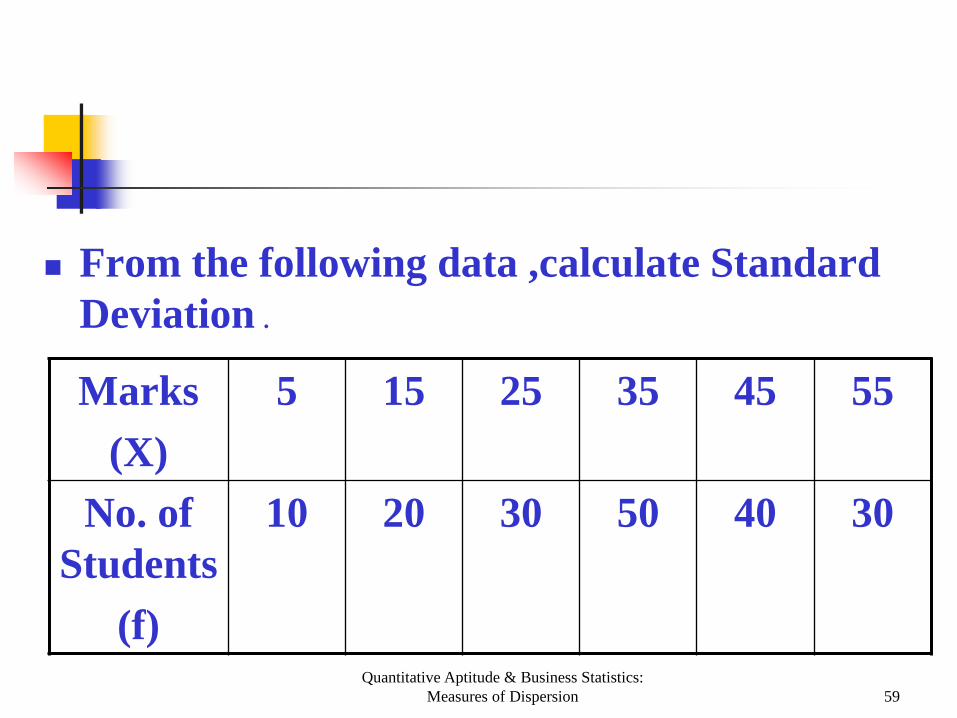
From the following data ,calculate Standard Deviation .
Marks (X)
5 15 25 35 45 55
No. of Students
(f)
10 20 30 50 40 30
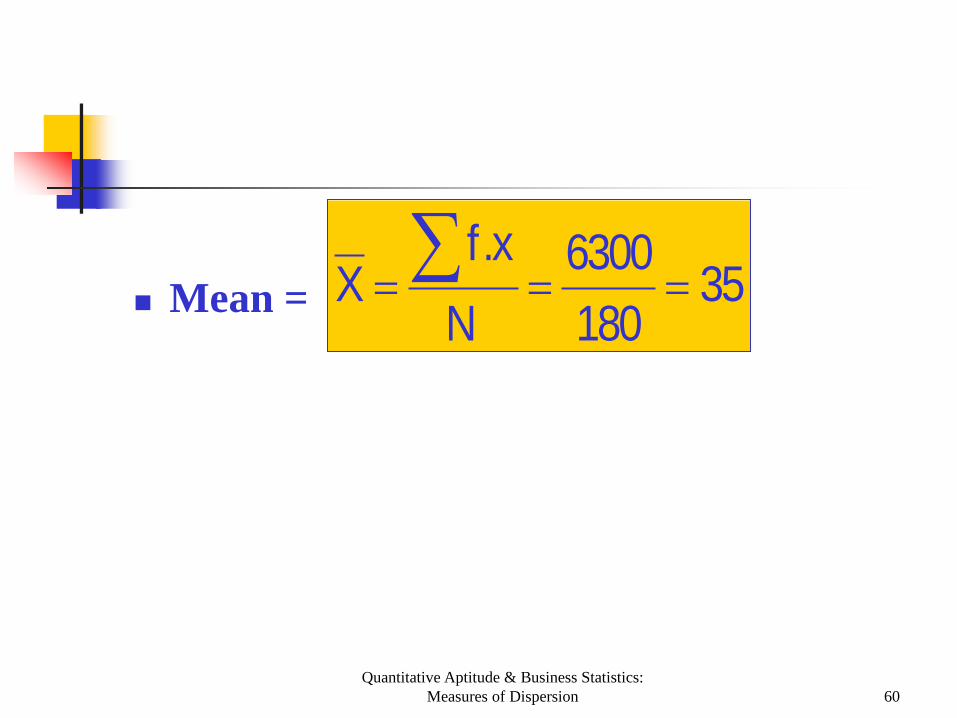
Quantitative Aptitude & Business Statistics: Measures of Dispersion 60
Mean = 35
1806300
Nx.f
X === ∑

Quantitative Aptitude & Business Statistics: Measures of Dispersion 61
Marks (X)
No. of Students (f)
(X-35)=x
fx2
5 15 25 35 45 55
10 20 30 50 40 30
-30 -20 -10 0
10 20
9000 8000 3000
0 4000
12000
N=180 ∑fx2
=36000
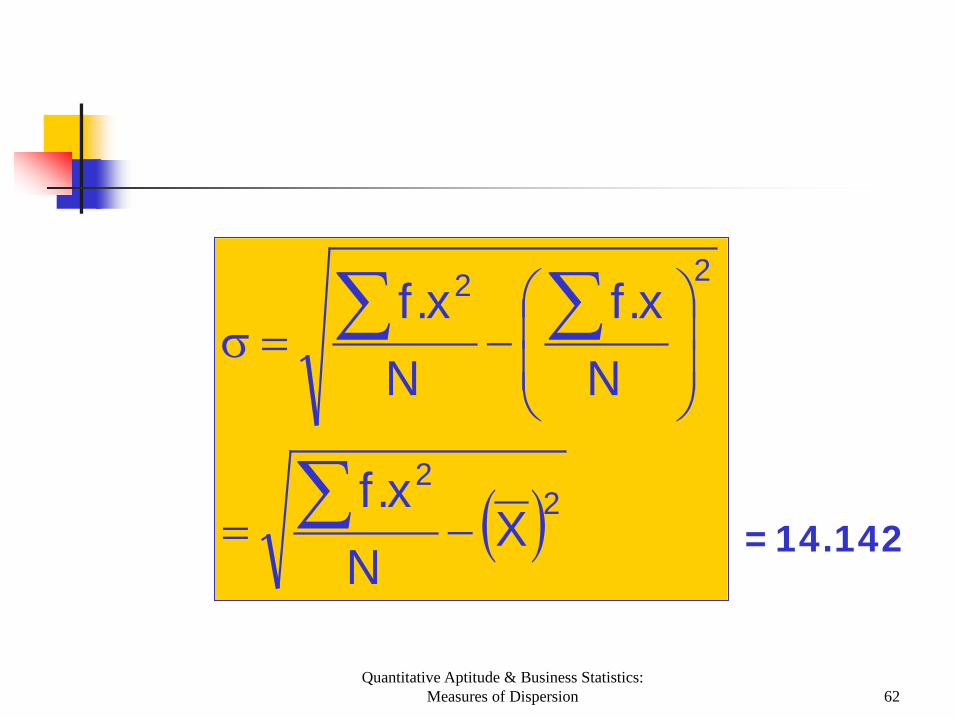
Quantitative Aptitude & Business Statistics: Measures of Dispersion 62
( )22
22
XN
x.f
Nx.f
Nx.f
−=
−=σ
∑
∑∑
=14.142
Quantitative Aptitude & Business Statistics: Measures of Dispersion 63
Properties of Standard Deviation
Independent of change of origin Not independent of change of Scale. Fixed Relationship among measures
of Dispersion.

Quantitative Aptitude & Business Statistics: Measures of Dispersion 64
σ=
σ=
54MD
32QD
Thus SD is never less than QD and MD
In a normal distribution there is fixed relationship
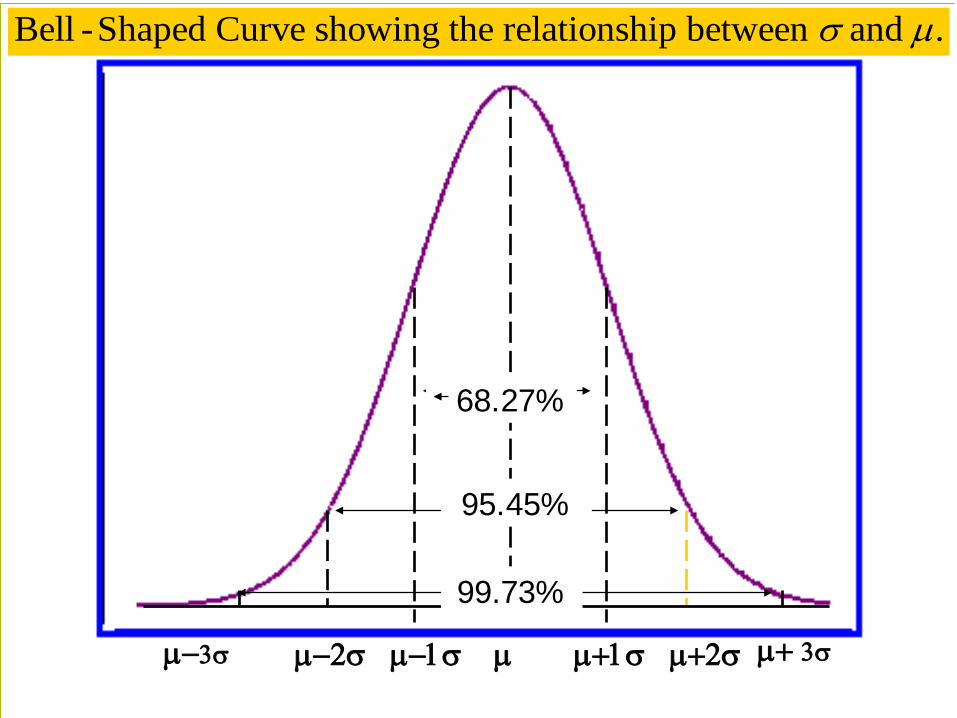
Quantitative Aptitude & Business Statistics: Measures of Dispersion 65
µ−3σ µ−2σ µ−1σ µ µ+1σ µ+2σ µ+ 3σ
Bell -Shaped Curve showing the relationship between and .σ µ
68.27%
95.45%
99.73%
Quantitative Aptitude & Business Statistics: Measures of Dispersion 66
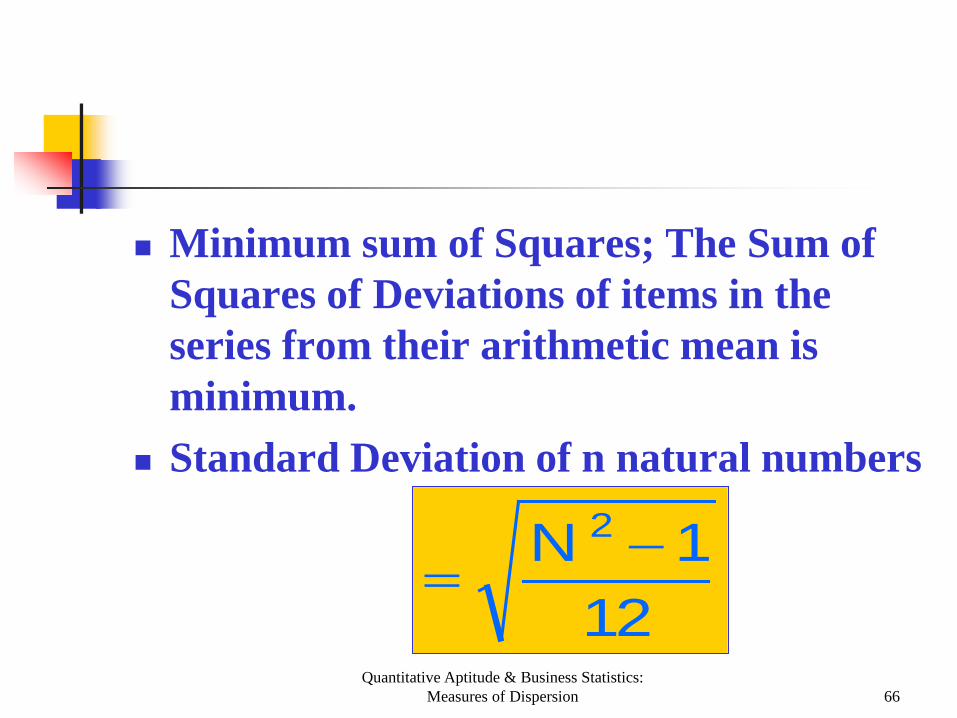
Minimum sum of Squares; The Sum of Squares of Deviations of items in the series from their arithmetic mean is minimum.
Standard Deviation of n natural numbers
121N 2 −
=
Quantitative Aptitude & Business Statistics: Measures of Dispersion 67
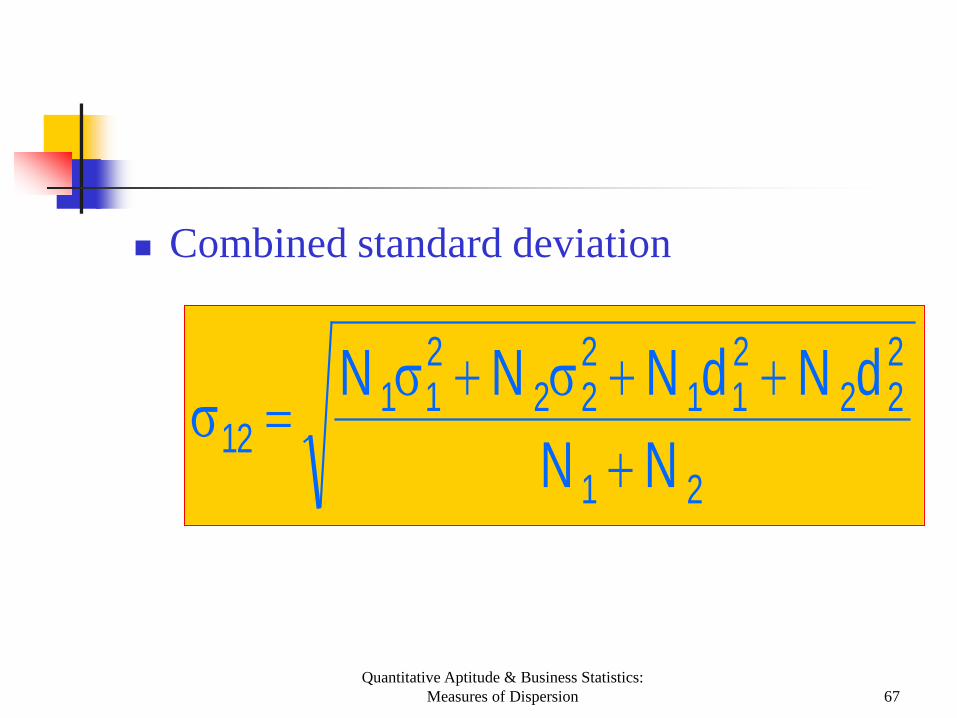
Combined standard deviation
21
222
211
222
211
12 NNdNdNNN
+++σ+σ
=σ
Quantitative Aptitude & Business Statistics: Measures of Dispersion 68
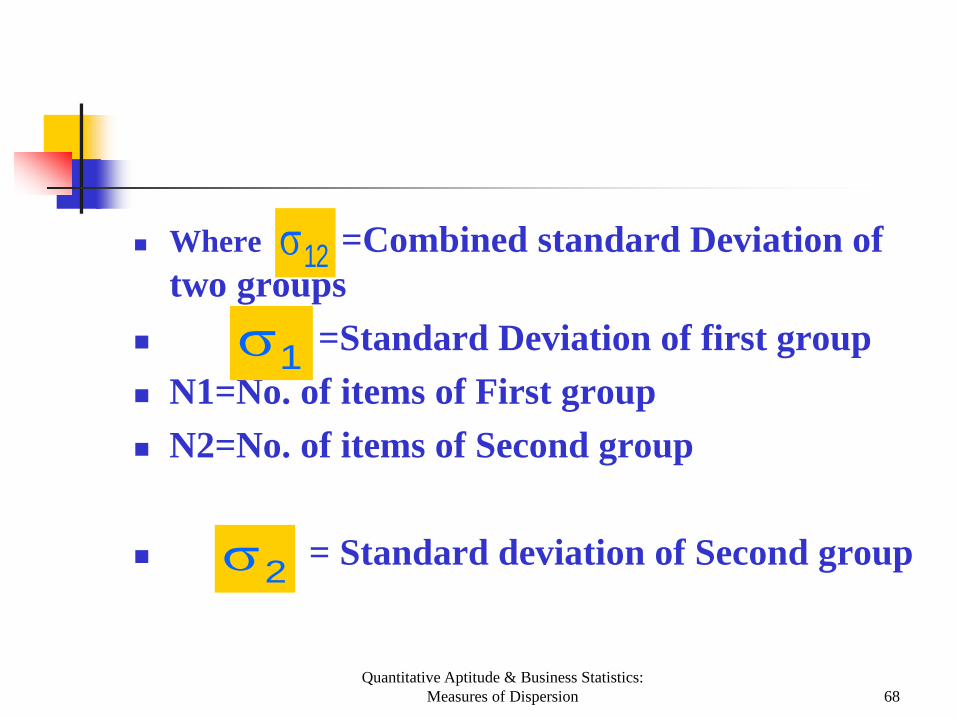
Where =Combined standard Deviation of two groups
=Standard Deviation of first group N1=No. of items of First group N2=No. of items of Second group
= Standard deviation of Second group
12σ
2σ
1σ

Quantitative Aptitude & Business Statistics: Measures of Dispersion 69
1211 XXd −=
1222 XXd −=Where is the combined mean of two groups
12X

Quantitative Aptitude & Business Statistics: Measures of Dispersion 70
Merits of Standard Deviation
It is based on all the items of the distribution.
it is a meanable to algebraic treatment since actual + or – signs deviations are taken into consideration.
It is least affected by fluctuations of sampling
Quantitative Aptitude & Business Statistics: Measures of Dispersion 71
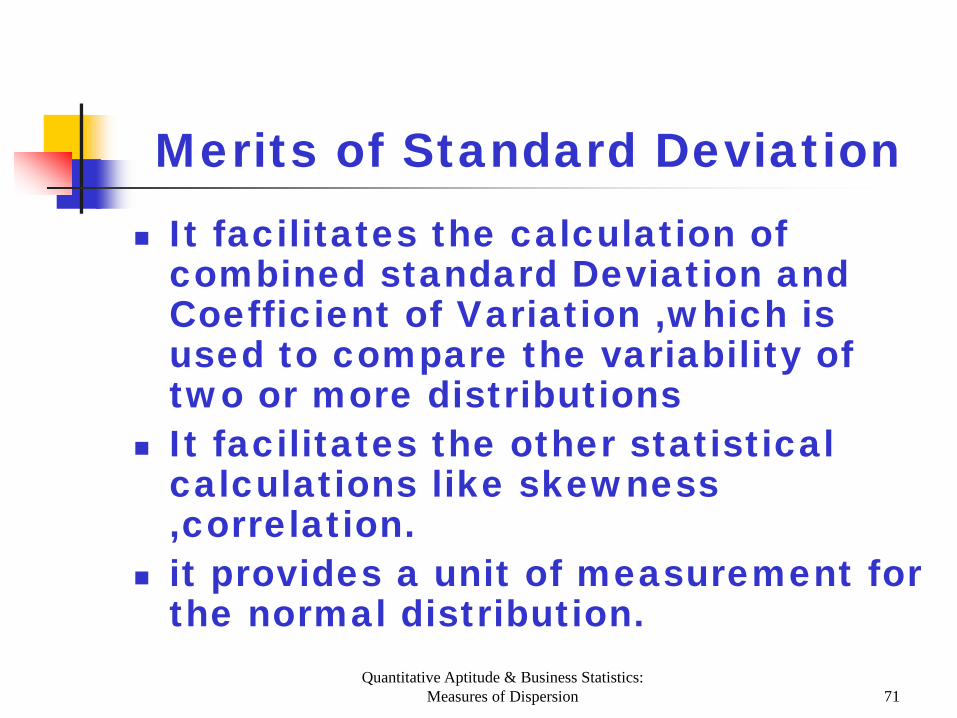
Merits of Standard Deviation It facilitates the calculation of
combined standard Deviation and Coefficient of Variation ,which is used to compare the variability of two or more distributions
It facilitates the other statistical calculations like skewness ,correlation.
it provides a unit of measurement for the normal distribution.
Quantitative Aptitude & Business Statistics: Measures of Dispersion 72
Limitations of Standard Deviation
It can’t be used for comparing the variability of two or more series of observations given in different units. A coefficient of Standard deviation is to be calculated for this purpose.
It is difficult to compute and compared
Quantitative Aptitude & Business Statistics: Measures of Dispersion 73
Limitations of Standard Deviation
It is very much affected by the extreme values.
The standard deviation can not be computed for a distribution with open-end classes.
Quantitative Aptitude & Business Statistics: Measures of Dispersion 74
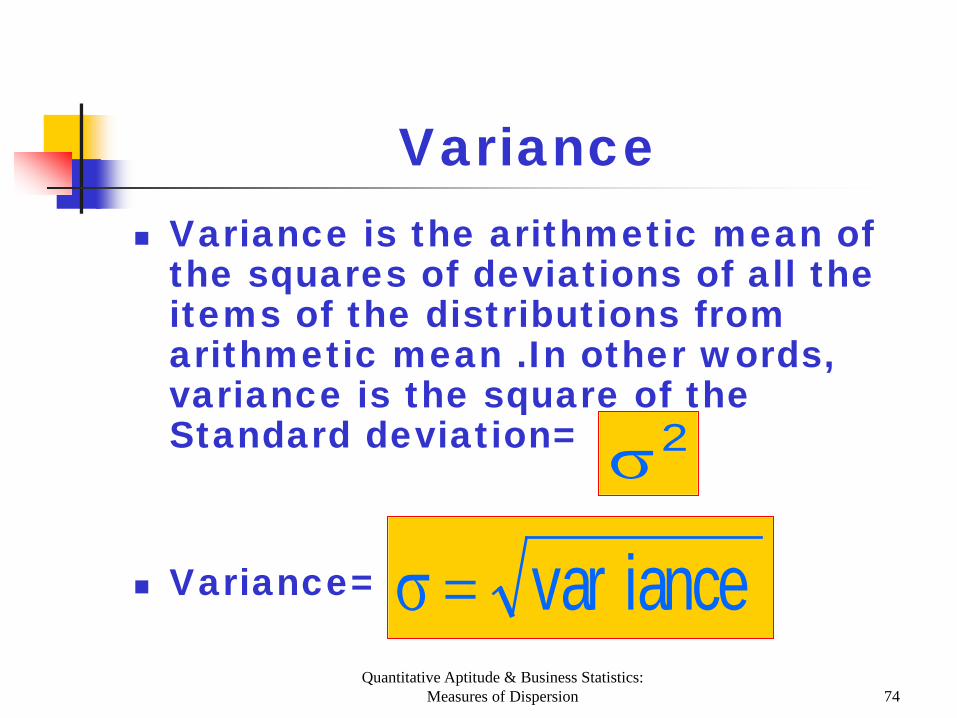
Variance Variance is the arithmetic mean of
the squares of deviations of all the items of the distributions from arithmetic mean .In other words, variance is the square of the Standard deviation=
Variance=
2σ
iancevar=σ

Quantitative Aptitude & Business Statistics: Measures of Dispersion 75
Interpretation of Variance
Smaller the variance ,greater the uniformity in population.
Larger the variance ,greater the variability

Quantitative Aptitude & Business Statistics: Measures of Dispersion 76
The Coefficient of Variation
The coefficient of variation is a measure of relative variability It is used to measure the
changes that have taken place in a population over time
Quantitative Aptitude & Business Statistics: Measures of Dispersion 77
To compare the variability of two populations that are expressed in different units of measurement
It is expressed as a percentage
Quantitative Aptitude & Business Statistics: Measures of Dispersion 78
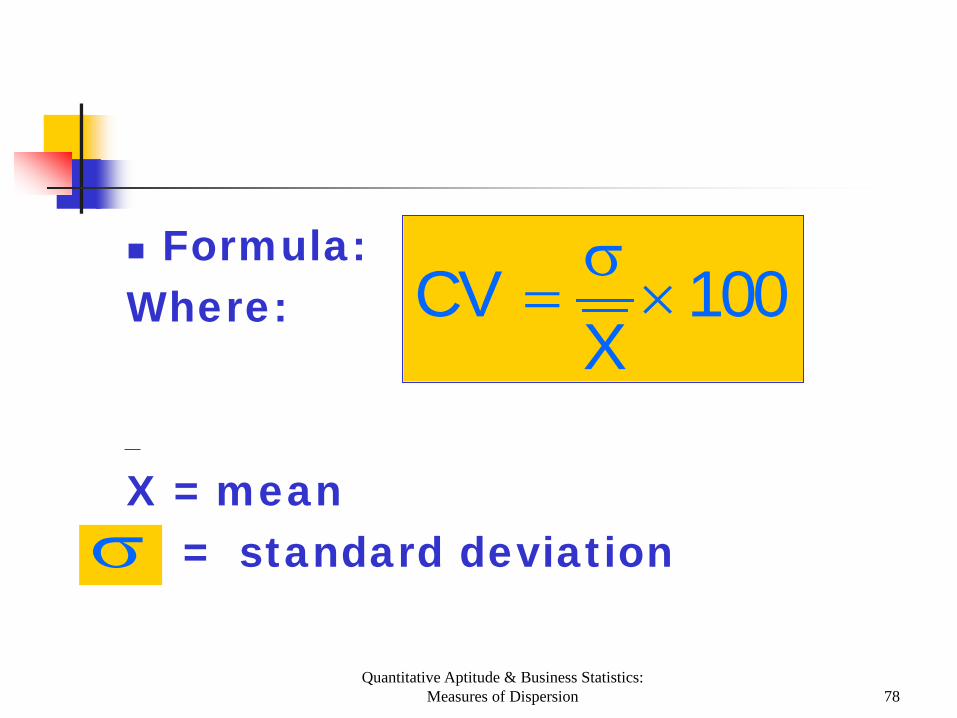
Formula: Where: X = mean = standard deviation
100X
CV ×σ
=
σ
Quantitative Aptitude & Business Statistics: Measures of Dispersion 79
1. Dispersion measures (a) The scatter ness of a set of
observations (b) The concentration of set of
observations ( c) The Peaked ness of distribution (d) None
Quantitative Aptitude & Business Statistics: Measures of Dispersion 80
1. Dispersion measures (a) The scatter ness of a set of
observations (b) The concentration of set of
observations ( c) The Peaked ness of distribution (d) None
Quantitative Aptitude & Business Statistics: Measures of Dispersion 81
2. Which one is an absolute measure of Dispersion?
(a) Range (b) Mean Deviation ( c) Quartile Deviation ( d) all these measures
Quantitative Aptitude & Business Statistics: Measures of Dispersion 82
2. Which one is an absolute measure of Dispersion?
(a) Range (b) Mean Deviation ( c) Quartile Deviation ( d) all these measures
Quantitative Aptitude & Business Statistics: Measures of Dispersion 83
3.Which measures of Dispersion is not affected by the presence of extreme observations
(a) deviation (b) Quartile Deviation (C) Mean Deviation (d) Range
Quantitative Aptitude & Business Statistics: Measures of Dispersion 84
3.Which measures of Dispersion is not affected by the presence of extreme observations
(a) deviation (b) Quartile Deviation (C) Mean Deviation (d) Range

Quantitative Aptitude & Business Statistics: Measures of Dispersion 85
3.Which measures of Dispersion is not affected by the presence of extreme observations
(a) deviation (b) Quartile Deviation (C) Mean Deviation (d) Range
Quantitative Aptitude & Business Statistics: Measures of Dispersion 86
4.which measures of Dispersion is based on all the items of observations
(a) Mean Deviation (b) Standard Deviation (C) Quartile Deviation (d) a and b but not c
Quantitative Aptitude & Business Statistics: Measures of Dispersion 87
4.which measures of Dispersion is based on all the items of observations
(a) Mean Deviation (b) Standard Deviation (C) Quartile Deviation (d) a and b but not c
Quantitative Aptitude & Business Statistics: Measures of Dispersion 88
5.Standard Deviation is (a) absolute measure (b) relative measure (c) both (d) none
Quantitative Aptitude & Business Statistics: Measures of Dispersion 89
5.Standard Deviation is (a) absolute measure (b) relative measure (c) both (d) none
Quantitative Aptitude & Business Statistics: Measures of Dispersion 90
6.Coefficient of standard deviation is (a) SD/mean (b) SD/Median (c) SD/Mode (d) Mean/SD
Quantitative Aptitude & Business Statistics: Measures of Dispersion 91
6.Coefficient of standard deviation is (a) SD/mean (b) SD/Median (c) SD/Mode (d) Mean/SD
Quantitative Aptitude & Business Statistics: Measures of Dispersion 92
7.Coefficient of Quartile Deviation is calculated by formula
(a)(Q3-Q1)/4 (b) (Q3-Q1)/2 (c) (Q3-Q1)/(Q3+Q1) (d) (Q3+Q1)/(Q3-Q1
Quantitative Aptitude & Business Statistics: Measures of Dispersion 93
7.Coefficient of Quartile Deviation is calculated by formula
(a)(Q3-Q1)/4 (b) (Q3-Q1)/2 (c) (Q3-Q1)/(Q3+Q1) (d) (Q3+Q1)/(Q3-Q1

Quantitative Aptitude & Business Statistics: Measures of Dispersion 94
8.The standard Deviation of 5,8,5,5,5,8and 8 is
(a) 4 (b) 6 (C) 3 (d) 0
Quantitative Aptitude & Business Statistics: Measures of Dispersion 95
8.The standard Deviation of 5,8,5,5,5,8and 8 is
(a) 4 (b) 6 (C) 3 (d) 0
Quantitative Aptitude & Business Statistics: Measures of Dispersion 96
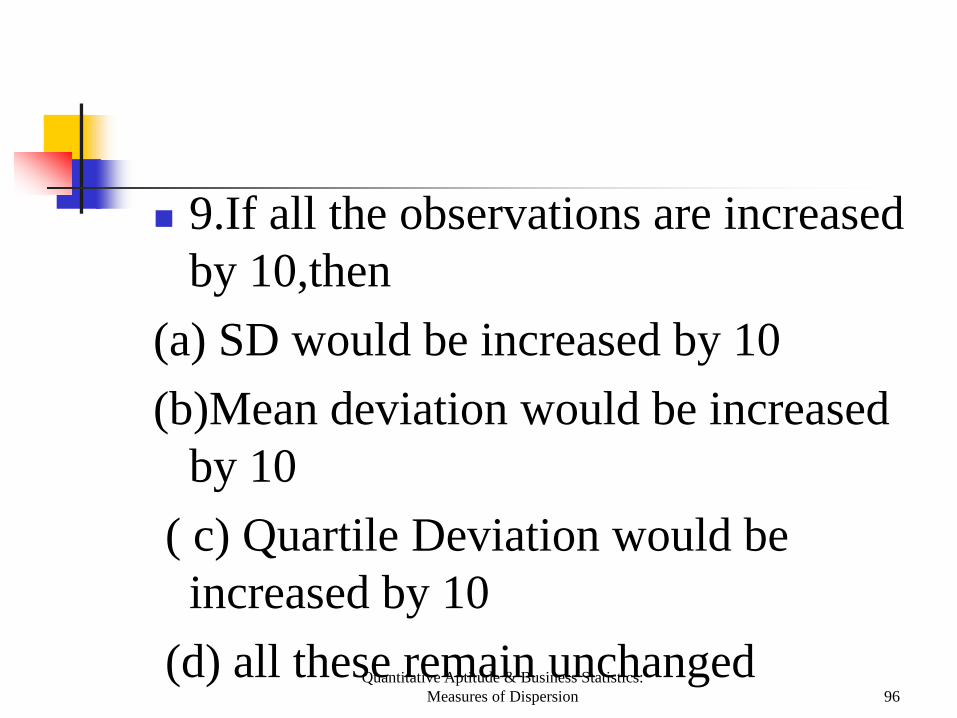
9.If all the observations are increased by 10,then
(a) SD would be increased by 10 (b)Mean deviation would be increased
by 10 ( c) Quartile Deviation would be
increased by 10 (d) all these remain unchanged
Quantitative Aptitude & Business Statistics: Measures of Dispersion 97
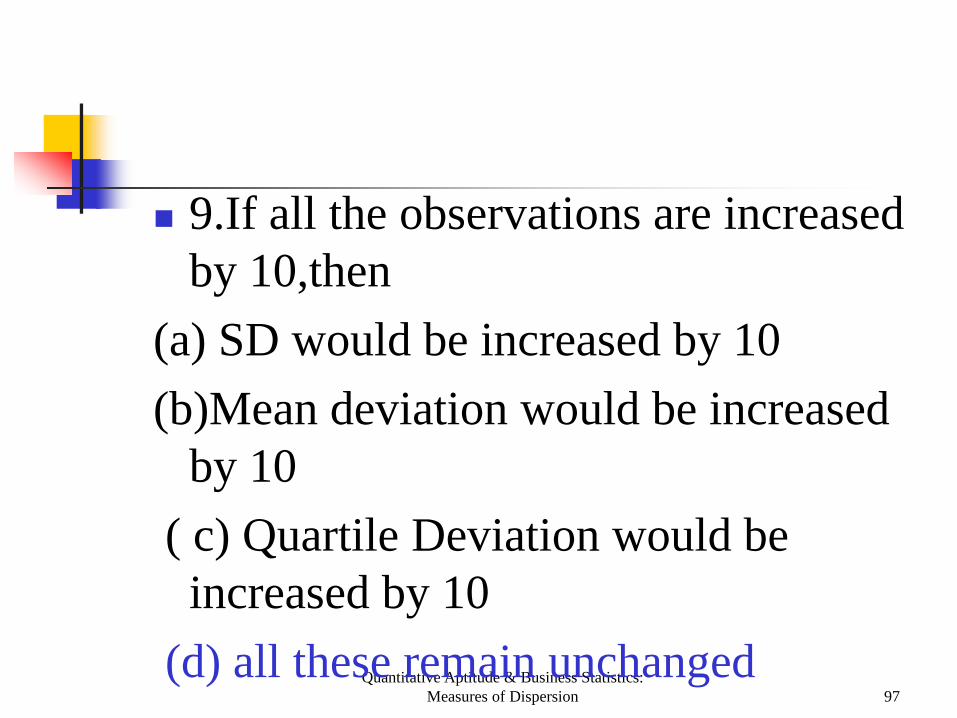
9.If all the observations are increased by 10,then
(a) SD would be increased by 10 (b)Mean deviation would be increased
by 10 ( c) Quartile Deviation would be
increased by 10 (d) all these remain unchanged

Quantitative Aptitude & Business Statistics: Measures of Dispersion 98
10.For any two numbers SD is always (a) Twice the range (b) Half of the range © Square of range (d) none of these

Quantitative Aptitude & Business Statistics: Measures of Dispersion 99
10.For any two numbers SD is always (a) Twice the range (b) Half of the range © Square of range (d) none of these

Quantitative Aptitude & Business Statistics: Measures of Dispersion 100
11Mean deviation is minimum when deviations are taken about
(a) Arithmetic Mean (b) Geometric Mean © Harmonic Mean (d) Median
Quantitative Aptitude & Business Statistics: Measures of Dispersion 101
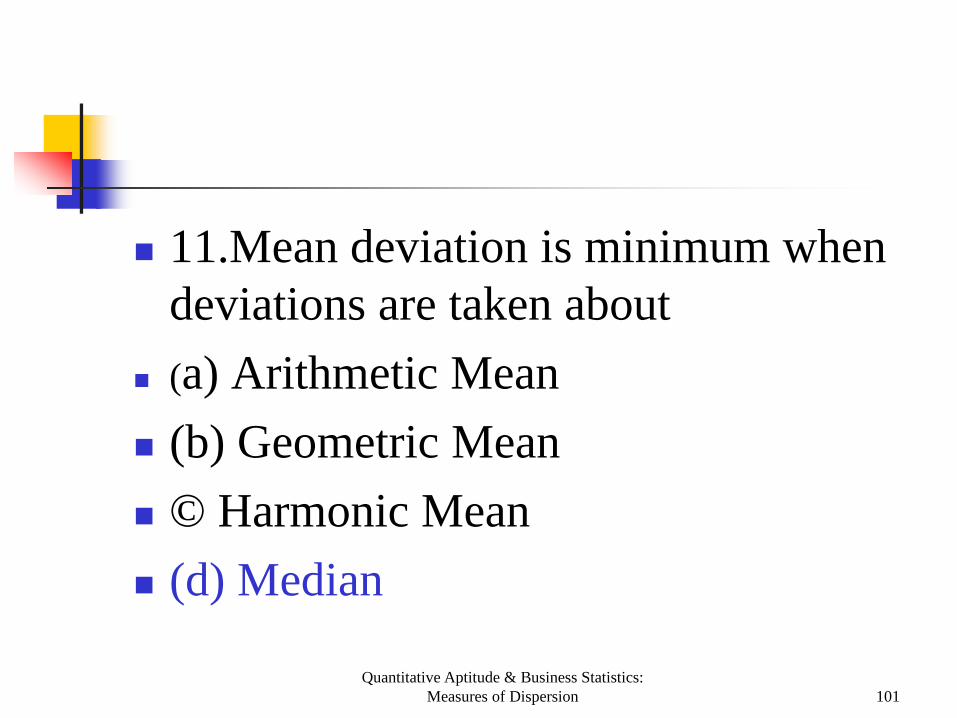
11.Mean deviation is minimum when deviations are taken about
(a) Arithmetic Mean (b) Geometric Mean © Harmonic Mean (d) Median

Quantitative Aptitude & Business Statistics: Measures of Dispersion 102
12.Root mean square deviation is (a) Standard Deviation (b) Quartile Deviation © both (d) none

Quantitative Aptitude & Business Statistics: Measures of Dispersion 103
12.Root mean square deviation from mean is
(a) Standard Deviation (b) Quartile Deviation © both (d) none
Quantitative Aptitude & Business Statistics: Measures of Dispersion 104
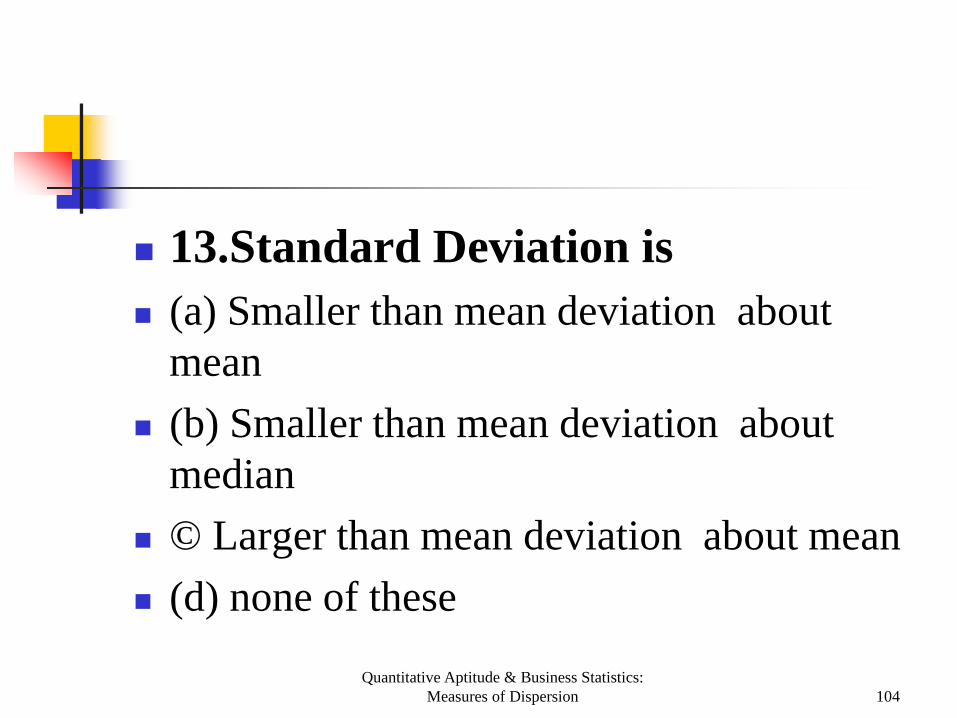
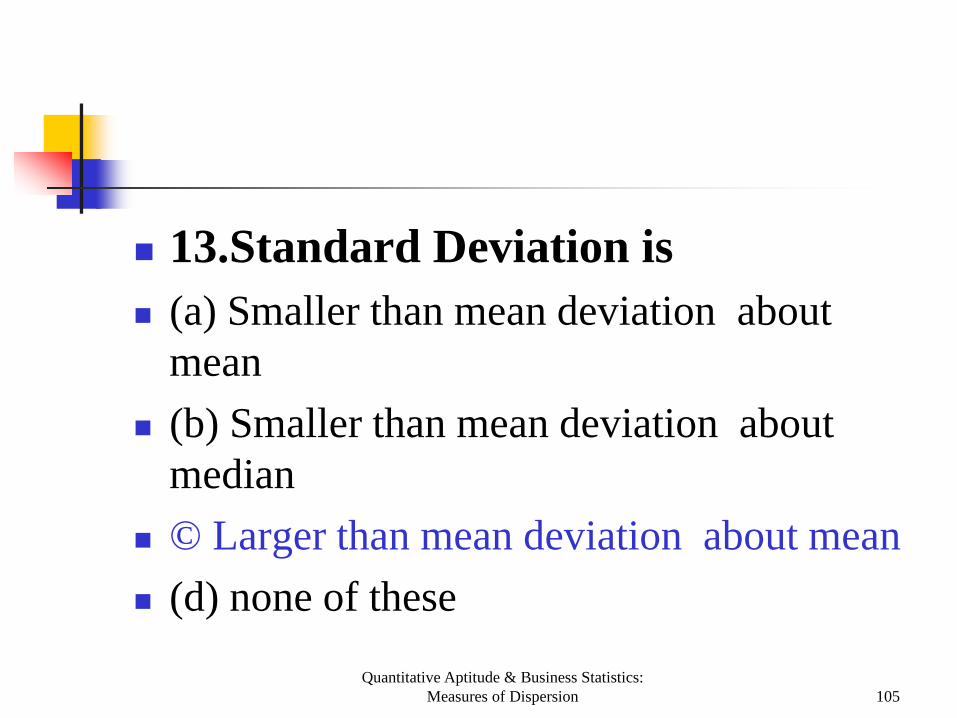
13.Standard Deviation is (a) Smaller than mean deviation about
mean (b) Smaller than mean deviation about
median © Larger than mean deviation about mean (d) none of these
Quantitative Aptitude & Business Statistics: Measures of Dispersion 105
13.Standard Deviation is (a) Smaller than mean deviation about
mean (b) Smaller than mean deviation about
median © Larger than mean deviation about mean (d) none of these
Quantitative Aptitude & Business Statistics: Measures of Dispersion 106
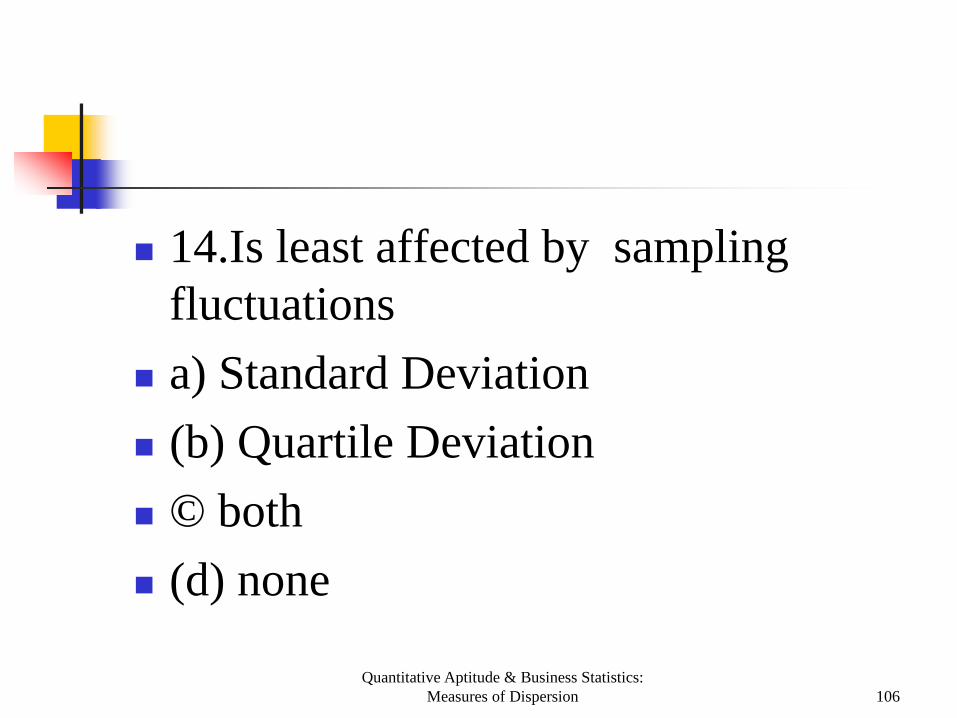
14.Is least affected by sampling fluctuations
a) Standard Deviation (b) Quartile Deviation © both (d) none
Quantitative Aptitude & Business Statistics: Measures of Dispersion 107
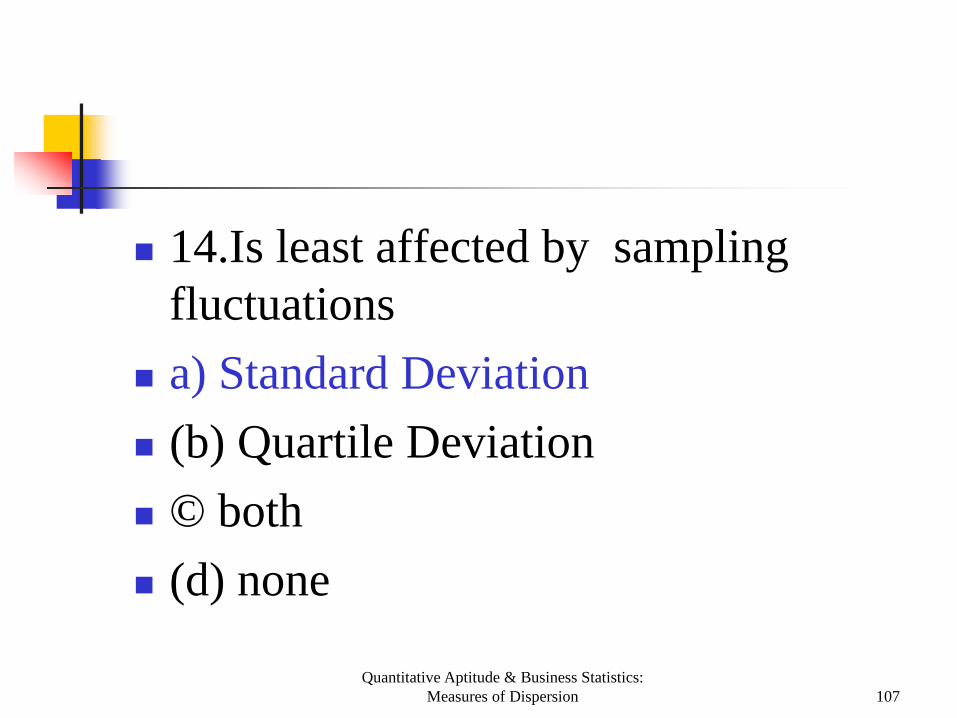
14.Is least affected by sampling fluctuations
a) Standard Deviation (b) Quartile Deviation © both (d) none

Quantitative Aptitude & Business Statistics: Measures of Dispersion 108
15. Coefficient of variation of two series is 60% and 80% respectively. Their standard deviations are 20 and 16 respectively, what is their A.M
A) 15 and 20 B) 33.3 and 20 C) 33.3 and 15 D) 12 and 12.8

Quantitative Aptitude & Business Statistics: Measures of Dispersion 109
15. Coefficient of variation of two series is 60% and 80% respectively. Their standard deviations are 20 and 16 respectively, what is their A.M
A) 15 and 20 B) 33.3 and 20 C) 33.3 and 15 D) 12 and 12.8
Quantitative Aptitude & Business Statistics: Measures of Dispersion 110
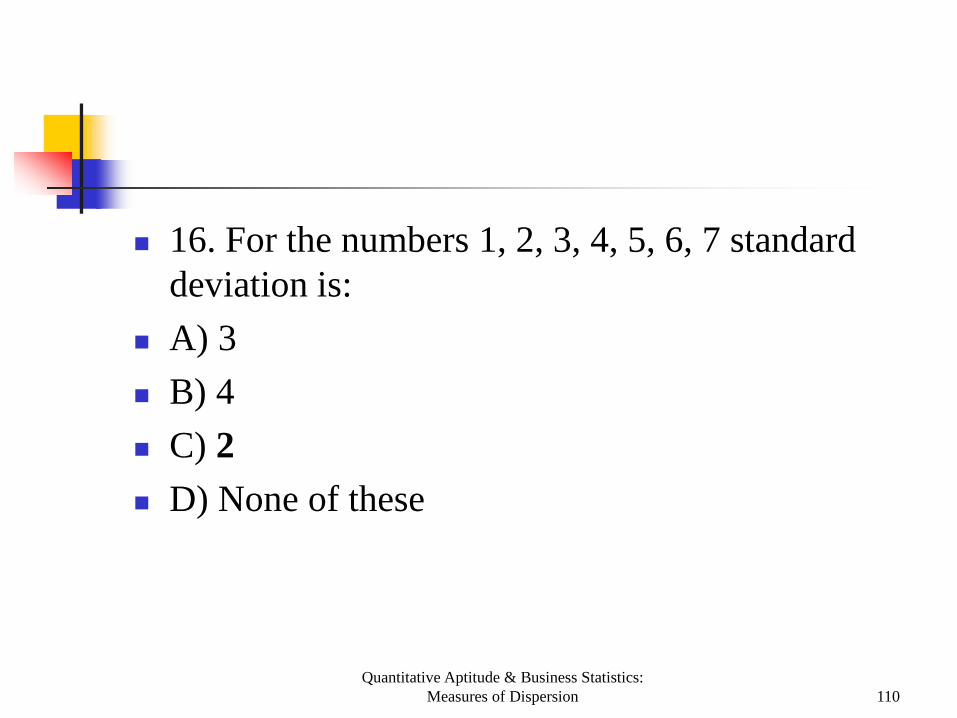
16. For the numbers 1, 2, 3, 4, 5, 6, 7 standard deviation is:
A) 3 B) 4 C) 2 D) None of these

Quantitative Aptitude & Business Statistics: Measures of Dispersion 111
16. For the numbers 1, 2, 3, 4, 5, 6, 7 standard deviation is:
A) 3 B) 4 C) 2 D) None of these
THE END
Measures of Dispersion