measures of dispersion 9/24/2013. readings chapter 2 measuring and describing variables (pollock)...
TRANSCRIPT
Measures of Dispersion
9/24/2013
Readings
• Chapter 2 Measuring and Describing Variables (Pollock) (pp.37-44)
• Chapter 6. Foundations of Statistical Inference (128-133) (Pollock)
• Chapter 3 Transforming Variables (Pollock Workbook)

OPPORTUNITIES TO DISCUSS COURSE CONTENT

Office Hours For the Week
• When– Wednesday 10-12– Thursday 8-12– And by appointment
• You will get your exams back on Thursday
• Homework, now due on October 3rd
Course Learning Objectives
1. Students will learn the basics of research design and be able to critically analyze the advantages and disadvantages of different types of design.
2. Students Will be able to interpret and explain empirical data.
DESCRIPTIVE STATISTICS
Descriptive Statistics
• These simply describe the attributes of a single variable.
• You cannot test here (you need two variables)
• Why do them?

Categories of Descriptive Statistics
Measures of Central Tendency• The most common, the
middle, the average
• Mean, Median and Mode
Measures of Dispersion• How wide is our range of
data, how close to the middle are the values distributed
• Range, Variance, Standard Deviation

FREQUENCY DISTRIBUTIONS
To Run A Frequency Distribution
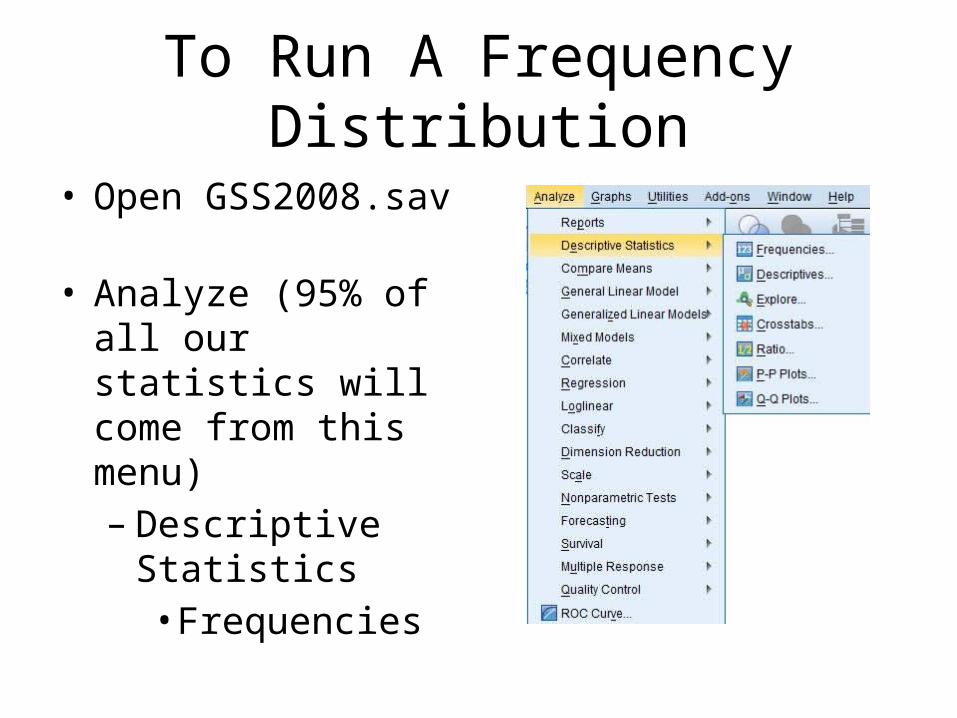
• Open GSS2008.sav
• Analyze (95% of all our statistics will come from this menu)– Descriptive Statistics• Frequencies
Step 2
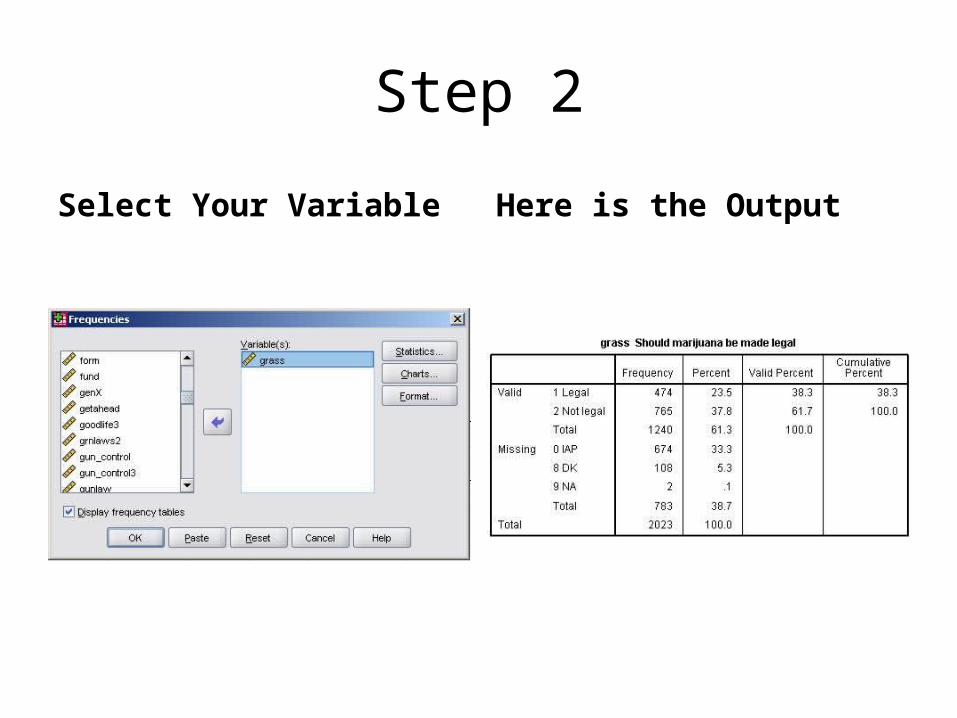
Select Your Variable Here is the Output

Interpreting the Results• Percent- relative
frequency for all cases
• Valid Percent- relative frequency for valid cases (This excludes missing values).
• Cumulative Percent- %of observations less than or equal to the category
What is the Mode (#, cat)?
What is the median (#, cat?)

MEASURES OF CENTRAL TENDENCY
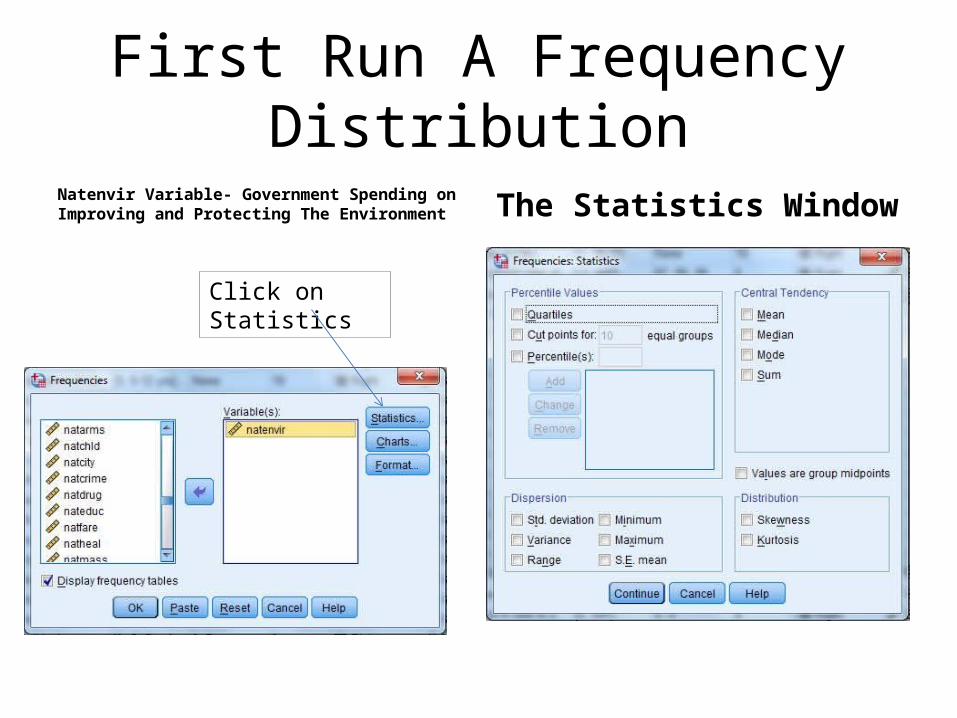
First Run A Frequency DistributionNatenvir Variable- Government Spending on Improving and Protecting The Environment The Statistics Window
Click on Statistics
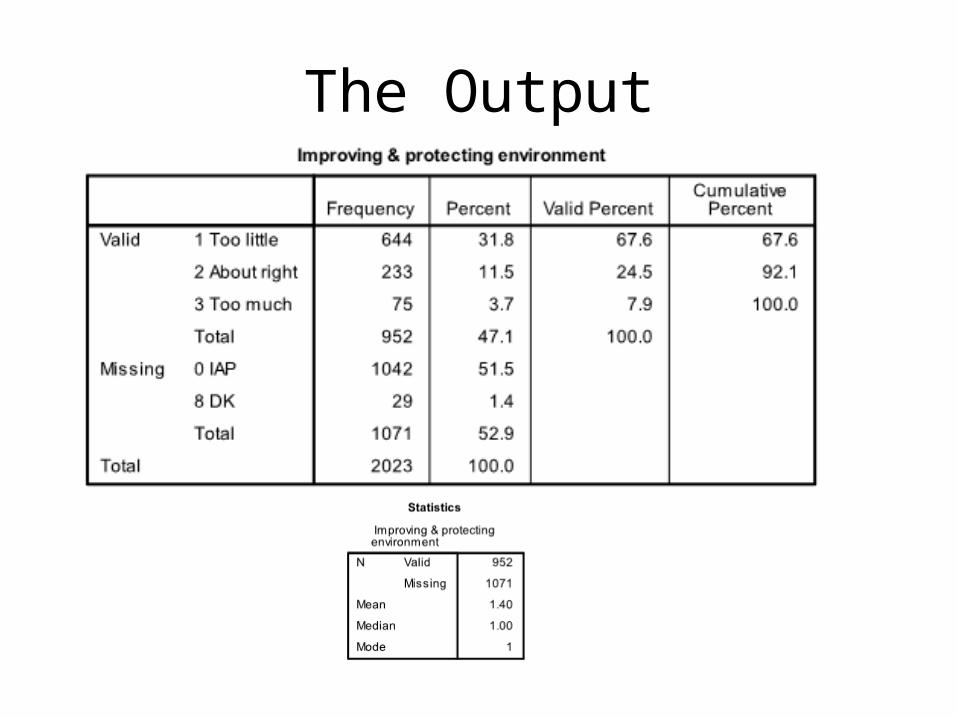
The Output
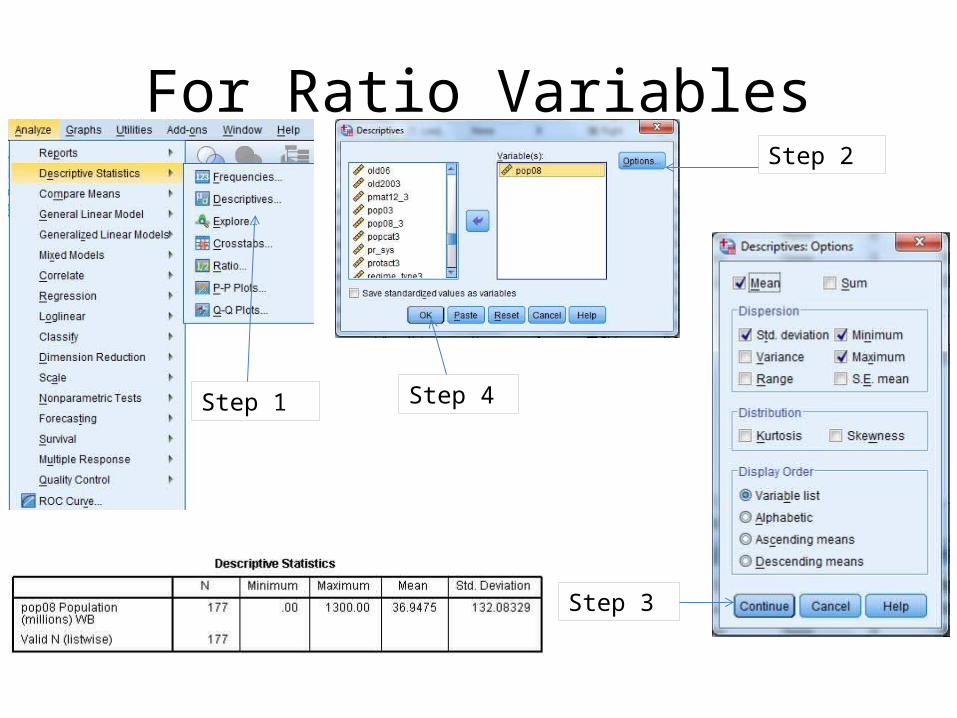
For Ratio Variables
Step 1
Step 2
Step 3
Step 4
CASE SUMMARIES
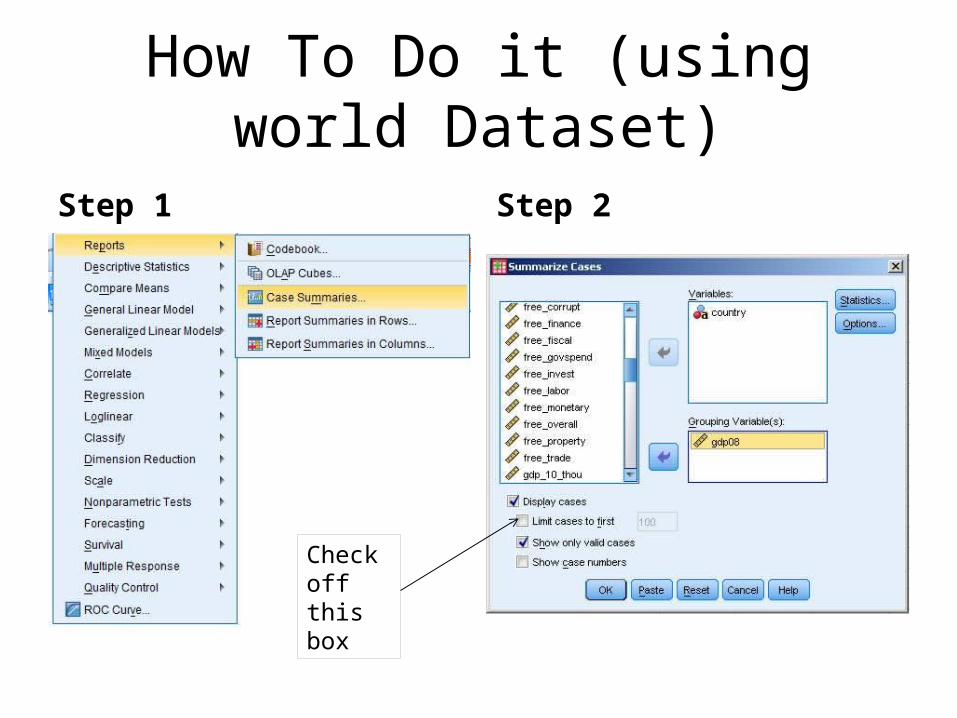
How To Do it (using world Dataset)
Step 1 Step 2
Check off this box
MEASURES OF DISPERISON
What are They?
• these measure the uniformity of the data
• they measure how closely or widely cases are separated on a variable.
The Range
• The Simplest Measure of Dispersion
– Max
– Min
• Range= max-min (only fun for ratio variables)
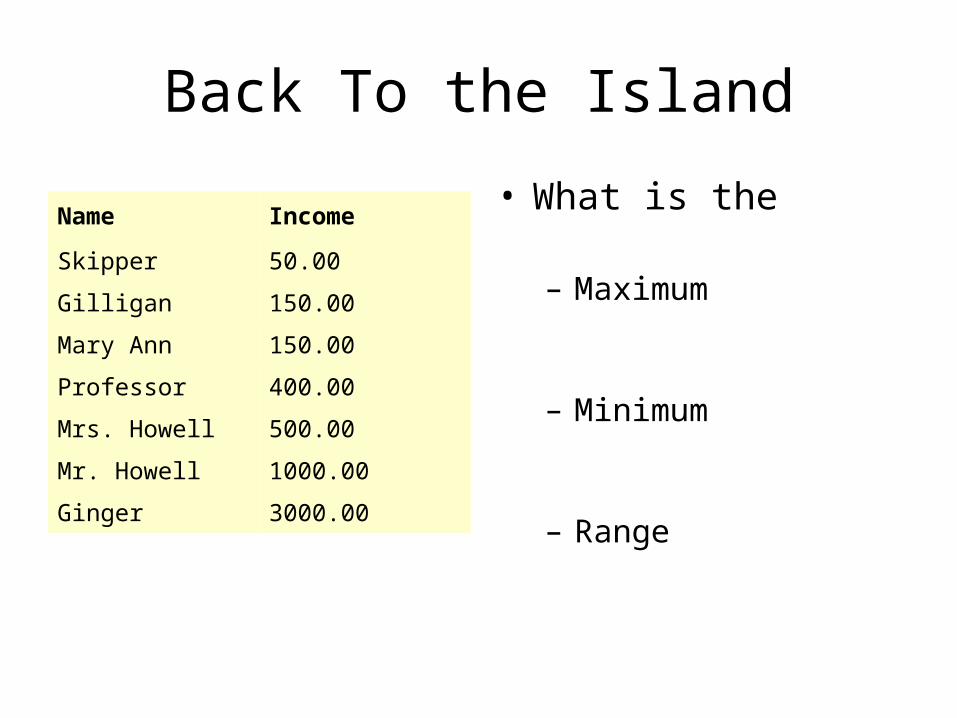
Back To the Island
Name Income
Skipper 50.00
Gilligan 150.00
Mary Ann 150.00
Professor 400.00
Mrs. Howell 500.00
Mr. Howell 1000.00
Ginger 3000.00
• What is the
– Maximum
– Minimum
– Range
High Vs. Low Dispersion
• Polarized
• Clustered

High Dispersion
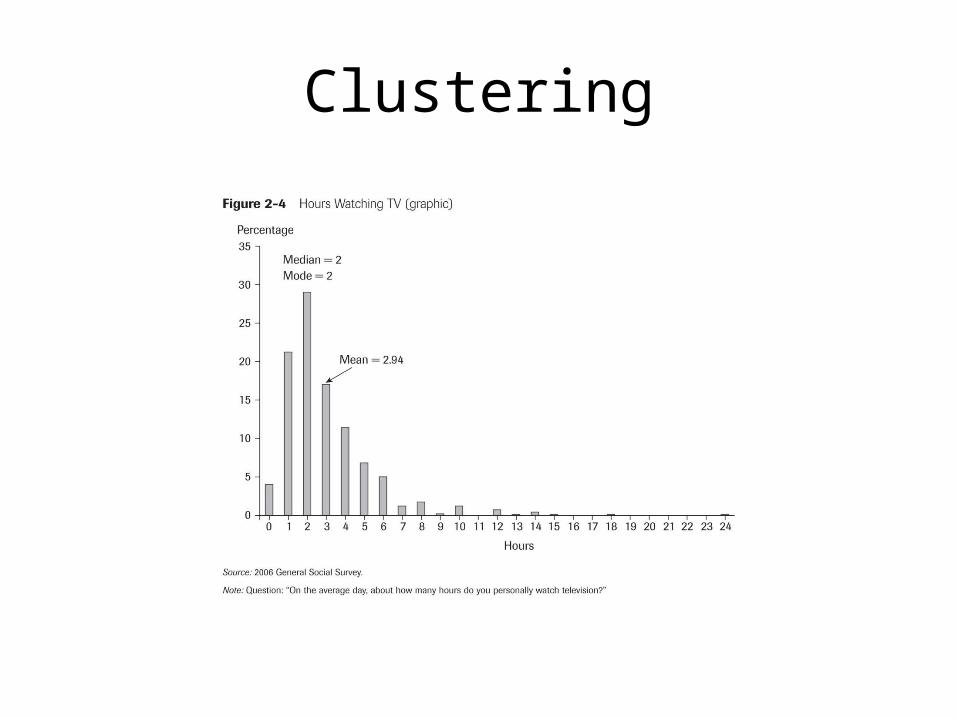
Clustering
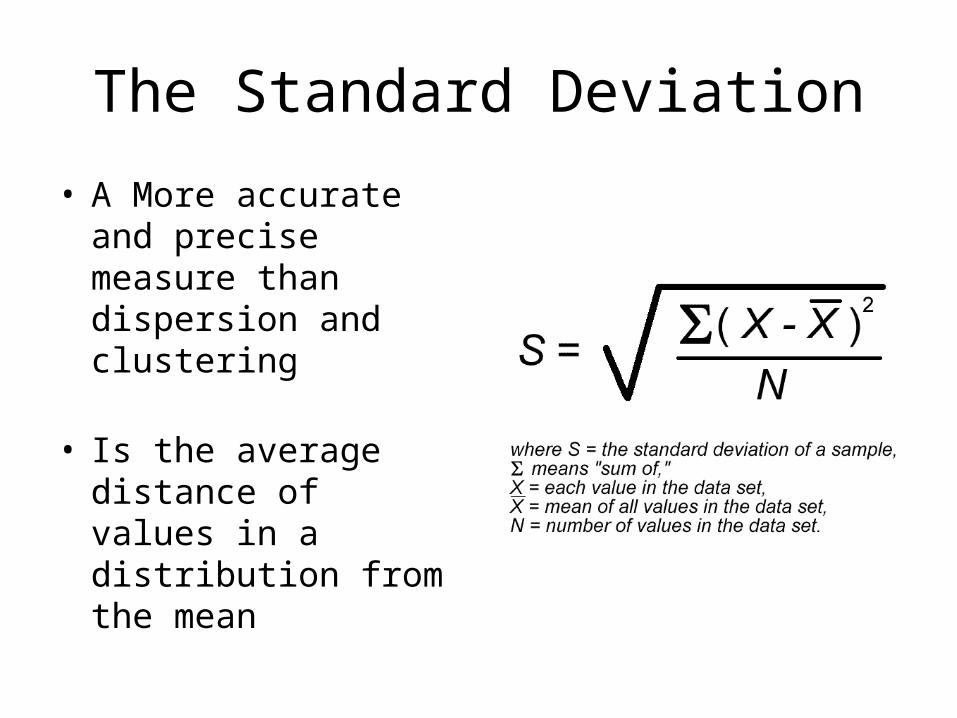
The Standard Deviation
• A More accurate and precise measure than dispersion and clustering
• Is the average distance of values in a distribution from the mean

What it tells us
• When the value of the standard deviation is small, values are clustered around the mean.
• When the value of the standard deviation is high, values are spread far away from the mean.


From 2008
Who was more divisive?
About the Standard Deviation
• its based on the mean
• the larger the standard deviation, the more spread out the values are and the more different they are
• if the standard deviation =0 it means there is no variability in the scores. They are all identical.
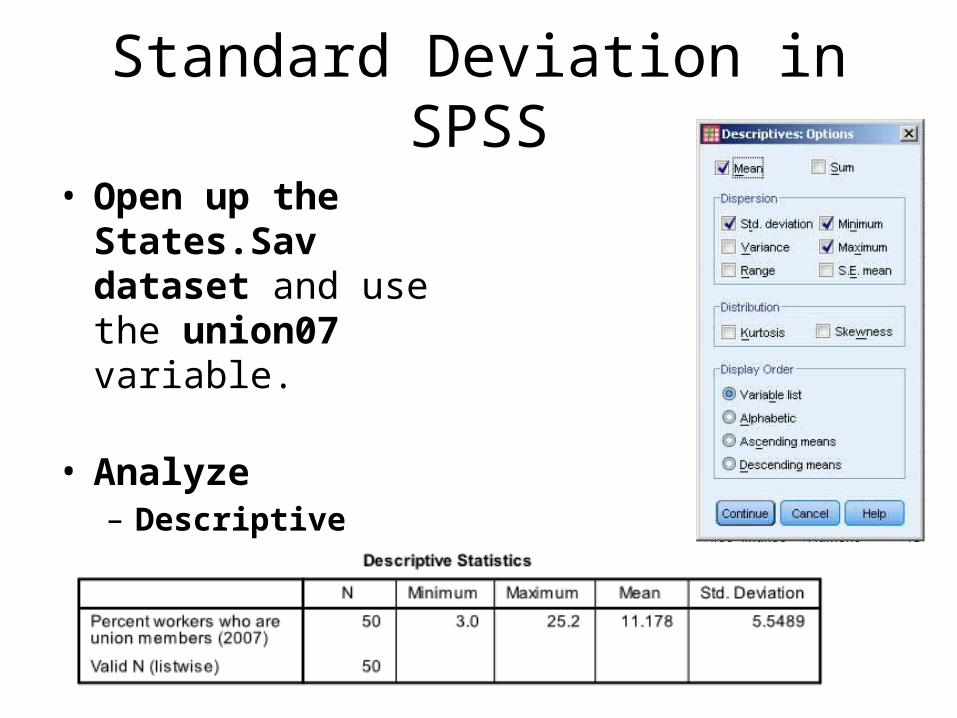
Standard Deviation in SPSS
• Open up the States.Sav dataset and use the union07 variable.
• Analyze – Descriptive Statistics
• Descriptives – Select your options
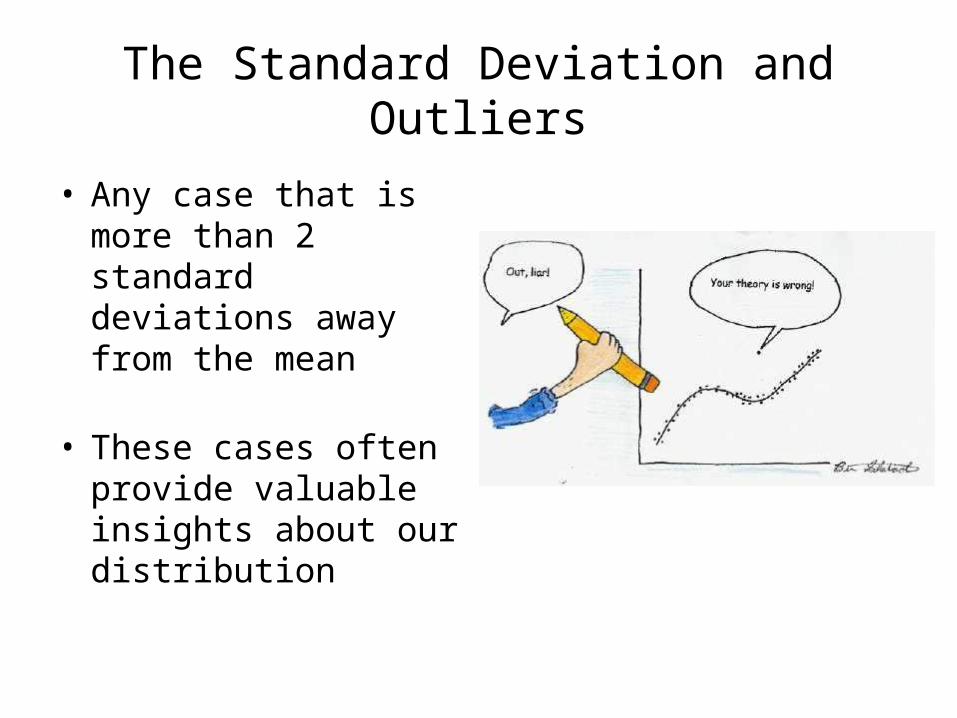
The Standard Deviation and Outliers
• Any case that is more than 2 standard deviations away from the mean
• These cases often provide valuable insights about our distribution

If you find this amusing or annoying, you get the concept

2011 Baseball Salaries
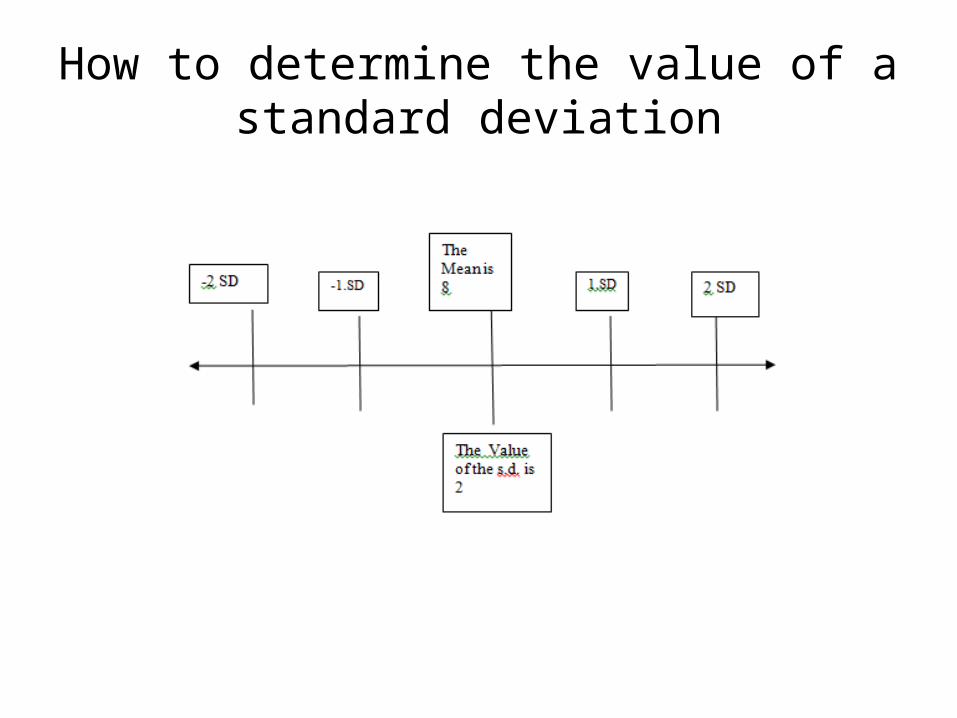
How to determine the value of a standard deviation

How to determine the value of a standard deviation
• The value of +/- 1 s.d. = mean + value of s.d – e.g. if the mean is 8 and the s.d is 2, the value of -1
s.d's is 6, and + 1 s.d.'s is 10
• The value of +/- 2 s.d. = mean + (value of s.d. *2) – e.g. if the mean is 8 and the s.d is 2, the value of -2
s.d's is 4, and + 2 s.d.'s is 12
• Any value in the distribution lower than 4 and higher than 12 is an outlier

ECU Pirates
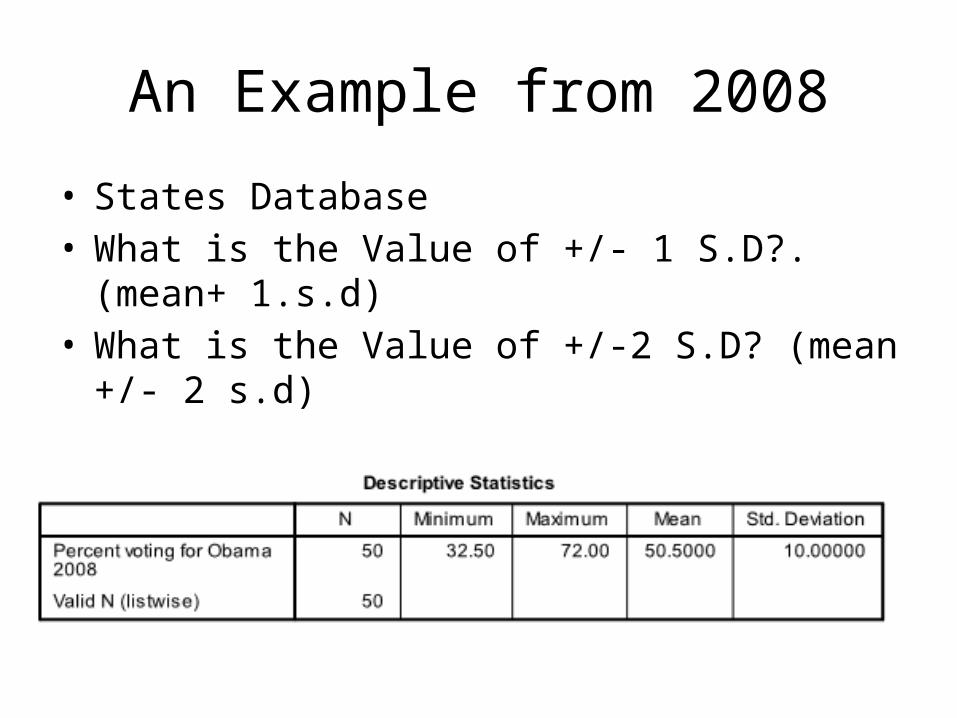
An Example from 2008
• States Database• What is the Value of +/- 1 S.D?. (mean+ 1.s.d) • What is the Value of +/-2 S.D? (mean +/- 2 s.d)

Unwrapping The Results
• Which are Outliers• How did that shape the 2012 campaign
THE NORMAL CURVE

Different Kinds of Curves
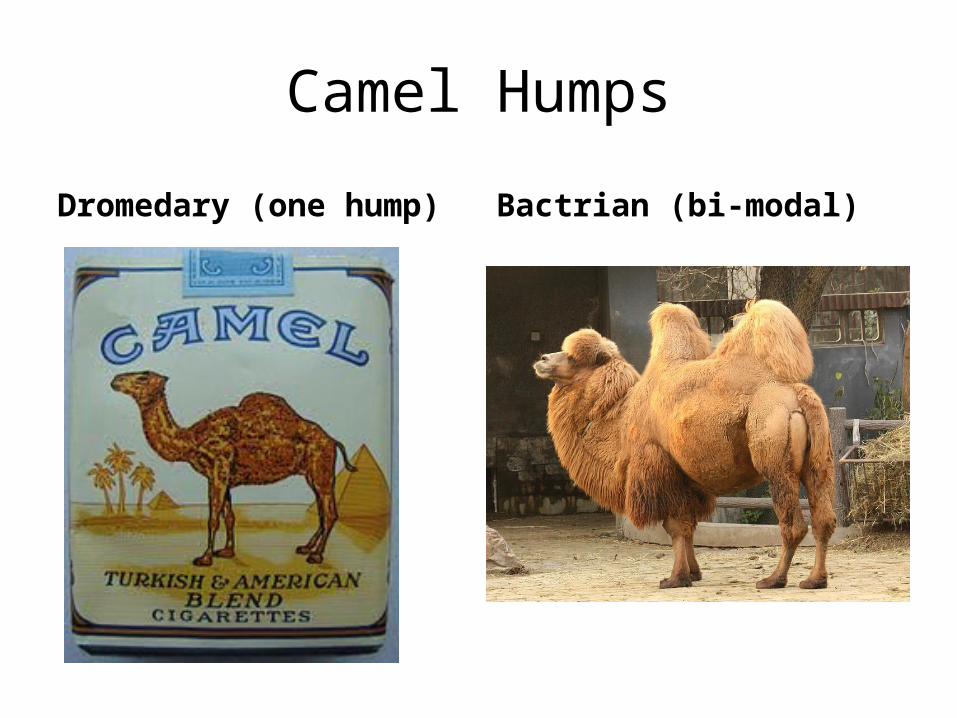
Camel Humps
Dromedary (one hump) Bactrian (bi-modal)
The Normal/Bell Shaped curve
• Symmetrical around the mean
• It has 1 hump, it is located in the middle, so the mean, median, and mode are all the same!
Why we use the normal curve
• To determine skewness
• The Normal Distribution curve is the basis for significance testing
Testing
• Causality
• Statistical Significance
• Practical Significance
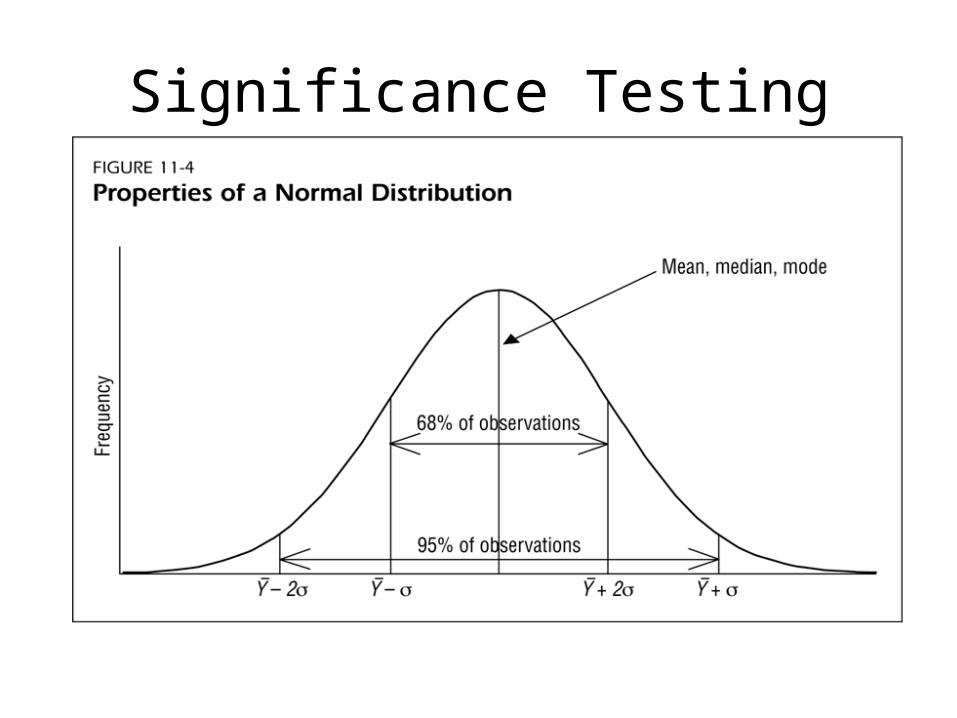
Significance Testing
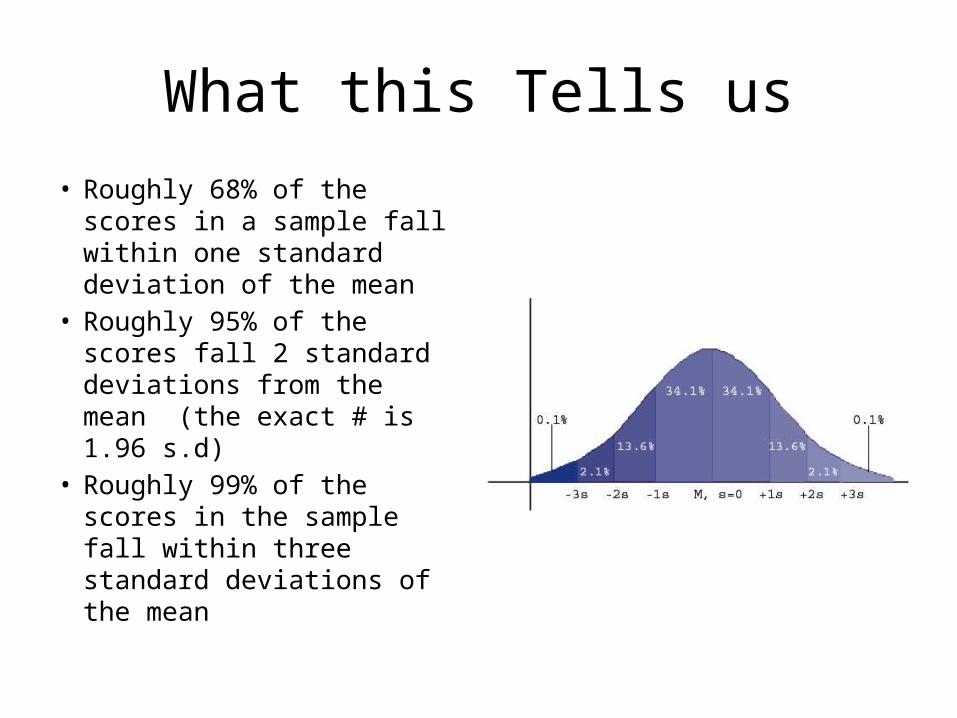
What this Tells us
• Roughly 68% of the scores in a sample fall within one standard deviation of the mean
• Roughly 95% of the scores fall 2 standard deviations from the mean (the exact # is 1.96 s.d)
• Roughly 99% of the scores in the sample fall within three standard deviations of the mean

A Practice Example• Assuming a normal curve compute
the age (value) – For someone who is +1 s.d, from the
mean
– what number is -1 s.d. from the mean
• With this is assumption of normality, what % of cases should roughly fall within this range (+/-1 S.D.)
• What about 2 Standard Deviations, what percent should fall in this range?

SKEWNESS

What is skewness?
• an asymmetrical distribution.
• Skewness is also a measure of symmetry,
• Most often, the median is used as a measure of central tendency when data sets are skewed.
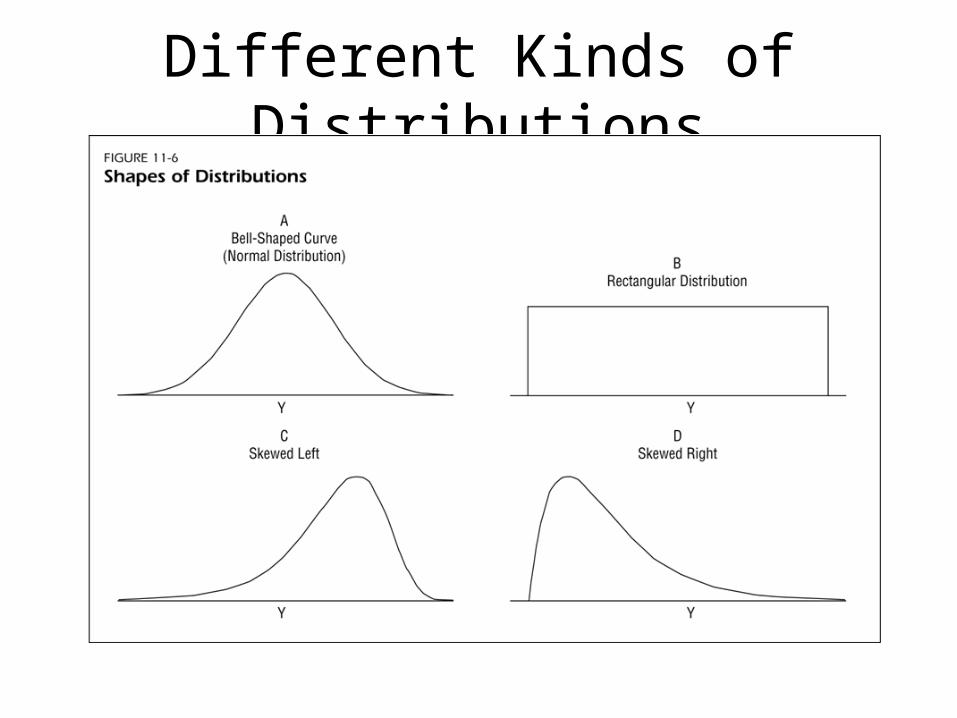
Different Kinds of Distributions
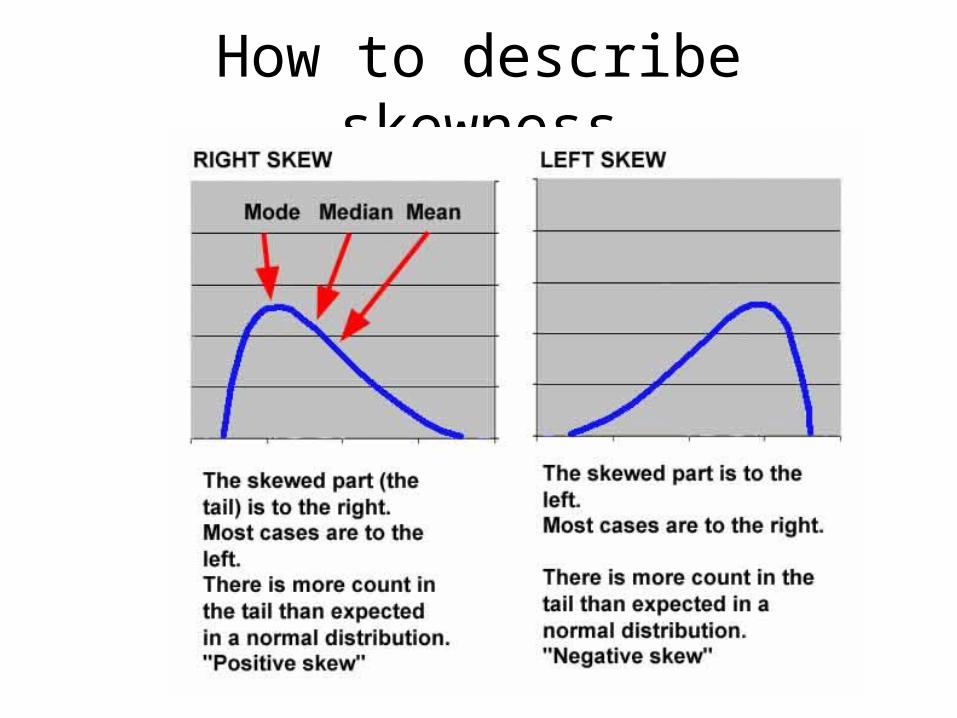
How to describe skewness