measures of competition and concentration in the banking
TRANSCRIPT

Economic & Financial Modelling • Summer 2002 1
Measures of Competition and Concentration in the Banking Industry: a Review of the Literature Jacob A. Bikker and Katharina Haaf Central Bank of the Netherlands 1. Introduction The deregulation of financial services in the European Union, the establishment of the Economic and Monetary Union (EMU) and the development of information technology are expected to contribute to dramatic changes in European banking markets over the coming years, with vast implications for competition and concentration in the banking and financial sector. The recent wave of mergers in the European banking industry can be seen as a result of these developments. This process of consolidation may affect competition, particularly on local retail markets, and enhances concentration, whereas the size of new global players may cause concerns about financial stability. To assess the implications of these developments, it is necessary to investigate the impact of consolidation on the market structure and the performance of banks. Measures of concentration and competition are essential for welfare-related public policy toward the banking market. In recent years, however, only a limited number of empirical studies have investigated competition and concentration in European banking markets. The scarcity of analysis in this field is primarily due to a dire shortage in detailed European sub-market banking data. This study provides an overview of the tools at hand to investigate competitive
Abstract: Measures of concentration and competition are of vital importance for welfare-related public policy toward market structure and conduct in the banking industry. Theoretical characteristics of market concentration measures are discussed and illustrated with numerical examples. Various structural and non-structural measures of competition are presented and their applications have been discussed. In structural approaches, the market structure is described by concentration ratios, based on the oligopoly theory or the structure-conduct-performance paradigm.

Jacob A. Bikker and Katharina Haaf .
Summer 2002 • Economic & Financial Modelling 2
conditions and to calculate the degree of concentration in (banking) markets, as presented in the literature. It summarises the theoretical foundations of the various measures of competition and concentration as well as their empirical application to the European banking industry. Concentration and competition are linked to product markets and geographical areas, both in theory and in empirical analyses. Banks provide a multitude of products that do not serve a unique market, and defining a relevant market involves making a preliminary decision about potentially relevant structural characteristics, such as concentration and competition (Kottmann, 1974). The relevant market includes all suppliers of a good who are actual or potential competitors, and it has a product dimension and a geographical dimension. The product definition of a market requires the determination of the range of products, which can be assigned to a particular market on the basis of their substitutability in terms of consumer demand. Likewise, the geographical boundaries of a market are drawn according to existing and potential contacts between actual and potential market participants. They are determined from the customer’s point of view and take into consideration individual consumer as well as product characteristics. The mobility of banking customers, and therefore the geographic boundaries of the market, depend on the type of customer and their economic size; the local dimension of a market is relevant for retail banking products and the regional or international dimension is relevant for corporate banking. Product characteristics influence the mobility of customers in that commercial borrowers tend to display greater mobility in their search for financing possibilities than depositors (Kottmann, 1974, Deppe, 1978, and Büschgen, 1993). The article is organised as follows. Section 2 presents an overview of market concentration measures, discusses their theoretical characteristics and gives numerical examples to illustrate differences and similarities between concentration indices in operation. The literature on the measurement of competition can be divided into two major streams: structural and non-structural approaches. In the structural approaches, concentration ratios take a central position in order to describe

Measures of Competition and Concentration
Economic & Financial Modelling • Summer 2002 3
the market structure. Structural approaches are investigated first (in Section 3), as they constitute a natural link between concentration and competition. The impact of market concentration on market performance has its roots in both the oligopoly theory and the structure-conduct-performance (SCP) paradigm. Whereas the former approach is founded in economic theory, the latter is an ad hoc approach, often criticised in methodological as well as identificational terms, but nevertheless applied empirically ad infinitum. Where a SCP model can be based on any concentration ratio, two formal derivations of the competition-concentration relationship based on oligopoly theory each exactly define the relevant concentration ratio. This section also surveys empirical results of the SCP test for the European banking industry. Section 4 provides a theoretical presentation of non-structural approaches to the measurement of competition, some of which share the same theoretical roots as the formal structural methods of the preceding section. Furthermore, this section summarises the results of the various studies applying those approaches to the European banking industry. Section 5 concludes the article. The Appendix reviews the most important distributional concepts employed in this article.
2. Measures of Concentration The importance of concentration ratios arises from their ability to capture structural features of a market. Concentration ratios are therefore often used in structural models explaining competitive performance in the banking industry as the result of market structure.1 This feature will be discussed in Section 3, where the impact of concentration on competitive performance is investigated. Concentration ratios are also able to reflect changes in concentration as a result of the entry of a bank into the market or its exit from it, or caused by a merge. This feature is used in the US, for instance, in the enforcement process of anti-trust laws in banking.
1 It should be noted, however, that a measure of concentration does not warrant conclusions about the competitive performance in a particular market. Even in a highly concentrated market, competitive behaviour between the leading banks is still possible.
Jacob A. Bikker and Katharina Haaf .
Summer 2002 • Economic & Financial Modelling 4
The concept of industrial concentration has been extensively treated and lively debated in the economic literature. Despite the many different approaches to its measurement, general agreement prevails about the constituting elements of concentration measures, i.e. the number of banks (fewness) and the distribution of bank sizes (inequality) in a given market. However, the classification of concentration measures in the literature is not systematic. This article presents concentration indices (CI) exhibiting the general form: (2.1) ∑ =
=n
i iiwsCI1
where is is the market share of bank i, iw is the weight attached to the market share and n is the number of banks in the market in question. This section considers ten concentration ratios – the k bank Concentration Ratio ( kCR ); the Herfindahl-Hirschman Index (HHI); the Hall-Tideman Index (HTI); the Rosenbluth Index (RI); the Comprehensive Industrial Concentration Index (CCI); the Hannah and Kay Index (HKI); the U Index (U); the multiplicative Hause Index (Hm); the additive Hause Index (Ha); and the Entropy measure (E) – and discusses the weighting scheme and structure of each. The theoretical discussion of the properties of the various indices is illustrated by their empirical application to the Dutch mortgage market. In addition, the most frequently used indices, kCR and HHI, are applied to 20 countries in order to assess their ability to measure and, more particularly, to rank bank concentration in these countries.
2.1. Classification by Weighting Scheme and Structure Concentration measures can be classified according to their weighting schemes and structure. Marfels (1971a) and Dickson (1981) discuss the weighting schemes of a number of concentration ratios. The weighting scheme of an index determines its sensitivity towards changes at the tail-end of the bank size distribution. Marfels differentiates between four groups of weights:2
2 Instead of Marfels’ fourth group of weighting schemes, in which the shares of individual banks are used as weights in a weighted geometric mean, the present

Measures of Competition and Concentration
Economic & Financial Modelling • Summer 2002 5
1. Weights of unity are attached to the shares of an arbitrarily
determined number of banks ranked in descending order ( 1=iw , ki ≤∀ ), and zero weights are attached to the remaining banks in
the industry ( 0=iw , ki >∀ ). An example is the k bank concentration ratio, probably the most frequently used concentration ratio.
2. Banks’ market shares are used as their own weights ( ii sw = , i∀ ), so that greater weights are attached to larger banks. These indices take account of all banks in the industry. An example is the Herfindahl-Hirschman Index, well known from both theory and practice.
3. The rankings of the individual banks are used as weights ( iwi = , i∀ ), where banks can be ranked in ascending or descending order.
All banks are included in computing this index. Examples are the Rosenbluth index and the Hall-Tideman index.
4. Each market share is weighted by the negative of its logarithm ( ii sw log−= , i∀ ). A smaller absolute weight is thus attached to larger market shares. An example is the Entropy index.
Dickson’s (1981) approach to weighting schemes is somewhat more theoretical. By defining conjectural variation elasticity,3 he presents the derivation of various weighting schemes embedded in microeconomic theory. Dickson found only six of the 15 indices under investigation consistent with theoretical market models: the kCR , the HHI, the CCI, the mH , the HKI and the U. Some of the indices presented in this section are more complex and hence consistent with more than one of the weighting schemes; an example is the CCI. The structure of concentration indices can be discrete or cumulative. Discrete measures of concentration correspond to the height of the concentration curve at an arbitrary point.4 The k bank concentration ratio, for instance, belongs to this class of discrete measures. Practical advantages of discrete measures are
article presents the logarithm of the market share of the respective bank (relevant for the calculation of e.g. the Entropy measure). The exponential of the Entropy measure, which uses the former weighting concept, will not be discussed in this article. 3 The concept of conjectural variation is explained in Section 3.2. 4 The Appendix explains the concentration curve.
Jacob A. Bikker and Katharina Haaf .
Summer 2002 • Economic & Financial Modelling 6
simplicity and limitation of required data. In the literature, both supporters and critics of discrete concentration measures are numerous. Both parties, however, stress the impact of concentration on the market behaviour of banks. Supporters of discrete measures maintain the view that the behaviour of a market dominated by a small number of banks is very unlikely to be influenced by the total number of enterprises in the market: the calculation of concentration indices on the basis of the entire bank size distribution would be unnecessarily large scale, while only marginally changing the final results. Critics adhere to the view that every bank in the market influences market behaviour and stress a severe disadvantage of discrete indexes: they ignore the structural changes in those parts of the industry, which are not encompassed by the index of concentration. The competitive behaviour of the smaller market players might force the larger players to act competitively as well. Cumulative or summary measures of concentration, on the other hand, explain the entire size distribution of banks, implying that structural changes in all parts of the distribution influence the value of the concentration index. Of the measures presented in this section, the HHI, the CCI, the RI and the HTI as well as the E display this feature. Marfels (1971b) showed that it is possible to find corresponding measures of inequality for every summary measure of concentration, but that discrete measures of concentration do not exhibit this duality. Hence, he argues that the behaviour of discrete measures resulting from changes in the number of banks in the industry or in bank size disparity cannot be clearly identified. 2.2. Concentration Ratios 2.2.1. The k Bank Concentration Ratio Simplicity and limited data requirements make the k bank concentration ratio one of the most frequently used measures of concentration in the empirical literature. Summing only over the market shares of the k largest banks in the market, it takes the form:

Measures of Competition and Concentration
Economic & Financial Modelling • Summer 2002 7
(2.2) ∑ ==
k
i ik sCR1
giving equal emphasis to the k leading banks, but neglecting the many small banks in the market. There is no rule for the determination of the value of k, so that the number of banks included in the concentration index is a rather arbitrary decision. The concentration ratio may be considered as one point on the concentration curve, and it is a one-dimensional measure ranging between zero and unity. The index approaches zero for an infinite number of equally sized banks (given that the k chosen for the calculation of the concentration ratio is comparatively small as compared to the total number of banks) and it equals unity if the banks included in the calculation of the concentration ratio make up the entire industry. If the industry consists of n equally sized banks, == ∑ =
k
i ik sCR1
nknk
i=∑ =1
1 , which is a decreasing function of the number of banks in the market, and which yields the numbers equivalent as ke CRkn = (White, 1982).5 2.2.2. The Herfindahl-Hirschman Index The Herfindahl-Hirschman Index (HHI) is the most widely treated summary measure of concentration in the theoretical literature and often serves as a benchmark for the evaluation of other concentration indices. In the United States, the HHI plays a significant role in the enforcement process of antitrust laws in banking. An application for the merger of two banks will be approved without further investigation if the basic guidelines for the evaluation of the concentration in deposit markets are satisfied. Those guidelines imply that the post-merger market HHI does not exceed 0.18, and that the increase of the index from the pre-merger situation is less than 0.02 (Cetorelli, 1999). Often called the full-information index because it captures features of the entire distribution of bank sizes, it takes the form: (2.3) ∑ =
=n
i isHHI1
2
5 See the Appendix for an explanation of the numbers equivalent.

Jacob A. Bikker and Katharina Haaf .
Summer 2002 • Economic & Financial Modelling 8
which is the sum of the squares of bank sizes measured as market shares. As mentioned above, the Herfindahl-Hirschman Index stresses the importance of larger banks by assigning them a greater weight than smaller banks, and it incorporates each bank individually, so that arbitrary cut-offs and insensitivity to the share distribution are avoided. The HHI index ranges between
n1 and 1, reaching its lowest value, the reciprocal of the number of banks, when all banks in a market are of equal size, and reaching unity in the case of monopoly. Davies (1979) analyses the sensitivity of the HHI to its two constituent parts, i.e. the number of banks in the market and the inequality in market shares among the different banks and finds that the index becomes less sensitive to changes in the number of banks the larger the number of banks in the industry. Various authors propose linking the Herfindahl-Hirschman Index to distributional theory by presenting it in terms of the moments of the underlying bank size distribution. A first attempt to present the HHI in terms of the distribution’s mean and variance has been undertaken by Adelman (1969). Kwoka (1985) rewrites the Herfindahl-Hirschman Index as ∑ =
−+=n
i i sssHHI1
2)( by
defining the mean market share as ns 1= . Re-arranging yields the HHI as an inverse function of the number of banks in the industry and a direct function of the market shares’s variance about the mean: (2.4) 2)/1( σnnHHI += This presentation points up two features of the Herfindahl-Hirschman Index. First, the relation between the number of banks and the value of HHI is not a simple one. Given the number of banks in the market, the HHI increases with the variance, which is itself a function of the number of banks in the market (Adelman, 1969). Second, this presentation of the HHI is ambiguous in that a variety of combinations of the number and sizes of banks can produce the same HHI (Kwoka, 1985). However, this need not be a shortcoming and, for instance, holds also for the Lerner index.6 6 The Appendix discusses the Lerner index.

Measures of Competition and Concentration
Economic & Financial Modelling • Summer 2002 9
In the context of hypothetical market analysis, Rhoades (1995) argues that the inequality of banks’ market shares might differ substantially between markets yielding the same HHI value. It is possible to calculate the numbers equivalent of the HHI as
HHIne 1= for every value of the Herfindahl-Hirschman Index
(since ( ) ( ) nnnnHHI n
i111 2
12 === ∑ =
), providing evidence that at least two different bank size distributions can generate the same HHI. Hart (1975) takes a slightly different approach to embedding the HHI into distributional theory. Arguing that there are cases where the exact number of banks in an industry is unknown but information is available about both banking market size and banks’ size classification, he proposes to divide the total distribution of bank sizes into classes and to calculate the parameters of the original distribution from the parameters of the first moment distribution if the relationship between the distributions is known. He obtains a definition of HHI given by: (2.5) ( ) nHHI 12
0 += η where 2
0η is the coefficient of variation (the possible change of the size structure) of the original distribution. As long as the coefficient of variation does not change, an increase in n will result in a decrease in the HHI. Hart considers the sensitivity to the entrance of very small banks into an oligopolistic market as the greatest disadvantage of the index. 2.2.3. The Hall-Tideman Index and the Rosenbluth Index The concentration indices developed by Hall and Tideman (1967) and Rosenbluth (Niehans, 1961) resemble one another both in form and in character. Hall and Tideman bring forward a number of properties which concentration measures should satisfy and they accept the HHI on the basis of those properties. They emphasise the need to include the number of banks in the calculation of a concentration index, because it reflects to some

Jacob A. Bikker and Katharina Haaf .
Summer 2002 • Economic & Financial Modelling 10
extent the conditions of entry into a particular industry.7 Their index takes the form: (2.6) )12/(1
1∑=−=
n
i iisHTI where the market share of each bank is weighted by its ranking in order to ensure that the emphasis is on the absolute number of banks, and that the largest bank receives weight 1=i . The HTI ranges between zero and unity, being close to zero for an infinite number of equally sized banks, and reaching unity in the case of monopoly. Like the Herfindahl-Hirschman Index, the HTI equals 1/n for an industry with n equally sized banks and the numbers equivalent of the index is defined as HTIne 1= . Rosenbluth’s index is related in an obvious way to the concentration curve,8 but unlike the kCR , it takes explicit account of each item in the size distribution. The use of the rankings of banks as weights for the calculation of the index, starting with the smallest, makes the index – unlike the kCR – sensitive to changes in the bank size distribution of smaller banks. The Rosenbluth index is calculated from the area above the concentration curve and below a horizontal line drawn at a level of 100% (entire market) on the vertical scale, defined as C in Figures 1 and 2 in the Appendix. Rosenbluth’s index takes the form )2(1 CRI = , which is identical to the HTI for C =
211
−∑ =
n
i iis . The only difference between the indices results from the ranking of banks. For a given degree of inequality, the RI decreases with the increase in the number of banks. Hause (1977) claims that the value of the Rosenbluth index is heavily influenced by the small banks in the size distribution, so that its
7 Entry into an industry is seen as relatively easy, if there are many banks in the industry, and relatively difficult if the market is shielded by a few banks. 8 The Rosenbluth index and the Gini coefficient are related according to RI=1/(n(1-G)), due to the similarity of the Lorenz curve and the concentration curve. See Appendix for explanation of the Gini coefficient and the Lorenz curve. Rosenbluth (1955), Kellerer (1960), Niehans (1961) and Marfels (1971b) give details and derivations of a theoretical relationship between the concepts of concentration inequality.

Measures of Competition and Concentration
Economic & Financial Modelling • Summer 2002 11
usefulness for analysing departures from competition in highly concentrated industries seems quite dubious. 2.2.4. The Comprehensive Industrial Concentration Index The comprehensive industrial concentration index (CCI) has emerged from the debate on concentration and dispersion of banks (or firms) within various industries. The debate rests on two arguments. Despite the widely recognised convention that the dominance of the largest few banks determines market behaviour, discrete concentration measures have been criticised on the grounds that they ignore changes in market structure occurring elsewhere than among the largest banks. Conversely, dispersion measures, such as the Lorenz curve and the Gini coefficient, are said to undervalue the importance of large banks in the industry. To circumvent the deficiencies of earlier indices, Horvarth (1970) presents the CCI, which is capable of reflecting both relative dispersion and absolute magnitude. The CCI owes its intellectual heritage to the HHI and takes the form: (2.7) ))1(1(
22
1 in
i i sssCCI −++= ∑ =
It is the sum of the proportional share of the leading bank and the summation of the squares of the proportional sizes of each bank, weighted by a multiplier reflecting the proportional size of the rest of the industry. The index is unity in the case of monopoly and it is higher than the dominant bank’s absolute percentage share for a market with a greater number of banks (Horvarth, 1970). The well-established theoretical literature on equilibrium subset cartels serve as a formal underpinning for the appropriateness of the dissimilar treatment of two classes of banks, i.e. the accentuation of the dominant bank at the expense of the rest. 2.2.5. The Hannah and Kay Index Hannah and Kay (1977) propose a summary index of concentration of the form: (2.8) )1/(1
1)( αα −
=∑=n
i isHKI 0>α and 1≠α

Jacob A. Bikker and Katharina Haaf .
Summer 2002 • Economic & Financial Modelling 12
where α is an elasticity parameter to be specified and intended to reflect their ideas about changes in concentration as a result of the entry or exit of banks, and the sales transfer among the different banks in the market. The freedom to choose α allows for alternative views on what is the appropriate weighting scheme and for the option to emphasise either the upper or the lower segment of the bank size distribution. Therefore, in addition to the distribution of the banks in the market, the value of the index is sensitive to the parameter α. For 0→α , the index approaches the number of banks in the industry, and for ∞→α , it converges towards the reciprocal of the market share of the largest bank. The numbers equivalent of the HKI can be solved for
)1/(1))1(( αα −= ee nnHKI as HKIne = . Hannah and Kay (1977) show that the entry of a bank whose size is equal to the effective average size of the existing banks9 will result in the greatest reduction in concentration and cause the numbers equivalent of the concentration index to increase by one. If a bank of greater than effective average size enters the industry, the effect of reduction in concentration would be smaller, or could even be reversed (higher concentration because the size effect outweighs the numbers effect). The expansion of a bank whose size exceeds the effective average bank size, would increase the value of the HKI, and the expansion of a bank smaller than the effective average bank size would reduce it. The distribution of the HKI for a given market and various values of α are presented in Table 1 at the end of this section. 2.2.6. The U Index Davies (1979) defines his U index in terms of inequality and the number of banks in the industry reflecting his perception that most of the concentration indices developed earlier attach too much weight to either inequality or the number of banks in the market. It takes the form 1−= nIU a , where 0≥a and I is a generally accepted measure of inequality. The index allows
9 The effective average size is defined as the market size divided by the numbers equivalent calculated from the concentration index for a specific industry.

Measures of Competition and Concentration
Economic & Financial Modelling • Summer 2002 13
flexibility in the weight given to size inequality (I) and the number of banks (n) by varying a, which is an innovation compared to the concentration measures presented earlier. The choice of a is not arbitrary. To obtain the value of a, Davis proposes to estimate a simple model of inter-industry variance in price cost margins of the form βαπ ii C= , where iπ and iC are, respectively, the price-cost margin and concentration in industry i.10 Replacing iC by the U index and taking logarithms, the regression equation can be written as: (2.9) iiii nI υββαπ +++= loglogloglog 21 Since ββ a=1 and ββ −=2 , the estimated value of a can be obtained as 21 ββ−=a . Theoretically, Davies derives the U index as: (2.10) ( ) ( ) an
iaa
iian
i iaaan
i i nsssnnsnU ))(()()(1
11
2111
2 ∑∑∑ =−
=−−
====
by defining inequality as ×==+= ∑∑ ==
)/(/11
22
122 n
i in
i i nxxnxcI
∑==
n
i isnnX1
222 / . Hence, I is a simple transformation of the coefficient of variation c². Davies investigates the reaction of the U index to new entries and mergers in order to shed light on the role and the possible values of the a parameter. Since mergers and entry can best be measured by introducing a yardstick measure of typical bank size, the Herfindahl average effective size of banks, has been applied.11 Davies proposes that a should be constrained to 1≤a in empirical applications for the index to deliver economically unambiguous and plausible results. For
1≤a , a merger always leads to an increase in the recorded concentration and the proportionate increase will be in line with the size of the merging banks. The magnitude of the parameter a furthermore determines the sensitivity of the index to different types of mergers. U will thus become more sensitive to mergers 10 Note that when data on price-cost margins would be available, the obvious question arises why Davies does not use these data directly as a measure of competition, rather than to try to fit a model that relates it to some other measure. 11 The Herfindahl effective average size is defined as the industry size divided by the numbers equivalent calculated from the Herfindahl-Hirschman Index.

Jacob A. Bikker and Katharina Haaf .
Summer 2002 • Economic & Financial Modelling 14
as the value of a increases and the merging banks are larger. The entry of a new bank into the industry will lead to a fall in recorded concentration, provided the entrant is no more than twice the Herfindahl average effective size. The de-concentrating effect is maximised, where the entrant is of exactly the average effective size. The entry of very small banks will generally have only a minimal effect on concentration, and the magnitude of a determines the sensitivity of U to entry. The restriction 1≤a , however, implies that ( )
iaa
i sns << −10 . From a theoretical point of view, this result is implausible. Oligopolistic behaviour becomes possible only if a is constrained to 1≥a . It therefore appears as if the U index delivers theoretically as well as empirically satisfactory results only in the case of 1=a , for which HHIU = . The distribution of the U index for a given market and various values of a are presented in Table 1 at the end of this section. 2.2.7. The Hause Indices Based on a discussion of the various interpretations of the Cournot model, Hause (1977) introduces six criteria that a theoretically reasonable measure of industrial concentration should satisfy. He claims that none of the earlier measures meets all of his criteria, and he attempts to derive two measures of concentration that do. Both depend on a parameter α that captures the effects of collusion in an oligopoly model. Hause furthermore provides numerical evidence that the tendency towards more competition as n increases is much slower for low values of α, i.e. a high degree of collusion, than implied by the HHI index. The multiplicatively modified Cournot measure takes the form: (2.11) { }( ) ∑ =
−−=n
isHHIs
iimiissH
1))((2 2
,α
α where HHI is the Herfindahl-Hirschman Index and α is the parameter capturing the degree of collusion. To ensure that the index is a decreasing, convex function of the equivalent number of equally sized banks implied by the index, it appears necessary to restrict 15.0≥α . The α parameter decreases inversely to the degree of collusion, and for ∞→α the index approaches the HHI. Assuming a two-bank industry, Hause derives the range for the expression raised to the power of α as [0, 2(1/3)0.15 = 0.39], so

Measures of Competition and Concentration
Economic & Financial Modelling • Summer 2002 15
that the exponent on is always exceeds unity (as long as α > 0).12 The validity of the index in theoretical terms depends quite crucially on the specification of α: only if ∞→α will the weights attached to the banks’ market shares grow to equal those of the HHI. The index equals one in the monopoly case, it converges to zero for an infinite number of equally sized banks in
the market and it takes the value ( )α)/)1((1 3
1 nnn −− if the banks in the industry are of equal size, converging to the Herfindahl result, i.e.
n1 , for large n. Hause furthermore proposes the additively adjusted Cournot measure of concentration, which is defined as: (2.12) { }( ) ∑ =
−+=n
i iiiia sHHIsssH1
22 )))(((, ββ
with 1>β . This restriction assures the convergence of the index to the HHI for larger numbers of banks, and the measure becomes
))1(( 1211 ββ −−− −+ nnn , if all banks in the market are of equal size. 2.2.8. Entropy Measure The Entropy measure has its theoretical foundations in information theory and measures the ex-ante expected information content of a distribution.13 It takes the form:14 (2.13) ∑ =
−=n
i ii ssE1 2log
The index ranges between 0 and n2log , and is therefore not restricted to [0, 1], as most of the other measures of concentration presented above. The value of the Entropy varies inversely to the degree of concentration. It approaches zero if the underlying 12 Actually, we are not able to reproduce Hause’s upper bound value for the expression raised to the power of α. In our view, in a two-bank industry, the expression takes its maximum value, ( )3314 , if 311 =s , which is the square of Hause’s maximum. 13 See Appendix for details. 14 The old-fashioned base 2 can be replaced by, for instance, the more common base e (for natural logarithms), which would change the value of the Entropy by a constant (viz. 2ln1 ). An example for this transformation is presented in the Appendix.

Jacob A. Bikker and Katharina Haaf .
Summer 2002 • Economic & Financial Modelling 16
market is monopoly and reaches its highest value, nE log= , when market shares of all banks are equal and market concentration is lowest. For a given number of banks, the index falls with an increase in inequality among those banks (White, 1982), and the weights the index attaches to market share decreases in absolute terms as the market share of a bank becomes larger (Kwoka, 1985). The numbers equivalent of this index takes the form E
en 2= . 2.3. Empirical Illustrations of Concentration Measures Before concluding the discussion of the various concentration measures, we present a few brief numerical exercises taken from practical experience. The first application demonstrates the diverging results yielded by the various concentration measures when applied to the same underlying market. Table 1 presents the values of these indices based on market shares of 16 active banks in the Dutch mortgage market. Even a short glance reveals the wide spread in these values. The results show clearly that not only does the range of possible values differ strongly across the indices, but so do the values of the indices within this range. For instance, the value is high for the CRk and low for the HHI and in particular for the Rosenbluth index, where the ranges of these indices are identical (see Table 1). Three of the indices, namely the HKI, the multiplicatively modified Hause index and the U index were calculated for a number of parameter values for α or a. The sensitivity of these indices to changes in those parameter values is displayed in Graphs 1-3. They clearly show that, for a given market structure, the U index is an increasing function of the underlying parameters, while the HKI and the Hause index are decreasing. The HHI is a special case of the U index for 1=a , whereas the Hause index converges to the HHI if ∞→α .

Measures of Competition and Concentration
Economic & Financial Modelling • Summer 2002 17
Table 1 Application of concentration measures to the Dutch mortgage market
Index type Range Parameters Typical features Value CR3 Takes only large banks into account; 0.82CR4 arbitrary cut off 0.90CR5
0 < CRk ≤ 1 0.96
HHI 1/n ≤ HHI ≤ 1 Considers all banks; sensitive to entrance of new banks 0.24
HTI 0 < HTI ≤ 1 Emphasis on absolute number of banks 0.25
Rosenbluth 0 < RI ≤ 1 Sensitive to changes in the size distribution of small banks 0.04
CCI 0 < CCI ≤ 1 Addresses relative dispersion and absolute magnitude; suitable for cartel markets 0.56
α = 0.005 Stresses influence small banks 15.79α = 0.25 9.41α = 5 3.64HKI 1/s1 ≤ HKI ≤ n
α = 10 Stresses influence large banks 3.40a = 0.25 Stresses number of banks 0.09a = 1 For a = 1 equal to the HHI. 0.24a = 2 0.92U index 1/n ≤ U ≤ ∞
a = 3 Stresses inequality distribution of banks 3.51α = 0.25 Suitable for highly collusive markets 0.44α = 1 0.25Hause index 0 < Hm ≤ 1 α = 2 Suitable for not collusive markets 0.24
Entropy 0 ≤ E ≤ log n Based on expected information content of a distribution 2.35
Concentration ratios are often used as input for public policy rules and measures regarding the banking market structure. Policy makers can concentration indices depending on (i) the features of their banking market (e.g. the type or level of concentration), (ii) their perceptions regarding the relative impact larger and smaller banks have on competition in a certain market, and (iii) their perceptions regarding the relative impact of size distribution and number of banks (for instance, reflecting the impact of a new entry). These features and perceptions mainly determine which index is most appropriate. Concentration ratios are also used to measure the impact of concentration on competition. Section 3.2.1 elaborates on the relation between the concentration ratios’ weighting schemes and underlying bank conduct.

Jacob A. Bikker and Katharina Haaf .
Summer 2002 • Economic & Financial Modelling 18
Graph 1 Hannah and Kay index (for different values of α)
0
2
4
6
8
10
12
14
16
0 1 2 3 4 5 6 7 8 9 10
α
Index value
Graph 2 U index (for different values of a)
0
0 ,5
1
1 ,5
2
2 ,5
3
3 ,5
4
0 0 ,5 1 1 ,5 2 2 ,5 3
a
Index value
Graph 3 Multiplicatively-modified Hause index
(for different values of α)
0,2
0,25
0,3
0,35
0,4
0,45
0 0,5 1 1,5 2 2,5 3
α
Index value
The second practical exercise demonstrates the results for two concentration measures when applied to different markets. Table 2 shows the values of the most frequently used indices, the HHI and the CRk’s, for k = 3, 5 and 10, based on market shares in terms of total assets of banks in 20 countries (for details and background, see Bikker and Haaf, 2002). We have already observed the spread caused by differences in weighting schemes which can occur in the (average) levels of the various indices.

Measures of Competition and Concentration
Economic & Financial Modelling • Summer 2002 19
Differences across countries in the HHI relate most heavily to the number of banks (see last column), whereas differences in the CRk are mainly due to the skewness of the bank-size distribution, in particular of its large-bank end. Table 2 Concentration indices for 20 countries, based on
total assets (1997) Values Rankings No. of
Countries HHI CR3 CR5 CR10 HHI CR3 CR5 CR10 banks Australia 0.14 0.57 0.77 0.90 6 6 5 6 31Austria 0.14 0.53 0.64 0.77 6 9 11 12 78Belgium 0.12 0.52 0.75 0.87 9 11 7 7 79Canada 0.14 0.54 0.82 0.94 6 8 2 1 44Denmark 0.17 0.67 0.80 0.91 4 3 4 5 91France 0.05 0.30 0.45 0.64 16 16 16 15 336Germany 0.03 0.22 0.31 0.46 18 18 18 19 1,803Greece 0.20 0.66 0.82 0.94 3 4 2 1 22Ireland 0.17 0.65 0.73 0.84 4 5 8 8 30Italy 0.04 0.27 0.40 0.54 17 17 17 17 331Japan 0.06 0.39 0.49 0.56 14 14 14 16 140Luxembourg 0.03 0.20 0.30 0.49 18 19 19 18 118Netherlands 0.23 0.78 0.87 0.93 2 1 1 3 45Norway 0.12 0.56 0.67 0.81 9 7 10 11 35Portugal 0.09 0.40 0.57 0.82 12 13 12 9 40Spain 0.08 0.45 0.56 0.69 13 12 13 13 140Sweden 0.12 0.53 0.73 0.92 9 9 8 4 21Switzerland 0.26 0.72 0.77 0.82 1 2 5 9 325UK 0.06 0.34 0.47 0.68 14 15 15 14 186US 0.02 0.15 0.23 0.38 20 20 20 20 717Averages 0.11 0.47 0.61 0.75 4,612σ a 0.07 0.18 0.20 0.18 Source: Bikker and Haaf (2002); a Standard deviation.
On the whole, apart from a few exceptions,15 the rankings of countries are rather similar for the various indices considered, which raises confidence in the appropriateness of these indices. The result is typical for what is observed in the empirical literature. Surprisingly, the ranking of the HHI and the 3-bank CR bear the closest resemblance (with a correlation of 0.98), whereas the ranking of the 5 and 10-bank CRs differ more from the HHI (with, respectively, correlations of 0.94 and 0.86). The 15 Exceptions are related mainly to a deviating bank size distribution of the largest 10 banks. This is especially true when the total number of banks is limited.

Jacob A. Bikker and Katharina Haaf .
Summer 2002 • Economic & Financial Modelling 20
CR3 and the CR10 are least similar. This observation puts into perspective the many ponderous considerations in the literature regarding the neglect of the smaller banks in the k bank CR indices, compared to the HHI, which takes all banks into account. 2.4. Concluding Remarks With the exception of the CRk and the HHI, the measures of concentration presented in the preceding discussion have been applied only sparingly in the empirical banking literature. The former two indices are also often used as proxies for the market structure in structural approaches to measure competition, i.e. the Structure-Conduct-Performance paradigm and the efficiency hypothesis, which both will be presented in the next section. The HHI, furthermore, is a statutory measure to evaluate the impact, which a proposed merger in the US banking industry is to have on the market structure in the region concerned. Applied in practice, the various concentration measures may show strongly diverging values for the same market, due to the use of varying weighting schemes, which reflect mainly different assessment regarding the relative impact of larger and smaller banks on competition in a certain market. Policy makers should choose concentration indices depending on the features of their banking market and their perceptions regarding the relative impact larger and smaller banks have on competition and regarding the relative impact of size distribution and number of banks. Where for the k bank CRs and the HHI the levels may vary, their rankings of banking markets in 20 countries appear (as is often the case) to be rather similar. This adds to the suitability of these indices for public policy rules and measures. 3. Structural Measures of Competition The literature on the measurement of competition can be divided into two major streams: structural and non-structural approaches. The structural approach to the measurement of competition embraces the Structure-Conduct-Performance paradigm (SCP) and the efficiency hypothesis, as well as a number of formal approaches with roots in Industrial Organisation theory. The two former models investigate, respectively, whether a highly concentrated market causes collusive behaviour among the larger

Measures of Competition and Concentration
Economic & Financial Modelling • Summer 2002 21
banks resulting in superior market performance, or else, whether it is the efficiency of larger banks that enhances their performance. These structural models, which link competition to concentration, are presented in this section. Non-structural models for the measurement of competition, namely the Iwata model (Iwata, 1974), the Bresnahan model,16 and the Panzar-Rosse model (Panzar and Rosse, 1987), were developed in reaction to the theoretical and empirical deficiencies of the structural models. These New Empirical Industrial Organisation approaches test competition and the use of market power, and stress the analysis of banks’ competitive conduct in the absence of structural measures. These non-structural approaches, which ignore the impact of concentration, will be discussed in Section 4. Structural measures of competition may, in turn, be divided into two major schools of thought: the formal and non-formal approaches. The study of the relationship between market performance and market structure has its roots in the non-formal framework of the SCP paradigm. Since its origins, this framework has evolved largely independently of ongoing refinements in formal models of imperfectly competitive markets (Martin, 1993). The empirical application of the SCP paradigm in its original form and the recognition that the market structure should be treated as an endogenous variable, led to a reformulation of the empirical tests and to attempts to build a formal theoretical framework for the structural equations. Oligopoly theory has replaced SCP as the organizing framework for industrial economics. In some cases, this work recast SCP arguments in a more formal mould (Martin, 1993). Yet, large discrepancies between the formal and non-formal approaches remain. The first part of this section discusses two non-formal approaches to the market structure-market performance relationship, the SCP framework and the efficiency hypothesis. These approaches are called non-formal as measures for the market structures are not derived theoretically, but chosen at will. The second part presents
16 See Bresnahan (1982) and Lau (1982). This technique is elaborated further in Bresnahan (1989).

Jacob A. Bikker and Katharina Haaf .
Summer 2002 • Economic & Financial Modelling 22
two formal derivations of the competition-concentration relationship, one based on the HHI and one on the CRk. These measures of the market structure follow formally from theoretical derivations. Both the formal and the non-formal approaches link competition to concentration, as in every approach a concentration ratio takes up a central position. 3.1. Non-formal Structural Approaches to Competition The SCP and the efficiency hypothesis are the two most common non-formal structural approaches to measure the impact of concentration on competition. In its original form, the SCP explains market performance as the result of an exogenously given market structure, which depends upon basic demand and supply side conditions (Reid, 1987, and Scherer and Ross, 1990) and which influences the conduct of banks in the industry. A higher level of concentration in the market is assumed to foster collusion among the active banks and to reduce the degree of competition in that particular market. The application of the SCP to the banking literature has been criticised by various authors, for instance by Gilbert (1984), Reid (1987), Vesala (1995) and Bos (2002). Their criticism is directed at the form of the model rather than at the specification of the variables used. Much of the criticism is related to the one-way causality – from market structure to market performance – inherent in the original model as it is still being applied in many banking studies, and to the failure of recent studies to incorporate new developments in the theory of industrial organisations. The extensive literature applying the structure-performance paradigm to the banking industry has been summarised by, for instance, Gilbert (1984), Molyneux et al. (1996) and Bos (2002). In this context, it should be noted that most of the studies applying the SCP framework to the banking industry do not take explicit account of the conduct of banks.17 This being the case, the remaining of the analysis will focus on the structure-performance (S-P) relationship. 17 To the best of our knowledge, only the study by Calem and Carlino (1991) takes explicit account of bank conduct in the empirical application of the SCP framework. They found that strategic conduct of commercial and federal savings banks in the United States was not limited to concentrated markets. Bikker and Haaf (2002) investigate the structure-conduct relationship.

Measures of Competition and Concentration
Economic & Financial Modelling • Summer 2002 23
The efficiency hypothesis, developed by Demsetz (1973) and Peltzman (1977), challenges the line of reasoning of the traditional S-P paradigm and offers a competing explanation of the relation between market structure and performance. The hypothesis claims that if a bank achieves a higher degree of efficiency than other banks in the market (i.e. its cost structure is comparatively more effective), its profit maximising behaviour will allow it to gain market share by reducing prices (Molyneux and Forbes, 1995). Market structure is therefore shaped endogenously by banks’ performance, so that concentration is a result of the superior efficiency of the leading banks (Vesala, 1995). Empirically, one may distinguish the S-P paradigm from the efficiency hypothesis by looking at the endogenous variable measuring the performance of a particular bank, which is usually estimated as a function of exogenous market structure and control variables, as in: (3.1) k
tjik ktitjti XMSCR ,,2,2,10, ∑ ++++=Π αααα
ti,Π is a performance measure for bank i, tjCR , is a measure of concentration in region j (the region to which bank i belongs) and
tiMS , is the market share of bank i; t refers to period t. CR and
MS each proxies an aspect of the market structure. kX is a vector of control variables included to account for both bank-specific and region-specific characteristics (Molyneux and Forbes, 1995). The traditional structure-performance relationship would apply to the data if 01 >α and 02 =α , and the efficiency hypothesis holds if 01 =α and 02 >α . Resulting from the definition of bank performance measures in various empirical studies, the S-P literature as applied to the banking industry can be divided into two groups. A large variety of articles have employed the price of a particular product or service as a measure of bank performance, whereas a smaller number of studies relied on profitability measures, such as banks’ profit rates.

Jacob A. Bikker and Katharina Haaf .
Summer 2002 • Economic & Financial Modelling 24
The first group uses a price measure of some kind – commonly either average prices of products or services (average interest rates on loans or deposits, average service charges on demand deposits), or the price of particular products or services (e.g. business loans).18 The use of average prices as proxy for bank performance has had its share of criticism. More precisely defined product markets are examined when data on individual product prices is employed. Price measures, however, ignore the (possible) cross-subsidisation that is not uncommon for a multi-product bank, so that studies applying these performance measures might present a misleading picture as compared to the overall performance of the bank (Molyneux and Forbes, 1995). The definition of relevant product (and geographical) markets, as discussed in the introduction, is also an issue here. Apart from the ease with which they can be obtained, profitability measures have the advantage of consolidating product profits and losses of a multi-product bank into one single figure; i.e. they do include cross-subsidisation among products. Like the pricing approach to banking performance, the calculation of profits measures from both stock and flow variables is a drawback (Molyneux et al., 1996). In addition, Vesala (1995) claims that banks’ operational inefficiencies can lead to lower profitability, so that market power and profits need not necessarily be positively correlated. Furthermore, the calculation of an aggregated profit measure precludes the estimation of market power in individual markets. Table 3 summarises a variety of measures that can be used to describe market structure in the banking industry. In most studies, banking market structure is proxied by a measure of concentration and the market shares of the banks in the market.19 The studies applying the S-P to the US banking industry usually define market structure in terms of the Herfindahl-Hirschman Index, the k bank concentration ratio or the number of banks in the market (Molyneux et al., 1996). Only a very limited number of studies apply the Entropy, the Hall-Tideman index or the Gini
18 For an overview, see Gilbert (1984), Molyneux et al. (1996) and Bos (2002). 19 Market share is often also considered as a proxy for bank efficiency.

Measures of Competition and Concentration
Economic & Financial Modelling • Summer 2002 25
coefficient as market structure measure. Not all structure-performance studies account for barriers to entry.
Table 3 The structure-performance relationship in banking
Concentration
- Herfindahl-Hirschman Index - k bank concentration ratio - number of banks - other concentration ratios or Gini coefficient
Market sharea - defined for the relevant market
Barriers to entryb
- regulatory barriers: bank charters or branches and the conditions related to them - non-regulatory barriers: minimal efficient size, product differentiation, scale economies, technology and know-how
Market structure (exogenous)
Number of branches - operating in the relevant market
Price measures
- price of particular products or services (for instance business loans) - average prices of products or services (e.g. average interest rates on loans; average interest rates on deposits; average service charges on demand deposits)
Performance (endogenous)
Profitability measures
- single figure consolidating profits and losses realised with all products offered by a bank
a Market shares of individual banks are very often used as a measure indicating the efficiency of banks; b Vesala (1995) claims that the correlation between regulatory protection and concentration, as well as the correlation between regulatory protection and profitability may be the reason for the detected positive correlation between concentration and profitability.
The control variables usually included in the empirical analysis proxy market demand conditions (e.g. per capita income or wage, levels of population density, immigration into specific markets), cost differences across banks, size-induced differences between banks, such as scale economies (e.g. measure of individual bank size), different risk categories (Molyneux et al., 1996) and ownership differences (Lloyd-Williams et al., 1994). The results of the rather limited number of studies investigating the S-P relationship for European banking markets are no less ambiguous than those obtained from the US (Gilbert, 1984, Weiss, 1989, Molyneux et al., 1996, and Bos 2002). The scarcity of those studies is mainly the result of the lack of sub-market banking data for the European banking markets, which makes it extremely difficult to define a meaningful (relevant) market area
Jacob A. Bikker and Katharina Haaf .
Summer 2002 • Economic & Financial Modelling 26
and a reasonable measure of concentration in universal banking and nation-wide banking markets. 3.2. Formal Structural Approaches to Competition The growing body of literature subjecting the choice of profitability measures to formal analysis has been summarised by Martin (1993). Most of these formal studies generalise the Lerner index of monopoly power. They do not stress any one measure of profitability as correct or the best, but provide guidance in selecting tests of market power and profitability. The overall organising framework, which will now be introduced, has its roots in Industrial Organisations theory. It provides the basis for the discussion of formal structural and non-structural models in competition theory. The derivations are based on the profit maximisation problem for oligopolistic markets, presented for instance by Cowling (1976) and Cowling and Waterson (1976). There are n unequally sized banks in the industry producing a homogeneous product.20 Bank size differences are incorporated by the shape of the individual banks’ cost functions. The profit function for an individual bank takes the form: (3.2) iiiii Fxcpx −−=Π )( where Πi is profit, xi is the volume of output, p is the output price, ci are the variable costs and Fi are fixed costs of bank i. Banks are assumed to face downward sloping market demand functions, the inverse of which is defined as: (3.3) )...()( 21 nxxxfXfp +++== The first order condition for profit maximising of bank i yields: (3.4) 0)()/)((/ =′−′+=Π iiiiii xcxdxdXXfpdxd and can be written as:
20 For a discussion on homogeneity, see Stigler (1964).
Measures of Competition and Concentration
Economic & Financial Modelling • Summer 2002 27
(3.5) 0)()1)(( =′−+′+ iii xcxXfp λ where i
n
ij ji dxxd /∑ ≠=λ is the conjectural variation of bank i
with respect to all other banks in the market. The concept of conjectural variation can parameterize any static or dynamic equilibrium structure in which firms’ reaction functions are continuous. It allows differentiation between various market forms, and can be viewed as including expectations about the behaviour of potential entrants as well as actual rivals (Cowling, 1976, p.5). Depending on the underlying market form, iλ can
take values between –1 and in
ij j xx /∑ ≠. In the case of perfect
competition, an increase in output by one bank has no effect on the market price and quantity: ( )iidxdX λ+== 10 , and hence
1−=iλ . A bank operating in a Cournot oligopoly does not expect retaliation from its competitors, i.e. it expects other banks to re-main inactive in response to an increase in its own output. An increase in output by bank i thus leads to an increase in total industry output by the same amount: ( )iidxdX λ+== 11 , so that
0=iλ . In the case of perfect collusion, a bank i expects full retaliation from its competitors, who intend to protect their market share as response to an increase in output by bank i:
== ii xXdxdX iλ+1 (an increase in output by bank i by one unit leads to an increase in market output by ixX units), and
=iλ ( ) in
ij jii xxxxX /∑ ≠=− . In what follows, equation (3.5)
will serve as a starting point both for the discussions of a variety of measures of competition and for the formal derivations of the relationship between measures of concentration and measures of competition. 3.2.1. The HHI in formal structure-performance models Multiplying equation (3.5) with xi and summing the result over all banks yields: (3.6) ( ) ( ) 0)/()/(
1222
11=′−′+ ∑∑∑ ===
n
i iiiiin
i
n
i i xxcXxXdxdXXfpx
Jacob A. Bikker and Katharina Haaf .
Summer 2002 • Economic & Financial Modelling 28
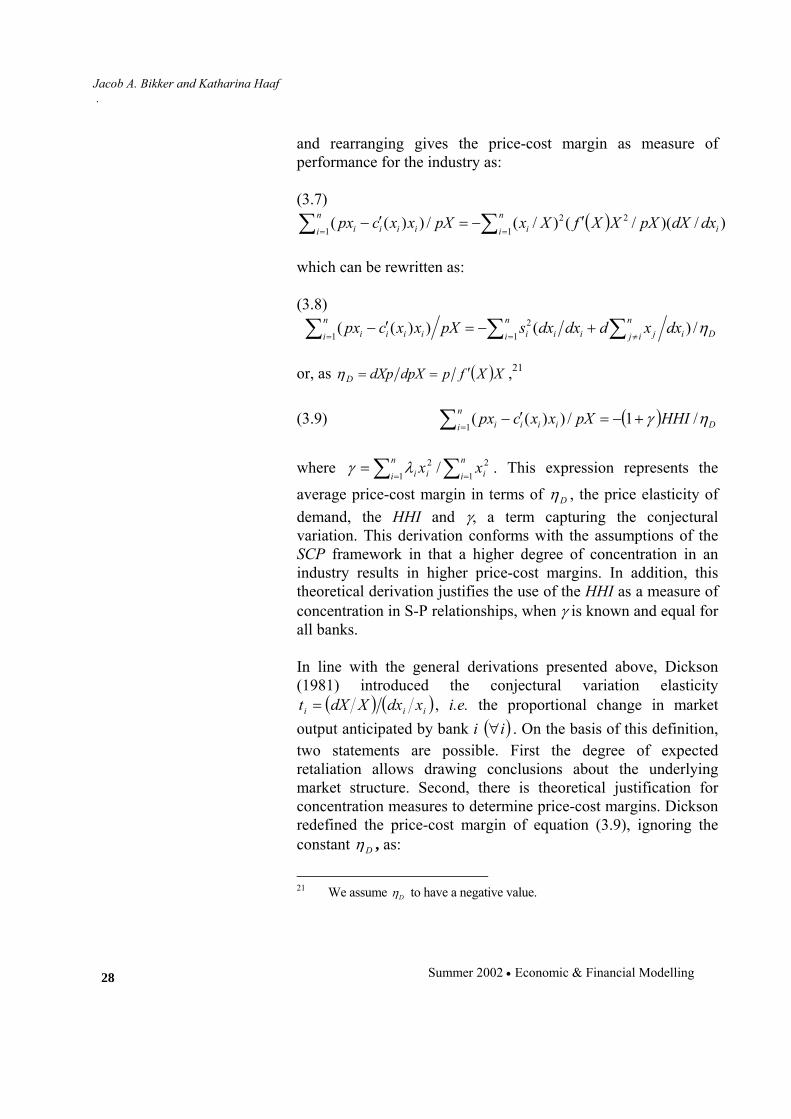
and rearranging gives the price-cost margin as measure of performance for the industry as: (3.7)
( ) )/)(/()/(/))(( 21
21 i
n
i iiiin
i i dxdXpXXXfXxpXxxcpx ′−=′− ∑∑ ==
which can be rewritten as: (3.8) D
n
i in
ij jiiin
i iiii dxxddxdxspXxxcpx η/)())((1
21 ∑ ∑∑ = ≠=
+−=′−
or, as ( )XXfpdpXdXpD ′==η ,21 (3.9) ( ) D
n
i iiii HHIpXxxcpx ηγ /1/))((1
+−=′−∑ =
where ∑∑ ==
=n
i in
i ii xx1
21
2 /λγ . This expression represents the
average price-cost margin in terms of Dη , the price elasticity of demand, the HHI and γ, a term capturing the conjectural variation. This derivation conforms with the assumptions of the SCP framework in that a higher degree of concentration in an industry results in higher price-cost margins. In addition, this theoretical derivation justifies the use of the HHI as a measure of concentration in S-P relationships, when γ is known and equal for all banks. In line with the general derivations presented above, Dickson (1981) introduced the conjectural variation elasticity
( ) ( )iii xdxXdXt = , i.e. the proportional change in market output anticipated by bank i ( )i∀ . On the basis of this definition, two statements are possible. First the degree of expected retaliation allows drawing conclusions about the underlying market structure. Second, there is theoretical justification for concentration measures to determine price-cost margins. Dickson redefined the price-cost margin of equation (3.9), ignoring the constant Dη , as:
21 We assume Dη to have a negative value.

Measures of Competition and Concentration
Economic & Financial Modelling • Summer 2002 29
(3.10) ∑=
=n
i ii tsA1
with ( )iii st λ+= 1 . Note that: ( ) +=+= ∑∑ ==
HHIsts n
i iin
i ii 12
11 λ
+=∑ =HHIXxn
i ii122 /λ ( )γγ +=∑ =
1/ 21
2 HHIXxn
i i . Just like the
definition of the conjectural variation iλ , the conjectural variation elasticity it takes different values depending on the underlying market structure. First, in a Cournot oligopoly,
XdxXdX i= , such that )/)(/()( XxXdxXdXt iii = = si. Second, 1=it in the case of perfect collusion, since =XdX
ii xdx . Third, for perfectly competitive markets 0=idxdX and 0=it . Measures of concentration can therefore be treated as
weighted averages of conjectural variation elasticities.
Table 4 Concentration measures and their conjectural variations
Measure of concentration Weight wi Range of conjectural variation HHI wi = si wi = ti = si
wi = 1 for i ≤ k wi = ti = 1 CRk wi = 0 for i > k wi = ti = 0 wi = 1 for s1 and wi = ti = 1 CCI wi = (si + (si - si
2)) for i > 1 si < wi (= ti ) ≤ 0.75 HKI b) wi = si
α – 1 0 ≤ ti ≤ 1 c)
wi = si n(a – 1) / a 0 < si n(a –1) / a (= ti ) < si for a ≤ 1 and U
ti > 1 is possible for a > 1 Hm wi = s
α))((1 2ii sHs
i−− si < ti < 1
a) See the text for the market structure corresponding to each of the values of ti; b) For the derivation of this weight, Dickson (1981) departs from the expression HKI = Σ si
α from which Hannah and Kay derived their index as presented in equation (2.8); c) The index can be made compatible by restricting 0 ≤ si
α - 1 ≤ 1, and a ≥ 1. The parameter a is equal to 1 in the monopoly case, and the Cournot equilibrium is obtained when α → 2. The results obtained by Dickson for theoretically justifiable measures of concentration presented in Section 2 of this article are summarised in Table 4. It turns out that the conjectural variation of a bank can take a fixed value, or vary within a certain range. The value of the conjectural variation elasticity thus tells

Jacob A. Bikker and Katharina Haaf .
Summer 2002 • Economic & Financial Modelling 30
us how the market structure has interacted with firms’ decisions to give us a measure that is more directly related to the objectives of policy makers (such as welfare). 3.2.2. The CRk in formal structure-performance models Another approach to the theoretical derivation of the SCP relationship has been proposed by, among others, Saving and Geroski (Reid, 1987) and assumes a k bank cartel with fringe competitors. Of the n banks in a market, k banks are acting as a cartel, and the remaining n-k banks are the competitive fringe in the industry. These n-k banks are price takers and equilibrate price and marginal cost, icp = , nki ),...,1( +=∀ , for profit maximising purposes. The supply of these banks can then be written as ( )pci
1− , so that the aggregate supply of the competitive
fringe is ( ) ∑ +=−
− =n
ki ikn pcpS1
1 )( . Industry demand is defined by ( )pDT , with ( ) 0<′ pDT . Under the conditions defined above, the k
bank cartel faces demand ( ) ( ) ( )pSpDpD knTk −−= , where ( ) 0>′− pS kn and ( ) 0<′ pDT . Differentiating the above equation and
dividing by ( ) ppDk yields ( ) ( ) ( ) ( )−′=′ pDppDpDppD rTkk //
( ) ( )pDppS rkn /−′ , which can be written as ×=Tk DD ηη
( ) ( ) ( ) ( )pDpSpDpD rknSrT kn// −−
−η , where kDη , TDη and knS −η
are, respectively, the elasticities with respect to price of residual demand, industry demand and fringe supply. For profit maximising reasons, the k bank cartel should, in line with the concept of the Lerner index, set its price-marginal cost margin equal to the reciprocal of the elasticity of its demand curve: (3.11)
( ) ( ) ( )kknSTD
k
kknknSkTTDkD
j
CC
DSDDpcp
−−=
−==
′−
−−−1
11ηηηηη
since kkT CDD /1/ = and kkkTkkn CDDDDS /1/)(/ =−=−
kk CC /)1(1 −=− . This result shows that the application of the CRk for empirical estimations of the S-P relationship is theoretically justified for a market with a k bank cartel and n-k

Measures of Competition and Concentration
Economic & Financial Modelling • Summer 2002 31
small banks. Hence, if we assume that the market is dominated by a cartel, in a S-P relationship, we should use CRk. 3.3. Concluding Remarks This section discussed formal and non-formal approaches to the relationships between market structure and market performance. The non-formal structure-performance paradigm and efficiency hypothesis, although lacking formal back up in micro-economic theory, have frequently been applied to the banking industry and provide policy makers by measures of market structure and performance as well as their interrelationship. The formal approaches presented give evidence of the appropriateness of the CRk and the HHI in the empirical application of structure-performance models. These formal relationships also state that bank conduct plays a role: CRk is based on the assumption of a k bank cartel, HHI presupposes that conduct can be described by conjectural variation and similar deductions hold for other concentration ratios. These interpretations help policy makers to select a measure of concentration appropriate to their needs. 4. Non-structural Measures of Competition This section discusses three non-structural measures of competition, namely the Iwata model, the Bresnahan model and the Panzar and Rosse approach. The derivations of the first two measures are based on the results obtained for the oligopoly profit-maximisation problem presented in Section 3. The Panzar and Rosse method is based on the comparative static properties of the reduced-form revenue approach. 4.1. The Iwata Model The Iwata model allows the estimation of conjectural variation values for individual banks supplying a homogeneous product in an oligopolistic market (Iwata, 1974). Although, to the best of our knowledge, this measure has been applied to the banking industry only once,22 it is included into the present overview for completeness. Defining the price elasticity of demand as
22 Shaffer and DiSalvo (1994) apply this model to a two-banks market.

Jacob A. Bikker and Katharina Haaf .
Summer 2002 • Economic & Financial Modelling 32
=Dη )/)(/( pxdXdp− , equation (3.5) can be written as −p ( ) ( ) 01)/)(/1( =′−+ iiiD xcxxp λη , which, by re-arranging yields:
(4.1) ( ) 1)/)(/)(( −−′= iiDi xXppxcηλ The numerical value of this conjectural variation will be obtained indirectly. Under the assumptions that p and Xxi are strict functions of exogenous variables, and that Dη , the elasticity of demand, is constant, the method involves the estimation of a market demand function and cost functions of individual banks to obtain a numerical value of the conjectural variation for each bank. The application of this model to the European banking industry is difficult, especially given the lack of micro-data for the structure of cost and production for homogeneous products of a large number of players in the European banking markets 4.2. The Bresnahan Model Bresnahan (1982) and Lau (1982) present a short-run model for the empirical determination of the market power of an average bank. Based on time-series of industry data, the conjectural variation parameter =λ ndxxd iji j /)/1( ∑ ≠
+ , with 10 ≤≤ λ ,
is determined by simultaneous estimations of the market demand and supply curves. Banks maximise their profits by equating marginal cost and perceived marginal revenue. The perceived marginal revenue coincides with the demand price in competitive equilibrium and with the industry’s marginal revenue in the collusive extreme (Shaffer, 1993). Under the bank equality assumption of the Bresnahan model, equation (3.5) can be rearranged to yield ( ) ( )ixcXXfp ′=′+ λ . Consistent with the statements about market forms and the corresponding conjectural variations in the introduction to this section, 0=λ for the average bank in a perfectly competitive market. Under Cournot equilibrium, 0=∑ ≠ iji j dxxd , so that n1=λ and ( ) =⋅+ nhp /
( )ixc′ , with ( ) ( )XXfh ′=⋅ , the semi-elasticity of market demand. ( ) ( )ixchp ′=⋅+ for perfect collusion since += 1(λ
=∑ ≠ndxxd iji j /) 1)/(/)/)(1( ==−+ iii nxxnxxX , i∀ .

Measures of Competition and Concentration
Economic & Financial Modelling • Summer 2002 33
Empirical applications of the Bresnahan model are rather scarce. It has been estimated by Shaffer (1989 and 1993) for, respectively, the US loan markets and for the Canadian banking industry. Suominen (1994) applied the model in its original one-product version to the Finnish loan market for the period 1960-84 during which the interest rates applied by banks were tightly regulated. Interest rates on loans were deregulated in August 1986, but interest rates on deposits remained effectively restricted until 1990. An adapted two-product version is applied to the Finnish loan market for the period after deregulation (September 1986-December 1989). Suominen finds coefficient estimates for δ which are close to zero and not significantly different from zero at the 5 per cent level for the period with regulated interest rates in both markets, and values of δ indicating use of market power after the deregulation of the loan market. Swank (1995) estimated Bresnahan’s model to obtain the degree of competition in the Dutch loan and deposit markets over the period 1957-1990, and found that both markets were significantly more oligopolistic than in Cournot equilibrium. Bikker (2002) tested nine European deposit and loan banking markets and could not rejected perfect competition. 4.3. The Panzar and Rosse Approach The method developed by Panzar and Rosse (1987) determines the competitive behaviour of banks on the basis of the comparative static properties of reduced-form revenue equations based on cross-section data. Panzar and Rosse (PR) show that if their method is to yield plausible results, banks need to have operated in a long-term equilibrium (i.e. the number of banks needs to be endogenous to the model) while the performance of banks needs to be influenced by the actions of other market participants. Furthermore, the model assumes a price elasticity of demand, e, greater than unity, and a homogeneous cost structure. To obtain the equilibrium output and the equilibrium number of banks, profits are maximised at the bank as well as the industry level. That means, first, that bank i maximises it profits where marginal revenue equals marginal cost:
Jacob A. Bikker and Katharina Haaf .
Summer 2002 • Economic & Financial Modelling 34
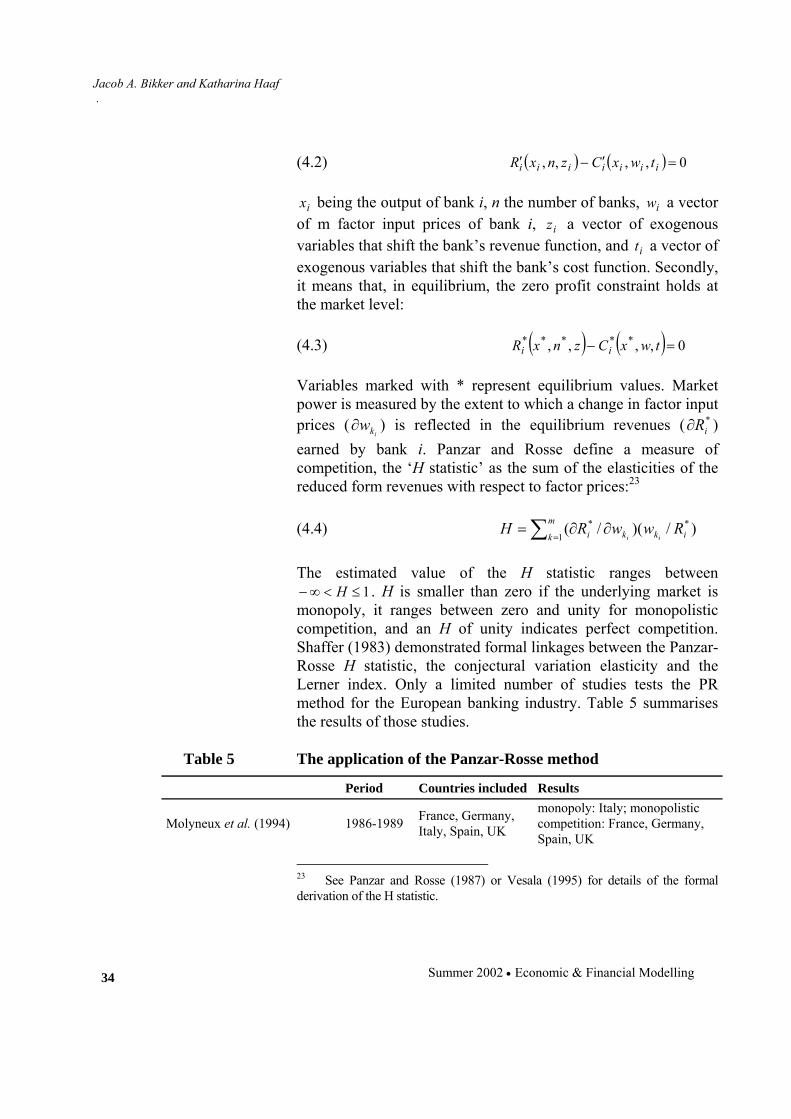
(4.2) ( ) ( ) 0,,,, =′−′ iiiiiii twxCznxR
ix being the output of bank i, n the number of banks, iw a vector of m factor input prices of bank i, iz a vector of exogenous variables that shift the bank’s revenue function, and it a vector of exogenous variables that shift the bank’s cost function. Secondly, it means that, in equilibrium, the zero profit constraint holds at the market level: (4.3) ( ) ( ) 0,,,, ***** =− twxCznxR ii Variables marked with * represent equilibrium values. Market power is measured by the extent to which a change in factor input prices (
ikw∂ ) is reflected in the equilibrium revenues ( *iR∂ )
earned by bank i. Panzar and Rosse define a measure of competition, the ‘H statistic’ as the sum of the elasticities of the reduced form revenues with respect to factor prices:23 (4.4) )/)(/( *
1*
ikkm
k i RwwRHii
∂∂= ∑ =
The estimated value of the H statistic ranges between
1≤<∞− H . H is smaller than zero if the underlying market is monopoly, it ranges between zero and unity for monopolistic competition, and an H of unity indicates perfect competition. Shaffer (1983) demonstrated formal linkages between the Panzar-Rosse H statistic, the conjectural variation elasticity and the Lerner index. Only a limited number of studies tests the PR method for the European banking industry. Table 5 summarises the results of those studies.
Table 5 The application of the Panzar-Rosse method Period Countries included Results
Molyneux et al. (1994) 1986-1989 France, Germany, Italy, Spain, UK
monopoly: Italy; monopolistic competition: France, Germany, Spain, UK
23 See Panzar and Rosse (1987) or Vesala (1995) for details of the formal derivation of the H statistic.

Measures of Competition and Concentration
Economic & Financial Modelling • Summer 2002 35
Vesala (1995) 1985-1992 Finland monopolistic competition for all but two years
Molyneux et al. (1996) 1986-1988 Japan monopoly Coccorese (1998) 1988-1996 Italy monopolistic competition Rime (1999) 1987-1994 Switzerland monopolistic competition Bikker and Groeneveld (2000) 1989-1996 EU-15 countries monopolistic competition
De Bandt and Davis (2000) 1992-1996 France, Germany, Italy
large banks: monopolistic competition in all countries small banks: monopolistic competition in Italy; monopoly in France, Germany
Bikker and Haaf (2002) 1988-1998 23 OECD countries monopolistic competition
Molyneux et al. (1994) tested the PR statistic on a sample of French, German, Italian, Spanish and British banks for the period 1986-1989 in order to assess the competitive conditions in major EC banking markets. They obtain values for H which are not significantly different from zero and from unity for France, Germany (except for 1987), Spain and the UK, thus pointing to monopolistic competition. The H-statistic for Italy during 1987-1989 is negative and significantly different from zero; it was therefore not possible to reject the hypotheses of monopoly.
Vesala (1995) applies the model to the Finnish banking industry (1985-1992) to test for competition and market power in the Finnish banking sector; his estimates of H were always positive, but significantly different from zero and from unity only in 1989 and 1990. Coccorese (1998), however, who also intends to evaluate the degree of competition in the Italian banking sector, obtains significantly non-negative values for H. H was also significantly different from unity, except in 1992 and 1994. For Switzerland, Rime (1999) observed monopolistic competition. Bikker and Groeneveld (2000) determine the competitive structure of the whole EU banking industry. The estimated values for the H-statistic lie between two-third and one in most countries. The hypothesis 0=H is rejected for all countries, whereas 1=H cannot be rejected for Belgium and Greece at the 95% confidence level. De Brandt and Davis (2000) investigate banking markets in France, Germany and Italy within groups of large and small banks. Aiming to assess the effects of EMU on market conditions, they obtain estimates of H, which are significantly different from zero and from unity for large banks in
Jacob A. Bikker and Katharina Haaf .
Summer 2002 • Economic & Financial Modelling 36
all three countries. The H statistics estimated for the sample with small banks indicate monopolistic competition in Italy, and monopoly power in France and Germany. Bikker and Haaf (2002) consider small, medium-sized and large banks in 23 countries, finding monopolistic competition virtually everywhere, although perfect competition could not be rejected for some market segments.
5. Conclusions This article surveys the various approaches to the measurement of concentration and competition, which are fundamental for welfare-related public policy toward structure and conduct in banking markets. The presentation and analysis of ten measures of concentration was supplemented by numerical examples illustrating their properties when applied empirically. The choice of the concentration index is mainly dependent on the policy makers’ perception of the relative influence on competition attached to large and small banks. The Herfindahl-Hirschman Index and the k bank concentration ratio appear most frequently, both in theory and practice. The simple structure of these indices and the limited data requirement of the CRk contribute to this success. Applied to various markets, these indices appear to bring forth virtually similar rankings, which adds to their suitability in practise. The theoretical justification of the CRk and the HHI as measures of concentration was derived in connection with the relationship between market structure and market performance. These analyses also elucidate the assumed bank conduct underlying these concentration ratios.
The structure-performance relationship, a simplified version of the traditional SCP paradigm, and the efficiency hypothesis integrate measures of concentration and competition. Formal derivations of this class of relationships provide evidence of the theoretical appropriateness of both the HHI and the kCR as measures of concentration in structural models. Various types of empirical applications of the S-P relationship, seeking to find support for either the SCP model or the efficiency hypothesis,

Measures of Competition and Concentration
Economic & Financial Modelling • Summer 2002 37
were discussed. As was the case for the US, applications of these tests to the European banks have not yielded clear-cut results.
Three non-structural measures of competition were presented. Their derivations are based on oligopoly theory of the Industrial Organisations approach (Bresnahan and Iwata model) or on the comparative static properties of reduced form revenue equations (Panzar and Rosse approach). Whereas both the Bresnahan and the Panzar and Rosse methods were applied to the European banking industry, the application of the Iwata model posed difficulties, given the lack of required micro-data on the structure of cost and production of a large number of players in the European banking markets. Since studies applying the Bresnahan method to European markets are scarce, no trends may be observed in their results. Monopolistic competition is the prevailing outcome in the studies applying the Panzar and Rosse method to European countries.
REFERENCES
[1] Adelman, M.A. (1951), The Measurement of Industrial Concentration, Review of Economics and Statistics 33, 269-296.
[2] Adelman, M.A. (1969), Comment on the ‘H’ Concentration Measure as a Numbers Equivalent, Review of Economics and Statistics 51, 99-101.
[3] Bikker, J.A., J.M. Groeneveld (2000), Competition and Concentration in the EU Banking Industry, Kredit und Kapital 33, 62-98.
[4] Bikker, J.A., K. Haaf (2002), Competition, concentration and their relationship: an empirical analysis of the banking industry, Journal of Banking & Finance (forthcoming).
[5] Bikker, J.A. (2002), Testing for imperfect competition on the EU deposit and loan markets with Bresnahan’s market power model, Kredit und Kapital (forthcoming).
[6] Bos J. (2002), European banking: Market Power and Efficiency, University Pers Maastricht.

Jacob A. Bikker and Katharina Haaf .
Summer 2002 • Economic & Financial Modelling 38
[7] Bresnahan, T.F. (1982), The Oligopoly Solution Concept is Identified, Economic Letters 10, 87-92.
[8] Bresnahan, T.F. (1989), Empirical Studies of Industries with Market Power, in: Schmalensee, R., Willig, R.D. (Eds), Handbook of Industrial Organisation, Volume II, 1012-1055.
[9] Büschgen, H.E. (1993), Bankbetriebslehre, Gabler, Wiesbaden.
[10] Calem, P.S., G.A. Carlino (1991), The Concentration-Conduct Relationship in Bank Deposit Markets, Review of Economics and Statistics 73, 268-276.
[11] Cetorelli, N. (1999), Competitive Analysis in Banking: Appraisal of the methodologies, Economic Perspectives, Federal Reserve Bank of Chicago, 2-15.
[12] Coccorese, P. (1998), Assessing the Competitive Conditions in the Italian Banking System: Some Empirical Evidence, BNL Quarterly Review 205, 171-191.
[13] Cowell, F.A. (1977), Measuring Inequality, Oxford, Phillip Allan.
[14] Cowling, K.G. (1976), On the Theoretical Specification of Industrial Structure-performance Relationships, European Economic Review 8, 1-14.
[15] Cowling, K.G., M. Waterson (1976), Price-Cost Margins and Market Structure, Economica 43, 267-274.
[16] Davies, S.W. (1979), Choosing between Concentration Indices: The Iso-Concentration Curve, Economica 46, 67-75.
[17] Davies, S.W. (1980), Measuring Industrial Concentration: An Alternative Approach, Review of Economics and Statistics 62,306-309.
[18] De Bandt, O., E.P. Davis (2000), Competition, Contestability and Market Structure in European Banking Sectors on the Eve of EMU, Journal of Banking & Finance 24, 1045-1066.
[19] Deppe, H.-D. (1978), Bankbetriebliches Lesebuch, C.E. Poeschel Verlag, Stuttgart.

Measures of Competition and Concentration
Economic & Financial Modelling • Summer 2002 39
[20] Demsetz, H., (1973), Industry Structure, Market Rivalry and Public Policy, Journal of Law and Economics 16, 1-10.
[21] Dickson, V.A. (1981), Conjectural Variation Elasticities and Concentration, Economics Letters 7, 281-285.
[22] Gilbert, R.A. (1984), Bank Market Structure and Competition – A Survey, Journal of Money, Credit and Banking 19, 617-645.
[23] Hall, M., N. Tideman (1967), Measures of Concentration, American Statistical Association Journal, 162-168.
[24] Hannah, L., J.A. Kay (1977), Concentration in Modern Industry, MacMillan Press, London.
[25] Hart, P.E. (1975), Moment Distribution in Economics: An Exposition, The Journal of the Royal Statistical Society, series A, 138, 423-434.
[26] Hause, J.C. (1977), The Measurement of Concentrated Industrial Structure and the Size Distribution of Firms, Annals of Economic and Social Measurement 6, 73-107.
[27] Horvarth, J. (1970), Suggestion for a Comprehensive Measure of Concentration, Southern Economic Journal 36, 446-452.
[28] Iwata, G. (1974), Measurement of Conjectural Variations in Oligopoly, Econometrica 42, 947-966.
[29] Kellerer, H. (1960), Zur statistischen Messung der Konzentration, in: H. Arndt (ed.), Die Konzentration in der Wirtschaft, Schriften des Vereins für Sozialpolitik, N.S., 20/I, 41-68.
[30] Kottmann, G. (1974), Die Bewertung der Konzentration in der Kreditwirtschaft, Verlag Harri Deutsch, Frankfurt and Zürich.
[31] Kwoka, J. (1985), The Herfindahl Index in Theory and Practice, Antitrust Bulletin 30, 915-947.
[32] Lau, L. (1982), On Identifying the Degree of Competitiveness from Industry Price and Output Data, Economic Letters 10, 93-99.

Jacob A. Bikker and Katharina Haaf .
Summer 2002 • Economic & Financial Modelling 40
[33] Lloyd-Williams, D.M, P. Molyneux, J. Thornton, (1994), Market Structure and Performance in Spanish Banking, Journal of Banking & Finance 18, 433-443.
[34] Marfels, C. (1971a), Absolute and Relative Measures of Concentration Reconsidered, Kyklos 24, 753-766.
[35] Marfels, C. (1971b), A Guide to the Literature on the Measurement of Industrial Concentration in the Post-War Period, Zeitschrift für Nationalökonomie 31, 483-505.
[36] Martin, S. (1993), Advanced Industrial Economics, Blackwell, New York and Oxford.
[37] Molyneux, P., D.M. Lloyd-Williams and J. Thornton (1993), Competitive Conditions in European Banking, Journal of Banking & Finance 18, 445-459.
[38] Molyneux, P., W. Forbes (1995), Market Structure and Performance in European Banking, Applied Economics 27, 155-159.
[39] Molyneux, P., Y. Altunabas, E. Gardener (1996), Efficiency in European Banking, John Wiley & Sons Ltd.
[40] Niehans, H. (1961), Round-Table-Gespräch über Messung der industriellen Konzentration, in: F. Neumark (ed.), Die Konzentration in der Wirtschaft, Schriften des Vereins für Sozialpolitik, N.S., 22, 367-395.
[41] Panzar, J.C., J.N. Rosse (1987), Testing for ‘Monopoly’ Equilibrium, Journal of Industrial Economics 35, 443-456.
[42] Peltzman, S. (1977), The Gains and Losses from Industrial Concentration, Journal of Law and Economics 20, 229-263.
[43] Reid, G.C. (1987), Theories of Industrial Organization, Blackwell, New York and Oxford.
[44] Rhoades, S.A. (1995), Market Share Inequality, the HHI, and other Measures of the Firm Composition of a Market, Review of Industrial Organization 10, 657-674.
[45] Rime, B. (1999), Mesure de degré de concurrence dans le système bancaire Suisse à l’aide du modèle de Panzar et Rosse, Revue Suisse d’Economie Politique et de Statistique 135, 21-40.

Measures of Competition and Concentration
Economic & Financial Modelling • Summer 2002 41
[46] Rosenbluth, G. (1955), Measures of Concentration, in Business Concentration and Price Policy, National Bureau Committee for Economic Research, Princeton, 57-99.
[47] Saving, T.R. (1970), Concentration Ratios and the Degree of Monopoly, International Economic Review 11, 139-146.
[48] Shaffer, S. (1983), Non-structural Measures of Competition, Economic Letters 12, 349-353.
[49] Shaffer, S. (1989), Competition in the US Banking Industry, Economic Letters 29, 321-323.
[50] Shaffer, S. (1993), A Test of Competition in Canadian Banking, Journal of Money, Credit, and Banking 25, 49-61.
[51] Shaffer, S., J. DiSalvo (1994), Conduct in a Banking Duopoly, Journal of Banking & Finance 18, 1063-1082.
[52] Scherer, F.M., D. Ross (1990), Industrial Market Structure and Economic Performance, Houghton Mifflin, Boston.
[53] Stigler, G.J. (1964), A Theory of Oligopoly, Journal of Political Economy 72, 44-61.
[54] Suominen, M. (1994), Measuring Competition in Banking: A Two-Product Model, Scandinavian Journal of Economics 96, 95-110.
[55] Swank, J. (1995), Oligopoly in Loan and Deposit Markets: An Econometric Application to the Netherlands, De Economist 143, 353-366.
[56] Theil, H. (1967), Economics and Information Theory, Studies in Mathematical and Managerial Economics 7, Noord-Holland Publishing Company.
[57] Vesala, J. (1995), Testing for Competition in Banking: Behavioral Evidence from Finland, Bank of Finland Studies, E:1.
[58] Weiss, L.W. (1989), Concentration and Price, MIT Press, Cambridge (Mass.) and London.
[59] White, A.P. (1982), A Note on Market Structure Measures and the Characteristics of the Markets that they ‘Measure’, Southern Economic Journal, 542-549.
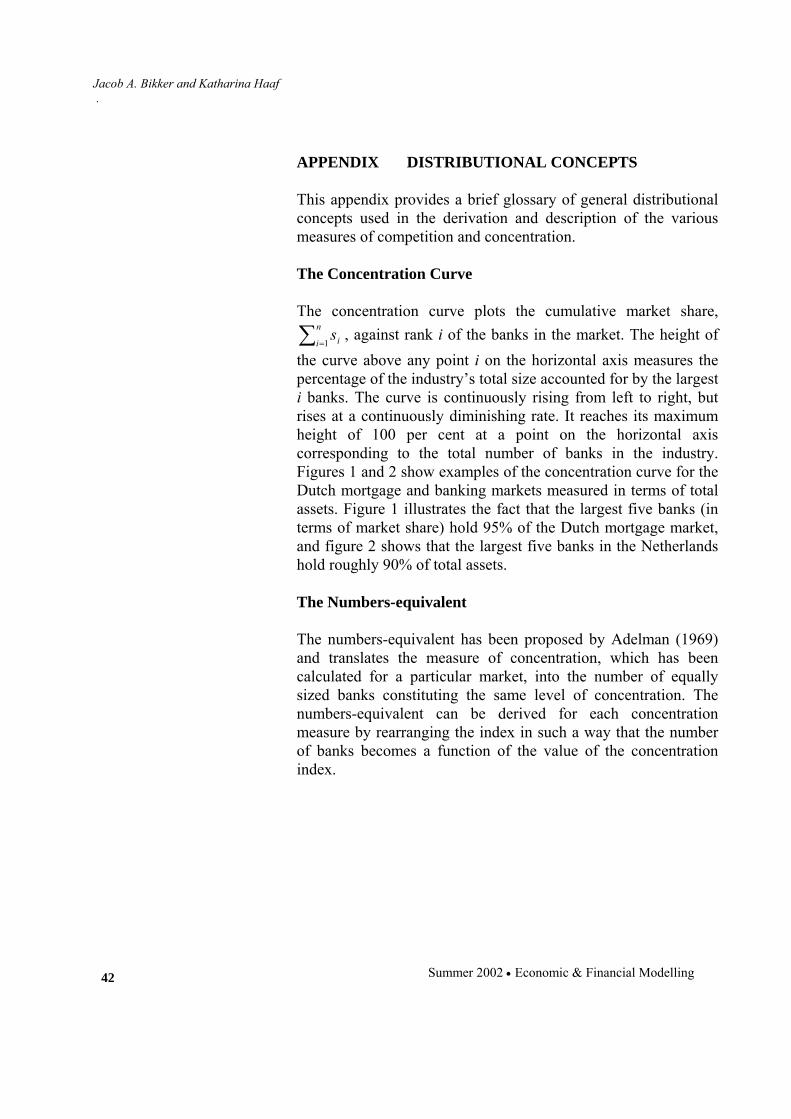
Jacob A. Bikker and Katharina Haaf .
Summer 2002 • Economic & Financial Modelling 42
APPENDIX DISTRIBUTIONAL CONCEPTS This appendix provides a brief glossary of general distributional concepts used in the derivation and description of the various measures of competition and concentration. The Concentration Curve The concentration curve plots the cumulative market share,
∑=
n
i is1
, against rank i of the banks in the market. The height of the curve above any point i on the horizontal axis measures the percentage of the industry’s total size accounted for by the largest i banks. The curve is continuously rising from left to right, but rises at a continuously diminishing rate. It reaches its maximum height of 100 per cent at a point on the horizontal axis corresponding to the total number of banks in the industry. Figures 1 and 2 show examples of the concentration curve for the Dutch mortgage and banking markets measured in terms of total assets. Figure 1 illustrates the fact that the largest five banks (in terms of market share) hold 95% of the Dutch mortgage market, and figure 2 shows that the largest five banks in the Netherlands hold roughly 90% of total assets. The Numbers-equivalent The numbers-equivalent has been proposed by Adelman (1969) and translates the measure of concentration, which has been calculated for a particular market, into the number of equally sized banks constituting the same level of concentration. The numbers-equivalent can be derived for each concentration measure by rearranging the index in such a way that the number of banks becomes a function of the value of the concentration index.

Measures of Competition and Concentration
Economic & Financial Modelling • Summer 2002 43
0102030405060708090
100
0 1 2 3 4 5 6 7 8 9 10 11 12 13 14 15 16
i
Figure 1: Concentration curve of mortgages in the Dutch banking industry
0102030405060708090
100
0 10 20 30 40 50 60 70 80
i
Figure 2: Concentration curve of total assets in the Dutch banking industry The Lerner Index The Lerner index μ, or degree of monopoly power, expresses market power as the difference between the output price and marginal cost in the profit maximum divided by the output price. Profits are maximised where marginal revenues equal marginal costs )(')(' XrXc = , with ( ) ( )XdXdppXr +=' , such that
( ) ( )XdXdpXcp −=− ' , and the Lerner index is then defined as: (A.1) DpXdXdppXcp ημ 1)(/))('( −=−=−=

Jacob A. Bikker and Katharina Haaf .
Summer 2002 • Economic & Financial Modelling 44
0=μ indicates perfect competition, since in equilibrium ( ) ( )XrXcp '' == .
The Lorenz Curve The Lorenz curve measures the cumulative percentages of output accounted for by various percentages of the number of banks, and therefore describes the inequality rather than the concentration of the banks’ market shares. Figure 3 illustrates the size inequality of the banks in the Dutch banking sector measured in terms of total assets, and shows that 95% of the banks in the Netherlands account for roughly 16% of total assets. The Lorenz curve and the cumulative concentration curve differ in two respects. First, the cumulative concentration curve measures the cumulative number of banks along the x-axis, whereas the Lorenz curve measures the cumulative percentages of banks. Second, the cumulative concentration curve ranks the banks starting with the largest; in contrast, the Lorenz curve ranks the banks starting with the smallest bank in the market. Both curves will be affected by a change in a bank’s market share.
0
0,1
0,2
0,3
0,4
0,5
0,6
0,7
0,8
0,9
1
0 0,1 0,2 0,3 0,4 0,5 0,6 0,7 0,8 0,9 1
Cumulative % of firms
Cum
ulat
ive
% o
f out
put
Figure 3: Lorenz curve for the Dutch banking sector The Gini Coefficient

Measures of Competition and Concentration
Economic & Financial Modelling • Summer 2002 45
The Gini coefficient (G), a measure of inequality,24 is defined as the ratio of the area enclosed by the Lorenz curve and the diagonal representing equality in distribution (A) and the entire area under this diagonal (A+B) in Figure 3, hence
( )BAAG += . The maximum value on both axes is 1, so that the area embraced by the diagram yields unity. Hence,
21=+ BA , and AG 2= . The Entropy Consider a set of events iE , where ni ,...,1= . Exactly one of these events will occur with probability ix , where ni ,...,1= , and
11
=∑ =
n
i ix . The information content of a realised event is a decreasing function of the ex-ante probability of its occurrence, and is generally defined as ( ) ( ) == ii xxh 1log ixlog− . The expected information content for all events can then be calculated before the realisation of an event. Since iE has probability ix , the message that iE occurs will be received with the same probability, so that the information content will be ( )ixh with probability ix . The expected information content of a realised
event is therefore ( ) ∑∑ ==−==
n
i iin
i ii xxxhxxH11
log)( , where x on the left stands for the array of the n probabilities ix (Theil, 1967). The Entropy as a measure of concentration has been presented in this article on the basis of a logarithm with base 2, as proposed by White (1982). This logarithm can be transformed into the natural logarithm as 2lnlnlog2 ii ss = , so that: (A.2) ∑∑ ==
−=−=n
i iin
i ii ssssE11 2 ln)2ln/1(log
and likewise into other logarithm bases. Coefficient of variation
24 An extensive overview of measures of inequality has been given by Cowell (1995). Only the concepts of importance within the context of this article will be briefly discussed here.

Jacob A. Bikker and Katharina Haaf .
Summer 2002 • Economic & Financial Modelling 46
The coefficient of variation is defined as xVc = , where x is the mean bank size and V, the variance, is defined as
nxxV n
i i /)(1
2∑ =−= . Unlike the variance, the coefficient of
variation remains unchanged if the sizes of all banks are increased proportionately.