measurements of the marine atmospheric boundary layer and air
TRANSCRIPT

1
Ben Reineman, Scripps Institution of Oceanography
SCOAR Meeting4 June 2014
Measurements of the marine atmospheric boundary
layer and air-sea interaction from ship-launched
ScanEagle UAVs
Collaborators:Ken Melville (SIO)
Luc Lenain (SIO)
Nick Statom (SIO)
Lorenz Eber, Cyrus Roohi et al. (NSWCDD)
photo: J. Smith photo: ScanEagle
EquatorMix
2012
Trident
Warrior 2013
http://airsea.ucsd.edu

2
• Coupling of atmospheric and oceanic boundary layers plays an important role in local
and global fluxes of mass, momentum, and energy
• Transfers actively modulated by the surface wave field
• Wind forcing injects energy into the wave field
– Mixes surfaces waters
– Directly influences turbulent heat transfer
• Wave breaking:
– Energy transferred to currents and turbulence
– Also important for gas transfer and aerosol generation
• Air-sea fluxes are not well understood, especially in high wind and wave environments
(e.g., high latitudes, extreme conditions)
Overview of air-sea interaction and surface processes
NSF/NCAR C130 (2004 GOTEX)
Piper Twin Comanche(2007 – )
ScanEagle(2012 – )
• Aircraft provide an efficient way to measure meter
to mesoscale processes over large spatial ranges
• To measure surface fluxes, need to be close to the
surface (≤30 m)
• Transition to smaller, lighter, safer platforms
• Unmanned Aerial Vehicles: safety, endurance, ship-
launched (remote locations)
U10 = 15 m/s, Hs = 3.6 m
photo: P. Sutherland
Twin Otter (L. Lenain)

3
“Flux” payload: wind, momentum and scalar flux measurements
• Fast-response turbulence probe (3D wind) + temperature, water vapor sensors
• Calibration: wind tunnel + in-flight maneuvers (Reineman et al. 2013)
• Main purpose: measure momentum and scalar heat fluxes
• Also includes: point lidar, GPS/Inertial Measurement Unit (IMU), data acquisition
Turbulence probe
Fast-response temperature sensor
Nadir lidar
SST T, RH
Fast-response water vapor sensor
Fast-response temperature sensor
0.170 mm diameter
Turbulence probe
2 – 3 kg payload, >11 hrs endurance22-kg max takeoff weight
Comparison of measured vertical wind spectra between turbulence probe and CSAT sonic anemometer
Frequency (Hz)
Sw
w(m
2s-
1)
Boeing-Insitu ScanEagle

4
UAV “stacked" flight configuration, measured parameters
• Coincident remote sensing and measurements of energy and momentum fluxes
30 m altitude
FLUXMet. package (P,T,RH)Turbulence probe (u,v,w)Fast-response temp., H2O vapor
Video Footprint
RF linkto base station
(navigation and control, down-sampled measurements)
for wave measurements
Momentum flux, latent and sensible heat flux
Point lidar
Met. package (P,T,RH)Large field-of-view visible and infrared video (IMAGING)Radiometers (RADIOMETRIC)
300 m altitude
5
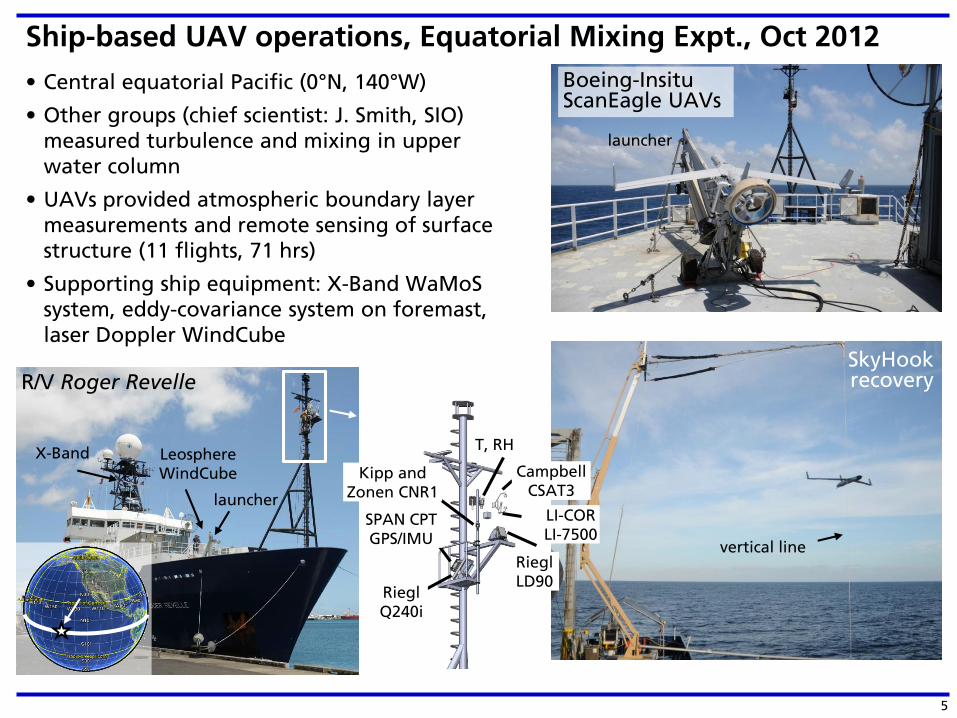
Ship-based UAV operations, Equatorial Mixing Expt., Oct 2012
• Central equatorial Pacific (0°N, 140°W)
• Other groups (chief scientist: J. Smith, SIO)
measured turbulence and mixing in upper
water column
• UAVs provided atmospheric boundary layer
measurements and remote sensing of surface
structure (11 flights, 71 hrs)
• Supporting ship equipment: X-Band WaMoS
system, eddy-covariance system on foremast,
laser Doppler WindCube
Boeing-Insitu ScanEagle UAVs
SkyHookrecoveryR/V Roger Revelle
vertical line
launcher
launcher
Campbell
CSAT3
LI-COR
LI-7500
T, RH
Riegl Q240i
Riegl
LD90
SPAN CPT GPS/IMU
Kipp and
Zonen CNR1
Leosphere WindCube
X-Band

7
Ship-based UAV operations
Scientific payload monitoring workstation
UAV pilot workstations“point-and-click” flying
Ground Control Station (GCS)
Tracking antenna (100 km line-of-sight)
Night operations
Inside the Ground Control Station:
ScanEagle
8
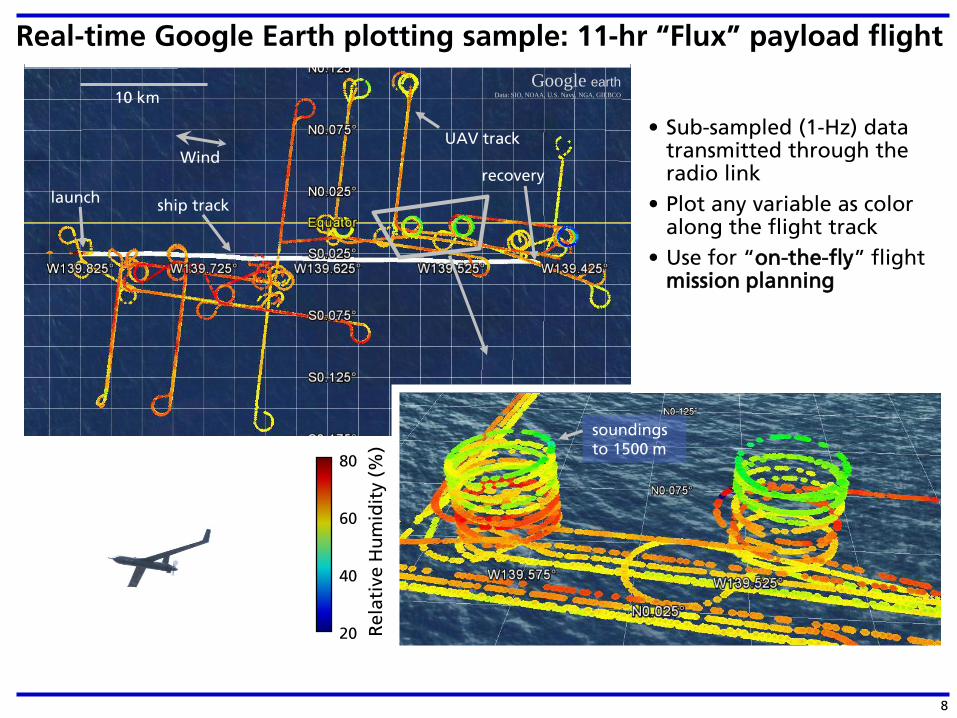
Real-time Google Earth plotting sample: 11-hr “Flux” payload flight
• Sub-sampled (1-Hz) data transmitted through the radio link
• Plot any variable as color along the flight track
• Use for “on-the-fly” flight mission planning
Google earthData: SIO, NOAA, U.S. Navy, NGA, GIEBCO
ship tracklaunch
recovery
10 km
UAV trackWind
80
60
40
20 Re
lati
ve H
um
idit
y (
%)
soundings
to 1500 m
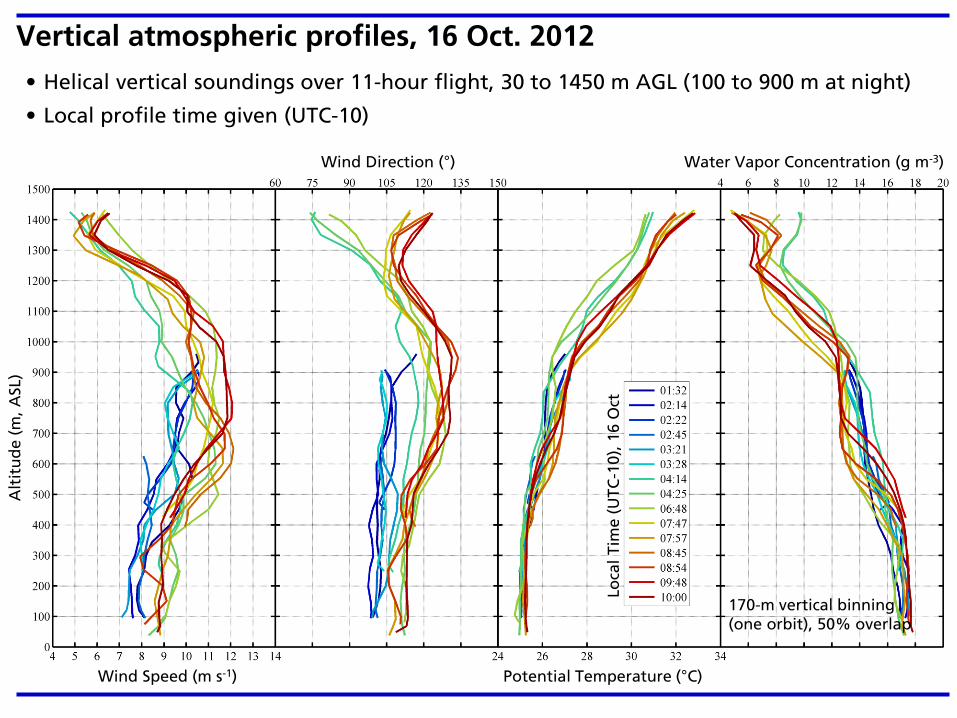
Vertical atmospheric profiles, 16 Oct. 2012
• Helical vertical soundings over 11-hour flight, 30 to 1450 m AGL (100 to 900 m at night)
• Local profile time given (UTC-10)
Lo
cal
Tim
e (
UT
C-1
0),
16
Oct
Alt
itu
de
(m
, A
SL)
Wind Speed (m s-1) Potential Temperature (°C)
Wind Direction (°) Water Vapor Concentration (g m-3)
170-m vertical binning (one orbit), 50% overlap
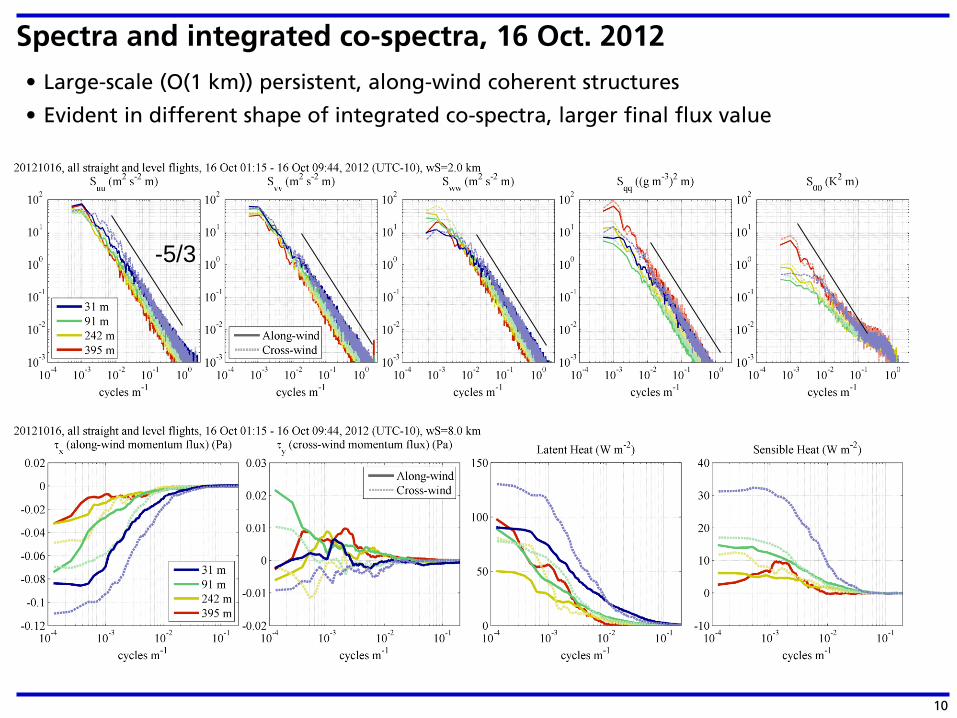
Spectra and integrated co-spectra, 16 Oct. 2012
10
• Large-scale (O(1 km)) persistent, along-wind coherent structures
• Evident in different shape of integrated co-spectra, larger final flux value
-5/3

Vertical flux profiles, 16 Oct. 2012• Red: crosswind flight segments, Blue: up/downwind; 8-km windowing (~5 minutes)
• Gray: vertical helical soundings (1500-m diameter), half-orbit windows (83-s)
• Atmospheric rolls on this day; generally larger fluxes from cross-wind segments
• U10 = 7 – 9 m/s, HBL ≈ 400 m; data from 11 flight-hrs, midnight to 11am LT
11
Alt
itu
de
(m
, A
SL)
τx (along-wind momentum flux) (Pa) Latent heat flux (W m-2)u* (m s-1) Sensible heat flux (W m-2)

14
Trident Warrior (July 2013, Norfolk, VA)
• Employ unmanned systems in forward operating areas: demonstration experiment
aboard R/V Knorr
• Autonomous vehicles:
Instrumented Wavegliders (SPAWAR), SLOCUM (OSU), ScanEagles (SIO, NSWCDD),
met. and wave buoys (NPS, SIO), profiling balloon and kite radiosondes (NSWCDD, NPS)
• Science objectives, measurements:
– Time-varying 3D structure of MABL (vert. profiles wind, temp, humidity)
– Response of MABL to SST, subsurface structure, and visa versa
– Real-time data assimilation of measurements into Coupled Ocean/Atmosphere
Prediction System (COAMPS) (SIO, NPS, NRL)
– Electromagnetic propagation monitoring, model evaluation (SPAWAR, SIO)
http://auvac.org
TW13
SIO
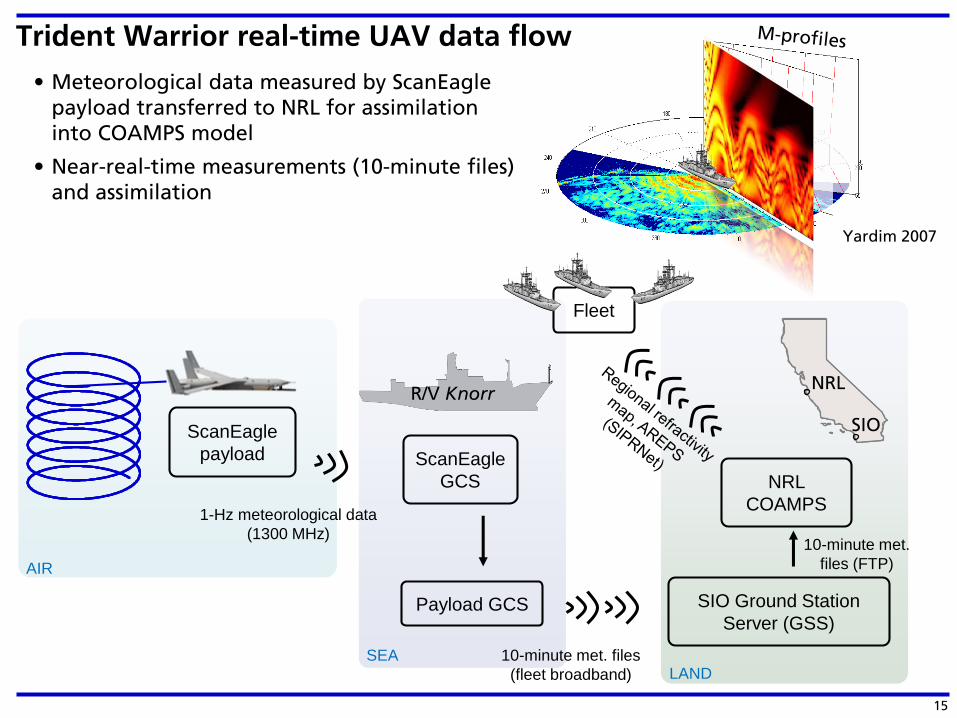
Trident Warrior real-time UAV data flow
15
ScanEagle
payload ScanEagle
GCS
NRL
Payload GCS
R/V Knorr
SIO Ground Station
Server (GSS)
NRL
COAMPS
10-minute met. files
(fleet broadband)
10-minute met.
files (FTP)
1-Hz meteorological data
(1300 MHz)
Yardim 2007
Fleet
• Meteorological data measured by ScanEagle
payload transferred to NRL for assimilation
into COAMPS model
• Near-real-time measurements (10-minute files)
and assimilation
AIR
SEALAND

Long-wave infrared imagery during stacked flight (Trident Warrior)
16
FLUX data:
IR image:
+0.2
0
-0.2
ΔT
(°C
)
• Sample infrared imagery sequence
during TW13
• Stacked flight: FLUX at 100 m ASL,
IMAGING at 910 m ASL
• Surface signatures of internal waves,
generated at Chesapeake Bay inlet
(30 km to the NW)
Photograph of X-Band display
Photograph from Knorr
7/14 1640 LT
7/14 1649 LT
36.7784 N, 75.8100 W
ScanEagle NoseCam 7/14 1704 LT
IW packet propagation
N
IMAGING payload: FLIR
A325 LWIR
Camera FLUX
17
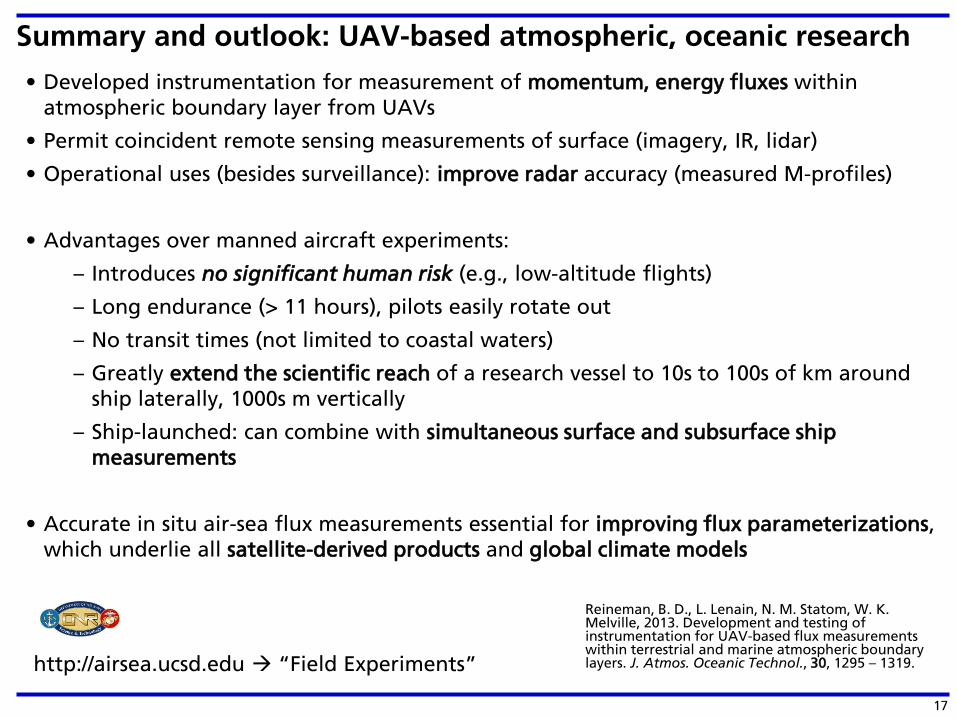
Summary and outlook: UAV-based atmospheric, oceanic research
• Developed instrumentation for measurement of momentum, energy fluxes within
atmospheric boundary layer from UAVs
• Permit coincident remote sensing measurements of surface (imagery, IR, lidar)
• Operational uses (besides surveillance): improve radar accuracy (measured M-profiles)
• Advantages over manned aircraft experiments:
– Introduces no significant human risk (e.g., low-altitude flights)
– Long endurance (> 11 hours), pilots easily rotate out
– No transit times (not limited to coastal waters)
– Greatly extend the scientific reach of a research vessel to 10s to 100s of km around
ship laterally, 1000s m vertically
– Ship-launched: can combine with simultaneous surface and subsurface ship
measurements
• Accurate in situ air-sea flux measurements essential for improving flux parameterizations,
which underlie all satellite-derived products and global climate models
Reineman, B. D., L. Lenain, N. M. Statom, W. K. Melville, 2013. Development and testing of instrumentation for UAV-based flux measurements within terrestrial and marine atmospheric boundary layers. J. Atmos. Oceanic Technol., 30, 1295 – 1319. http://airsea.ucsd.edu “Field Experiments”

18
Photo composite: San Nguyen