measurements of 60co in massive steel samples exposed to the
TRANSCRIPT

Measurements of 60Co in massive steel samples exposed to the Hiroshima atomic
bomb explosion
J. Gasparro, M. Hult, G. MarissensM. Hoshi, K. Tanaka, S. Endo
M. Laubenstein
EUR 24146 EN - 2010

The mission of the JRC-IRMM is to promote a common and reliable European measurement system in support of EU policies. European Commission Joint Research Centre Institute for Reference Materials and Measurements Contact information Address: Retieseweg 111 E-mail: [email protected] Tel.: +32-(0)14-571 269 Fax: +32-(0)14-571 864 http://irmm.jrc.ec.europa.eu/ http://www.jrc.ec.europa.eu/ Legal Notice Neither the European Commission nor any person acting on behalf of the Commission is responsible for the use which might be made of this publication.
Europe Direct is a service to help you find answers to your questions about the European Union
Freephone number (*):
00 800 6 7 8 9 10 11
(*) Certain mobile telephone operators do not allow access to 00 800 numbers or these calls may be billed.
A great deal of additional information on the European Union is available on the Internet. It can be accessed through the Europa server http://europa.eu/ JRC 56541 EUR 24146 EN ISBN 978-92-79-14851-4 ISSN 1018-5593 DOI 10.2787/22773 Luxembourg: Office for Official Publications of the European Communities © European Communities, 2010 Reproduction is authorised provided the source is acknowledged Printed in Belgium

Measurements of 60Co in massive steel samples exposed to the Hiroshima atomic bomb explosion
J. Gasparro, M. Hult, G. Marissens European Commission, Joint Research Centre,
Institute for Reference Materials and Measurements Retieseweg 111
2440 Geel, Belgium
M. Hoshi, K. Tanaka, S. Endo Research Institute for Nuclear Medicine and Biology,
Hiroshima University 1-2-3 Kasumi Minami-ku, Hiroshima 734, Japan
M. Laubenstein Laboratori Nazionali del Gran Sasso, INFN
S.S. 17/bis km 18+910 I-67010 Assergi (AQ), Italy


1
Executive Summary Man's knowledge on the effect of ionising radiation is to a large extent based on follow-ups of Hiroshima victims. It is of utmost importance that the dose they received from neutrons from the A-bomb in 1945 be estimated as accurately as possible. Regular re-assessments of the dose received by Hiroshima victims have been performed ever since 1945. In the assessment from 1986 (Dosimetry System 1986, DS86) there were big discrepancies between model calculations and measurements of 60Co induced in steel samples from distances >1000 m (long range) from the epicentre. The 5.2 y half-life of 60Co means that the massic activity in steel samples from Hiroshima is extremely low nowadays. Therefore it is necessary to measure the 60Co from steel samples in a semideep or deep underground laboratory and to use massive samples in order to reach low detection limits for the massic activity (measured in mBq/kg). This report gives the details of measurements of 14 steel samples from Hiroshima. The sample selection carried out by Hiroshima University was an essential and a very complex task, as it is important to know that the samples in question were present in 1945 and to understand what other structures could possibly have been shadowing the steel. The details of the sample selection process are, however, not dealt with in detail in this report. The underground gamma-ray spectrometry measurements were carried out as a collaboration within three CELLAR (Collaboration of European Low-level underground LAboRatories) institutes. IRMM was coordinating the work and performing measurements in the underground laboratory HADES. Samples were also measured in the Gran Sasso underground laboratory in Italy and in the UDO laboratory in the ASSE mine, operated by PTB. This report does, however, not include the results from the three samples that were measured by PTB as PTB has been reorganising their low-level radioactivity work and assessing the future of their underground laboratory. As soon as these results are known, this report will be updated and re-printed. The results of the measurements show that it is no longer possible to assess the activity induced by neutrons from the A-bomb at ground distances greater than about 1000 m (slant range ~ 1200 m) since environmental activation starts to dominate at that distance. The measurements were, however, successful in showing that measurements reported in DS86 on 60Co in steel at long range show too high activity. The new measurements support the computer models of DS86 and DS02 (Dosimetry System 2002) and convey the message that the 60Co dilemma from DS86 is solved. The measurements thus provide greater confidence in the existing dosimetry system.

2
Table of contents Executive Summary ................................................................................................................................. 1 Table of contents ...................................................................................................................................... 2 List of Tables............................................................................................................................................ 3 1. Introduction .......................................................................................................................................... 4 2. Materials and Methods ......................................................................................................................... 4
2.1. Overview of samples ..................................................................................................................... 5 2.1.1. Description and preparation of the samples ........................................................................... 5 • 2.1.1.1 Sumitomo bank............................................................................................................. 6 • 2.1.1.2 Aioi bridge.................................................................................................................... 6 • 2.1.1.3 Fukoku life assurance................................................................................................... 7 • 2.1.1.4 Chugoku electricity ...................................................................................................... 7 • 2.1.1.5 Kodokan building ......................................................................................................... 8 • 2.1.1.6 City Hall ....................................................................................................................... 9 • 2.1.1.7 City Hall-2.................................................................................................................. 10 • 2.1.1.8 Hiroshima bank Kanayamacho .................................................................................. 10 • 2.1.1.9 Hiroshima bank Kanayamacho 6 ............................................................................... 11 • 2.1.1.10 Kyu-Fuzoku elementary school................................................................................ 11 • 2.1.1.11 Yokogawa bridge ..................................................................................................... 11 • 2.1.1.12 Hiroshima University plate ...................................................................................... 12 • 2.1.1.13 Hiroshima University window ................................................................................. 13 • 2.1.1.14 Nisseki "1"................................................................................................................ 13 • 2.1.1.15 Nisseki "5"................................................................................................................ 14 • 2.1.1.16 Postal Saving Building (Chokin Kyoku).................................................................. 14
2.2. Detectors and measurements ....................................................................................................... 15 2.2.1. Detectors............................................................................................................................... 15 2.2.2. Measurements of samples .................................................................................................... 16 2.2.3. Measurements of background and mercury samples in HADES......................................... 17 2.2.4. Subtraction of background to the peak counts ..................................................................... 18
2.3. Efficiency calculation models and programs .............................................................................. 18 2.4. Activities and decision thresholds............................................................................................... 19
2.4.1. Activity calculations............................................................................................................. 19 2.4.2. Determination of decision thresholds................................................................................... 19
2.5. Elemental analysis....................................................................................................................... 20 3. Results ................................................................................................................................................ 21
3.1. Other activation products ............................................................................................................ 27 4. Activation of environmental neutrons................................................................................................ 28 5. Discussion .......................................................................................................................................... 29 6. Conclusions ........................................................................................................................................ 30 6. References .......................................................................................................................................... 30

3
List of Tables Table 1. List of Hiroshima samples described in this report.................................................................... 5 Table 2. Data of the HPGe-detectors used for the measurements.......................................................... 15 Table 3. Overview of the γ-ray measurements ...................................................................................... 16 Table 4. Overview of the net live time for each sample......................................................................... 17 Table 5. List of background measurements in HADES for the long range samples.............................. 17 Table 6. The cobalt content from ICP-OES and k0-NAA as well as the evaluated final results.......... 20 Table 7. Summary of activity at the start of the measurement............................................................... 25 Table 8. Summary of activity at reference date...................................................................................... 25 Table 9. Activities at the start of measurement together with associated decision thresholds............... 26 Table 10. Activities at reference date (1945-08-05 23:15 UTC) together with associated decision thresholds................................................................................................................................................ 26 Table 11. Specific activities at reference date together with associated decision thresholds. ............... 27

4
1. Introduction Knowledge of the effect of ionising radiations on humans and the resulting dosimetry regulations concerning exposure are mainly based on follow-up of the population exposed to the atomic bomb explosions above Hiroshima and Nagasaki. The Radiation Effects Research Foundation (RERF) is an organisation that started as a collaboration between USA and Japan. It conducts research into the medical effects of radiation on man. The RERF started in 1975 and took over the work started by the US organisation, Atomic Bomb Casualty Commission (ABCC), which was established in 1947. An important task for RERF is to retrospectively determine the effective doses at various locations in Hiroshima. This is a work that has been under continuous development and refinement ever since 1945. In recent years computer models for dose determination have been developed. The first dose re-assessment that was based on computer models was Dosimetry System 86 (DS86) from 1986. It is important that the model calculations are supported by measurements. One way of doing this is to measure the activity of certain radionuclides that were produced by the neutrons from the A-bomb. There were certain disagreements between model calculations and activity measurements after DS86 (Hoshi, 1998; Gold, 1999). Of particular importance for this study was the disagreement in activity of 60Co found in steel samples. The most recent re-assessment of doses is the Dosimetry System 02 (DS02). Many disagreements from DS86 have been resolved but there are still a few that persist and amongst them 60Co in steel. The values in the vicinity of ground zero at short range are in good agreement but at ground distances of 1000 m from ground zero and further, there are still discrepancies. It is important to clarify if these disagreements are due to problems in computer models or due to the technically very challenging measurements of extremely low-levels of 60Co in steel. A previous series of measurements was performed by IRMM and PTB in 2003. The specific activities determined in samples collected at a ground distance shorter than 993 m (city hall) were in agreement with DS02. The small masses of the samples (between 8 and 160 g) permitted, however, only calculation of decision thresholds at longer distances. Those decision thresholds were lower than the specific activity values from earlier measurements. It was thus decided to perform a second series of measurements using larger samples in order to determine 60Co specific activities in the order of 0.1 mBq/kg at the time of measurement and this is the scope of this report. It is outside the scope of this report to study the effect of neutron transport inside the samples albeit this being a vital part when dealing with massive samples like the ones in this study. The neutron transport inside the samples influences the activity calculations since an inhomogeneous activity distribution is expected. This report forms the basis for continued studies and calculations on the effect of inhomogeneous activity distribution and neutron transport in the samples. Furthermore, this report seeks to estimate the effect of the environmental neutrons and if the 60Co activity induced by the A-bomb is still measurable at long distance or swamped by environmental activation.
2. Materials and Methods The samples were collected at locations in Hiroshima that were carefully selected. The samples must have had a direct view of the A-bomb in 1945. The sampling process is described by Cullings at al. (2003) in the DS02 report. Sixteen "large mass" samples were found suitable and shipped to IRMM by boat in order to minimise the activation by cosmic rays. Fifteen samples were shipped in November 2004 and arrived January 4, 2005. A sixteenth sample (Hiroshima Bank Kanayama-cho branch iron ring on the rooftop) was shipped in May 2006 and arrived at IRMM August 4, 2006. IRMM made sample preparations and shipped 4 samples further to two laboratories in the CELLAR (Collaboration of European Low-level underground LAboRatories) network. The majority of samples (12) were measured by IRMM using the underground laboratory HADES. One sample was measured by LNGS (Laboratori Nazionali del Gran Sasso) in their underground laboratory, 3 by PTB (Physikalisch-Technische Bundesanstalt) in the ASSE salt mine. However, as PTB was undergoing reorganisation and assessing the future of their underground laboratory, it has not yet been able to deliver the final quantitative results. When these arrive an updated version of this report will be issued.

5
In order to determine the stable cobalt content, a small piece (~ 1 g) was cut off from each sample for elemental analyses using 2 different methods, ICP-OES (Inductively Coupled Plasma Optical Emission Spectroscopy) and k0-NAA (k0-Neutron Activation Analysis),. When calculating the specific activities it was an important issue to make correct background subtraction as 60Co is present in the background, and the massive steel samples in this project shield (=protect/cover) to some extent the background radiation from the shield (= the lead+copper surrounding the detector). This is also discussed below.
2.1. Overview of samples Table 1 summarises the data of each sample indicating the mass of the sample used for gamma-ray spectrometry. They are sorted by increasing slant range. Table 1. List of Hiroshima samples described in this report.
Sample Short description
Ground distance
(m)
Slant range
(m) Mass as arrived (g) 1 Sumitomo bank Thick bent bar 260 654 386.482
Aioi bridge 5 slabs kept together by a spanner to form a thick piece 300 671 1769.03
3 Fukoku Life assurance
Thick rod bent to form a semi-circle 331 685 192.96
4 Chugoku electricity Section of a ring with steps 687 912 613.315 Kodokan building Short piece of pipe 720 937 120.786
City hall Tube with enlarged part at one end - thread visible 993 1160 2321.54
7 City hall-2 Solid bar bent 90 deg. 993 1160 798.698
Hiroshima bank Kanayamacho
Thick rod bent to form semi-circle - resembles Fukoku sample
1210 or 1203 1351 190.27
9 Hiroshima bank Kanayamacho 6
Thick rod bent to form semi-circle 1222 233.41
10 Kyu-Fuzoku elementary school Straight tube with white letters 1269 1404 634.44
11
Yokogawa bridge
Seemingly 4 pieces kept together by a spanner -traces of molten metal 1290 1423 2777.36
12 Hiroshima university plate Thick square plate 1400 1523 523.65
13 Hiroshima university window
Three bars connected by a flat strip 1400 1523 704.69
14 Nisseki "5" Tube 1480 1597 1127.5615 Nisseki "1" Tube slightly bent 1480 1597 806.9816 Postal Saving Building
(Chokin Kyoku) Very thick rod in T-shape 1591 1700 1667.36* Nisseki "5" and Nisseki "1" were measured together. ** Hiroshima University plate and window were measured together
2.1.1. Description and preparation of the samples All samples were brushed with a steel brush and cleaned as described below under each subsection. Some samples were sawed in smaller pieces, which were sometimes flattened with a bench vise in order to obtain a more suitable geometry for measurement. As the procedures were slightly different for each sample, a more detailed description is given for each sample.

6
• 2.1.1.1 Sumitomo bank This sample consisted of a small thick bent bar with a diameter of 24 mm and a length of 132 mm. The sample was partly covered with a grey-reddish paint. It was first brushed with a steel brush, then immersed in HCl for one hour, rinsed with water, brushed and scraped with a knife. This was followed by 3 cycles of immersion in acetone (for resp. 20 minutes, 10 minutes and 1 hour) and scraping. Then it was immersed in HCl for 40 minutes, rinsed with water and cleaned with tissue. It was subsequently immersed in HNO3 for 10 minutes and then rinsed with water and alcohol. It was then sent to PTB for measurement (the small pieces for elemental analysis were cut off afterwards).
Figure 1. Picture of the "Sumitomo bank" sample as received
• 2.1.1.2 Aioi bridge This sample consisted of 6 pieces of metal welded together. The sample was showing heavy corrosion and molten metal deposit. The pieces were separated and the small samples for elemental analysis were cut off before cleaning. They were first brushed, then immersed in HCl for 70 minutes, washed with water and paper tissue, brushed, cleaned again with water and paper tissue. They were subsequently immersed in HNO3 for 30 minutes and rinsed with alcohol. Only the connecting piece and the two outer pieces were used for measurement.
Figure 2. Pictures of the "Aioi bridge" sample as received (first two) and with the pieces separated (last two).

7
• 2.1.1.3 Fukoku life assurance
This sample consisted of a thick rod, bent to form part of a ring. It was partly covered with paint, most of which was removed by scraping. The sample was then cut in two pieces that were immersed in HCl for 105 minutes in order to remove rust and the last traces of paint. It was then rinsed with water and immersed in HNO3 for 30 minutes and subsequently washed with water and alcohol before being sent to PTB for measurement.
Figure 3. Pictures of the " Fukoku life assurance" sample as received and after sawing.
• 2.1.1.4 Chugoku electricity This sample consisted of one stepped piece showing some corrosion. After cutting off a sample for elemental analysis, it was cut in three pieces, brushed, immersed in HCl for 100 minutes, rinsed with water, then immersed in HNO3 for 70 minutes and subsequently washed with water and alcohol before being sent to PTB for measurement.
Figure 4. Pictures of the "Chugoku electricity" sample as received and after sawing.
8
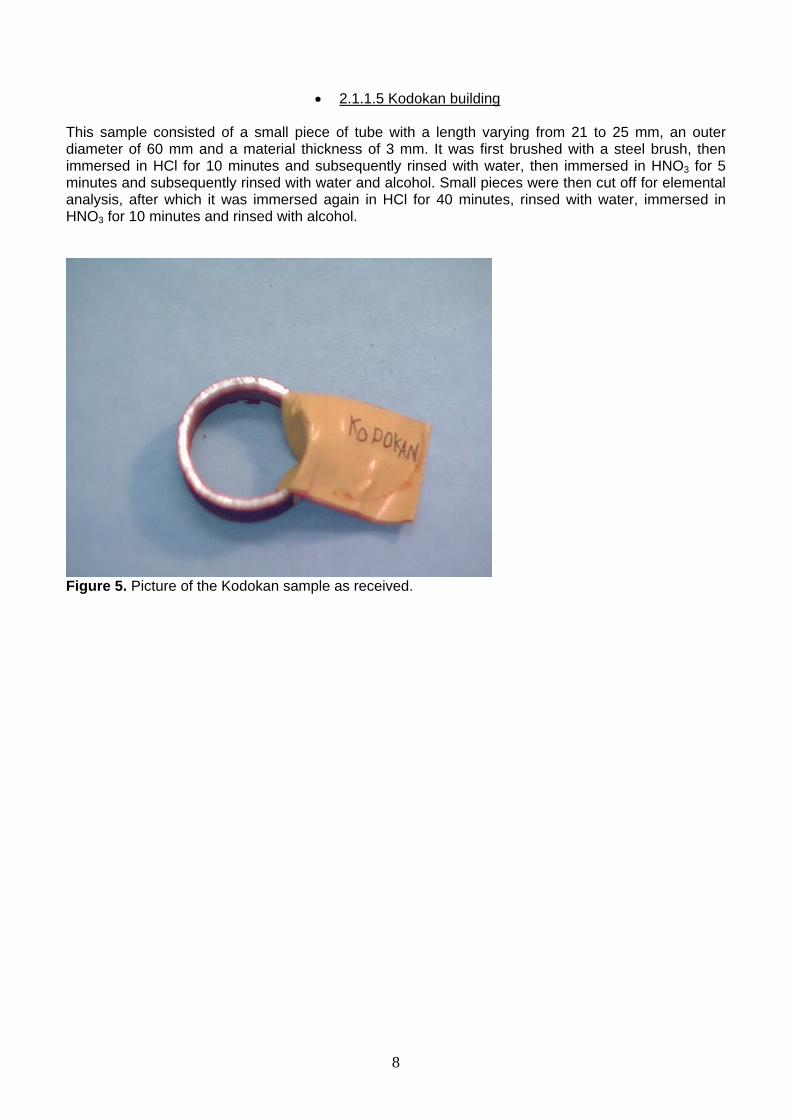
• 2.1.1.5 Kodokan building
This sample consisted of a small piece of tube with a length varying from 21 to 25 mm, an outer diameter of 60 mm and a material thickness of 3 mm. It was first brushed with a steel brush, then immersed in HCl for 10 minutes and subsequently rinsed with water, then immersed in HNO3 for 5 minutes and subsequently rinsed with water and alcohol. Small pieces were then cut off for elemental analysis, after which it was immersed again in HCl for 40 minutes, rinsed with water, immersed in HNO3 for 10 minutes and rinsed with alcohol.
Figure 5. Picture of the Kodokan sample as received.

9
• 2.1.1.6 City Hall
This sample consisted of a tube with an enlargement on one side. It was immersed in HCl for 1 hour and then cleaned with water and paper tissue. It was subsequently immersed in HNO3 for 30 minutes and rinsed with alcohol. The tube was then cut into pieces having a height of around 8 cm that were then cut in two along the vertical axis and then flattened. All those pieces were then again brushed, immersed in HCl, washed with water and paper tissue, immersed in HNO3 and rinsed with alcohol. Finally, the piece with the enlargement was sawed in two along the vertical axis. Pieces that were screwed together came apart in a total of 6 pieces. Four of them were flattened. All pieces were then cleaned again in HCl and HNO3. A Marinelli beaker was then cut in order to remove the outer part and the pieces were centred around the inner part (after cleaning it in ultrasonic bath). This was done in order to measure in a geometry as close as possible to a Marinelli geometry. The pieces were wrapped in plastic foil to keep them together.
Figure 6. The "City Hall" sample cut in pieces which are cut longitudinally and flattened.

10
• 2.1.1.7 City Hall-2 This sample consisted of a solid bar, bent 90 degrees. It had a length of 418 mm and a diameter of 15 to 18 mm. It was sawed in 13 pieces which were then brushed and scraped. The pieces were then immersed in HCl for 30 minutes and rinsed with water. The 5 pieces with paint left were again scraped, brushed, immersed in HCl for 10 minutes and rinsed with water. All pieces were then immersed in HNO3 for 20 minutes and rinsed with water. Those pieces were then placed in a standard Teflon container for measurement.
Figure 7. The "City Hall-2" sample as it arrived.
• 2.1.1.8 Hiroshima bank Kanayamacho This sample consisted of a thick rod, bent, forming a part of a ring. It was brushed, immersed in HCl for 1 hour, washed with water and paper tissue, scraped to remove paint and then immersed in HNO3 for 40 minutes and rinsed with alcohol. This sample was possibly shielded from directly exposure to the A-bomb neutrons.
Figure 8. The "Hiroshima bank Kanayamacho" sample as it arrived and on a Germanium detector.

11
• 2.1.1.9 Hiroshima bank Kanayamacho 6 This sample consisted of a thick rod, bent to form part of a ring. It is claimed to have been directly exposed to the bomb while this should not be the case for the other Kanayamacho sample. It was sawed in two pieces that were brushed and scraped, then immersed in HCl for 30 minutes, rinsed with water, immersed in HNO3 for 20 minutes and rinsed with water and alcohol.
Figure 9. The "Hiroshima bank Kanayamacho-6" sample as it arrived.
• 2.1.1.10 Kyu-Fuzoku elementary school This sample consisted of a piece of tube with a length of 298 mm, a diameter of 48 mm and a material thickness of 2 mm. Heavy rust deposits were present on the inside of the tube. It was sawed in 8 pieces which were then flattened. During this procedure, most of the rust and paint came off. The pieces were then brushed, immersed in HCl for 20 minutes, rinsed with water, immersed in HNO3 for 15 minutes and rinsed with water and alcohol.
Figure 10. The " Kyu-Fuzoku elementary school" sample as it arrived, cut in pieces and these pieces cut longitudinally and flattened.
• 2.1.1.11 Yokogawa bridge
Figure 11. The " Yokogawa bridge" sample as arrived and disassembled,

12
This sample consisted of four pieces of metal welded together. It was showing heavy corrosion as well as traces of molten metal. It had a length of 298 mm and a maximum height of 68 mm. The long flat pieces were sawed into 10 pieces in total while the connecting piece was left alone. The pieces were then cleaned individually by brushing, immersions in HCl (2 to 4 immersions for a total time of 100 to 190 minutes) followed by rinsing with water and brushing and a final immersion in HNO3 for 15 to 35 minutes in order to remove rust and traces of molten metal. Subsamples for analysis were taken from the connecting piece. A Marinelli beaker was then cut in order to remove the outer part and the pieces were centred around the inner part (after cleaning it in an ultrasonic bath) in order to measure in a geometry as close as possible to a Marinelli geometry. The pieces were wrapped in a radiopure plastic foil to keep them together.
Figure 12. The " Yokogawa bridge" with its pieces cut and cleaned, the inner part of a Marinelli beaker and the sample arranged around it and fixed with plastic foil for measurement.
• 2.1.1.12 Hiroshima University plate This sample consisted of one thick plate having a width of 69 mm and a length of 82 mm. Its thickness was between 12 and 17 mm. It was partly covered with paint. It was first brushed, then immersed in HCl for 55 minutes, rinsed in water, brushed again and subsequently immersed in HNO3 for 30 minutes and rinsed with water and alcohol. This sample was then prepared for measurement together with the university window sample (see section 2.1.1.14 hereunder).
Figure 13. The " Hiroshima University plate" sample as it arrived.

13
• 2.1.1.13 Hiroshima University window
This sample consisted of three bars connected by a flat strip. It was partly covered by paint. The pieces were separated and a small sample was taken for analysis. The strip was scraped and brushed and then sawed in two pieces. Those were then immersed in HCl for 65 minutes, rinsed with water, scraped again and then immersed in HNO3 for 40 minutes and rinsed with water. As paint was still present this procedure was done a second time. The bars were cut into small pieces and immersed in HCl for 30 minutes. This was followed by scraping and the bars were then again immersed in HCl for 50 minutes and rinsed with water. The paint left was removed by scraping and the sample was then immersed in HNO3 for 20 minutes and rinsed with water and alcohol. A Marinelli beaker was then cut in order to remove the outer part and the pieces were centred around the inner part (after cleaning it in ultrasonic bath) in order to measure in a geometry as close as possible to a Marinelli geometry. The plate sample described in 2.1.1.13 was placed on top of the Marinelli while the pieces from the window sample were placed on the side around the inner wall of the beaker. The pieces were wrapped in radiopure plastic foil to keep them together.
Figure 14. The " Hiroshima University window" sample as it arrived, cut in pieces and arranged around the inner part of a Marinelli beaker together with the University plate and fixed with plastic foil for measurement.
• 2.1.1.14 Nisseki "1" This sample consisted of a slightly bent tube with a length of 225 mm, a diameter of 47 mm and a material thickness of 3 mm. The tube was cut into six pieces. Five of them were flattened until they fitted into a Marinelli beaker along the side wall. The sixth piece was completely flattened to fit on the

14
upper part of the beaker. The pieces were then brushed and scraped, immersed in HCl for 30 minutes, rinsed with water, scraped and brushed again to remove traces of paint, immersed in HNO3 for 15 minutes, rinsed with water and alcohol.
Figure 15. The "Nisseki 1" sample as it arrived, cut in pieces, these pieces cut longitudinally and partly flattened to fit in a Marinelli beaker.
• 2.1.1.15 Nisseki "5" This sample consisted of a straight tube with a length of 280 mm, a diameter of 49 mm and a material thickness of 3 mm. The tube was cut into eight pieces that were then flattened. They were then brushed, immersed in HCl for 30 minutes, rinsed with water, brushed and scraped to remove traces of paint, immersed in HNO3 for 15 minutes and rinsed with water and alcohol. They were then placed for measurement on the top of the Marinelli beaker on which the pieces of Nisseki "1" had already been placed.
Figure 16. The "Nisseki 5" sample as it arrived, cut in pieces and these pieces cut longitudinally and flattened.
• 2.1.1.16 Postal Saving Building (Chokin Kyoku)
This sample consisted of a very thick rod (diameter of 50 mm), in T-shape, composed of 3 pieces: the rod itself, a smaller piece and a pin connecting them. Those pieces were partly covered with paint. The sample was first brushed using a steel brush, then immersed in HCl for 75 minutes, then scraped and brushed, subsequently immersed again in HCl for 55 minutes and a second time for 80 minutes with brushing between both immersions. It was then cleaned for 15 minutes in an ultrasonic bath and then immersed in HNO3 for 30 minutes. Then the sample was drilled at the level of the pin to separate the two main pieces. Those were then immersed in HCl for 70 minutes, brushed, immersed again in

15
HCl for 15 minutes, brushed, immersed in HNO3 for 15 minutes and rinsed with water and alcohol. Subsamples for elemental analysis were taken from the smallest of both pieces. The biggest piece was then sawed in two through the central pin. The two resulting pieces were again sawed in two. The pieces were then again immersed in HCl for 20 minutes, cleaned with water and paper tissue, immersed in HNO3 for 40 minutes and then rinsed with water and alcohol.
Figure 17. The "Postal Saving Building" sample separated in its components, these when cut in pieces and cleaned and the connecting pin cut longitudinally
2.2. Detectors and measurements 2.2.1. Detectors
Five detectors were used for this study, three at IRMM (named Ge-3, Ge-4 and Ge-5), one at PTB (named PTB-ULB) and one at LNGS (named GeCris). Their main characteristics are summarized in Table 2. Note that the results from the measurements on PTB-ULB are not included in this report. Table 2. Data of the HPGe-detectors used for the measurements Ge-3 Ge-4 Ge-5 PTB-ULB GeCris Bkg cra at 1173 keV (d-1)
0.31(7) 0.53(10) 0.58(9) 0.68(15) 0.36(11)
Bkg cra at 1332 keV (d-1)
0.20(5) 0.41(9) 0.46(10) 0.61(14) 0.28(9)
Relative efficiency
60% 106% 50% 95% 120%
Volume (cm3) 251 412 150 357 468 Crystal configuration
coaxial coaxial planar coaxial coaxial
Diameter (cm) 6.4 8.0 8.0 7.7 8.4 Depth of laboratory (m)
225 225 225 925 1400
Overburden (m w.e.)
500 500 500 2100 3800
a: counting rate of the peak at given energy in the background spectrum

16
2.2.2. Measurements of samples
The duration of a measurement was determined by the activity of the sample. A sample with relatively high activity was given shorter measurements time than one with relatively low activity. The activity in the samples depended both on the slant range and the mass of the sample. Long measurements were generally performed as several shorter ones since other measurements like quality control, background measurements with the same shield configuration or measurements of other samples being done between two measurements of the sample. Table 3 hereunder gives the list of all the measurements for each sample. Table 3. Overview of the γ-ray measurements
Sample Detector Live time (d) Start date End date Geometry
Aioi bridge Ge-5 43.6 14-06-2005 28-07-2005 3 pieces directly on endcap Kodokan building Ge-3 41.5 22-02-2005 05-04-2005 Directly on endcap
Ge-3 40.4 11-05-2005 21-06-2005 1 piece directly on endcap City hall Ge-5 41.6 16-08-2005 27-09-2005 Marinelli Ge-5 15.6 06-12-2006 22-12-2006 City hall-2 Ge-5 13.7 09-01-2007 23-01-2007
In Teflon container (directly on endcap)
Hiroshima bank Kanayamacho Ge-4 42.6 21-06-2005 03-08-2005 Directly on endcap
Hiroshima bank Kanayamacho 6 Ge-3 34.6 16-01-2007 20-02-2007 Directly on endcap
sandwich 46
(data not usable)
12-01-2007 27-02-2007 Pieces piled on detector
Ge-4 27.4 11-08-2009 08-09-2009 Pieces piled on detector
Kyu-Fuzoku elementary school
Ge-4 19.5 21-10-2009 10-11-2009 Pieces piled on detector Ge-5 8.9 30-03-2005 08-04-2005 Ge-5 21.7 19-04-2005 11-05-2005 Pieces piled on detector
Ge-5 46.6 24-03-2006 10-05-2006 Marinelli Ge-5 13.6 16-05-2006 30-05-2006 Marinelli Ge-5 14.9 07-06-2006 22-06-2006 Marinelli Ge-4 38.5 26-08-2005 04-10-2005 Marinelli
Yokogawa bridge
Ge-4 65.4 21-11-2005 26-01-2006 Marinelli Ge-3 102.1 03-11-2005 14-02-2006 Marinelli Ge-3 46.6 24-03-2006 10-05-2006 Marinelli Ge-3 6.8 17-05-2006 24-05-2006 Marinelli
Hiroshima university
Ge-3 8.1 14-06-2006 22-06-2006 Marinelli Ge-4 2.9 23-01-2007 26-01-2007 Marinelli Ge-4 28.4 05-02-2007 06-03-2007 Marinelli Nisseki Ge-4 29.4 13-03-2007 12-04-2007 Marinelli GeCris 26.6 30-01-2006 27-02-2006 Postal Saving
Building GeCris 37.3 16-06-2006 25-07-2006 As shown on picture
After control of each individual spectrum to check for the absence of energy shifting and other problems that can occur, spectra of the different measurements were added and Table 4 hereunder indicates the live time of the spectra sums used for the determination of the activities.

17
Table 4. Overview of the net live time for each sample. Sample detector Live time (d)
Aioi bridge Ge-5 43.60 Kodokan building Ge-3 41.48 City hall Ge-5 41.62 City hall-2 Ge-5 29.28 Hiroshima bank Kanayamacho Ge-4 42.58 Hiroshima bank Kanayamacho 6 Ge-3 34.55 Kyu-Fuzoku elementary school Ge-4 46.88 Yokogawa bridge Ge-4 106.03 Yokogawa bridge Ge-5 75.08 Hiroshima university Ge-3 163.54 Nisseki Ge-4 60.69 Postal Saving Building GeCris 63.93 The spectra were not analysed using automatic peak-fitting routines. Three regions of interest were determined for each peak, one encompassing the peak itself, one at lower energy and one at higher energy (those last two being used to determine the continuum). All counts within a region of interest are taken into account.
2.2.3. Measurements of background and mercury samples in HADES In order to lower the background in HADES, and in particular the contribution of radon daughters to it, pieces of OFHC copper have been specifically designed to fill the space around the detector and the sample. As the samples are generally placed in standard Teflon containers, those copper pieces have been designed for this specific geometry. In order to measure bigger samples, it is necessary to remove some of the copper pieces. Consequently, several shielding configurations are possible for each detector and background measurements were performed for each of the shielding configurations used during this study. Table 5 shows the list of background measurements used for this study. Table 5. List of background measurements in HADES for the long range samples.
Counting Rate (d-1) Detector Configuration Live time (d) 1173 keV 1332 keV Ge-3 All Cu in 97.29 0.37 0.32 Ge-4 F out 23.76 0.72 0.45 Ge-4 E and F out 41.99 0.30 0.43 Ge-4 All Cu in 44.51 0.82 0.29 Ge-5 2 Cu out 77.49 0.46 0.43 Ge-5 3 Cu out 46.44 0.05 0.25 Ge-5 All Cu in 52.64 0.38 0.39 As the samples measured were made of steel and had a mass up to 2.7 kg (in a Marinelli geometry), the influence of the sample on the detection of background events can not be neglected. Consequently, mercury samples were also measured (in a Marinelli geometry) in order to be able to assess the influence the sample has on the detection of background counts. Mercury was chosen because of its very high attenuation coefficient, its high radiopurity and the ease with which it can be poured into containers of different shapes. After selecting mercury batches (based on their radiopurity), two samples were prepared: one for the detectors Ge-4 and Ge-5 and the other one for the detector Ge-3 as this detector has a different outer diameter. The results were presented at the ICRM (International Committee for Radionuclide Metrology) conference in 2007 (Hult et al., 2008).

18
2.2.4. Subtraction of background to the peak counts Background counts in the energy region interesting for this study are due to the presence of 60Co, mainly in the copper shield and inside (or in) a detector's endcap. The contribution from 60Co present inside (or in) an endcap was considered constant whatever the sample placed outside is. This assumption was made because the probability of having a photon emitted inside the endcap and scattered in the sample depositing an energy of 1173 or 1332 keV in the crystal is very small. The contribution of 60Co present in the copper shield was determined using background and mercury samples measurements. It was considered that the decay of 60Co was similar for each measurement and efficiencies for detecting decays occurring in the shield in the presence of air (background), a mercury sample or a steel sample were calculated by Monte-Carlo simulations. Using the measurements of background and mercury allowed determining the background counting rate to subtract it from the sample counting rate. The equation used to determine the net number of counts is shown in chapter 2.4.1.
2.3. Efficiency calculation models and programs All the efficiency calculations were performed with Monte-Carlo simulations using EGS4. A MORTRAN code implementing a cylindrical model, UCCYSL was systematically used (Nelson et al., 1985). In this model we incorporated the source, the detector with its mounting included in some detail and the surrounding shield. Models of the detectors have been elaborated based on the manufacturers' data sheets and radiographs. Standards consisting of point sources and volume sources have been used to adjust the deadlayer thicknesses. For radionuclides having multiple gamma-rays in cascade (including 60Co), the complete decay scheme is introduced in the code so that proper correction for summing-in or summing-out is applied. For 60Co, the weak angular correlation was neglected. Fig.18 shows as example the model used for the measurement of mercury on the detector Ge-4.
Figure 18. Model of Ge-4 with mercury sample. Yellow represents Cu, green represents low density polyethylene, grey represents Hg, turquoise represents Al, red represents the active part of the Ge crystal and the red hashed part is the Ge deadlayer. In EGS4, the geometry is defined by planes and radii, thus resulting in ring-shaped regions. The models representing Ge-3 (resp. Ge-4 and Ge-5) have 1723 regions (resp. 761 and 749).

19
2.4. Activities and decision thresholds All calculations in this report assume a homogeneous activity distribution, which is correct only if there was a constant neutron flux inside the samples. Because of the relatively thick samples, this assumption is not entirely correct but is used here as it is considered outside the scope of this study to estimate the inhomogeneous activity. It should, however, be possible in a follow-up study to assess the inhomogeneous activity since track was kept on the position each sample was placed on a HPGe-detector. By knowing the neutron distribution inside the sample it should be possible to divide the samples into slices in the computer model and obtain activities for the different slices.
2.4.1. Activity calculations The activity was calculated by applying the following formula to each peak:
)1( m
d
t
t
eCeA λ
λ
ελ
−−=
where A is the activity at the reference date, λ the decay constant, C the background corrected net number of counts in the peak in question, td the decay time, ε the absolute efficiency per decay and tm the measurement time. In case a signal above decision threshold was determined for both peaks, the weighted mean of the activity from the two peaks was calculated (adding the correlated part separately). The uncertainties are expressed as combined standard uncertainties, following the Guide to the Expression of Uncertainty in measurement. They are given in brackets after the relevant number and their numerical value refers to the corresponding last digit(s) of the quoted result. In order to correctly subtract the background, C has been calculated according to the following equation
⎥⎥⎦
⎤
⎢⎢⎣
⎡⎟⎟⎠
⎞⎜⎜⎝
⎛
−
−+⎟
⎟⎠
⎞⎜⎜⎝
⎛
−
−−−= B
samBair
BHg
airHgBHgB
airBHg
airHgHgmc
BBBBBtNC ε
εεε
εε
where Nc is the net number of counts in the peak considered in the spectrum from the measurement of the sample, BHg and Bair are the net count-rates in the same peak in the mercury and the background spectra respectively. B
Hgε , Bairε and B
samε are the calculated efficiencies (using EGS4) for detecting, in the germanium detector, decays occurring in the outer copper shield with the presence of respectively mercury, air (background measurement) and sample.
2.4.2. Determination of decision thresholds Decision thresholds were determined according to the ISO 11929-31 standard using a significance level of 0.05 and 0.10 and all measured activities were compared to the decision threshold.
1 However, the equation used for the calculations was Eq.5 of the DIN 25482-5 standard as Eq.11 of the ISO 11929-3 standard is not correct.

20
2.5. Elemental analysis It was important for this study to perform elemental analysis in order to know the cobalt content of each sample as final results given are expressed in activity of 60Co per mass unit of cobalt. Subsamples were sent to BAM (Bundesanstalt für Materialforschung und –prüfung) for analysis by ICP-OES and to SCK•CEN (Studiecentrum voor Kernenergie•Centre d'étude de l'énergie nucléaire) for analysis using k0-NAA (Etxebarria et al., 1996). At BAM the samples were dissolved in HCl/HNO3. the solution was then heated in H3PO4 and H2SO4 until fuming. The salts were dissolved in HCl. Finally, cobalt was determined in the sample solution with ICP-OES (λ=228.616 nm). Samples sent to SCK•CEN were first cleaned for a few seconds in a solution containing HCl, HF and detergent, rinsed and then cleaned in an ultrasonic bath. The samples were then put in plastic bags together with neutron flux monitors. Cobalt, iron and chromium were determined (via the reactions 59Co(n,γ)60Co, 58Fe(n,γ)59Fe and 50Cr(n,γ)51Cr) after a seven-hour irradiation performed in the 700 kW reactor BR1. Table 6. The cobalt content from ICP-OES and k0-NAA as well as the evaluated final results.
Sample ICP-OES:
Mass fraction of Co (mg/kg)
k0-NAA: Mass
fraction of Co (mg/kg)
Rel. Diff. (%) (BAM-SCK)/SCK
final results (Mean value)
(mg/kg) Final Rel
uncer. (%)
Sumitomo bank 149 (6) 139 (4) 7.2 144 (7) 5 Aioi bridge 110 (5) 102 (3) 7.8 106 (6) 5 Fukoku Life assurance 96 (5) 90 (2) 6.7 93 (4) 5 Chugoku electricity 24 (1) 22.4 (6) 7.1 23.2 (11) 5 Kodokan building 151 (4) 139 (4) 8.6 145 (8) 6 City hall 162 (6) 154 (4) 5.2 158 (6) 4 City hall-2 182 (5) 173 (4) 5.2 178 (6) 4 Hiroshima bank Kanayamacho 127 (6) 103 (3) 23.3 115 (17) 15
Kanayamacho-6 76 (6) 76 (6) 8
Kyu-Fuzoku elementary school 149 (7) 135 (4) 10.4 142 (10) 7
Yokogawa bridge 196 (9) 194 (5) 1.0 195 (7) 3 Hiroshima university plate 127 (6) 112 (3) 13.4 120 (11) 9 Hiroshima university window 279 (9) 256 (6) 9.0 268 (16) 6 Nisseki "5" 146 (3) 136 (3) 7.4 141 (7) 5 Nisseki "1" 104 (4) 97 (3) 7.2 101 (5) 5 Postal Saving Building 186 (9) 177 (5) 5.1 182 (6) 4 Reference sample (ref. value: 810 mg/kg) 820 (40) 750 (40) 9.2 - -
21
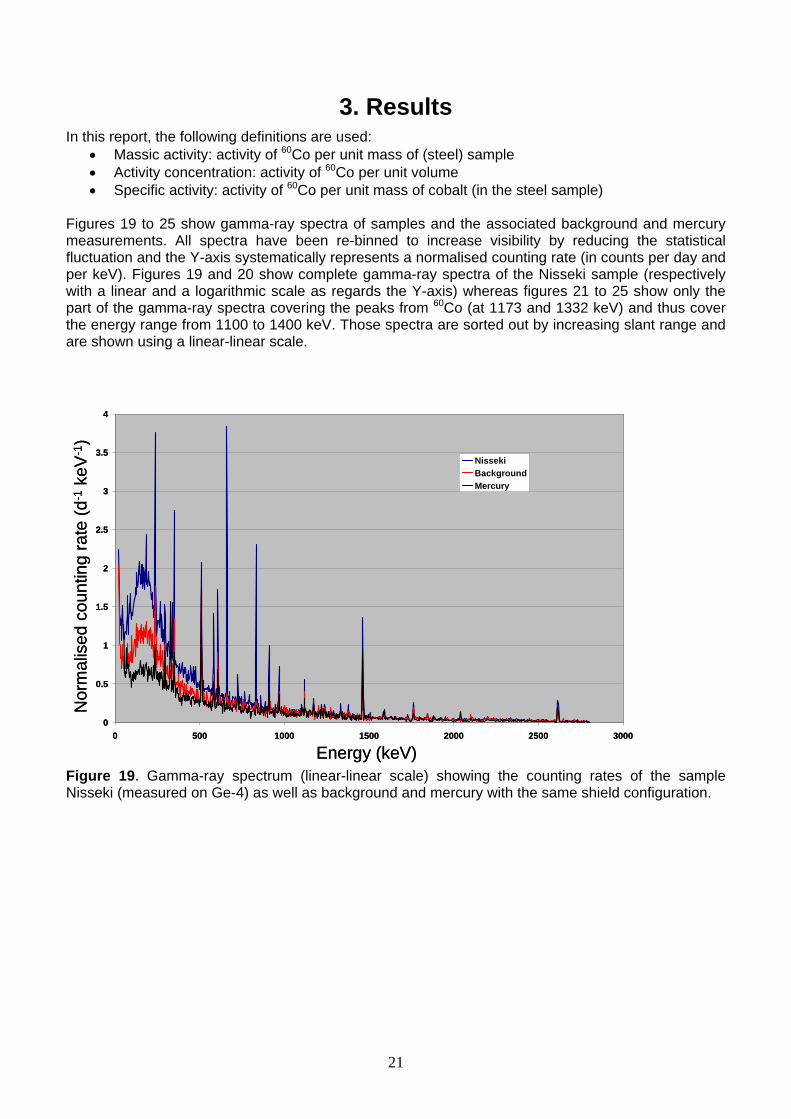
3. Results In this report, the following definitions are used:
• Massic activity: activity of 60Co per unit mass of (steel) sample • Activity concentration: activity of 60Co per unit volume • Specific activity: activity of 60Co per unit mass of cobalt (in the steel sample)
Figures 19 to 25 show gamma-ray spectra of samples and the associated background and mercury measurements. All spectra have been re-binned to increase visibility by reducing the statistical fluctuation and the Y-axis systematically represents a normalised counting rate (in counts per day and per keV). Figures 19 and 20 show complete gamma-ray spectra of the Nisseki sample (respectively with a linear and a logarithmic scale as regards the Y-axis) whereas figures 21 to 25 show only the part of the gamma-ray spectra covering the peaks from 60Co (at 1173 and 1332 keV) and thus cover the energy range from 1100 to 1400 keV. Those spectra are sorted out by increasing slant range and are shown using a linear-linear scale.
0
0.5
1
1.5
2
2.5
3
3.5
4
0 500 1000 1500 2000 2500 3000
NissekiBackgroundMercury
Energy (keV)
Nor
mal
ised
cou
ntin
g ra
te (d
-1ke
V-1
)
0
0.5
1
1.5
2
2.5
3
3.5
4
0 500 1000 1500 2000 2500 3000
NissekiBackgroundMercury
Energy (keV)
Nor
mal
ised
cou
ntin
g ra
te (d
-1ke
V-1
)
Figure 19. Gamma-ray spectrum (linear-linear scale) showing the counting rates of the sample Nisseki (measured on Ge-4) as well as background and mercury with the same shield configuration.
22
0.001
0.01
0.1
1
10
0 500 1000 1500 2000 2500 3000
NissekiBackgroundMercury
Energy (keV)
Nor
mal
ised
cou
ntin
g ra
te (d
-1ke
V-1
)
0.001
0.01
0.1
1
10
0 500 1000 1500 2000 2500 3000
NissekiBackgroundMercury
Energy (keV)
Nor
mal
ised
cou
ntin
g ra
te (d
-1ke
V-1
)
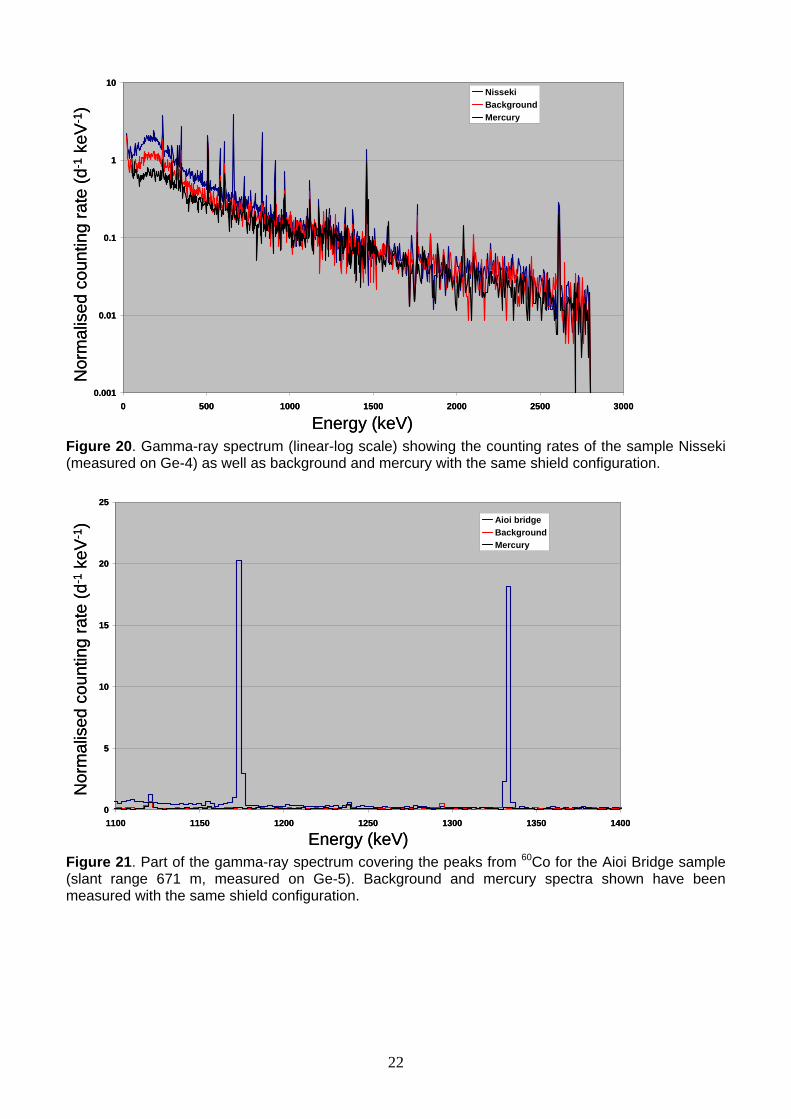
Figure 20. Gamma-ray spectrum (linear-log scale) showing the counting rates of the sample Nisseki (measured on Ge-4) as well as background and mercury with the same shield configuration.
0
5
10
15
20
25
1100 1150 1200 1250 1300 1350 1400
Aioi bridgeBackgroundMercury
Energy (keV)
Nor
mal
ised
cou
ntin
g ra
te (d
-1ke
V-1
)
0
5
10
15
20
25
1100 1150 1200 1250 1300 1350 1400
Aioi bridgeBackgroundMercury
Energy (keV)
Nor
mal
ised
cou
ntin
g ra
te (d
-1ke
V-1
)
Figure 21. Part of the gamma-ray spectrum covering the peaks from 60Co for the Aioi Bridge sample (slant range 671 m, measured on Ge-5). Background and mercury spectra shown have been measured with the same shield configuration.
23
0
0.2
0.4
0.6
0.8
1
1.2
1.4
1100 1150 1200 1250 1300 1350 1400
City HallBackgroundMercury
Energy (keV)
Nor
mal
ised
cou
ntin
g ra
te (d
-1ke
V-1
)
0
0.2
0.4
0.6
0.8
1
1.2
1.4
1100 1150 1200 1250 1300 1350 1400
City HallBackgroundMercury
Energy (keV)
Nor
mal
ised
cou
ntin
g ra
te (d
-1ke
V-1
)
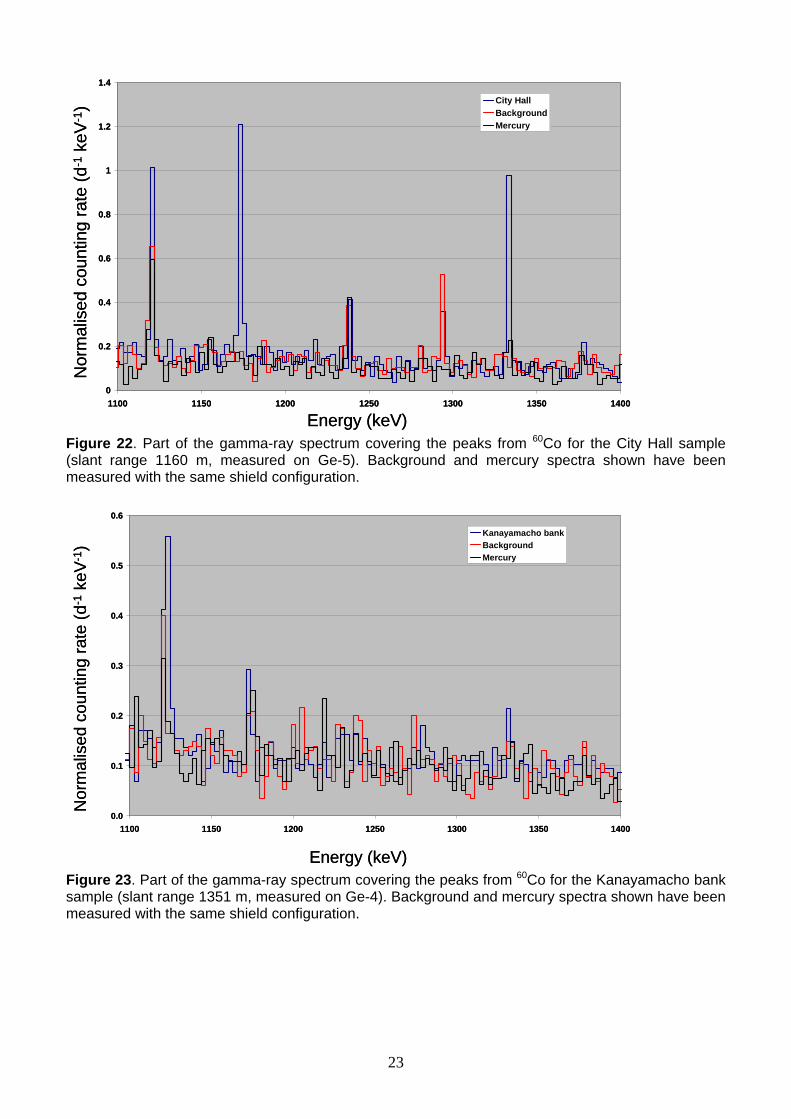
Figure 22. Part of the gamma-ray spectrum covering the peaks from 60Co for the City Hall sample (slant range 1160 m, measured on Ge-5). Background and mercury spectra shown have been measured with the same shield configuration.
0.0
0.1
0.2
0.3
0.4
0.5
0.6
1100 1150 1200 1250 1300 1350 1400
Kanayamacho bankBackgroundMercury
Energy (keV)
Nor
mal
ised
cou
ntin
g ra
te (d
-1ke
V-1 )
0.0
0.1
0.2
0.3
0.4
0.5
0.6
1100 1150 1200 1250 1300 1350 1400
Kanayamacho bankBackgroundMercury
Energy (keV)
Nor
mal
ised
cou
ntin
g ra
te (d
-1ke
V-1 )
Figure 23. Part of the gamma-ray spectrum covering the peaks from 60Co for the Kanayamacho bank sample (slant range 1351 m, measured on Ge-4). Background and mercury spectra shown have been measured with the same shield configuration.

24
0.0
0.1
0.2
0.3
0.4
0.5
0.6
0.7
0.8
1100 1150 1200 1250 1300 1350 1400
YokogawaBackgroundMercury
Energy (keV)
Nor
mal
ised
cou
ntin
g ra
te (d
-1ke
V-1
)
0.0
0.1
0.2
0.3
0.4
0.5
0.6
0.7
0.8
1100 1150 1200 1250 1300 1350 1400
YokogawaBackgroundMercury
Energy (keV)
Nor
mal
ised
cou
ntin
g ra
te (d
-1ke
V-1
)
Figure 24. Part of the gamma-ray spectrum covering the peaks from 60Co for the Yokogawa sample (slant range 1423 m, measured on Ge-4). Background and mercury spectra shown have been measured with the same shield configuration.
0.0
0.1
0.2
0.3
0.4
0.5
0.6
1100 1150 1200 1250 1300 1350 1400
NissekiBackgroundMercury
Energy (keV)
Nor
mal
ised
cou
ntin
g ra
te (d
-1ke
V-1 )
0.0
0.1
0.2
0.3
0.4
0.5
0.6
1100 1150 1200 1250 1300 1350 1400
NissekiBackgroundMercury
Energy (keV)
Nor
mal
ised
cou
ntin
g ra
te (d
-1ke
V-1 )
Figure 25. Part of the gamma-ray spectrum covering the peaks from 60Co for the Nisseki sample (slant range 1597 m, measured on Ge-4). Background and mercury spectra shown have been measured with the same shield configuration.

25
Table 7. Summary of activity at the start of the measurement
sample Slant range
(m)
Mass of sample
measured (g)
Activity at start of
measurement (mBq)
Specific activity
(mBq/g[Co])Measured
by
Aioi bridge 671 674.23 58 (3) 810(30) IRMM Kodokan building 937 116.00 2.02 (25) 120(11) IRMM
City hall 1160 1763.24 3.5 (5) 12.5(12) IRMM City hall-2 1160 756.60 0.5 (3)? 3.8(24) IRMM Hiroshima
bank Kanayamacho
1351 181.8 <0.1 <5 IRMM
Hiroshima bank
Kanayamacho 6
1351 220.6 <0.21 <13 IRMM
Kyu-Fuzoku elementary
school 1404 535.52 <0.11 <1.5 IRMM
Yokogawa bridge 1423 2697.02 0.62 (14) 1.18(18) IRMM
Hiroshima university 1523 1176.60 <0.1 <0.4 IRMM
Nisseki "1" and "5" 1597 1825.37 0.23(18)? 1.0(8) IRMM
Postal Saving Building 1700 1628.61 0.18 (11) 0.6(3) LNGS
Table 8. Summary of activity at reference date
sample Slant range (m)
Mass of sample
measured (g)
Activity at reference date (Bq)
Specific activity at reference
date (Bq/g[Co])
Measured by
Aioi bridge 671 674.23 152 (6) 2130 (800) IRMM Kodokan building 937 116.00 5.1 (5) 300(30) IRMM
City hall 1160 1763.24 9.3 (9) 33 (3) IRMM City hall-2 1160 756.60 1.6(10)? 12(8)? IRMM Hiroshima
bank Kanayamacho
1351 181.8 <0.26 <12 IRMM
Hiroshima bank
Kanayamacho 6
1351 220.6 <0.7 <40 IRMM
Kyu-Fuzoku elementary
school 1404 535.52 <0.5 <6.6 IRMM
Yokogawa bridge 1423 2697.02 1.7 (3) 3.2 (5) IRMM
Hiroshima university 1523 1176.60 <0.27 <1.1 IRMM
Nisseki "1" and "5" 1597 1825.37 0.7(6)? 3.3(25)? IRMM
Postal Saving Building 1700 1628.61 0.5 (3) 1.8 (11) LNGS

26
Tables 9 and 10 show the activity of each sample at the start of measurement and at reference date, respectively. Decision thresholds using a significance level of 0.05 and 0.10 are also indicated in order to obtain a better understanding of the significance of the results. Activities at the start of measurement are given only to indicate the sensitivity reached during the measurements and to assess the impact of environmental activation. The reference date is 1945-08-05 23:15 UTC (1945-08-06 08:15 local time). For the long range samples (further than City Hall), the main contribution to the uncertainties are due to the counting statistics from measurements of the sample and the background (measurements with and without mercury). Together their contribution to the combined standard uncertainty is 95% to 99%. However, for two samples (Kodokan and City Hall) their contribution varies between 83% and 88% as the contribution from the efficiency is between 12% and 17%. For the samples closer to epicentre than City Hall, the counting statistics is better and the dominating uncertainty is due to the efficiency calculation. The relative uncertainty for the efficiency for these samples is in the order of 10%. Table 9. Activities at the start of measurement together with associated decision thresholds.
Decision threshold (mBq) Sample
Activity at start of measurement
(mBq) α=0.05 α=0.10 Measured by
Aioi bridge 58 (3) 0.34 0.26 IRMM Kodokan building 2.02 (25) 0.16 0.12 IRMM
City hall 3.5 (5) 0.31 0.24 IRMM City hall-2a 0.5 (3) 0.4 0.3 IRMM
Hiroshima bank Kanayamacho 0.01 (10) 0.10 0.08 IRMM
Hiroshima bank Kanayamacho 6 < 0 0.21 0.17 IRMM
Kyu-Fuzoku elementary school < 0 0.11 0.09 IRMM
Yokogawa bridge 0.62 (14) 0.13 0.12 IRMM Hiroshima universitya 0.10 (9) 0.10 0.08 IRMM Nisseki “1” and “5”b 0.23 (18) 0.17 0.13 IRMM
Postal Saving Building 0.18 (11) 0.19 0.15 LNGS a: using only 1332 keV gamma-ray as 1173 keV gamma-ray gives result below decision threshold b: using only 1173 keV gamma-ray as 1332 keV gamma-ray gives result below decision threshold Table 10. Activities at reference date (1945-08-05 23:15 UTC) together with associated decision thresholds
Decision threshold (Bq) Sample
Activity at reference date
(Bq) α=0.05 α=0.10 Measured by
Aioi bridge 152 (6) 0.9 0.7 IRMM Kodokan building 5.1 (5) 0.4 0.3 IRMM
City hall 9.3 (9) 0.8 0.6 IRMM City hall-2a 1.6 (10) 1.3 1.0 IRMM
Hiroshima bank Kanayamacho
0.03 (21) 0.26 0.20 IRMM
Hiroshima bank Kanayamacho 6 < 0 0.7 0.5 IRMM
Kyu-Fuzoku elementary school < 0 0.50 0.39 IRMM
Yokogawa bridge 1.7 (3) 0.4 0.3 IRMM Hiroshima universitya 0.27 (24) 0.27 0.21 IRMM Nisseki “1” and “5”b 0.7 (6) 0.6 0.4 IRMM
Postal Saving Building 0.5 (3) 0.56 0.44 LNGS a: using only 1332 keV gamma-ray as 1173 keV gamma-ray gives result below decision threshold b: using only 1173 keV gamma-ray as 1332 keV gamma-ray gives result below decision threshold

27
More interesting is the specific activity, i.e the activity of 60Co per mass unit of total cobalt, (also given in Table 8) as this is more or less directly proportional to the neutron fluence in the area where the sample was located. Specific activities of the samples together with decision thresholds at reference date are given in Table 11. Table 11. Specific activities at reference date together with associated decision thresholds.
Decision threshold (Bq/g[Co]) sample Specific activity at reference date
(Bq/g[Co]) α=0.05 α=0.10
Measured by
Aioi bridge 2130 (800) 12 10 IRMM Kodokan building 300 (30) 23 18 IRMM
City hall 33 (3) 3 2.3 IRMM City hall-2a 12 (8) 10 8 IRMM
Hiroshima bank Kanayamacho
1 (9) 12 10 IRMM
Hiroshima bank Kanayamacho 6 < 0 40 30 IRMM
Kyu-Fuzoku elementary school < 0 6.6 5.1 IRMM
Yokogawa bridge 3.2 (5) 0.6 0.5 IRMM Hiroshima universitya 1.1 (10) 1.1 0.9 IRMM Nisseki “1” and “5”b 3.3 (25) 2.5 1.9 IRMM
Postal Saving Building 1.8 (11) 1.9 1.5 LNGS a: using only 1332 keV gamma-ray as 1173 keV gamma-ray gives result below decision threshold b: using only 1173 keV gamma-ray as 1332 keV gamma-ray gives result below decision threshold
3.1. Other activation products In the gamma spectra from the measurements there are also peaks at 811 keV (58Co) and 835 keV (54Mn). As the half-lives of these radionuclides are relatively short (71 d and 312 d, respectively) the peaks from these radionuclides can possibly be used to estimated the activation due to environmental neutrons and cosmic rays. Table 12 gives the activity of these radionuclides in the samples at the time when a sample was taken underground. Note that also in these calculations a homogeneous activity distribution was assumed. Table 12. Massic activity (i.e. activity per kg of sample mass) for 58Co and 54Mn. Decision thresholds calculated using α=0.05.
Activity at the start of measurement [mBq]
Massic activity at the start of measurement [mBq/kg] Sample Slant
range [m] Mass [kg]
58Co 54Mn 58Co 54Mn Aioi bridge 671 0.6742 <0.6 1.3(3) <0.9 1.9(5) Kodokan 937 0.1160 <0.18 <0.16 <1.5 <1.3 City Hall 1160 1.7632 <0.5 2.3(4) <0.27 1.31(22) City Hall 2 1160 0.7566 <0.4 1.7(3) <0.6 2.2(4) Bank 1351 0.1818 0.47(9) 0.41(7) 2.6(5) 2.3(4) Bank-6 1370 0.2206 0.27(12) 0.54(13) 1.2(6) 2.5(6) Kyu-Fuzoku 1404 0.5355 <0.11 0.93(13) <0.21 1.74(25) Yokogawa 1423 2.6970 0.23(8) 4.3(5) 0.08(3) 1.60(17) University 1523 1.1766 <0.18 2.4(3) <0.16 2.02(22) Nisseki 1597 1.8254 <0.20 3.6(4) <0.11 1.96(22) Postal Saving Building 1700 1.628 1.2(2) 0.75(12)

28
4. Activation of environmental neutrons The main factor limiting the possibility of using 60Co in steel as a monitor for retrospective neutron exposure, is the level of the activation due to environmental neutrons and cosmic rays. According to Shizuma (Shizuma et al., 2002), without self-shielding the specific saturation activity of 60Co in steel is about 3 mBq/g(Co) (=3·10-6 Bq/mg(Co)), which is shown as a red line in Figure 26. This corresponds to a specific activity of 0.009 Bq/mg(Co) at the reference date in 1945. According to model calculations in DS02 this specific activity was obtained at a slant range of about 1400 m. As discussed earlier the self-shielding results in lower activation in massive samples, which could indicate the activities measured for the long range samples in this study presumable to a large extent is still due to A-bomb activation. Nevertheless it is not possible anymore to determine the exact activity of 60Co induced by the A-bomb in steel samples at slant ranges exceeding about 1400 m. It is, however, possible to refute earlier claims of higher specific activities of 60Co at these distances.
0.01
0.10
1.00
10.00
100.00
1000.00
500 600 700 800 900 1000 1100 1200 1300 1400 1500 1600 1700 1800 1900
new datanew data, decision thresholdsAioi bridge Kodokan building
City Hall
City Hall 2
BankBank 6
PostalSavingBuilding
University
Nisseki
Yokogawa bridgeApproximate level of environmental activation(no neutron self-shielding taken into account)
500 600 700 800 900 1000 1100 1200 1300 1400 1500 1600 1700 1800 190010-2
10-1
100
101
102
103
Slant range (m)
Spec
ific
activ
ity a
t the
sta
rtof
mea
sure
men
t (m
Bq/
g [C
o])
Kyu Fuzoku
Figure 26. Specific 60Co activity at the start of measurement.

29
5. Discussion As already mentioned, it is important to compare the experimental values with model calculations that are the basis of the international regulations concerning doses. Fig. 27 shows two curves from the DS86 and DS02 models, together with the activity results reported here. It shows also the previous results obtained after chemical pre-concentration of cobalt (Shizuma et al., 1998) and the results of the first IRMM-PTB study (Hult et al., 2004).
0.0001
0.001
0.01
0.1
1
10
100
500 600 700 800 900 1000 1100 1200 1300 1400 1500 1600 1700 1800 1900
previous workIRMM data from 2003Decision thresholds - IRMM 2003DS86DS02New datanew data, decision thresholds
Slant range (m)1900500 600 700 800 900 1000 1100 1200 1300 1400 1500 1600 1700 1800
10-4
100
10-3
10-1
10-2
101
102
A-dome
Aioibridge
KirinBeerhall
Kodokan
City Hall
City Hall 2
Bank
Bank 6
PostalSavingBuildingYokogawa bridge
HiroshimaUniversity
Nisseki
Red CrossHospital(pipe)
Red CrossHospital(ladder)
Bank ofCredit
Spec
ific
activ
ity a
tre
fere
nce
date
(Bq/
mg [
Co]
)
Kyu Fuzoku
Figure 27: Specific 60Co activity (i.e per mg of Co) at the reference date in 1945 as a function of the slant range from the epicentre. It should be noted that these results do not take into account corrections for neutrons self-absorption in the samples, which is probably the main reason why the (relatively) thick samples appear in this graph with specific activities below the DS86 and DS02 curves. This is particularly pronounced for the "Aioi bridge" sample (dimensions 108x84x45 mm). "City Hall 2" is also quite low compared to theoretical value although it is not so thick (diameter 18 mm). This sample was measured for 29 days and the number of counts in the 1173 keV and 1332 keV gamma-rays peaks was around 20 whereas according to the theoretical curves, it should have been around 70. Since the first City Hall sample has a higher specific activity one could speculate that the "City Hall 2" sample was somewhat shielded from the explosion. For some of the samples, only decision thresholds are given. This is the case for the two Kanayamacho bank samples. "Kanayamacho bank-6" is claimed to have been directly exposed to the bomb while this was not considered certain for the other bank sample. Those two samples were bars with a diameter of 15 mm. For the University sample, the number of counts is at the level of the (5%) decision threshold and about 60% of what it should be according to the theoretical curves although this sample was also not

30
amongst the thickest ones. It should be noted that in order to obtain "enough" mass, two different samples from the university were measured together and impact of this might be difficult to assess in case the two samples were activated differently. The low values that were obtained can even so be a useful indication of the level of induced activity. As discussed in Chapter 4, the effect of environmental neutrons is detrimental at slant ranges above 1400 m. Nevertheless It is possible to refute earlier measurements yielding specific 60Co activities 10 to 100 times higher than DS86 and DS02 predictions at these distances. These measurements should therefore increase confidence in the existing dosimetry model (DS02).
6. Conclusions It is important for the confidence in the model calculations presented in the DS02 to quantify 60Co in steel at slant ranges greater than 1000 m. This report presents the lowest specific activities of 60Co ever measured in steel samples from Hiroshima. The main limit in the measurements presented here were from 60Co induced by environmental neutrons and cosmic rays. Although the influence of environmental activation is significant at slant ranges greater than 1400 m, these extremely low-level measurements should serve the purpose of creating greater confidence in the DS02 model calculations.
6. References
Cullings, H.M., Fujita, S., Watanabe, T., Yamashita, T., Tanaka, K., Endo, S., Shizuma, K., Hoshi, M., Hasai, H. (2003), Sample collection and documentation, Dosimetry System 2002, 223-260.
DIN (1993), Nachweisgrenze und Erkennungsgrenze bei Kernstrahlungsmessungen; Zählende hochauflösende gammaspektrometrische Messungen ohne Berücksichtigung des Probenbehandlungseinflusses, Deutsches Institut für Normung E.V. (German National Standard), DIN 25482-5.
Etxebarria, N., Robouch, P. Pauwels, J., et al. (1996) Proceedings of the Second International k0-Users Workshop, Ljubljana, Slovenia. pp. 137-141.
Gold, R., (1999), The Hiroshima neutron dosimetry enigma: Missing puzzle piece No.6, Radiation Measurements 30, 435-451.
Hoshi, M., Yokoro, K., Sawada, S., Shizuma, K., Iwatani, K., Hasai, H., Oka, T., Morishima, H., Brenner, D.J.,(1989), Europium-152 activity induced by Hiroshima atomic bomb neutrons: comparison with the 32P, 60Co, and 152Eu activities in dosimetry system 1986 (DS86), Health Physics 57, 831-837.
Hoshi, M., Takada, J., Endo, S., Shizuma, K., Iwatani, K., Oka, T., Fujita, S., Hasai, H., (1998), Problems of radiation dose evaluation in Hiroshima and Nagasaki and their explanation, Radiation Protection Dosimetry 77, 15-23.
Hult, M., Gasparro, J., Vasselli, R., Shizuma, K., Hoshi, M., Arnold, D., Neumaier, S., (2004) Deep underground measurements of 60Co in steel exposed to the Hiroshima atomic bomb explosion, Appl. Radiat. Isot. 61, 173-177
Hult, M., Preuße, W., Gasparro, J., Köhler, M., (2006) Underground gamma-ray spectrometry, Acta Chimica Slovenica 53, 1-7.

31
Hult, M., Gasparro, J., Lindahl, P., Marissens, G., Fessler, A., Johnston, P.N., (2008) On the use of mercury as a means of locating background sources in ultra low-background HPGe-detector systems, Appl. Radiat. Isot. 66, 829-834.
ISO/IEC/OIML/BIPM (1993). Guide to the expression of uncertainty in measurement, (1st ed.). International Standard Organisation, Geneva, Switzerland.
ISO (2000). Determination of the detection limit and decision threshold for ionizing radiation measurements- Part 3: Fundamentals and application to counting measurements by high resolution gamma spectrometry, without the influence of sample treatment, (1st ed.). International Standard Organisation, Geneva, Switzerland. ISO 11929-3.
Komura, K., Hamajima, Y., (2004) Ogoya underground laboratory for the measurement of extremely low levels of environmental radioactivity: review of recent projects carried out at OUL, Appl. Radiat. Isot. 61, 185-189
Komura, K., Hoshi, M., Endo, S., Imanaka, T., Fukushima, H.,(2006) Ultra Low-Background Measurement of 152Eu in Hiroshima samples, Dosimetry System 2002, 600-604.
Komura, K., Hoshi, M., Endo, S., Imanaka, T., Egbert, S.D., Rühm, W., Fukushima, H., Fujita, S., (2007), Atomic bomb induced 152Eu: reconciliation of discrepancy between measurements and calculation, health physics 92, 366-370.
Laubenstein, M., Hult, M., Gasparro, J., Heusser, G., Köhler, M., Neumaier, S., Arnold, D., Povinec, P., Reyss, J.-L., Schwaiger, M., Theodorsson, P., (2004) Underground Measurement of Radioactivity, Appl. Radiat. Isot. 61/2-3, 167-172
Laubenstein, M., Heusser, G., (2008) Cosmogenic radionuclides in metals as indicator for sea level exposure history, Appl. Radiat. Isot. 67, 750-754.
Nelson, W.R., Hirayama, H., Rogers, D.W.O., (1985). The EGS4 code system. SLAC Report 265.
Radiation Effects Research Foundation (RERF), (1987). In: Roesch, W.C. (Ed.), US–Japan Joint Reassessment of Atomic Bomb Radiation Dosimetry in Hiroshima and Nagasaki, Vols. 1 and 2. DS86, Dosimetry System 1986. Radiation Effects Research Foundation, Hiroshima, Japan. http://www.rerf.or.jp/shared/ds86/ds86a.html http://www.rerf.or.jp/shared/ds86/ds86b.html (accessed 2008-11-07)
Radiation Effects Research Foundation (RERF), (2003). US–Japan Joint Reassessment of Atomic Bomb Radiation Dosimetry in Hiroshima and Nagasaki, Vols. 1 and 2. DS02, Dosimetry System 2002. Radiation Effects Research Foundation, Hiroshima, Japan. http://www.rerf.or.jp/shared/ds02/index.html http://www.rerf.or.jp/shared/ds02/index2.html (accessed 2008-11-07)
Shizuma, K., Iwatani, K., Hasai, H., Oka, T., Endo, S., Takada, J., Hoshi, M., Fujita, S., Watanabe, T., Imanaka, T., (1998). Residual 60Co activity in steel samples exposed to the Hiroshima atomic-bomb neutrons. Health Phys. 75 (3), 278–284.
Shizuma, K., Endo, S., Hoshi, M., Takada, J., Iwatani, K., Hasai, H., Oka, T., Shimazaki, T., Okumura, Y., Fujita, S., Watanabe, T., Imanaka, T., (2002) Measurement of Residual 60Co Activity induced by atomic-bomb neutrons in Nagasaki and background contribution by environmental neutrons. J. Radiat. Res. 43, 387-396.
European Commission EUR 24146 EN – Joint Research Centre – Institute for Reference Materials and Measurements Title: Measurements of 60Co in massive steel samples exposed to the Hiroshima atomic bomb explosion Authors: J. Gasparro, M. Hult, G. Marissens, M. Hoshi, K. Tanaka, S. Endo and M. Laubenstein Luxembourg: Office for Official Publications of the European Communities 2010 – 31 pp. – 21.0 x 29.7 cm EUR – Scientific and Technical Research series – ISSN 1018-5593 ISBN 978-92-79-14851-4 DOI 10.2787/22773 Abstract In order to help solving discrepancies in retrospective Hiroshima dosimetry, sixteen steel samples from Hiroshima were measured in the underground laboratory HADES. The aim was to measure the specific activity of 60Co. Although it was found that activities at long range (> 1300 m slant range) were mainly cosmogenically induced, the activities were so low that former measurement that were 10 to 100 times higher than predicted by computer model calculations in DS86 and DS02 could be refuted. As a consequence, the confidence in the existing dose estimates has become stronger.
How to obtain EU publications Our priced publications are available from EU Bookshop (http://bookshop.europa.eu), where you can place an order with the sales agent of your choice. The Publications Office has a worldwide network of sales agents. You can obtain their contact details by sending a fax to (352) 29 29-42758.

The mission of the JRC is to provide customer-driven scientific and technical support for the conception, development, implementation and monitoring of EU policies. As a service of the European Commission, the JRC functions as a reference centre of science and technology for the Union. Close to the policy-making process, it serves the common interest of the Member States, while being independent of special interests, whether private or national.
LA
-NA
-24146-EN-C