measurements and mop (measures of...
TRANSCRIPT

Service Engineeringhttp://ie.technion.ac.il/serveng200·
Measurements and MOP (Measures Of Performance)
Why Now? Why Measure?
Measurements - Some Empirical Axioms
Transaction-based (Event-based) Data; Time statistics
• Face-to-Face: The T, C, S, I, F, O methods.
• Telephone: ACD, CTI/CRM, Surveys.
• Internet: Log files.
• Transportation: The Hertzel-Balfur intersection.
• Administration: Project Management, Emergency Services, Government.
• Healthcare: Emergency Departments,...
Averages do NOT tell the whole story
The Systems/Network View
• Niagra Falls, A Bank, A Call Center.
• Networks: Decentralized Call Centers, Haifa City Hall, Shouldice Hospital.
Simple Tools: Pareto, Fishbone Diagrams, Histrograms. Sometimes enough, butoften lead to the use of models and, moreover:
Subtleties: What is Service Time, Customers Patience (later)
Sample Size Matters
Scales; Frequencies of use; Model-based Database (eg. DATA MOCCA =Data Models for Call Center Analysis; Extansions to Healthcare, Internert,...)
The Fluid View: Introduction
Lord Kelvin said (roughly) the following: “We can not understand (do sciencewith, manage) that which we can not measure (quantify).” Galileo Galileiadds: “Measure what can be measured, and make measurable what can not bemeasured.” (Does this really apply when “measuring people”?) And LeonardCohen sings in “The Future”: Won’t be nothing = Nothing you can measureanymore.
1

Why Only Now?
• History– Telephone - 1910 (Erlang, Palm) – Computers - 1960 (Moore, Kleinrock) – Transportation - 1960 (Newell)– Manufacturing - 1970 (Jackson, Solberg) – Communications - 1980,...
• Services– Research: academic, anecdotal– Public sector: monopoly, no resources– Management: vision, intuition– Attitude: customer neglect, we’re experts– Technology: Telephone, ... ,Multimedia,...
– Measurements• Why bother? • Time statistics scarce

Service Engineeringhttp://ie.technion.ac.il/serveng200·
Call Center Measurements, Data Models and Data Analysis
Adapted from: Telephone Call Centers: Tutorial, Review, and Research Prospects
By Noah Gans (Wharton), Ger Koole (Vrije Universiteit) and Avishai Mandelbaum (Technion).Published in Manufacturing and Service Operations Management (M&SOM), 5 (2), 2003;
downloadable from http://ie.technion.ac.il/serveng/References/CCReview.pdf
Abstract: Telephone call centers are an integral part of many businesses, and their economicrole is significant and growing. They are also fascinating socio-technical systems in which thebehavior of customers and employees is closely intertwined with physical performance measures.In these environments traditional operational models are of great value – and at the same timefundamentally limited – in their ability to characterize system performance.
We review the state of research on telephone call centers. We begin with a tutorial on how callcenters function and proceed to survey academic research devoted to the management of their op-erations. We then outline important problems that have not been addressed and identify promisingdirections for future research.
1 Data Generation and Reporting
As it operates, a large call center generates vast amounts of data. Its IVR(s) and ACD are special-purpose computers that use data to mediate the flow of calls. (Acronyms are explained in theAppendix at the end.) Each time one of these switches takes an action, it records the call’sidentification number, the action taken, the elapsed time since the previous action, as well as otherpieces of information. As a call winds its way through a call center, a large number of these recordsmay be generated.
From these records, a detailed history of each call that enters the system can, in theory, bereconstructed: when it arrived; who was the caller; what actions the caller took in the IVR andhow long each action took; whether and how long the caller waited in queue; whether and for howlong a CSR served the call; who was the CSR. If the call center uses CTI, then additional datafrom the company’s information systems may be included in the record: what the call was about;the types of actions taken by a CSR; related account information.
In practice, call centers have not typically stored or analyzed records of individual calls, however.This may be due, in part, to the historically high cost of maintaining adequately large databases– a large call center generates many gigabytes of call-by-call data each month – but clearly thesequantities of data are no longer prohibitively expensive to store. It is also likely due to the factthat the software used to manage call centers – itself developed at a time when data storage wasexpensive – often uses only simple models which require limited, summary statistics. Finally, webelieve that it is due to lack of understanding of how and why more detailed analyses should becarried out.
1

29/07/2006 5:27 PM
DATA-MOCCA DATA MOdel for Call Center Analysis
Volume 1
Model Description and Introduction to User Interface
Dr Valery Trofimov
Professor Paul D. Feigin Professor Avishai Mandelbaum
Ms Eva Ishay Ms Ella Nadjharov
Created: August, 2004 Last Revised: July 29, 2006

7 A Vision: Central Repository for Call-Center Data and Exper-tise
A prerequisite for understanding the financial effects of operational decisions is the ability to analyzean integrated data set that includes both operational (ACD) and marketing / business (customerinformation systems) data. With this information, one can attempt to tease out the longer-term,financial effects of operational policies.
Our experience has been that both types of data are very difficult to access, however. Onereason for this is technical. Only recently have the manufacturers of telephone equipment givencustomers something of an “off the shelf” ability to capture, store, and retrieve detailed, call-by-call data. Similarly, the integration of these operational data with the business data capturedin customer information systems is only now becoming widely available. Another reason stemsfrom confidentiality concerns; companies are rightly wary of releasing customer information. Oncemanagers recognize the great untapped value of these data, we believe they will employ mechanismsfor preserving confidentiality in order to reap the benefit.
Ultimately, we envision a data-repository that is continuously fed by many call centers of varyingtypes. The collected data would be continuously and automatically analyzed, from both operationsand marketing perspectives. Then the data would be both archived and fed back to the originatingcall centers, who would use it (through visualization tools) to support ongoing operations, as wellas tactical and strategic goals.
Little imagination is required for appreciating the value of such a data-base. As a start, itsdeveloper could become a benchmark that sets industry standards, as far as customer-service qualityand call-center efficiency are concerned. As already mentioned, such a data-base would enable theidentification of success-drivers of call-center business transaction.
A Glossary of Call-Center Acronyms
Acronym Description DefinitionACD automatic call distributor p. ??ANI automatic number identification p. ??ASA average speed of answer p. ??CRM customer relationship management p. ??CSR customer service representative p. ??CTI computer-telephony integration p. ??DNIS dialed number identification service p. ??IVR interactive voice response unit (also called VRU) p. ??PABX private automatic branch exchange (also called PBX) p. ??PBX private automatic branch exchange (also called PABX) p. ??PSTN public switched telephone network p. ??QED Quality and Efficiency Driven (operational regime) p. ??TSF telephone service factor (also called the ‘service level’) p. ??VRU interactive voice response unit (also called IVR) p. ??WFM workforce management p. ??
7


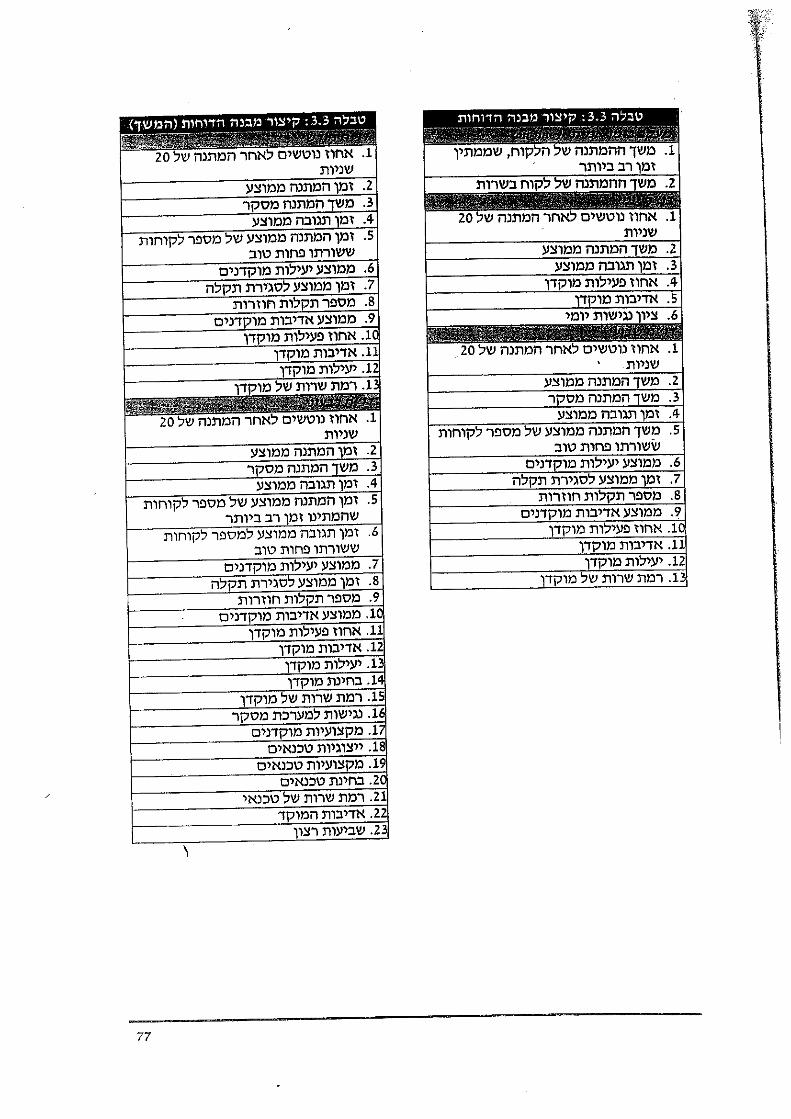
“Production” Of Justice
Queue
Mile Stone
Activity
Appeal
Proceedings
Closure
Prepare AllocateOpen File
Avg. sojourn time ≈ in months / years
Processing time ≈ in mins / hours / days
Phase Transition
Phase
45 100
118
59
33
.
.
.
..
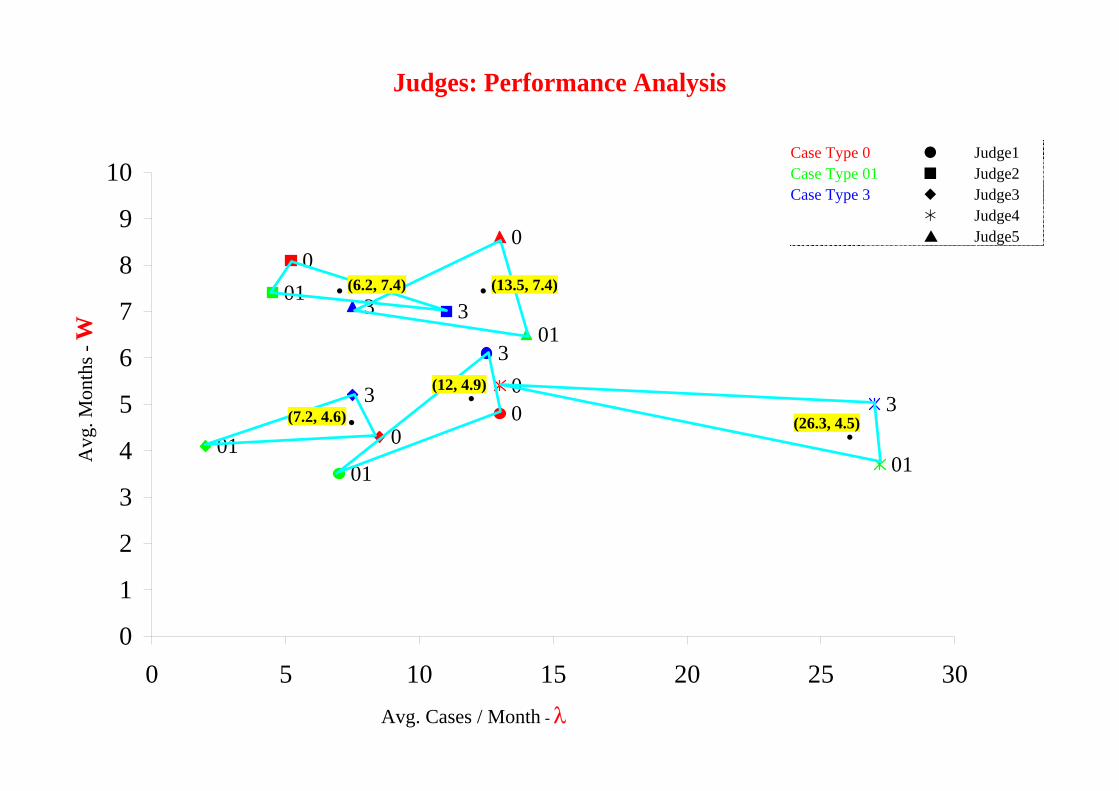
(6.2, 7.4) (13.5, 7.4)
(26.3, 4.5)
(12, 4.9)
(7.2, 4.6) 3
001
3
001
01
0
3
01
3
00
3
01
0
1
2
3
4
5
6
7
8
9
10
0 5 10 15 20 25 30
Judges: Performance Analysis
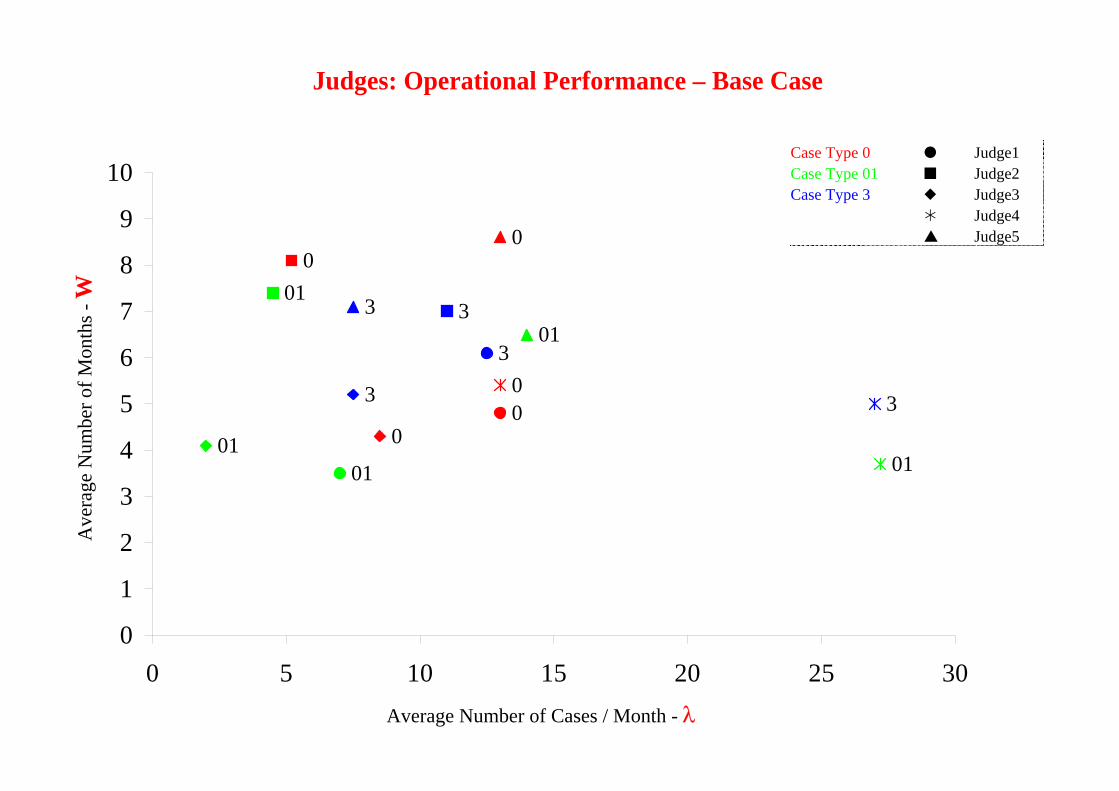
Case Type 0 Judge1 Case Type 01 Judge2 Case Type 3 Judge3 Judge4 Judge5
Judges: Performance Analysis Judges: Performance by Case-Type
Ave
rage
Num
ber o
f Mon
ths -
W
Average Number of Cases / Month - λ
Judges: Operational Performance – Base Case

45 100
118
59
33
.
.
.
..
(6.2, 7.4) (13.5, 7.4)
(26.3, 4.5)
(12, 4.9)
(7.2, 4.6) 3
001
3
001
01
0
3
01
3
00
3
01
0
1
2
3
4
5
6
7
8
9
10
0 5 10 15 20 25 30
Judges: Performance Analysis
Case Type 0 Judge1 Case Type 01 Judge2 Case Type 3 Judge3 Judge4 Judge5
Ave
rage
Num
ber o
f Mon
ths -
W
Average Number of Cases / Month - λ
Judges: Operational Performance – Base Case Judges: Performance Analysis Judges: Performance by Case-Type

(6.2, 7.4) (13.5, 7.4)
(26.3, 4.5)
(12, 4.9)
(7.2, 4.6)
.
.
.
..
3
001
3
001
01
0
3
01
3
00
3
01
0
1
2
3
4
5
6
7
8
9
10
0 5 10 15 20 25 30
Judges: Performance Analysis
Case Type 0 Judge1 Case Type 01 Judge2 Case Type 3 Judge3 Judge4 Judge5
Avg
. Mon
ths -
W
Avg. Cases / Month - λ
3
001
3
001
01
0
3
01
3
00
3
01
0
1
2
3
4
5
6
7
8
9
10
0 5 10 15 20 25 30
(6.2, 7.4) (13.5, 7.4)
(26.3, 4.5)
(12, 4.9)
(7.2, 4.6)
.
.
.
..
Judges: Performance Analysis
Case Type 0 Judge1 Case Type 01 Judge2 Case Type 3 Judge3 Judge4 Judge5
Avg
. Mon
ths -
W
Avg. Cases / Month - λ

(6.2, 7.4) (13.5, 7.4)
(26.3, 4.5)
(12, 4.9)
(7.2, 4.6) 3
001
3
001
01
0
3
01
3
00
3
01
0
1
2
3
4
5
6
7
8
9
10
0 5 10 15 20 25 30
.
.
.
..
45 100
118
59
33
Judges: Performance Analysis
Case Type 0 Judge1 Case Type 01 Judge2 Case Type 3 Judge3 Judge4 Judge5
Avg
. Mon
ths -
W
Avg. Cases / Month - λ

Charlotte – Center 6/13/00 - Tue
Time Recvd Answ Abn %
ASA AHT Occ % On Prod%
On Prod FTE
Sch Open FTE
Sch Avail
% Total 20,577 19,860 ~3.0% 30 307 95.1% 85.4% 222.7 234.6 95.0%
8:00 332 308 7.2% 27 302 87.1% 79.5% 59.3 66.9 88.5%
8:30 653 615 5.8% 58 293 96.1% 81.1% 104.1 111.7 93.2%
9:00 866 796 8.1% 63 308 97.1% 84.7% 140.4 145.3 96.6%
9:30 1,152 1,138 1.2% 2l8 303 90.8% 81.6% 211.1 221.3 95.4%
10:00 1,330 1.286 3.3% 22 307 98.4% 84.3% 223.1 229.0 97.4%
10:30 1,364 1,338 1.9% 33 296 99.0% 84.1% 222.5 227.9 97.6%
11:00 1,380 1,280 7.2% 34 306 98.2% 84.0% 222.0 223.9 99.2%
11:30 1,272 1,247 2.0% 44 298 94.6% 82.8% 218.0 233.2 93.5%
12:00 1,179 1,177 0.2% 1 306 91.6% 88.6% 218.3 222.5 98.1%
12:30 1,174 1,160 1.2% 10 302 95.5% 93.6% 203.8 209.8 97.1%
13:00 1,018 999 1.9% 9 314 95.4% 91.2% 182.9 187.0 97.8%
13:30 1,061 961 9.4% 67 306 100.0% 88.9% 163.4 182.5 89.5%
14:00 1,173 1,082 7.8% 78 313 99.5% 85.7% 188.9 213.0 88.7%
14:30 1,212 1,179 2.7% 23 304 96.6% 86.0% 206.1 220.9 93.3%
15:00 1,137 1,122 1.3% 15 320 96.9% 83.5% 205.8 222.1 92.7%
15:30 1,169 1,137 2.7% 17 311 97.1% 84.6% 202.2 207.0 97.7%
16:00 1,107 1,059 4.3% 46 315 99.2% 79.4% 187.1 192.9 97.0%
16:30 914 892 2.4% 22 307 95.2% 81.8% 160.0 172.3 92.8%
17:00 615 615 0.0% 2 328 83.0% 93.6% 135.0 146.2 92.3%
17:30 420 420 0.0% 0 328 73.8% 95.4% 103.5 116.1 89.2%
18:00 49 49 0.0% 14 180 84.2% 89.1% 5.8 1.4 416.2%
36

Week from 11/2/1998 to 11/8/1998
Num
ber
of in
com
ing
calls
per
30-
min
ute
inte
rval
0
2000
4000
6000
8000
10000
12000
14000
16000Monday Tuesday Wednesday Thursday Friday Saturday Sunday

Q-Science
May 1959!
Dec 1995!
(Help Desk Institute)
Arrival Rate
Time 24 hrs
Time 24 hrs
% Arrivals
(Lee A.M., Applied Q-Th)

Arrival Process, in 1976 ( E. S. Buffa, M. J. Cosgrove, and B. J. Luce,
“An Integrated Work Shift Scheduling System”, Decision Sciences, 7, 620-630 (1976) )
Yearly Monthly
Daily Hourly

Arrival Process, in 1999
Yearly Monthly
Daily Hourly


�
�
�
�
Figure 12: Mean Service Time (Regular) vs. Time-of-day (95% CI) (n =
42613)
Time of Day
Mea
n S
ervi
ce T
ime
10 15 20
100
120
140
160
180
200
220
240
7 8 9 10 11 12 13 14 15 16 17 18 19 20 21 22 23 24
30

Measurements
• Data is the Language of Nature
• Prerequisite for Science, Engineering and Management, yet
• Empirical “Axiom” = Problems with Historical Records
- The data you need is not there for you to use:
Not collected or erased, contaminated, …
- If there is data, it has ‘frequencies” but no “times”:
Fires, Courts, Hospitals, Projects, …
- If “times”, typically aggregated means but no std’s:
Let alone histograms / distributions,
Typically small samples, too short time-periods
Often paper-archives, not computerized
• Challenges – not Technological
- Too little: “Complete” Data (QIE, Abandons)
- Too much: Transaction-mgt., Big-Brother, Data Mining
• Scope
- Face-to-face services
- Tele-services (Telephony, Hopefully Internet)
- Administrative processes
- Healthcare


�
�
�
�
Figure 7: Service Time Distribution from This Call Center
18
�
�
�
�
Service Times are Lognormal
Figure 8: Histogram of Log(Service Time) (Nov + Dec)
0 2 4 6 8
0.0
0.1
0.2
0.3
0.4
Log(Service Time)
Pro
port
ion
19

Government Office - Cont'd
Service Times Histogram:
0%
10%
20%
30%
40%
0-1 1-2 2-3 3-4 4-5 5-6 6-7 7-8 8-9 9-10 10-11 11+
Minutes
Freq
uenc
y
AVG: 2.6 MinsSTD: 2.6 MinsN: 2261 (~450 per day)
Waiting Times Histogram:
0%
10%
20%
30%
40%
0-10 10-20 20-30 30-40 40-50 50-60 60-70 70-80 80-90 90-100 100-110 110+
Minutes
Freq
uenc
y
AVG: 27.6 MinsSTD: 28.1 MinsN: 2261
Note: Average sojourn time is 30.2 mins. Hence Service Index = 0.086. Too Low!
17


exact estimate 90%
� � � � � � � � � � � � � � �time
�
�
�
�
�
�
queu
e
F-Method Exact Queue Vs. Estimate

KeyCorp. Bank, 1995
• 10th largest bank holding company in US. • 5th largest branch network in US. • over 1300 branches, 210 million customer-teller
transactions per year.
SEMS- Service Excellence management
System
Results and Impact, Approximately from 1993 to 1995.
• Dissatisfied customers: 17 8%. • % customers that wait > 5 min: 14 4%. • % days with 90% of customers wait < 5 min: 55
89%. • % branches with 90% of customers • wait < 5 min: 42 94%. • Customer average session time reduced by 53%:
246 sec 115 sec. SEMS cost: $500.000 (including training). Estimated profit (95-99): $98.000.000

RFID Journal - Where is RFID's ROI in Health Care?
RFID JOURNAL : THE WORLD'S RFID AUTHORITY
THE WORLD'S RFID AUTHORITY
Where is RFID's ROI in Health Care?
The most strategic benefits for radio frequency identification in health care aren't necessarily found in applications with the most apparent return on investment.
Feb. 13, 2006—The U.S. health-care industry represents a large percentage of the overall U.S. economy and an area well known for being a late adopter of information technology. In fact, according to the U.S. Department of Health and Human Services (HHS), at the end of the 1990s, the health-care industry was investing only about $1,000 per worker on IT, compared with about $8,000 per worker for most other industries.
Yet, despite its late-adopter nature, the industry can benefit tremendously from IT innovation in order to improve patient safety and streamline business processes. The HHS estimates IT can reduce health-care costs up to 20 percent per year by saving time and reducing duplication and waste. IT innovation can come either in the form of established technologies deployed in new ways, or as emerging technologies applied to support new or existing processes.
The innovation that has traditionally occurred purely on the clinical side of health care is now starting to branch out into health-care IT (see The Importance of Industry Parallels). Within the broad context of IT innovation, RFID is just one area that shows promise for the future. According to BearingPoint's recent "RFID in Healthcare" survey of more than 300 health-care professionals, carried out in collaboration with the National Alliance for Health Information Technology (ITAA), we have found a wealth of application opportunity areas for RFID in organizations providing health care. Application areas include access control and security, asset tracking, laboratory order management, medical-equipment tracking,
patient flow, patient safety (identification and medication administration), pharmaceutical order management, real-time location systems, supply chain, smart shelving, wireless commerce and worker identification. We have found that the top three applications, in terms of business benefit for today's provider organizations, are commonly mobile-asset tracking, patient-flow management and medication administration. Each of these application areas has its own unique business case, and we'll explore these here.
The business case for tracking mobile assets is related to the ability to find assets such as infusion pumps
file:///C|/Documents%20and%20Settings/Shimrit/Deskto...20Where%20is%20RFID's%20ROI%20in%20Health%20Care.htm (1 of 3)25/03/2007 23:59:41

RFID Journal - Where is RFID's ROI in Health Care?
quickly, and to minimize time searching for these assets within an emergency department or other hospital unit. Real-time location systems are able to locate these assets within a few feet, or within a particular room. The time savings may be realized by both clinical engineering staff and nursing staff, and can often amount to a couple of days per week per person. Additionally, these faster search times can help improve overall asset utilization and, in certain circumstances, enable more streamlined inventories of equipment and lower rental costs. Tracking technologies can help to lower shrinkage when items get accidentally misplaced for extended periods of time, while also serving as a deterrent to deliberate theft. The return on investment can be quantified by looking at all of these factors and comparing them with the initial and ongoing costs involved in implementation. In this example, the business case is fairly straightforward to determine, and investment decisions typically ride upon the infrastructure costs of the network deployment.
The business case for better patient-flow management is related to the ability to streamline patient flow, and thus patient throughput, throughout the continuum of care. If an emergency department can process more patients per year, it can help delay the need to expand the unit or build additional facilities. Improved patient flow can also have a positive effect on patient satisfaction and provider business processes and recordkeeping. The ability to capture procedure start and stop times and patient wait times can help automate previously manual measurement techniques. It can also be used for Six Sigma purposes and continuous improvement. An electronic record of patient flow greatly improves the time taken to perform chart audits and can feed into the patient electronic medical record. Patient status can be electronically communicated to family members in waiting rooms via displays, helping reduce call volumes and associated costs. Better flow management may also help to increase revenue by more accurately capturing services rendered, enabling full billing for those services and supplies.
Finally, diversions where patients are redirected to other hospitals can be reduced since optimizing patient flow provides more capacity in the system, allowing patients to be treated on the spot. In this example, the business case is more complex and the return on investment can be harder to estimate. Patient-flow management is a complex topic requiring strong knowledge of current health-care processes and a holistic approach to implementation that factors in change management and continuous improvement, along with the technical aspects of implementation.
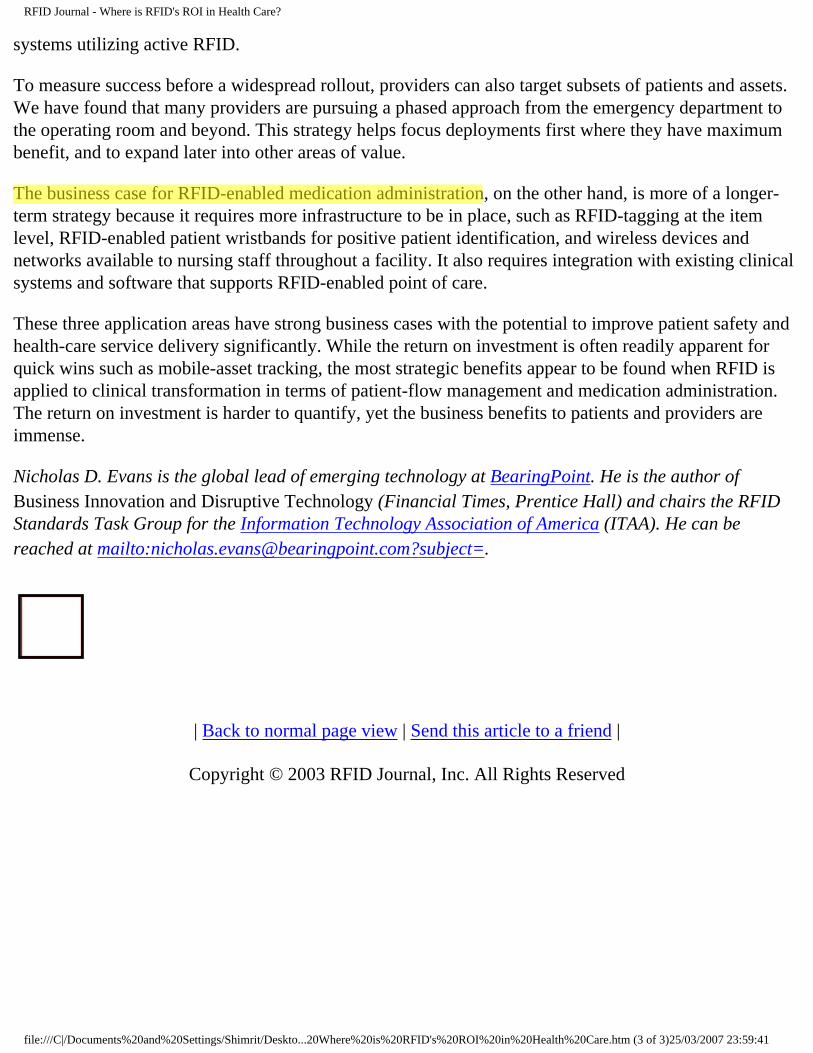
The business case for RFID-enabled medication administration relates to the well-known "five rights" of medication administration: right patient, right medication, right dose, right time and right route. Like bar codes, RFID can help ensure these five rights are upheld and, hence, contribute toward reduced medical error rates. While only 7 percent of erroneously administered doses, on average, lead to "adverse drug events"—causes harm to the patient—these kinds of preventable events can lead to increased patient stays averaging over two extra days and costing around $4,600 per event. Litigation from ADEs can be much more significant in terms of cost, and negative publicity is equally damaging. In this example, the business case is again harder to determine in terms of hard ROI numbers, but it is obviously an area of the most importance, since it directly relates to patient safety.
To execute on these three business cases, it is important to take a holistic approach and consider which initiatives are quick wins versus longer-term strategies. Tracking assets and improving patient flow can be implemented in parallel in order to leverage the same infrastructure—typically indoor positioning
file:///C|/Documents%20and%20Settings/Shimrit/Deskto...20Where%20is%20RFID's%20ROI%20in%20Health%20Care.htm (2 of 3)25/03/2007 23:59:41
RFID Journal - Where is RFID's ROI in Health Care?
systems utilizing active RFID.
To measure success before a widespread rollout, providers can also target subsets of patients and assets. We have found that many providers are pursuing a phased approach from the emergency department to the operating room and beyond. This strategy helps focus deployments first where they have maximum benefit, and to expand later into other areas of value.
The business case for RFID-enabled medication administration, on the other hand, is more of a longer-term strategy because it requires more infrastructure to be in place, such as RFID-tagging at the item level, RFID-enabled patient wristbands for positive patient identification, and wireless devices and networks available to nursing staff throughout a facility. It also requires integration with existing clinical systems and software that supports RFID-enabled point of care.
These three application areas have strong business cases with the potential to improve patient safety and health-care service delivery significantly. While the return on investment is often readily apparent for quick wins such as mobile-asset tracking, the most strategic benefits appear to be found when RFID is applied to clinical transformation in terms of patient-flow management and medication administration. The return on investment is harder to quantify, yet the business benefits to patients and providers are immense.
Nicholas D. Evans is the global lead of emerging technology at BearingPoint. He is the author of Business Innovation and Disruptive Technology (Financial Times, Prentice Hall) and chairs the RFID Standards Task Group for the Information Technology Association of America (ITAA). He can be reached at mailto:[email protected]?subject=.
| Back to normal page view | Send this article to a friend |
Copyright © 2003 RFID Journal, Inc. All Rights Reserved
file:///C|/Documents%20and%20Settings/Shimrit/Deskto...20Where%20is%20RFID's%20ROI%20in%20Health%20Care.htm (3 of 3)25/03/2007 23:59:41

RFID לשליטה באירוע רב נפגעים MCS
.טכניון, נ"ר בתעו"סטודנט לד, בשיתוף יריב מרמור, ם"ד רמב"מנהל מלר, ר שלומי ישראלית"ד
.נ"תעו, IBM Research in Haifa, ם"רמב: OCRלקראת פרויקט במסגרת
וחים הםעיקר השימושים המדו. בתחום הרפואה צוברת תאוצהRFIDהשימוש ב טכנולוגיית ה
זיהוי ומעקב אחר חולים •
, אנשי צוותזיהוי ומעקב •
)מכונות הנשמה למשל (רגישמעקב אחר ציוד רפואי •
בדיקות דםזיהוי ומעקב •
)מנות דם פלסמה או מנות טסיות( שנשלחים מבנק הדם תוצרי דםזיהוי ומעקב •
.יקרות/ חשובות תרופות זיהוי ומעקב אחר •
הן ברמת , על מנת לייעל תהליכי טיפולRFIDיתן להפיק ממערכות ה הכוונה היא לנצל את המידע שנהן ברמת המעקב אחר הטיפול והן ברמת השליטה על זרימת , )כוח אדם וציוד(הקצעת המשאבים
).עד לרזולוציה של זרימת החולה הבודד(החולים
/ קסיקולוגי המוני אירוע טו= אטה / אירוע רב נפגעים =ן "אר(למתאריו השונים , אירוע רב נפגעיםמאופיין בהגעה של פצועים רבים , )אירוע ביולוגיה/ אירוע קרינה / חומרי לחימה כימיים = ך "חל
פתיחת אתרי , )על פי תורה מוסדרת מראש(היערכות מיוחדת של בית החולים , בפרק זמן קצר .הקצאת כוח אדם וציוד ייעודי ועוד, חירום
. ציוד ועוד, כוח אדם–לבין הדרישה , ין הצרכים הרגעייםכ במתארים השונים קיים פער ב"בדחשוב לקבל תמונה מהירה מדוייקת וזמינה של המשאבים ומאידך לרכז את בשלבים הראשונים
.הדרישות
:איסוף הנתונים יכלו להתבצע במספר דרכים
.RFID, איסוף מבר קוד או מתויות זהוי אחרות, הקלדה למחשב, רישום ידני
רישום ידני איטי ומצריך . הנובעות מרישום שגוי, דני קיימות טעויות אינהרנטיות לשיטהברישום הילסיכום שיטה זו איטית ובעלת . העברה למחשב על מנת שהמנהל יוכל לקבל תמונת מצב ברורה
.פוטנציאל גבוה לטעות
. סיכוי להקלדת טעות בעלתו גם היא איטית, הקלדה למחשב
הנתונים . יתרונות ברורים, שאינה תלויה בהקלדה ומתבצעת מיידיתRFIDלשאיבת נתונים במערכת מנותחים מיידית ומוצגים במערכות השליטה כמעת , ללא צורך בהקלדה, נשאבים בצורה אקטיבית
on‐line.

.משתפרת יכולת השליטה של מנהלי האירוע, זמין ומדוייק יותר, ככל שהמידע אמין
בכל האירועים . ות רבה לצבירת המידע החל מהדקות הראשונותיש חשיב, מתערים שהוזכרובכלל כ .פצועים לאזורים שונים ולעיתים מרוחקים של בית החולים/ שמפנה חוליםtriageהללו מופעל
באנגלית נשמע יותר " ( הדברים הנכונים7עקרון "הצלחה במתארים אלו תתקבל אם נוכל לשמור על ):טוב
“Seven rights”: give the right medication to the right patient with the right dosage through the right route at the right time, and ensure that victims receive the right care at a mass casualty incident.
נות השימוש לבדוק היתכ,התרגיל הינו פלטפורמה מצויינת. ח"ך בביה"בסוף מאי מתקיים תרגיל חל .במתאר מרובה נפגעים, RFIDבטכנולוגיית ה
ואנשי הלוגיסטיקה ) אחים ורופאים(כמות המטפלים , באופן פרקטי נרצה ידע על כמות החולים .בכל אחד מהאתרים שנפרסים בתרגיל, )מנהלנים, משנעים, מאבטחים(
.נבדוק את האפשרות של הצגת המידע בצורה שתעזור לשליטה
).רישום ממוחשב( את המידע שמופק בטכנולוגיה זו למידע שמופק בעזרים הרגילים נוכל להשוות

MCE with RFID Support: Rambam Hospital, May 2010
Drill: Chemical Mass Casualty Event (MCE), Rambam Hospital
מאייר -קלים ודחק'מרתף פנימית ו-משפחותקרדיולוגיהעורנוירולוגיהבינוניים
נספח לנוהלקרדיולוגיה,עור,נוירולוגיה-בינונייםחדר אוכל-קשים
ד"מלר-משולבים
Focus on the red casualties - severely wounded (50+ in the drill)Note: 20 observers taking real-time measurements (validation)
22

MCE with RFID Support: Data Cleaning
Data-base Company report comment Asset id order Entry date Exit date Entry date Exit date
4 1 1:14:07 PM 1:14:00 PM 6 1 12:02:02 PM 12:33:10 PM 12:02:00 PM 12:33:00 PM 8 1 11:37:15 AM 12:40:17 PM 11:37:00 AM exit is missing
10 1 12:23:32 PM 12:38:23 PM 12:23:00 PM 12 1 12:12:47 PM 12:35:33 PM 12:35:00 PM entry is missing 15 1 1:07:15 PM 1:07:00 PM 16 1 11:18:19 AM 11:31:04 AM 11:18:00 AM 11:31:00 AM 17 1 1:03:31 PM 1:03:00 PM 18 1 1:07:54 PM 1:07:00 PM 19 1 12:01:58 PM 12:01:00 PM 20 1 11:37:21 AM 12:57:02 PM 11:37:00 AM 12:57:00 PM 21 1 12:01:16 PM 12:37:16 PM 12:01:00 PM
22 1 12:04:31 PM 12:20:40 PM first customer is missing
22 2 12:27:37 PM 12:27:00 PM 25 1 12:27:35 PM 1:07:28 PM 12:27:00 PM 1:07:00 PM 27 1 12:06:53 PM 12:06:00 PM
28 1 11:21:34 AM 11:41:06 AM 11:41:00 AM 11:53:00 AMexit time instead of entry time
29 1 12:21:06 PM 12:54:29 PM 12:21:00 PM 12:54:00 PM 31 1 11:40:54 AM 12:30:16 PM 11:40:00 AM 12:30:00 PM 31 2 12:37:57 PM 12:54:51 PM 12:37:00 PM 12:54:00 PM 32 1 11:27:11 AM 12:15:17 PM 11:27:00 AM 12:15:00 PM 33 1 12:05:50 PM 12:13:12 PM 12:05:00 PM 12:15:00 PM wrong exit time 35 1 11:31:48 AM 11:40:50 AM 11:31:00 AM 11:40:00 AM 36 1 12:06:23 PM 12:29:30 PM 12:06:00 PM 12:29:00 PM 37 1 11:31:50 AM 11:48:18 AM 11:31:00 AM 11:48:00 AM 37 2 12:59:21 PM 12:59:00 PM 40 1 12:09:33 PM 12:35:23 PM 12:09:00 PM 12:35:00 PM 43 1 12:58:21 PM 12:58:00 PM 44 1 11:21:25 AM 11:52:30 AM 11:52:00 AM entry is missing 46 1 12:03:56 PM 12:03:00 PM 48 1 11:19:47 AM 11:19:00 AM 49 1 12:20:36 PM 12:20:00 PM 52 1 11:21:29 AM 11:50:49 AM 11:21:00 AM 11:50:00 AM 52 2 12:10:07 PM 1:07:28 PM 12:10:00 PM 1:07:00 PM recorded as exit 53 1 12:24:26 PM 12:24:00 PM 57 1 11:32:02 AM 11:58:31 AM 11:58:00 AM entry is missing 57 2 12:59:41 PM 1:14:00 PM 12:59:00 PM 1:14:00 PM 60 1 12:27:12 PM 12:48:41 PM 12:27:00 PM 12:48:00 PM 63 1 12:10:04 PM 12:10:00 PM 64 1 11:30:29 AM 12:43:38 PM 11:30:00 AM 12:43:00 PM
Think “Cleaning” 60,000+ customers/day (call centers)?23
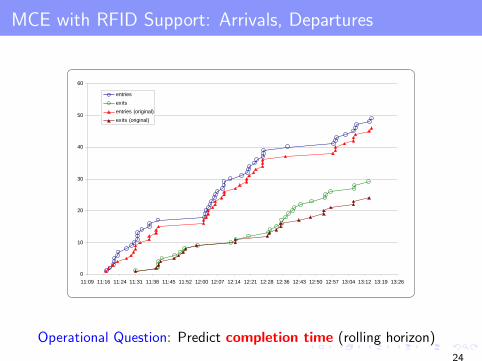
MCE with RFID Support: Arrivals, Departures Cleaning Data – An Example: RFID data in an MCE Drill
0
10
20
30
40
50
60
11:09 11:16 11:24 11:31 11:38 11:45 11:52 12:00 12:07 12:14 12:21 12:28 12:36 12:43 12:50 12:57 13:04 13:12 13:19 13:26
entriesexitsentries (original)exits (original)
0
5
10
15
20
25
30
11:09 11:16 11:24 11:31 11:38 11:45 11:52 12:00 12:07 12:14 12:21 12:28 12:36 12:43 12:50 12:57 13:04 13:12 13:19 13:26
number of patientsnumber of patients (original)
Operational Question: Predict completion time (rolling horizon)
24

MCE with RFID Support: # Severely Wounded Patients
Cleaning Data – An Example: RFID data in an MCE Drill
0
10
20
30
40
50
60
11:09 11:16 11:24 11:31 11:38 11:45 11:52 12:00 12:07 12:14 12:21 12:28 12:36 12:43 12:50 12:57 13:04 13:12 13:19 13:26
entriesexitsentries (original)exits (original)
0
5
10
15
20
25
30
11:09 11:16 11:24 11:31 11:38 11:45 11:52 12:00 12:07 12:14 12:21 12:28 12:36 12:43 12:50 12:57 13:04 13:12 13:19 13:26
number of patientsnumber of patients (original)
- Paths of doctors, nurses, patients (100+, 1 sec. resolution) ?
- What if 150+ casualties severely wounded (feasible) ?
25
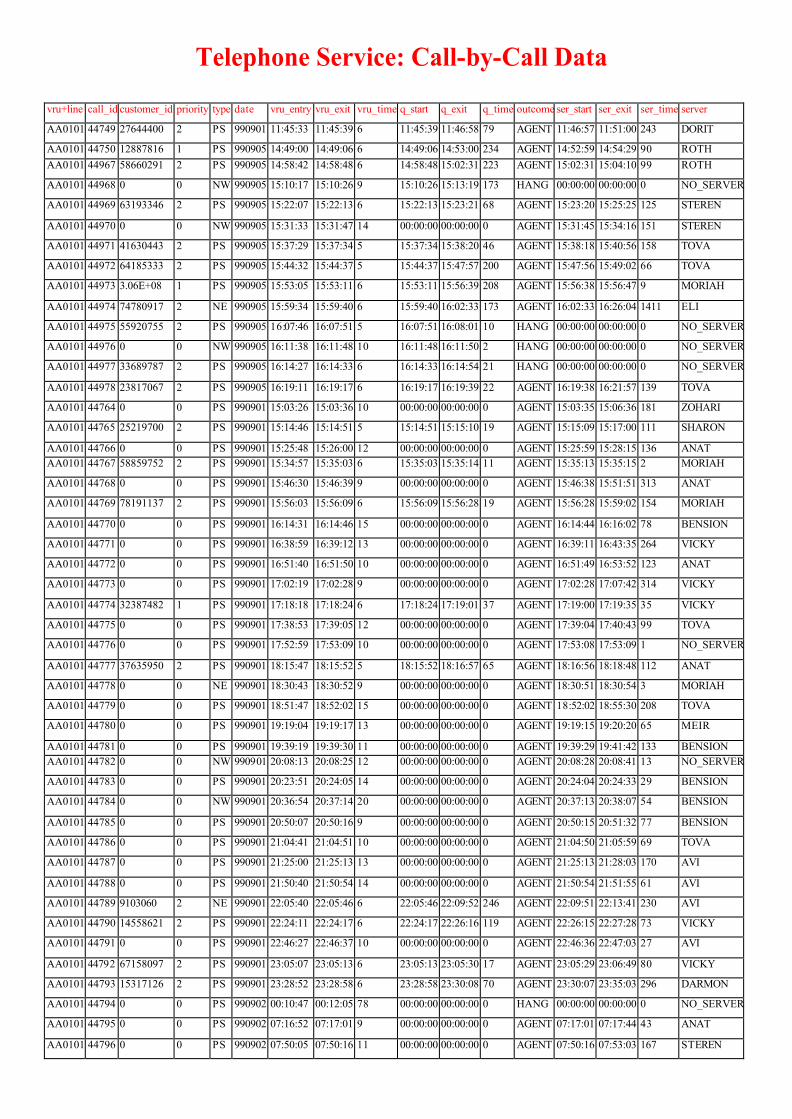
Telephone Service: Call-by-Call Data
vru+line call_id customer_id priority type date vru_entry vru_exit vru_time q_start q_exit q_time outcome ser_start ser_exit ser_time server
AA0101 44749 27644400 2 PS 990901 11:45:33 11:45:39 6 11:45:39 11:46:58 79 AGENT 11:46:57 11:51:00 243 DORIT
AA0101 44750 12887816 1 PS 990905 14:49:00 14:49:06 6 14:49:06 14:53:00 234 AGENT 14:52:59 14:54:29 90 ROTH AA0101 44967 58660291 2 PS 990905 14:58:42 14:58:48 6 14:58:48 15:02:31 223 AGENT 15:02:31 15:04:10 99 ROTH
AA0101 44968 0 0 NW 990905 15:10:17 15:10:26 9 15:10:26 15:13:19 173 HANG 00:00:00 00:00:00 0 NO_SERVER
AA0101 44969 63193346 2 PS 990905 15:22:07 15:22:13 6 15:22:13 15:23:21 68 AGENT 15:23:20 15:25:25 125 STEREN
AA0101 44970 0 0 NW 990905 15:31:33 15:31:47 14 00:00:00 00:00:00 0 AGENT 15:31:45 15:34:16 151 STEREN
AA0101 44971 41630443 2 PS 990905 15:37:29 15:37:34 5 15:37:34 15:38:20 46 AGENT 15:38:18 15:40:56 158 TOVA
AA0101 44972 64185333 2 PS 990905 15:44:32 15:44:37 5 15:44:37 15:47:57 200 AGENT 15:47:56 15:49:02 66 TOVA
AA0101 44973 3.06E+08 1 PS 990905 15:53:05 15:53:11 6 15:53:11 15:56:39 208 AGENT 15:56:38 15:56:47 9 MORIAH
AA0101 44974 74780917 2 NE 990905 15:59:34 15:59:40 6 15:59:40 16:02:33 173 AGENT 16:02:33 16:26:04 1411 ELI
AA0101 44975 55920755 2 PS 990905 16:07:46 16:07:51 5 16:07:51 16:08:01 10 HANG 00:00:00 00:00:00 0 NO_SERVER
AA0101 44976 0 0 NW 990905 16:11:38 16:11:48 10 16:11:48 16:11:50 2 HANG 00:00:00 00:00:00 0 NO_SERVER
AA0101 44977 33689787 2 PS 990905 16:14:27 16:14:33 6 16:14:33 16:14:54 21 HANG 00:00:00 00:00:00 0 NO_SERVER
AA0101 44978 23817067 2 PS 990905 16:19:11 16:19:17 6 16:19:17 16:19:39 22 AGENT 16:19:38 16:21:57 139 TOVA
AA0101 44764 0 0 PS 990901 15:03:26 15:03:36 10 00:00:00 00:00:00 0 AGENT 15:03:35 15:06:36 181 ZOHARI
AA0101 44765 25219700 2 PS 990901 15:14:46 15:14:51 5 15:14:51 15:15:10 19 AGENT 15:15:09 15:17:00 111 SHARON
AA0101 44766 0 0 PS 990901 15:25:48 15:26:00 12 00:00:00 00:00:00 0 AGENT 15:25:59 15:28:15 136 ANAT AA0101 44767 58859752 2 PS 990901 15:34:57 15:35:03 6 15:35:03 15:35:14 11 AGENT 15:35:13 15:35:15 2 MORIAH
AA0101 44768 0 0 PS 990901 15:46:30 15:46:39 9 00:00:00 00:00:00 0 AGENT 15:46:38 15:51:51 313 ANAT
AA0101 44769 78191137 2 PS 990901 15:56:03 15:56:09 6 15:56:09 15:56:28 19 AGENT 15:56:28 15:59:02 154 MORIAH
AA0101 44770 0 0 PS 990901 16:14:31 16:14:46 15 00:00:00 00:00:00 0 AGENT 16:14:44 16:16:02 78 BENSION
AA0101 44771 0 0 PS 990901 16:38:59 16:39:12 13 00:00:00 00:00:00 0 AGENT 16:39:11 16:43:35 264 VICKY
AA0101 44772 0 0 PS 990901 16:51:40 16:51:50 10 00:00:00 00:00:00 0 AGENT 16:51:49 16:53:52 123 ANAT
AA0101 44773 0 0 PS 990901 17:02:19 17:02:28 9 00:00:00 00:00:00 0 AGENT 17:02:28 17:07:42 314 VICKY
AA0101 44774 32387482 1 PS 990901 17:18:18 17:18:24 6 17:18:24 17:19:01 37 AGENT 17:19:00 17:19:35 35 VICKY
AA0101 44775 0 0 PS 990901 17:38:53 17:39:05 12 00:00:00 00:00:00 0 AGENT 17:39:04 17:40:43 99 TOVA
AA0101 44776 0 0 PS 990901 17:52:59 17:53:09 10 00:00:00 00:00:00 0 AGENT 17:53:08 17:53:09 1 NO_SERVER
AA0101 44777 37635950 2 PS 990901 18:15:47 18:15:52 5 18:15:52 18:16:57 65 AGENT 18:16:56 18:18:48 112 ANAT
AA0101 44778 0 0 NE 990901 18:30:43 18:30:52 9 00:00:00 00:00:00 0 AGENT 18:30:51 18:30:54 3 MORIAH
AA0101 44779 0 0 PS 990901 18:51:47 18:52:02 15 00:00:00 00:00:00 0 AGENT 18:52:02 18:55:30 208 TOVA
AA0101 44780 0 0 PS 990901 19:19:04 19:19:17 13 00:00:00 00:00:00 0 AGENT 19:19:15 19:20:20 65 MEIR
AA0101 44781 0 0 PS 990901 19:39:19 19:39:30 11 00:00:00 00:00:00 0 AGENT 19:39:29 19:41:42 133 BENSION AA0101 44782 0 0 NW 990901 20:08:13 20:08:25 12 00:00:00 00:00:00 0 AGENT 20:08:28 20:08:41 13 NO_SERVER
AA0101 44783 0 0 PS 990901 20:23:51 20:24:05 14 00:00:00 00:00:00 0 AGENT 20:24:04 20:24:33 29 BENSION
AA0101 44784 0 0 NW 990901 20:36:54 20:37:14 20 00:00:00 00:00:00 0 AGENT 20:37:13 20:38:07 54 BENSION
AA0101 44785 0 0 PS 990901 20:50:07 20:50:16 9 00:00:00 00:00:00 0 AGENT 20:50:15 20:51:32 77 BENSION
AA0101 44786 0 0 PS 990901 21:04:41 21:04:51 10 00:00:00 00:00:00 0 AGENT 21:04:50 21:05:59 69 TOVA
AA0101 44787 0 0 PS 990901 21:25:00 21:25:13 13 00:00:00 00:00:00 0 AGENT 21:25:13 21:28:03 170 AVI
AA0101 44788 0 0 PS 990901 21:50:40 21:50:54 14 00:00:00 00:00:00 0 AGENT 21:50:54 21:51:55 61 AVI
AA0101 44789 9103060 2 NE 990901 22:05:40 22:05:46 6 22:05:46 22:09:52 246 AGENT 22:09:51 22:13:41 230 AVI
AA0101 44790 14558621 2 PS 990901 22:24:11 22:24:17 6 22:24:17 22:26:16 119 AGENT 22:26:15 22:27:28 73 VICKY
AA0101 44791 0 0 PS 990901 22:46:27 22:46:37 10 00:00:00 00:00:00 0 AGENT 22:46:36 22:47:03 27 AVI
AA0101 44792 67158097 2 PS 990901 23:05:07 23:05:13 6 23:05:13 23:05:30 17 AGENT 23:05:29 23:06:49 80 VICKY
AA0101 44793 15317126 2 PS 990901 23:28:52 23:28:58 6 23:28:58 23:30:08 70 AGENT 23:30:07 23:35:03 296 DARMON
AA0101 44794 0 0 PS 990902 00:10:47 00:12:05 78 00:00:00 00:00:00 0 HANG 00:00:00 00:00:00 0 NO_SERVER
AA0101 44795 0 0 PS 990902 07:16:52 07:17:01 9 00:00:00 00:00:00 0 AGENT 07:17:01 07:17:44 43 ANAT
AA0101 44796 0 0 PS 990902 07:50:05 07:50:16 11 00:00:00 00:00:00 0 AGENT 07:50:16 07:53:03 167 STEREN


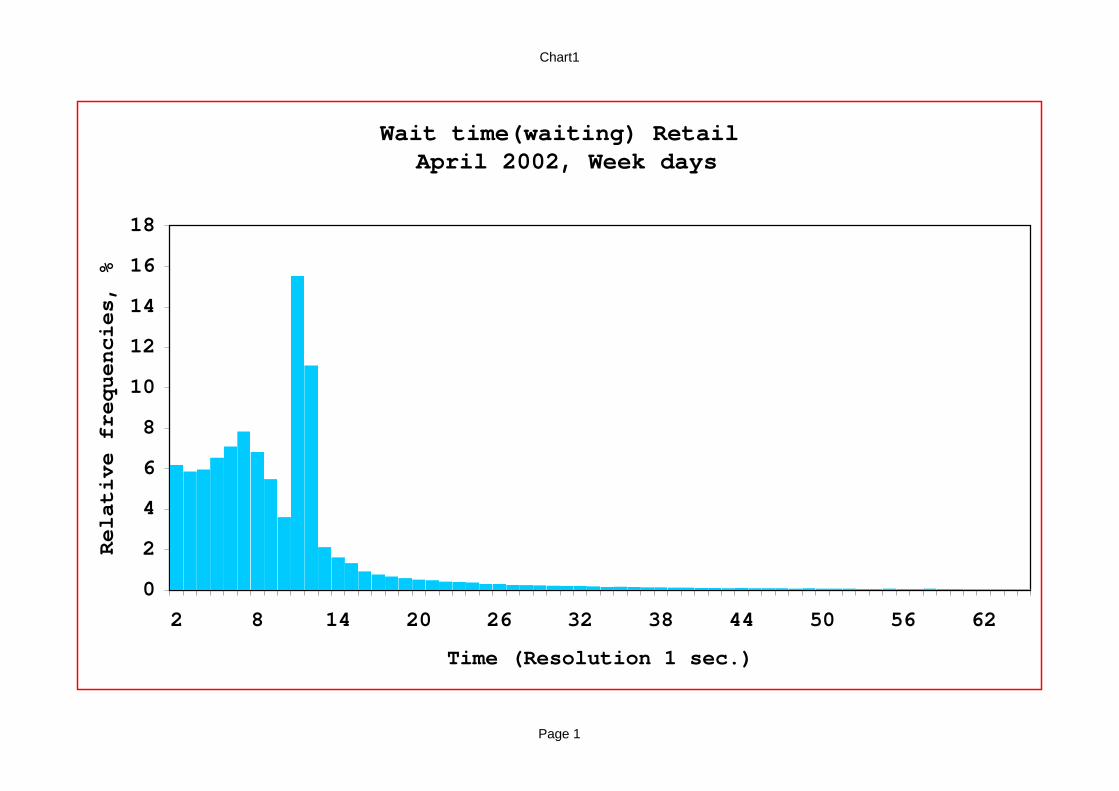
Chart1
Page 1
Wait time(waiting) Retail April 2002, Week days
0
2
4
6
8
10
12
14
16
18
2 8 14 20 26 32 38 44 50 56 62
Time (Resolution 1 sec.)
Relative frequencies, %

node 1 node 2
node 3
C
A
CC
A
A
8742
1418611712
488
731
1804
1618 171426
10126
254
14688
125
9254
193


Transportation: Throughput (Flow) vs. Occupancy
Free-Flow → Critical-Occupancy → Congestion (Human)
37
ED: Throughput (Flow) vs. Occupancy (Human)
Congestion-Dependent Flow-Rates: Light, Regular, Heavy
6.0
6.5
7.0
7.5
8.0
8.5
7 9 11 13 15 17 19 21 23 25 27 29 31 33 35 37 39 41 43 45 47 49 51 53 55 57 59 61
L (Number of Occupied Beds)
Pat
ient
s pe
r Day
per
Bed
l (L)m (L)
Empirical Analysis of an ED:Y. Marmor (PhD), Y. Tseytlin (MSc), G. Yom-Tov (PhD), Mor Armony.
38

(with Jennings, Massey, Whitt)
Time-Varying Queues: Predictable Variability
Arrivals
Queues
Waiting
45

Average Service Durations Over The Day
0
25
50
75
100
125
150
175
200
7:00 8:00 9:00 10:00 11:00 12:00 13:00 14:00 Avg.
Seco
nds
Tel-Aviv
Jerusalem
Raanana
3 Branches Provide the Same Tele-Service
0
5
10
15
20
25
30
8:00 9:00 10:00 11:00 12:00 13:00 14:00 Avg.
Min
utes
Archive
Visa
? Sample Size !
0
2
4
6
8
10
12
14
8:00 9:00 10:00 11:00 12:00 13:00 14:00 Avg.
Min
utes
Lamination
Tellers
Immigrants
Time or State Dependent ?
“Fluid” – view, but …
0
2
4
6
8
10
12
14
8:00 9:00 10:00 11:00 12:00 13:00 14:00 15:00 16:00 Avg.
Min
utes
Collection
Cashier
Hiuvim
3 Patterns


Arrival Process: Time Scales
Yearly
Monthly
Daily
Hourly
Strategic
Tactical
Operational
Regulatory

Custom Inspections at an Airport
Number of Checks Made During 1993:
Number of Checks Made in November 1993:
Average Number of Checks During the Day:
Source: Ben-Gurion Airport Custom Inspectors Division
Weekend Weekend Weekend Weekend
Day in Month
# C
heck
s
Holiday
Week in Year
# C
heck
s
Predictable?
# C
heck
s
Strike
Hour


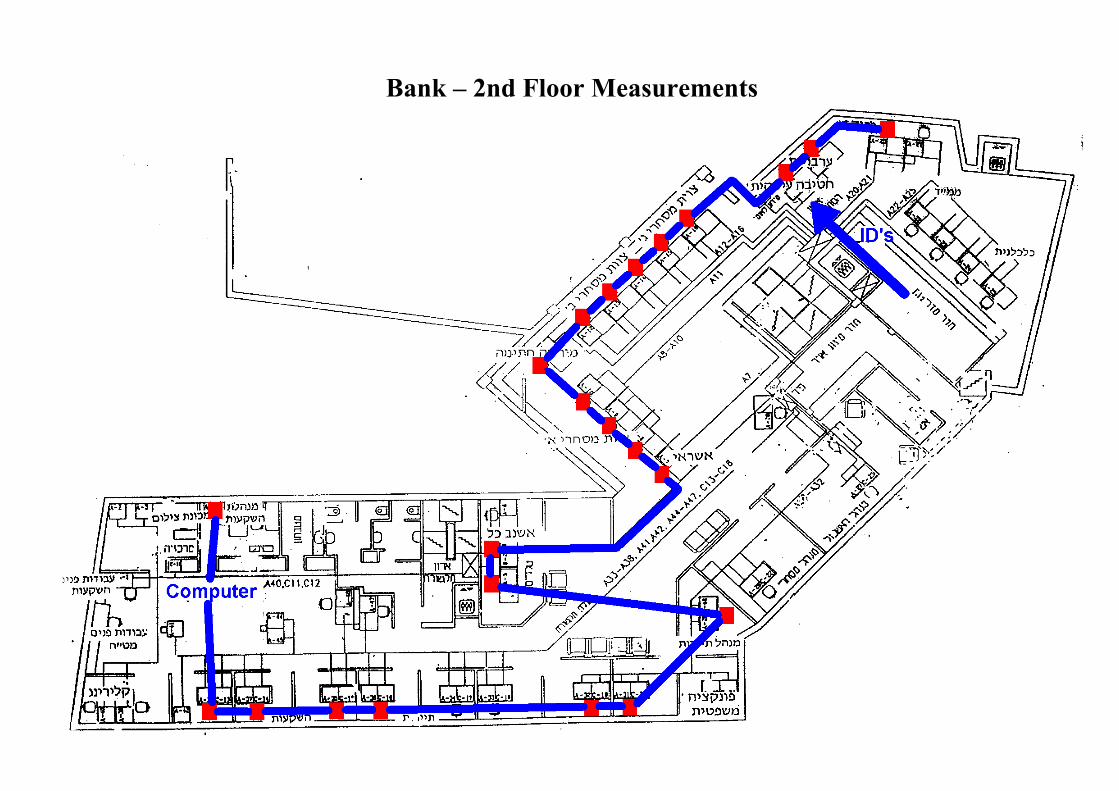
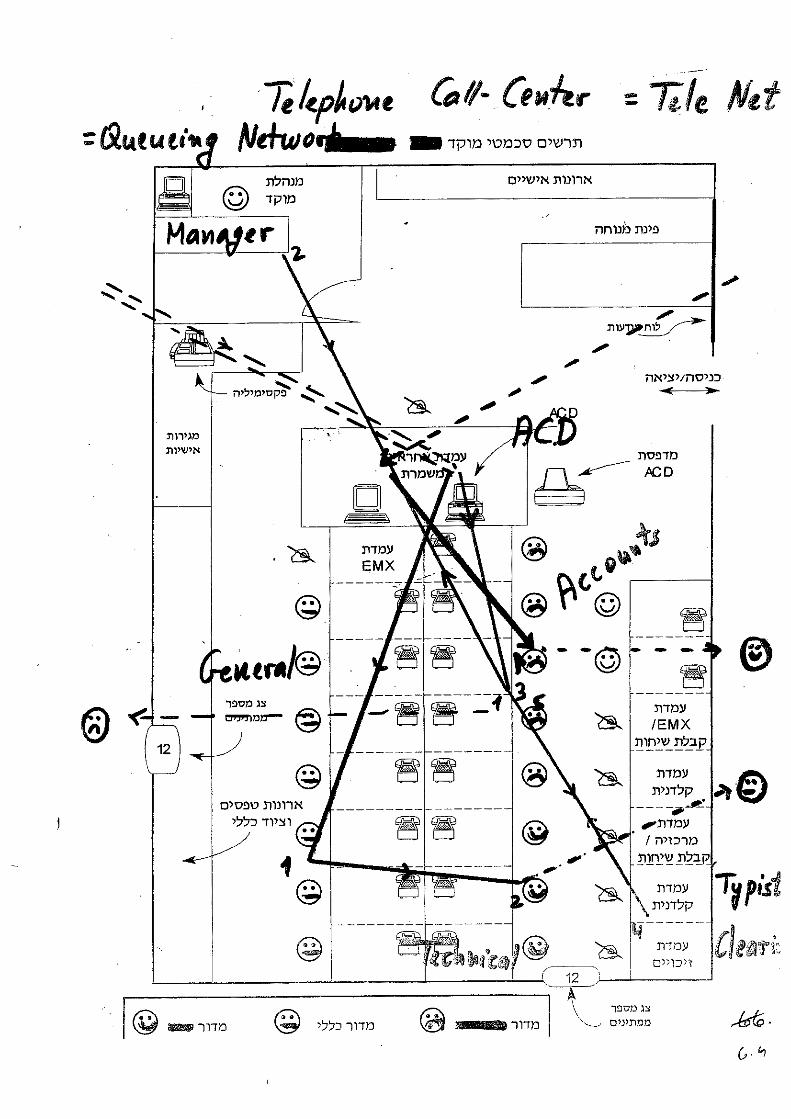
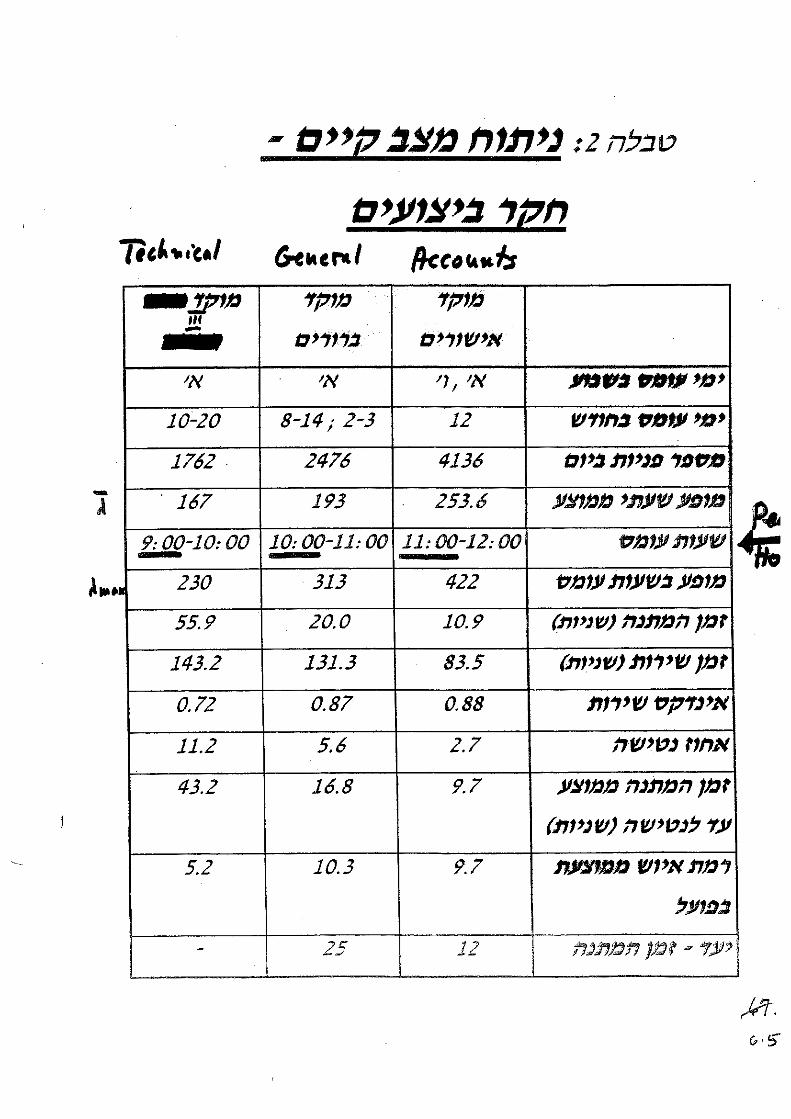
Bank – 2nd Floor Measurements

Bank: A Queuing Network
Transition Frequencies Between Units in The Private and Business Sections: Private Banking Business
To Unit Bankers Authorized Compens - Tellers Tellers Overdrafts Authorized Full Exit
From Unit Personal - ations Personal Service
Bankers 1% 1% 4% 4% 0% 0% 0% 90%
Private Authorized Personal 12% 5% 4% 6% 0% 0% 0% 73%
Banking Compensations 7% 4% 18% 6% 0% 0% 1% 64%
Tellers 6% 0% 1% 1% 0% 0% 0% 90%
Tellers 1% 0% 0% 0% 1% 0% 2% 94%
Services Overdrafts 2% 0% 1% 1% 19% 5% 8% 64%
Authorized Personal 2% 1% 0% 1% 11% 5% 11% 69%
Full Service 1% 0% 0% 0% 8% 1% 2% 88%
Entrance 13% 0% 3% 10% 58% 2% 0% 14% 0%
Legend: 0%-5% 5%-10% 10%-15% >15%
Dominant Paths - Private:
Unit Station 1 Station 2 Total
Parameter Banker Teller Dominant Path
Service Time 12.1 3.9 16.0 Waiting Time 6.5 5.7 12.2
Total Time 18.6 9.6 28.2
Service Index 0.65 0.40 0.56
Service Index = % time being served
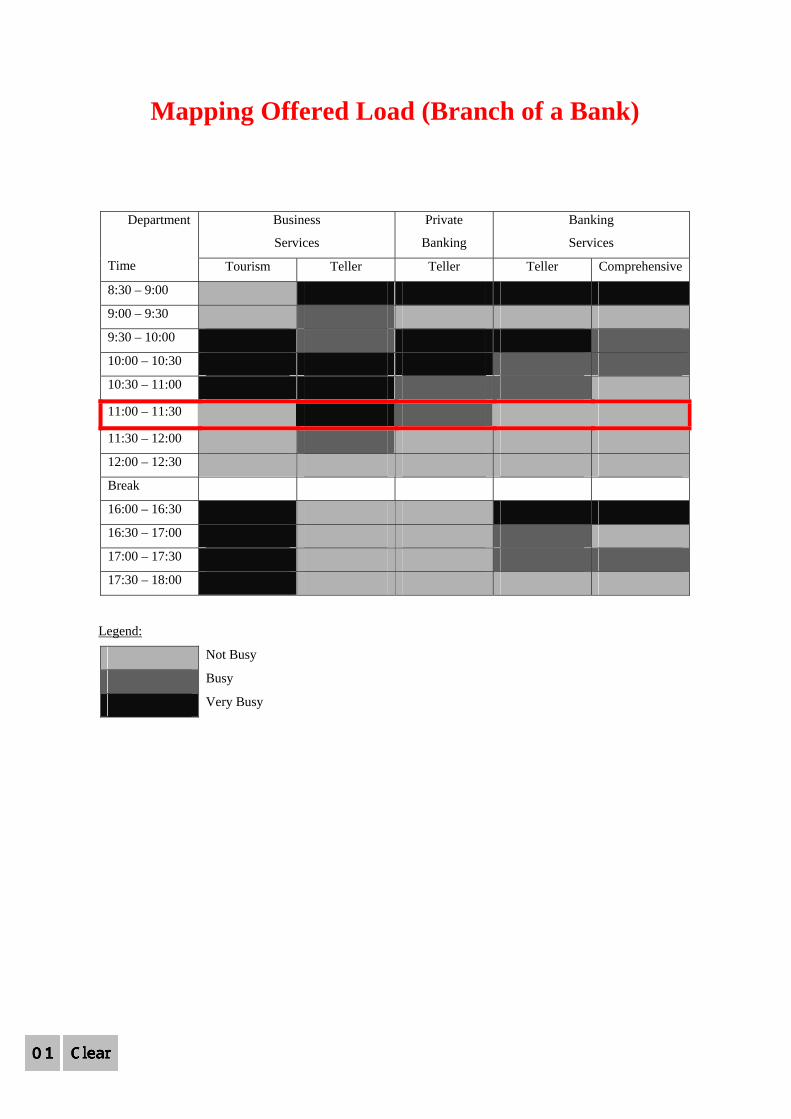
Mapping Offered Load (Branch of a Bank)
Business
Services
Private
Banking
Banking
Services
Department
Time Tourism Teller Teller Teller Comprehensive
8:30 – 9:00
9:00 – 9:30
9:30 – 10:00
10:00 – 10:30
10:30 – 11:00
11:00 – 11:30
11:30 – 12:00
12:00 – 12:30
Break
16:00 – 16:30
16:30 – 17:00
17:00 – 17:30
17:30 – 18:00
Legend:
Not Busy
Busy
Very Busy
Note: What can / should be done at 11:00 ? Conclusion: Models are not always necessary but measurements are !

Call-Center Network: Gallery of Models
Agents(CSRs)
Back-Office
Experts)(Consultants
VIP)Training (
Arrivals(Business Frontier
of the21th Century)
Redial(Retrial)
Busy)Rare(
Goodor
Bad
Positive: Repeat BusinessNegative: New Complaint
Lost Calls
Abandonment
Agents
ServiceCompletion
Service Engineering: Multi-Disciplinary Process View
ForecastingStatistics
New Services Design (R&D)Operations,Marketing
Organization Design:Parallel (Flat)Sequential (Hierarchical)Sociology/Psychology,Operations Research
Human Resource Management
Service Process Design
To Avoid Delay
To Avoid Starvation Skill Based Routing
(SBR) DesignMarketing,Human Resources,Operations Research,MIS
Customers Interface Design
Computer-Telephony Integration - CTIMIS/CS
Marketing
Operations/BusinessProcessArchiveDatabaseDesignData Mining:MIS, Statistics, Operations Research, Marketing
InternetChatEmailFax
Lost Calls
Service Completion)75% in Banks (
( Waiting TimeReturn Time)
Logistics
Customers Segmentation -CRM
Psychology, Operations Research,Marketing
Expect 3 minWilling 8 minPerceive 15 min
PsychologicalProcessArchive
Psychology,Statistics
Training, IncentivesJob Enrichment
Marketing,Operations Research
Human Factors Engineering
VRU/IVR
Queue)Invisible (
VIP Queue
(If Required 15 min,then Waited 8 min)(If Required 6 min, then Waited 8 min)
Information DesignFunctionScientific DisciplineMulti-Disciplinary
IndexCall Center Design
(Turnover up to 200% per Year)(Sweat Shops
of the21th Century)
Tele-StressPsychology
16

Conceptual Model: Hospital Network
Emergency Department: Generic Flow
PhysicianNurseImagingLabElse
60estimated max time
initialexamination
decision point for alternative processes
10%probability of events
06vital signs
07
E.C.G05
decision
awaitingdischarge
40
treatment 41
50
consultation
instructionsprior discharge
discharge /hospitalization
else
triage04
43
54
reception03
observation
46
every 15 minutes
follow up47
bloodwork
1312
100%
imaging /consultation /treatment
17
14
decision
20
ultrasound2928
21
Xray
2725,26
CT
3130
22
15
39
37
45
follow up48
every 15 minutes
49
11
handlingpatient&family
08
09
38imaging
36
3534
32,33 treatment18
56
hospitalization/discharge
awaitingevacuation
55
52
53
10
treatment 19
16
discharge
51
else
treatment42
44
reference point
labs labs
consultation
Labs
consultation
imaging
decision
proportion of patients 01 process requires bed 02
23
24
Figure 2. The Unified Patient Process Chart
21


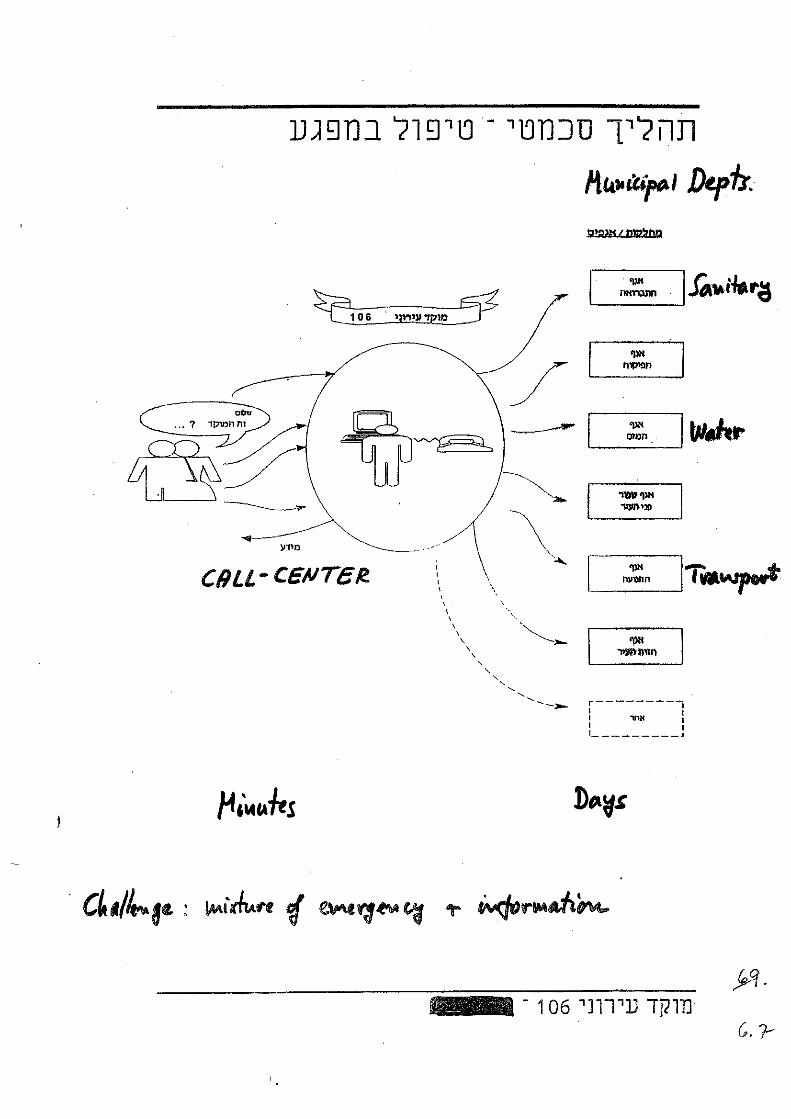
Two Local Municipalities
"Theorem" : Durations of human homogeneous services "are" exponential "Proof": Empirical (see below); Theoretical (phase-type dense); Scientific?
Department Station Total Avg. Service STD Utilization Maximal Service
No. Customers Time (Mins) (Mins) Time (Mins) 1 370 7.55 ± 0.68 7.96 37% 79.32 2 951 5.42 ± 0.33 6.27 68% 105.20 3 510 6.51 ± 0.50 6.94 44% 63.33
Collection - Reception
4 377 8.41 ± 0.75 8.90 42% 58.15 5 493 11.59 ± 0.80 10.88 76% 74.60 Collection -
Immigrants 6 569 10.38 ± 0.62 8.98 78% 50.87 7 114 10.80 ± 1.98 12.82 16% 93.73 8 28 9.07 ± 3.56 11.50 3% 52.07 9 47 18.32 ± 4.90 20.34 10% 113.57
10 28 23.39 ± 5.52 17.75 9% 63.77 11 59 11.99 ± 3.16 14.75 9% 70.30
Collection - Back office
12 128 16.73 ± 2.34 16.08 28% 88.68 13 1460 2.51 ± 0.21 4.92 48% 52.18
Cashier 14 1416 3.86 ± 0.18 4.16 72% 46.92 15 340 13.74 ± 1.07 12.02 62% 63.68 16 363 10.88 ± 0.92 10.60 52% 87.92 17 473 6.66 ± 0.50 6.68 42% 49.93
Billing - Reception
18 302 11.22 ± 1.30 13.81 45% 100.60 19 34 19.29 ± 5.64 19.99 8% 78.27 Billing -
Back office 20 13 12.20 ± 3.86 8.47 3% 29.28
Total (1 month) 8075
1 57 7.80 ± 1.70 7.61 6.5% 31.28 Water 2 130 9.34 ± 1.20 8.37 19.3% 54.68 3 336 9.04 ± 0.80 8.93 48.2% 49.05 4 208 9.93 ± 1.00 8.82 33.0% 49.12 5 417 8.97 ± 0.70 8.55 59.4% 49.37 6 144 9.53 ± 1.20 8.75 21.8% 41.70 7 156 8.03 ± 1.10 7.96 19.8% 35.27
Tellers
8 67 3.74 ± 0.70 3.58 4.0% 21.03 Cashier 9 757 6.64 ± 0.40 6.94 79.7% 29.95
Manager 10 190 1.99 ± 1.00 8.44 24.1% 38.97 Discounts 11 317 4.59 ± 0.40 4.54 23.1% 36.72
Total (1 month) 2779
* Service time ranges given with 90% confidence
“STD = Mean” is what often (but not always) "counts" towards Exponentiality.