measurement, sensors, and data acquisition in the two...
TRANSCRIPT

ME 144LDynamic Systems and Controls Laboratory
Department of Mechanical EngineeringThe University of Texas at Austin
Measurement, Sensors, and Data
Acquisition in the Two-Can System
Prof. R.G. Longoria
Updated Fall 2010

ME 144LDynamic Systems and Controls Laboratory
Department of Mechanical EngineeringThe University of Texas at Austin
Goal of this week’s lab
• Gain familiarity with using sensors
• Gain familiarity with using DAQ hardware
• Build familiarity with LabVIEW for DAQ applications
• Build data collection VIs
• Learn how to capture waveforms
• Learn how to save data to a spreadsheet/measurement
files
• Compare model and experiment results; improve
model predictions

ME 144LDynamic Systems and Controls Laboratory
Department of Mechanical EngineeringThe University of Texas at Austin
Discuss here…
• Measurement and sensor concepts
• Data acquisition concepts
• Analyzing acquired data (signals) for specific
purpose(s)

ME 144LDynamic Systems and Controls Laboratory
Department of Mechanical EngineeringThe University of Texas at Austin
Measurement System Context
SPower Flow
MeasurementSystem
Outputs for
Knowledge orControl
Sensor
SystemMeasurand
(True Value)
Optional Aux. Power
Signal
Conditioning
Auxiliary Power
•Recorder/Indicator•Processing
•Controller
Transducedsignal
Signal or information
Most modern measurement systems end up transforming
measurands into electrical (or optical) form.
Referent - a system
attribute that appears
relevant (e.g., state
variables)
Measurand - a referent
that is measurable
ME 144LDynamic Systems and Controls Laboratory
Department of Mechanical EngineeringThe University of Texas at Austin
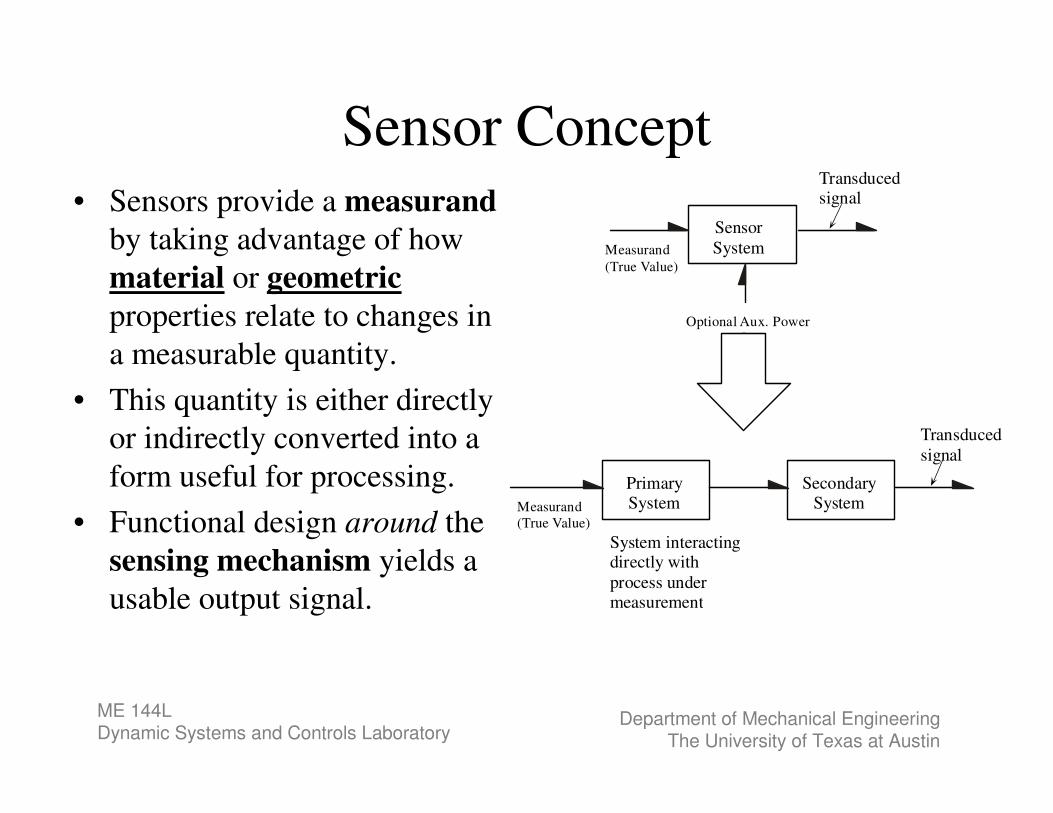
Sensor Concept• Sensors provide a measurand
by taking advantage of how
material or geometric
properties relate to changes in
a measurable quantity.
• This quantity is either directly
or indirectly converted into a
form useful for processing.
• Functional design around the
sensing mechanism yields a
usable output signal.
Sensor
SystemMeasurand
(True Value)
Optional Aux. Power
Transducedsignal
PrimarySystem
SecondarySystemMeasurand
(True Value)
Transduced
signal
System interactingdirectly with
process undermeasurement

ME 144LDynamic Systems and Controls Laboratory
Department of Mechanical EngineeringThe University of Texas at Austin
Types of Electromechanical Sensors
• Resistive Sensors
• Capacitive Sensors
• Inductive and Magnetic Sensors
• Piezolelectric Sensors

ME 144LDynamic Systems and Controls Laboratory
Department of Mechanical EngineeringThe University of Texas at Austin
Electrical Signal Domains
• The conversion of a physical quantity into electrical form is often done to indicate a direct relation. For example, the voltage level may be directly related to pressure.
• In general, however, the information about the physical quantity can be encoded in the signal in many different ways.
• Three major ways to encode a physical signal:
1. analog - in which the magnitude of an electrical quantity is related to the information of interest
2. time - in which the time relationship between changes in signal level is related to the information of interest
3. digital - in which an integer number is represented by binary level signals

ME 144LDynamic Systems and Controls Laboratory
Department of Mechanical EngineeringThe University of Texas at Austin
Electrical Signal Domains
analog - many
electromechanical
sensors are of this
form;
potentiometers,
thermistors, etc.
digital -
counters, a/d
converters,
etc.
time - some devices generate signals where frequency
is a function of a physical quantity; e.g., a tachometer
From Malmstadt, et al, “
Electronic Meas for Scientists”

ME 144LDynamic Systems and Controls Laboratory
Department of Mechanical EngineeringThe University of Texas at Austin
Electrical Signal DomainsExample: Thermistor digital thermometer
From Malmstadt, et al, “ Electronic Meas for Scientists”

ME 144LDynamic Systems and Controls Laboratory
Department of Mechanical EngineeringThe University of Texas at Austin
Example: Analog vs. Digital Tire
Pressure Gauge
Valve Stem
Spring
Graduated
Stem
Pressure
Pm
Air
Leakage,Ql
C
T
1 I
x
x•
0 LeakageQl
Tire
Pressure
CAir
Spring Piston/stem
mass
Calibrate
for Pressure
1
E
Pm
R
valve
ò
dt
Digital tire gauge
(Radio Shack)

ME 144LDynamic Systems and Controls Laboratory
Department of Mechanical EngineeringThe University of Texas at Austin
Digital Tire Pressure Gauge
Digital tire gauge
(Radio Shack)

ME 144LDynamic Systems and Controls Laboratory
Department of Mechanical EngineeringThe University of Texas at Austin
Level measurement in two-can
Many ways to measure level in the two-can system.
This is a resistive level sensor we’ve
built for the two-can system.
Height goes as the inverse of resistance
(or impedance) of the water between
the probes.
*As height drops, resistance goes up.

ME 144LDynamic Systems and Controls Laboratory
Department of Mechanical EngineeringThe University of Texas at Austin
Pressure Sensors
1 psi ~ 28 in of water
Most pressure sensors
feature a diaphragm that
responds to applied
pressure.
A sensing mechanism of
some type converts the
response to a proportional
electrical signal.
This diaphragm contacts
a small beam with strain
gauges.
This diaphragm in the PX409
pressure sensor is micro-
machined to include
piezoresistive strain gauges.

ME 144LDynamic Systems and Controls Laboratory
Department of Mechanical EngineeringThe University of Texas at Austin

ME 144LDynamic Systems and Controls Laboratory
Department of Mechanical EngineeringThe University of Texas at Austin
Can Emptying – Measured
Volume vs. Time for Can1
0
100
200
300
400
500
600
700
800
900
1000
0 1 2 3 4 5 6 7 8 9 10 11 12 13 14 15 16 17 18 19 20 21 22 23 24 25 26 27 28
Time [sec]
Vo
lum
e [
ml]
This is volume data during a one-can
emptying experiment collected using the
PX409 pressure sensor (calibrated for can
volume)
1 where
g AP gh Ah V C
A C g
ρρ
ρ= = = = ‘hydraulic capacitance’

ME 144LDynamic Systems and Controls Laboratory
Department of Mechanical EngineeringThe University of Texas at Austin
Digital data acquisition (DAQ)
• Basics about signals and how they are measured
by data acquisition (DAQ) hardware that use
analog-to-digital conversion (ADC).
• How to build simple programs in LabVIEW for
acquiring signals, displaying the data, analyzing
the data, and storing the data for later use.

ME 144LDynamic Systems and Controls Laboratory
Department of Mechanical EngineeringThe University of Texas at Austin
A/D Converter in DMM
From “Using Your
Meter”
by A.J. Evans, Master Publishing, Inc., 1994.
Although it is not
hard to find an analog
multitester, digital
devices are much more
common.
In a DMM, signal
conditioners convert the
quantity under measure
into a voltage to be read
by an A/D converter.

ME 144LDynamic Systems and Controls Laboratory
Department of Mechanical EngineeringThe University of Texas at Austin
Computers rely on DAQ
Data Acquisition (DAQ, ‘dak’) hardware is used to form a
communication interface between a computer and the ‘real world’.
There is a lot of DAQ
hardware available from
very low cost to high-
end. Choose as needed
for your application.

ME 144LDynamic Systems and Controls Laboratory
Department of Mechanical EngineeringThe University of Texas at Austin
DAQ Functions Besides A/D
• Analog Output
– Generate DC Voltages
– General waveforms (Function Generator)
• Digital I/O
– General low (0V) and high (5V) pulses
– Read digital pulses
• Timing I/O
– Generate pulse trains (square waves)
– Read frequency, time values

ME 144LDynamic Systems and Controls Laboratory
Department of Mechanical EngineeringThe University of Texas at Austin
What do you need to know?
• Resolution and range
• How fast to sample*
• How many times to sample
• Device and configuration (MAX)
• Connecting the signals the right way
• What channels to sample
• How to deal with the data*
The lab experiments are meant to provide experience with these concepts.
General Concepts
Hardware Specific

ME 144LDynamic Systems and Controls Laboratory
Department of Mechanical EngineeringThe University of Texas at Austin
Analog-to-Digital Conversion
• The A/D converter (ADC) converts an analog voltage into a
binary number through the process of quantization.
• The ADC will have a full-scale voltage range over which it
can operate.
• The number of bits will dictate how many discrete levels will
be used to represent measured voltages.
• For example, an 8-bit converter with a full-scale voltage of 10
V will give you a resolution of 10V/256 which is 39.1 mV.

ME 144LDynamic Systems and Controls Laboratory
Department of Mechanical EngineeringThe University of Texas at Austin
A/D ConversionSignal entering the computer must be discretized
in amplitude as well as time (sampling).
Contrast n = 3 versus n = 16
3
16
10
2
10
2
1.25
0.152
V
FS
n V
VV
mV
=∆ = =
=
Resolution:

ME 144LDynamic Systems and Controls Laboratory
Department of Mechanical EngineeringThe University of Texas at Austin
Choosing a sampling
or scan rate (scans/sec, or Hz)
• The ADC samples according to a scan rate.
• How fast you sample should satisfy the Nyquist
sampling theorem.
• The sampling frequency should be at least two times
the highest frequency present in the signal.
• Not satisfying Nyquist criterion has implications in
how the signal is ‘reconstructed’.

ME 144LDynamic Systems and Controls Laboratory
Department of Mechanical EngineeringThe University of Texas at Austin
Selecting a sample rate…Depending on your
objective, you
might choose scan
rate to satisfy
Nyquist criterion.
But you might also
want to have
accuracy in time
measurements.
Can you see how you have to balance how fast you sample,
how many samples you get, etc.?
ME 144LDynamic Systems and Controls Laboratory
Department of Mechanical EngineeringThe University of Texas at Austin
Data Acquisition Usage in Lab
• Build a virtual instruments in LabVIEW to acquire and graph voltage signals from pressure sensors and to conduct calibration.
• The VI should save waveforms to a measurement file for post-processing.
• Analyze the data
– Use to arrive at improved estimates of K flow coefficients
– Compare to simulation results

ME 144LDynamic Systems and Controls Laboratory
Department of Mechanical EngineeringThe University of Texas at Austin
Methods for finding K
• Simple one-can experiments, measuring volume
and time to empty (last week)
• Use pressure (volume) data over time
– More accurate determination of critical heights,
time values, etc.
– Captures volume-time characteristic (shape)
– Enables comparison to simulation directly or to
analytical model

ME 144LDynamic Systems and Controls Laboratory
Department of Mechanical EngineeringThe University of Texas at Austin
One-Can Experiments – Case 2
• Qin = 0. 0 out
dVQ
dt= −
outQ
dVK V
dt= −or
constantV ≠
h
Volume is a dynamic state.
0 0.5 1 1.5 20
0.2
0.4
0.6
0.8
1
VoKo
2t⋅−
2
1 e
t−
τ eq⋅
t
Linear cans
never empty
eq
dVK V
dt= −
dVK V
dt= −
Nonlinear can2
( ) ,02
o e
KV t V t t T
= − ≤ ≤
Solution:
1
1o
K
V
=
=

ME 144LDynamic Systems and Controls Laboratory
Department of Mechanical EngineeringThe University of Texas at Austin
Fitting Data to Analytical Solution
2 22( )
2 4o o o
K KV t V t t K V t V
= − = − +
2
( )2
i i i o i
Ke V V t V V t
= − = − −
The analytical solution is a quadratic equation:
There exist general routines that will fit experimental data (i.e., for volume
over time) to polynomials of this form.
Another approach is to derive a solution for K from minimizing the sum of
the squared error,
This results in a formula for K that is a
function of the volume-time data.
2
0ide
dK=

ME 144LDynamic Systems and Controls Laboratory
Department of Mechanical EngineeringThe University of Texas at Austin
Comparison of Different Methods
0 5 10 15 20 25 30-2
0
2
4
6
8
10x 10
-4
measured
LSE-1
LSE-2
Vo & Te
Simulation results from using
different K values are shown
plotted with measured volume
data.
From LSE
You are expected to derive and test your own methods for finding K using this data.

ME 144LDynamic Systems and Controls Laboratory
Department of Mechanical EngineeringThe University of Texas at Austin
How do I know my method works?
Simulate the experimental data collection!
Use your K values from the previous
week’s lab work.

ME 144LDynamic Systems and Controls Laboratory
Department of Mechanical EngineeringThe University of Texas at Austin
Summary
• Use a known physical problem (two-can) for
purposeful learning of DAQ usage, signal
processing, etc.
• Experience with using pressure sensors (off-
the-shelf)
• Take opportunity to experiment with very basic
LabVIEW VI for data collection.