measurement of the quality of life for economic evaluation ... ausecorev 2004.pdf · measurement of...
TRANSCRIPT

The Australian Economic Review, vol. 37, no. 1, pp. 62–88
2004 The University of Melbourne, Melbourne Institute of Applied Economic and Social ResearchPublished by Blackwell Publishing Asia Pty Ltd
Abstract
Including the quality of life in the economic as-sessment of health and medical services is wellestablished in the literature and a number ofmulti-attribute utility (MAU) instruments areavailable which purport to measure healthstate utilities. One of these, the Assessment ofQuality of Life (AQoL) instrument was devel-oped in Australia and uses Australian impor-tance weights. The present article discussessome of the methodological problems encoun-tered by existing instruments. It outlines theconstruction of the AQoL Mark 2 and the meth-odological innovations which have attemptedto overcome some of these problems.
Technical and other details may be obtainedin Richardson et al. (2003a, 2003b, 2003c) andPeacock et al. (2003). These papers may be ac-cessed from the Health Economics Unit website at <http://heu.buseco.monash.edu.au>.
1. Introduction
The objective of this article is to introduce theAssessment of Quality of Life (AQoL) Mark 2multi-attribute utility (MAU) instrument, tooutline the challenges it faced and the method-ological innovations which sought to meetthese challenges. The article commences with abrief discussion of the purpose of MAU instru-ments and some of the reasons for concernabout the current generation of instruments.The second section outlines the theory of in-strument construction and the various innova-tions in the methodology for the constructionof AQoL 2. Section 3 describes the modellingof the AQoL 2 descriptive system and its ‘scal-ing’—calibration. Results from the two con-struction surveys and interviews are presentedin Section 4 and the algorithm for estimatingutility scores is reported. Likely extensions tothe instrument are discussed briefly in Section5.
1.1 MAU Instruments and Their Purpose
Before the development of cost utility analysis(CUA), the economic evaluation of health ser-vices either ignored quality of life (QoL) ortreated QoL as an ‘intangible’ that could benoted and described but not precisely quanti-fied. CUA has attempted to overcome thisdeficit by adopting the quality-adjusted lifeyear (QALY) as the unit of output in cost-effectiveness studies. The approach may be de-scribed as ‘quasi-utilitarian’ as its most funda-mental assumption is that a year of full healthresults in the same level of utility for everyone.
Measurement of the Quality of Life for Economic Evaluation and the Assessment of Quality of Life (AQoL) Mark 2 Instrument
Jeff Richardson
†
, Neil Atherton Day
‡
, Stuart Peacock
†
and Angelo Iezzi
†
*
†
Health Economics Unit, Monash University
‡
Centre for Program Evaluation, The University of Melbourne
* The authors would like to acknowledge the financial as-sistance of the Victorian Health Promotion Foundation andthe Population Health Division of the Commonwealth De-partment of Health and Ageing. We also benefited greatlyfrom the comments of two anonymous reviewers.

Richardson et al.: Measurement of the Quality of Life 63
2004 The University of Melbourne, Melbourne Institute of Applied Economic and Social Research
The assumption is a sufficient condition for thesummation and comparison of utilities. An al-ternative and more defensible interpretation ofthe assumption is that CUA makes the norma-tive judgement that, all else equal, the utility aperson receives from full health
should
betreated as being equal (interestingly, the ethicalassumption made by Jeremy Bentham, theoriginator of utilitarianism).
In CUA ‘best health’ is assigned a value of1.00 and death a value of 0.00. Consequently,(positive) utility varies between 0.00 and 1.00and QALYs may be calculated by multiplyinglife years by the numerical value of the healthstate utility.
The measurement of ‘utility’ requires twotasks. First, the health state under investigationmust be described. Second, a scaling techniquewhich purports to measure utility must be usedto attach numerical values to the health state.The two methods most widely accepted asmeasuring utility are the standard gamble (SG)and the time trade-off (TTO) techniques.
1
These two tasks—description and measure-ment—may themselves be carried out in one oftwo ways. First, in the ‘holistic’ or compositeapproach to measurement, the relevant healthstates are described in a series of vignettes, orscenarios. These are then rated using the se-lected scaling instrument to obtain a ‘utility’index which is used to calculate QALYs. Theconstruction of the health scenarios and the rat-ing exercise both require surveys. Normally,patients who have experienced the health statesare consulted for scenario construction and arandom sample of the population is used for theweighting.
The second, ‘decomposed’, approach re-quires the preliminary construction of a genericMAU QoL instrument which is capable of de-scribing numerous health states and assigning autility score to each of these. The first stage inthe construction of an MAU instrument istherefore the construction of the ‘descriptivesystem’. This involves the decomposition of aparticular concept of health and describingeach of the resulting attributes (dimensions orconstituent parts) of the concept using one ormore ‘items’; that is, by a series of questions,each with multiple responses, which describe
the dimension and the intensity of the healthstate experienced. To convert the multi-attribute descriptive system into an MAU in-strument, a scoring algorithm is created whichcan convert any combination of item responsesinto an index of utility. This is normallyachieved by measuring a limited number ofmulti-attribute health states and using these tocalibrate a model which is then used to infer theutility values of every other health state in thedescriptive system.
2
The model may be derivedeither by econometric analysis of the observedutilities or by the use of decision analytic tech-niques to fit a simple additive or amultiplicative model.
3
The fully scaled MAUinstrument may then be used to estimate theutility of health states.
Both approaches have strengths and weak-nesses. Holistic measurement permits a de-scription which is tailored to a particular healthstate. Unique aspects of the health state, itscontext, its consequences, the process of healthcare delivery, risk and prognosis may all be in-cluded in the vignette. Validation of healthstate-specific vignettes, however, is seldom, ifever, carried out. In contrast, the descriptivesystem of the MAU approach may be unable tocapture many of the nuances of the health stateand be incapable of capturing the importanceof the process or context. However, this ap-proach should, in principle, be based upon a de-scriptive system, the reliability and validity ofwhich can be investigated using standard pro-cedures. After construction, the use of an MAUinstrument is inexpensive and easy and allowsthe rapid estimation of utilities in the context ofa longitudinal trial. This means that it is feasi-ble to construct a time profile of each of the di-mensions of health included in the instrument.Because of these respective strengths andweaknesses both techniques have a role inCUA.
1.2 Problems with MAU Instruments
To date, only a handful of generic instrumentshave attempted to measure utility. (These aredescribed and contrasted in Hawthorne, Rich-ardson and Day 2001.) Each of these hasparticular strengths. However each has

64 The Australian Economic Review March 2004
2004 The University of Melbourne, Melbourne Institute of Applied Economic and Social Research
limitations. These include an ad hoc approachto the construction of the descriptive system,the adoption of a limited concept of QoL (and,more specifically, the exclusion of importantsocial elements), the use of a rating scale to ob-tain utility scores
4
and overly simplistic model-ling. While there has been some limiteddiscussion of construct validity, other MAU in-struments have not demonstrated this property.More surprisingly, there has been little recog-nition in the economics literature of the needfor rigorous validation studies—testingwhether or not QALYs and MAU instrumentsmeasure what they purport to measure. Thereare now a large number of empirical studieswhich include both utility and disease-specificinstruments (see Brazier et al. 1999 for a re-view). When the scores from the instrument ofinterest correlate with other instrument scoresthe assertion is generally made that the instru-ment has been ‘validated’. At best, however,correlational evidence represents weak andcontext-specific ‘validation’. It does not dem-onstrate the existence of a ‘strong intervalproperty’ (Richardson 2002), namely the re-quirement that a 10 per cent increase in the nu-merical value of the ‘utility’ index is equivalent
to a 10 per cent increase in life years or (other-wise equal) lives saved. Indeed, this propertyhas been virtually ignored.
While there is no criterion test of the stronginterval property, the plausibility of utilityscores may be investigated by determining theimplications of a utility score for the willing-ness to sacrifice life. The result of one such testof two instruments is reported in Table 1. Pub-lished values for the original McMaster (HUI1) and the Quality of Wellbeing (QWB) instru-ments (column 1) were used to calculate thenumber of people whose full cure (utility indexreturns to 1.0) would be equivalent to saving alife (gaining 1.0). This is reported in column 2.Thus, for example, according to the QWB, cur-ing one person from a ‘cough’ would increaseutility by 1 – 0.74 = 0.26. Four such cureswould increase utility by 4
×
0.26 = 1.04 andtherefore be equivalent to saving a life. The im-plausibility of this and the other results in Table1 casts serious doubt upon the existence of thisstrong interval property for these two instru-ments.
Some critics of utility measurement have ar-gued that the entire enterprise will fail if thescale includes death or abbreviate life because,
Table 1 Number Cured Equivalent to Saving One Life—Implied by Two MAU Instruments
State
Published value
of state
Number cured equivalent to saving a life
(approximately)
McMaster Health Index Questionnaire (HUI Mark 2)
a
Some limitations in physical ability to lift, walk, run, jump or bend 0.870 8
Needing a hearing aid 0.870 8
Having pain or discomfort for a few days in a row every month 0.870 8
Needing mechanical aids to get around, but not needing help from others 0.730 4
Quality of Wellbeing Scale (QWB)
Stuffy, running nose 0.830 6
Pimples 0.800 5
Lisp 0.763 4
Headache 0.756 4
Spells of feeling upset 0.743 4
Trouble with sleeping 0.743 4
Cough 0.743 4
Note
: (a) There is now a HUI Mark 3 instrument (see Furlong et al. 1998).
Source
: Nord, Richardson and Macarounas-Kirchmann (1993).

Richardson et al.: Measurement of the Quality of Life 65
2004 The University of Melbourne, Melbourne Institute of Applied Economic and Social Research
as Carr-Hill (1992) argues, there is a ‘quitelegitimate refusal’ of normal people to ratedeath on the same scale as health states.
5
Whileintuitively appealing we know of no evidenceto support this position and during the con-struction of utility weights for both the AQoL1 and AQoL 2 we did not encounter respon-dents who refused to trade life for quality oflife under any circumstances. This does not, ofcourse, indicate that the TTO is the gold stan-dard technique for utility elicitation. This con-tentious issue is outside the scope of the presentarticle.
6
In the largest comparative study of MAU in-struments to date, Hawthorne et al. (2001)found little in common in the conceptualisationor construction of five instruments and a rela-tively low correspondence between the utilityscores obtained from 976 survey respondents.The correlation coefficients from this study arereported in Table 2 and are low. The data whichwere correlated were obtained from instrumentscoring algorithms which eliminate the ‘noise’which exists in individual data: it is ‘averagedout’. The resulting scores from each instrumentshould, therefore, be identical. Despite this, thehighest correlation—between AQoL 1 and the15D instruments (0.821)—implies that only 67per cent of variation in one instrument is ex-plained by the other instrument. The lowestcorrelation—between HUI 3 and EQ5D(0.653)—implies that only 43 per cent of vari-ation in one instrument is explained by theother.
The strength of the correlation is a relatively‘soft’ test of validity. The null hypothesis thattwo instruments both give unbiased estimatesof true utility would result in a linear relation-ship between the instruments which passed
through the points (0, 0) and (1, 1); that is, anincrease in the value of utility measured by onescale would correspond, on average, with anidentical increment measured on the secondscale. This result was not obtained by Haw-thorne et al. (2001). Rather, two groups of in-struments were identified. AQoL 1, HUI 3 andEQ5D gave similar utility scores; the 15D andSF36 (Brazier weights) also gave similarscores. However when instruments in the twogroups were compared, the slope of the linearrelationship differed by up to 100 per cent—differences in the utilities of health states pre-dicted by instruments in the first group wouldbe double the differences found by the two in-struments in the second group. This impliesthat twice the QALY gain would be estimatedusing instruments from the first group as com-pared with instruments in the second group.
The results from the five instruments studyimply an unsatisfactory ‘state of the art’ inMAU construction. Results reflect differencesin the assumptions and methods at almostevery stage of the construction, including thepossibility of simple measurement error, atopic receiving relatively little discussion byeconomists in the utility measurement litera-ture.
1.3 Aims of the AQoL Project
There were two broad objectives of the AQoLproject. These were, first, to advance the stateof the art of instrument construction and, sec-ond, to create an instrument with increasedsensitivity, construct and predictive validity.More specifically, the project sought to createutility instruments where the descriptive sys-tem was:
Table 2 Correlations between Instruments
AQoL 1 HUI 3 15D EQ5D SF36
HUI 3 0.762
15D 0.821 0.799
EQ5D 0.751 0.653 0.760
SF36 0.733 0.664 0.741 0.725
Mean 0.767 0.715 0.775 0.722 0.716
Note
:
N
= 968. The population includes outpatient and ward patients.
Source
: Hawthorne et al. (2001).

66 The Australian Economic Review March 2004
2004 The University of Melbourne, Melbourne Institute of Applied Economic and Social Research
• derived using correct psychometric proce-dures for instrument construction (constructvalidity);
• sensitive to as much of the full universe ofhealth-related QoL as is practical;
• based upon a description of ‘handicap’—problems in a social context—as distinctfrom a ‘within the skin’ descriptive system;
• based upon structurally independent dimen-sions of health; and
• hierarchical, so that the descriptive systemcould allow redundancy—double count-ing—within dimensions in order to achieveinstrument sensitivity, but with structural in-dependence between the dimensions.
The achievement of these properties for theAQoL 1 is described elsewhere (Hawthorne etal. 1997). The AQoL 2 sought to incorporatefive additional elements. These were:
(i) an increase in the sensitivity of the de-scriptive system in the region of fullhealth and a description which permittedthe evaluation of health promotional ac-tivities as well as illness cure or allevia-tion;
(ii) the creation of at least two scaling sys-tems based upon the TTO, as with AQoL1, and the person trade-off (PTO) scalingmethodologies (the appropriate choice ofscaling instrument has not been deter-mined in the literature);
(iii) a re-estimation of the utility scores em-ploying techniques to eliminate one pos-sible source of bias in previousmethodologies, namely a ‘focusing ef-fect’;
(iv) the testing and use of ‘deliberativeweights’ which permit and encourage thecontemplation of the health states for asignificant period of time (1 to 2 weeks)before responding to questions; and
(v) the use of a more flexible two-stage mod-elling methodology to combine disaggre-gated dimension scores into an overallutility score for a multi-attribute healthstate.
2. Methodological Issues in the Construction of an MAU Instrument
2.1 Instrument Construction Theory
The correct psychometric procedures for in-strument construction are summarised in Fig-ure 1. To our knowledge AQoL 1 is the onlyinstrument which has fully implemented theseprocedures.
As shown, instrument construction involvestheory, data collection and item analysis. BothAQoL 1 and AQoL 2 were based upon the hy-pothesis that (dis)utility depends primarilyupon the extent of a person’s handicap; that is,it depends upon the effects of ill health upon a
Figure 1 Steps in Constructing an MAU Instrument (AQOL 2 Specific Information)
1. Theory of health-related QoL
• Concept (handicap)
• Hypothesised dimensions
2. Item bank
• Literature, eclectic sources
• Filter
• Focus groups (GPs, specialists)
• Linguistic analysis
3. Item selection
• Survey 1: ‘Construction’ (n = 618)
• Statistical analysis (Structural Equation Modelling)
4. Scaling
• Survey 2 (2 × interview + postal, n = 411)
5. Validation
• Survey 3: AQoL (1) n = 972
• Descriptive system validation
– Confirmatory factor analysis
– Comparison with non-utility scales
Richardson et al.: Measurement of the Quality of Life 67
2004 The University of Melbourne, Melbourne Institute of Applied Economic and Social Research
person’s capacity to function in a social con-text. In contrast, the HUI instruments and the15D incorporate descriptive systems basedupon disability, that is, upon ‘within the skin’descriptions of the impact of ill health upon aperson’s capacity to carry out certain functions.Next, dimensions of handicap are hypothe-sised. An item bank is constructed from thelarge number of items which describe the hy-pothesised dimensions. AQoL items wereobtained from the literature, from other instru-ments, from focus groups, directly from the cli-nicians and from the research team itself. Theinitial items in the item bank are ‘filtered’ toeliminate items which are poorly expressed,which contain ambiguous or multiple elements(‘aspects’ or ‘concepts’) or which are obvi-ously repetitive.
Final item selection is based upon an analy-sis of a ‘construction survey’. This is a strati-fied and representative group of respondentswho complete all of the items. Statistical an-alyses identify items which cluster together andthe correspondence between these clusters andthe hypothesised dimension structure. The finalchoice of items and dimensions is based uponthe interplay of empirical results, the theoryand the coherence of the overall instrument.
The resulting instrument is scaled (cali-brated). The number of health states describedby a multi-attribute descriptive system forhealth status is too large to obtain utility scoresseparately for each state. For example, theAQoL 1 utility algorithm consists of 12 itemseach with four response categories.
7
Conse-quently, there are 4
12
(16.8 million) combina-tions of item responses. Scaling thereforerequires the use of a model and a combinationrule to estimate the utility of each health statefrom the item responses and the item utilitieswhich have been separately obtained. To date,MAU instruments have employed simple addi-tive models (weights sum to unity), multiplica-tive models (weights constrain scores between1.0 and 0), and econometric models (selectedmulti-attribute states are regressed upon itemresponses and the coefficients of the best fittingstatistical result become item weights).
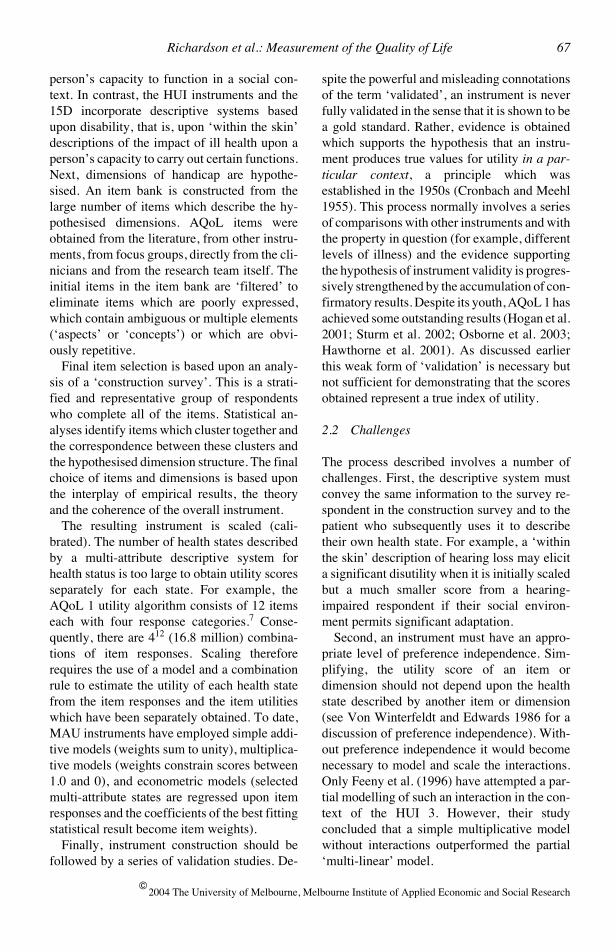
Finally, instrument construction should befollowed by a series of validation studies. De-
spite the powerful and misleading connotationsof the term ‘validated’, an instrument is neverfully validated in the sense that it is shown to bea gold standard. Rather, evidence is obtainedwhich supports the hypothesis that an instru-ment produces true values for utility
in a par-ticular context
, a principle which wasestablished in the 1950s (Cronbach and Meehl1955). This process normally involves a seriesof comparisons with other instruments and withthe property in question (for example, differentlevels of illness) and the evidence supportingthe hypothesis of instrument validity is progres-sively strengthened by the accumulation of con-firmatory results. Despite its youth, AQoL 1 hasachieved some outstanding results (Hogan et al.2001; Sturm et al. 2002; Osborne et al. 2003;Hawthorne et al. 2001). As discussed earlierthis weak form of ‘validation’ is necessary butnot sufficient for demonstrating that the scoresobtained represent a true index of utility.
2.2 Challenges
The process described involves a number ofchallenges. First, the descriptive system mustconvey the same information to the survey re-spondent in the construction survey and to thepatient who subsequently uses it to describetheir own health state. For example, a ‘withinthe skin’ description of hearing loss may elicita significant disutility when it is initially scaledbut a much smaller score from a hearing-impaired respondent if their social environ-ment permits significant adaptation.
Second, an instrument must have an appro-priate level of preference independence. Sim-plifying, the utility score of an item ordimension should not depend upon the healthstate described by another item or dimension(see Von Winterfeldt and Edwards 1986 for adiscussion of preference independence). With-out preference independence it would becomenecessary to model and scale the interactions.Only Feeny et al. (1996) have attempted a par-tial modelling of such an interaction in the con-text of the HUI 3. However, their studyconcluded that a simple multiplicative modelwithout interactions outperformed the partial‘multi-linear’ model.

68 The Australian Economic Review March 2004
2004 The University of Melbourne, Melbourne Institute of Applied Economic and Social Research
Figure 2 Structural Dependence and Double Counting
A third requirement is that the items are sen-sitive to all health states over the health domainwhich the instrument purports to describe. Forexample, an instrument which included the dis-utility from reduced locomotion might accu-rately detect a reduced capacity to walk and runbut fail to detect the reduced capacity to climbstairs. If the former problem did not correlatehighly with the latter then the descriptive sys-tem will have a degree of insensitivity. Moreimportantly, neither of these problems mighthave a significant effect upon an elderly personwho does not seek to walk significant distancesand does not have stairs in their house. Themore relevant question might therefore con-cern the elderly person’s ability to carry out theactivities of daily living which should, there-fore, be included in a sensitive instrument. Thisexample illustrates one of the reasons for bas-ing a descriptive system upon the concept ofhandicap.
Fourth, and potentially in conflict with theneed for instrument sensitivity, the descriptivesystem should have structural independence—orthogonality—between items or dimensions.In the terminology of decision analysis, thereshould not be ‘redundancy’ in the instrument.This will occur if more than one item describes
part of an attribute. For example, an instrumentseparately describing a reduced capacity towalk, to carry out activities of daily living, andto engage in sport and social activities mightcapture the same problem three different ways.With most forms of scaling this would result inan erroneously low score for individuals withpoor mobility.
The trade-off between instrument sensitivityis illustrated in Figure 2, in which the contentof an item is represented by an oval. The instru-ment illustrated on the left-hand side of the fig-ure is close to the ideal structure. Most of thepsychological and physical domains are de-scribed. Some insensitivity exists where itemsdo not cover parts of the domain. In contrast,the instrument on the right-hand side is sensi-tive but includes very significant overlap as themajority of points in both of the domains are inmore than one oval.
AQoL 1 sought to overcome the latter prob-lems and the trade-off between redundancy andinstrument sensitivity by adopting, for the firsttime, a hierarchical structure. This is shown inFigure 3 in which the manifest items clusterinto five latent variables, each representing adimension of the global latent variable, namelyhealth-related quality of life.
Psychological domain
Physical domain
Structural independenceStructural dependence

Richardson et al.: Measurement of the Quality of Life 69
2004 The University of Melbourne, Melbourne Institute of Applied Economic and Social Research
Sensitivity within dimensions was sought byemploying several items in the knowledge thatthis resulted in some redundancy within di-mensions. Orthogonality was achieved be-tween the five dimensions during theconstruction stage through the use of factoranalysis. The downward bias resulting fromdouble counting was limited by independentlyassessing the disutility of each dimension ‘allworst’ health state; that is, it was not possiblefor the disutility, including redundancy, to begreater than the disutility of the three itemsevaluated simultaneously.
AQoL 2 introduced a somewhat differentstatistical strategy. Structural Equation Model-ling was used to select items and dimensionswhich maximised the models explanatorypower of the variance and covariance betweenitems and dimensions; that is, we selected themodel where the latent variable for QoL bestexplains the co-variance between manifestitem responses. This strategy does not, how-ever, ensure orthogonality between dimen-sions. To offset the effects of redundancy asecond stage ‘correction’ to the magnitude of
the predicted utilities will be carried out as dis-cussed in Section 5 below.
2.3 AQoL 2 Innovations
The challenges for AQoL 2 largely arose fromthe experience with AQoL 1. In the three yearsfollowing its initial publication, AQoL 1 wasrequested and sent to 80 research teams and ap-pears to have been used in at least 50 projects.Results from these and from the authors’ five-instrument study indicate a number ofstrengths and weaknesses in AQoL 1 (Haw-thorne et al. 2001). Positive features appear tobe as follows:
• AQoL 1 has greater sensitivity over certaindomains of ill health than other instrumentsand particularly in the region of goodhealth;
• conceptualising health in terms of handicaphas led to a preference for the AQoL instru-ment in a number of projects where socialcontext has been of importance;
Prescribed medicines
Medication and aids
Medical treatment
Self-care
Household tasks
Mobility
Relationships with others
Social isolation
Family role
Seeing
Hearing
Communication
Sleep
Anxiety and depressed
Pain
Health-relatedquality of life
Illness
Independent
Social
Physical
Psychological
living
relationships
senses
wellbeing
Dimensions Items
Figure 3 Structure of AQoL 1
70 The Australian Economic Review March 2004
2004 The University of Melbourne, Melbourne Institute of Applied Economic and Social Research
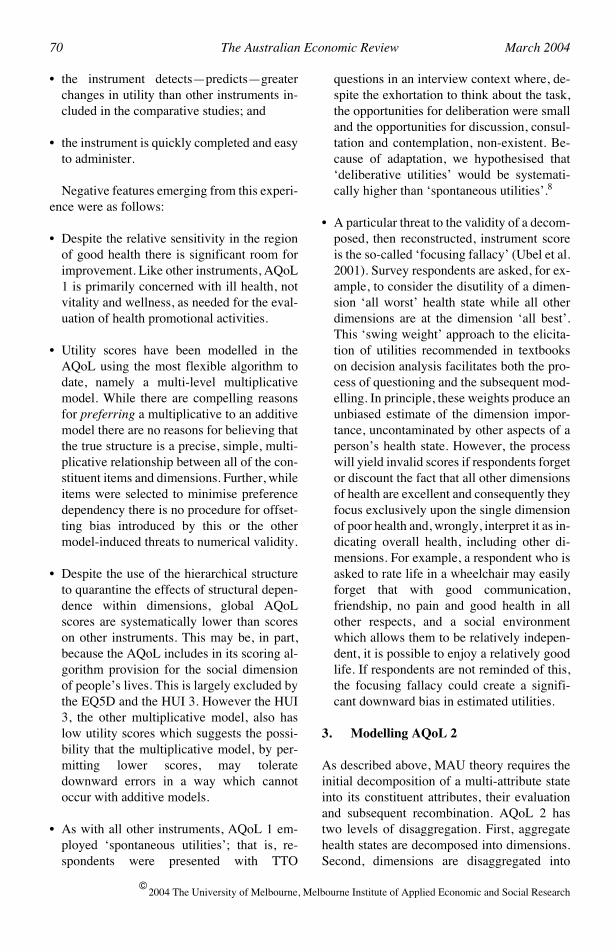
• the instrument detects—predicts—greaterchanges in utility than other instruments in-cluded in the comparative studies; and
• the instrument is quickly completed and easyto administer.
Negative features emerging from this experi-ence were as follows:
• Despite the relative sensitivity in the regionof good health there is significant room forimprovement. Like other instruments, AQoL1 is primarily concerned with ill health, notvitality and wellness, as needed for the eval-uation of health promotional activities.
• Utility scores have been modelled in theAQoL using the most flexible algorithm todate, namely a multi-level multiplicativemodel. While there are compelling reasonsfor
preferring
a multiplicative to an additivemodel there are no reasons for believing thatthe true structure is a precise, simple, multi-plicative relationship between all of the con-stituent items and dimensions. Further, whileitems were selected to minimise preferencedependency there is no procedure for offset-ting bias introduced by this or the othermodel-induced threats to numerical validity.
• Despite the use of the hierarchical structureto quarantine the effects of structural depen-dence within dimensions, global AQoLscores are systematically lower than scoreson other instruments. This may be, in part,because the AQoL includes in its scoring al-gorithm provision for the social dimensionof people’s lives. This is largely excluded bythe EQ5D and the HUI 3. However the HUI3, the other multiplicative model, also haslow utility scores which suggests the possi-bility that the multiplicative model, by per-mitting lower scores, may toleratedownward errors in a way which cannotoccur with additive models.
• As with all other instruments, AQoL 1 em-ployed ‘spontaneous utilities’; that is, re-spondents were presented with TTO
questions in an interview context where, de-spite the exhortation to think about the task,the opportunities for deliberation were smalland the opportunities for discussion, consul-tation and contemplation, non-existent. Be-cause of adaptation, we hypothesised that‘deliberative utilities’ would be systemati-cally higher than ‘spontaneous utilities’.
8
• A particular threat to the validity of a decom-posed, then reconstructed, instrument scoreis the so-called ‘focusing fallacy’ (Ubel et al.2001). Survey respondents are asked, for ex-ample, to consider the disutility of a dimen-sion ‘all worst’ health state while all otherdimensions are at the dimension ‘all best’.This ‘swing weight’ approach to the elicita-tion of utilities recommended in textbookson decision analysis facilitates both the pro-cess of questioning and the subsequent mod-elling. In principle, these weights produce anunbiased estimate of the dimension impor-tance, uncontaminated by other aspects of aperson’s health state. However, the processwill yield invalid scores if respondents forgetor discount the fact that all other dimensionsof health are excellent and consequently theyfocus exclusively upon the single dimensionof poor health and, wrongly, interpret it as in-dicating overall health, including other di-mensions. For example, a respondent who isasked to rate life in a wheelchair may easilyforget that with good communication,friendship, no pain and good health in allother respects, and a social environmentwhich allows them to be relatively indepen-dent, it is possible to enjoy a relatively goodlife. If respondents are not reminded of this,the focusing fallacy could create a signifi-cant downward bias in estimated utilities.
3. Modelling AQoL 2
As described above, MAU theory requires theinitial decomposition of a multi-attribute stateinto its constituent attributes, their evaluationand subsequent recombination. AQoL 2 hastwo levels of disaggregation. First, aggregatehealth states are decomposed into dimensions.Second, dimensions are disaggregated into

Richardson et al.: Measurement of the Quality of Life 71
2004 The University of Melbourne, Melbourne Institute of Applied Economic and Social Research
items. The recombination at each level requiresitem and dimension importance weights.Multi-attribute theory suggests that, when thesum of importance weights exceeds unity, amultiplicative model should be used. For inde-pendent reasons, this model is also important inthe context of health state utilities.
9
The procedures adopted for the derivation of
the AQoL 2 descriptive system followed thepsychometric principles outlined above. Asnoted, AQoL appears to be unique amongstMAU models in this respect. AQoL 2 is similarto AQoL 1 in its conceptualising health prima-rily in terms of handicap. AQoL 2 was alsoconstructed to achieve a multi-level structurewith a number of sub-dimensions, each ofwhich consists of a number of (non-orthogonal) items.
The content of an instrument is determinedby the ‘universe’ of health states defined by theitem bank. For AQoL 2, the item bank was ex-panded to include items of greater relevance inthe region of normal to good health. Addition-ally, response categories for items in AQoL 1were expanded from four per item in order toincrease upper end sensitivity.
The second innovation with respect to thedescriptive system was the addition of a 10-point rating scale with endpoints ‘greatly im-proved’ and ‘totally ruined’ (the respondent’slife). Respondents were asked to use this scaleto indicate how the health state described bytheir item response affected their QoL. Thescale was included for two reasons. First, it per-mits a consistency check. Discordance be-tween the item response and the rating scalemay signal the need to eliminate the responsefrom an analysis. Second, dimension scoresmay be compared, econometrically, with bothitem and rating scale responses to determinewhether or not the rating scale responses in-crease the explanatory power of the dimensionscore. These options are not pursued here. Sys-tematic rules or algorithms for the inclusion ofinformation from the rating scale have yet to beinvestigated and, at present, rating scale datawould need to be used with care.
The protocol for scaling AQoL 2 includedthree potentially important innovations. Thefirst of these was an attempt to encourage re-
spondent deliberation. The almost universalpractice in CUA has been to commence the in-terview with a brief introduction and ‘warmup’ exercise and then to present respondentswith a vignette or health state and ask for theirresponse (using the TTO or SG). While respon-dents are encouraged to think before respond-ing, the time constraints upon the interviewnecessarily result in a ‘spontaneous response’.People making real world decisions with re-spect to these health states would, in contrast,have the opportunity to contemplate the op-tions at length and to discuss the issues withfamily and friends.
There has been almost no experimentationwith the use of ‘deliberative responses’. (Forexceptions see Murray and Lopez 1996 andShiell et al. 2000.) Consequently the AQoL 2protocol employed two separate face-to-faceinterviews. In the first, the usual protocol wasadopted. Interviews were preceded by an intro-duction and warm up exercise followed by theTTO elicitation. The warm up typically tookabout 10 minutes but in some cases longer.Respondents were then dichotomised ran-domly. One-half of respondents were providedwith a deliberation kit designed to encouragethought and discussion of selected issues be-tween the interviews (the intervention group).The remaining respondents were simply re-interviewed (the control group). Differences (alow test–retest correlation) between the firstand second interview responses in the secondgroup may arise because of the sensitising ef-fect of the first interview (Cook and Campbell1978) or because of unreliability. Significantdifferences between the two group’s responsesto the second interview may be attributed to de-liberation. Results presented below employStage 2 interview results. Comparison of thesewith Stage 1 and a comparison of the interven-tion and control groups is reported in Peacocket al. (2003).
The second and potentially most importantinnovation in scaling AQoL 2 was a change inthe presentation of questions to minimise errorarising from the focusing effect. For each of themulti-attribute health states, an overview of thefull health state was included which indicatedwhich of the dimensions were at the dimension

72 The Australian Economic Review March 2004
2004 The University of Melbourne, Melbourne Institute of Applied Economic and Social Research
all-best, all-worst, or at an intermediate healthstate. This took the form of a visual aid. Whena respondent was asked to focus upon poorhealth in one dimension only, they were pro-vided this information pictorially in a waywhich reminded them that other dimensionswere good or at their all best.
A final difference with AQoL 1 arises forpragmatic reasons. If a single respondent wasasked to provide all of the information re-quired, the interview burden would have beenexcessive, even allowing for a two-stage inter-view. Consequently, the two face-to-face inter-views were used to collect relatively complexTTO and PTO scores for the major parameters,namely the multi-attribute health states and thedimension all-worst scores. Item responses anditem worst scores were collected subsequentlyfrom the respondents using a postal survey anda rating scale. Repetition of some rating scalequestions during the interview allowed theconstruction of an econometric ‘exchange rate’between rating scale and TTO/PTO scores.
As discussed, to increase the flexibility ofthe modelling a two-stage procedure wasadopted, described below as the ‘Stage 1 mul-tiplicative model’ and the ‘Stage 2 econometriccorrection’. Stage 1 employed the standardmultiplicative model recommended in decisionanalytic theory (Von Winterfeldt and Edwards1986). This is similar to equation (1) below:
U
=
U
1
*
U
2
*
U
3
… *
U
n
(1)
where
U
is the utility of the combined multi-attribute health state and
U
i
(
i
= 1, …,
n
) are theutility scores for items (in the dimensionmodel) or dimensions (in the AQoL model).The actual model is somewhat more flexible. Itis calculated using disutilities rather than utili-ties and these are adjusted for the relative im-portance of each of the model’s dimensions.This results in equation (2) in which
x
ij
are di-mension (or item) scores,
w
i
are the dimension(or item) importance weights and
k
is the over-all scaling constant. This is obtained by solvingequation (3) for
k
. It is similar to the require-ment in an additive model that the dimensionweights sum to unity. The relationship betweenutility and disutility is given in equation (4).
DU
= (2)
k
= (3)
U
*
= 1 –
DU
*
(4)
where
DU
is the disutility score correspondingwith utility
U
.This multiplicative model was applied at two
levels; first, to combine items into dimensionsand, second, to combine dimensions into theoverall AQoL score.
In order to carry out the ‘Stage 2 econometriccorrection’, TTO scores were collected for aselection of MAU health states. These were se-lected using an experimental design in order toinclude varying response levels from each ofthe dimensions and with varying combinationsof response levels from the dimensions. Thesemulti-attribute scores have been regressedupon the multiplicative Stage 1 AQoL scoreand other Stage 1 data using the power functionin equation (5).
TTO
(
MA
) =
AQoL
a
+
D
(5)
where
AQoL
= Stage 1 multiplicative AQoLscore;
a
= constant; and
D
= a set of parametersincluding dimension scores and slope dummyvariables.
This function is constrained to pass throughthe points (1, 1) and (0, 0); that is, when themultiplicative AQoL score is 0 the predictedscore for the power function is 0 and, likewise,an AQoL score of 1.00 must predict a score of1.00. Between these points the function is flex-ible and may vary with the model parameters.Results are not included in the present article.
4. Results
4.1 Survey Results
Two postal surveys and two interviews (withthe same respondent) were conducted. Toachieve a broadly representative sample of theAustralian population, names were selectedfrom postcodes within Melbourne according to
1k--- 1 kwiDUi xij( )+[ ]
i 1=
n
∏ 1–
1 kwi+( )i 1=
n
∏ 1–

Richardson et al.: Measurement of the Quality of Life 73
2004 The University of Melbourne, Melbourne Institute of Applied Economic and Social Research
the socio-economic profile of the postcode, asmeasured by the SEIFA index. Respondents tothe first postal survey—the ‘construction sur-vey’—were asked to complete all of the itemsin the item bank which survived the initial fil-ter. The second postal survey was for the cali-bration of item responses for items selected forthe final instrument. The protocol required thetransformation of the rating scale into TTOscores. Details of this procedure and a full de-scription of the surveys and interviews aregiven in Richardson et al. (2003b). The two in-terviews were carried out to obtain TTO, PTOand self-TTO data. (The latter two datasets arenot discussed here.) A small payment was madeto respondents who came to a central locationfor the two interviews. The number of respon-dents and response rates are shown in Table 3.Partly because of the persistence with whichcontacts were pursued and partly because of thefinancial inducement, response rates for suchan onerous interview/survey were acceptableand greater than the 25 to 30 per cent responserate commonly obtained from such surveys.
4.2 AQoL 2 Descriptive System
Structural Equation Modelling was used to de-termine the dimensions and the combination ofitems within each dimension which best ex-plained variation in the observed item re-sponses. ‘Logical analysis’—correspondencebetween items, dimensions and theoretical ex-pectations—was also used when the statisticalresults were ambiguous or perverse.
The result of the analysis is shown in Figure4 and the AQoL 2 questionnaire is reproduced
in Appendix 1. The 20 items selected form sixdimensions of health: independent living (fouritems); social and family (three items); mentalhealth (four items); coping (three items); pain(three items); and sense perceptions (threeitems). The coefficients reported in Figure 4 in-dicate an exceptionally good relationship be-tween the postulated model and the pattern ofitem responses. A confirmatory fit index (CFI)above 0.9 is considered to be acceptable. TheCFI of 0.99 for AQoL 2 is very good.
10
Com-mencing from the left side of Figure 4, the firstcolumn of numbers are the gamma coefficientsbetween the dimension and AQoL latent vari-ables. These are equivalent to a standardisedcorrelation coefficient. In contrast with the cor-relations reported in Table 2 these correlationsare based upon individual observations. Thereis no ‘averaging’ of the noise and, conse-quently, such correlation coefficients are gen-erally low. In the present case, however, withthe exception of sense perceptions where thegamma coefficient is 0.51, all of the coeffi-cients are 0.73 or greater. Lambda weights be-tween the observed item responses and thedimension latent variables—the middle col-umn of Figure 4—may also be interpreted asequivalent to correlation coefficients. None isbelow 0.50. Error terms on the individual itemsin the final, right-hand column are generallylow for an analysis of individual-level data.
4.3 Utility Weights
Results from the scaling interviews and postalsurvey are reported in Tables 4 to 7. Postalsurvey 2 obtained ratings scale results for item
Table 3 Data Collection for AQoL 2
PurposeRespondents
(number)Response rate
(per cent)
Postal Survey 1
Postal, outpatients, inpatients completion of items in item bank 618
a
44
Interview 1
TTO values for dimension worst, multi-attribute health states 411 47
Interview 2
Multi-attribute health states (continued) PTO, self-TTO 411 47
Postal Survey 2
Rating scale: Item responses, item worst scores 163 40
Note
: (a) General population 316, outpatients 96, inpatients 206.

74 The Australian Economic Review March 2004
2004 The University of Melbourne, Melbourne Institute of Applied Economic and Social Research
responses and item worst health states. Thesewere transformed into TTO equivalent scoresusing a two-part transformation function de-scribed in Richardson et al. (2003b). Table 4reports item response utilities measured on a(1–0) scale where the endpoints are the itembest (
DU
= 0.00) and the item worst (DU =1.00).
Items were constructed to achieve two objec-tives. The first was to obtain item responsesthat are approximately equidistant between theitem best and worst health state. Thus, for ex-ample, if the disutility scores for an item as-sumed values of 0.00, 0.02, 0.04, 0.06 and1.00, then the item would be unable to detectchanges in the range 0.06 to 1.00. The second
objective was to obtain greater sensitivity nearfull health than has been achieved in previousinstruments. Results in Table 4 indicate thatthese two objectives have been largely ful-filled. Only four of the 20 items have a spacebetween response values which exceed 0.5(items 6, 15, 16 and 17). In contrast, the spacebetween the first two response items (which arein the vicinity of good health) is comparativelysmall. In 12 cases it is less than 0.10 and themaximum gap is 0.20 (items 7 and 16).
Item worst scores, wi, were also estimatedfrom rating scale results in the second postalsurvey and are measured on a scale fromdimension best (DU = 0.00) to dimensionworst (DU = 1.00). They indicate the relative
Q1 0.75
SOCIAL
INDLIV
MHEALTH
COPING
PAIN
SENSPERC
Q2 0.27
Q3 0.22
Q4 0.20
Q5 0.16
Q6 0.33
Q7 0.31
Q8 0.36
Q9 0.31
Q10 0.50
Q11 0.67
Q18 0.67
Q19 0.55
Q20 0.66
Q15 0.13
Q16 0.28
Q17 0.33
Q12 0.45
Q13 0.56
Q14 0.56
0.83
0.96
0.73
0.51
0.96
0.86
AQOL
0.85
0.90
0.920.82
0.830.80
0.83
0.70
0.58
0.74
0.66
0.930.85
0.580.67
0.59
0.82
0.66
0.88
0.50
Figure 4 Structure of AQoL 2a
Note: (a) Chi-square = 460.73, df = 164, P-value = 0.00000, RMSEA = 0.054, CFI = 0.99, d1_6×6×2.spl. From the left, thethree sets of numbers represent gamma coefficients (between the AQoL and dimension latent variables), Lambda coeffi-cients (between dimension and items) and error terms on each of the items.

Richardson et al.: Measurement of the Quality of Life 75
2004 The University of Melbourne, Melbourne Institute of Applied Economic and Social Research
importance of the different items. To obtain thefinal item weights these are multiplied by thedimension scaling factors (kd) which are de-rived from the item worst scores and fromequation (3) (see Table 5). The final itemweight, wti, is used to construct the dimensionformulae shown later (see Figure 5).
The appropriate criterion for judging the re-sults in Table 5 is that weights should not betoo small—indicating an unimportant item—and, ideally, there should be no item in a di-mension which dominates other results. FromTable 5 these objectives have been achieved.No item has an importance weight of less than
0.38 and 15 of the 20 weights exceed 0.5. Nosingle item dominates the results.
TTO values for the dimension worst andAQoL all-worst health states were assessed ona best health (0.00) – death (1.00) scale. Thelatter endpoint was used in preference to theAQoL all-worst health state to minimise thecognitive burden upon interviewees. As the all-worst health state may be (and generally was)worse than death for respondents, the TTO pro-tocol permitted this option.11 The disutilities ofthese pivotal results were collected in both ofthe face-to-face interviews which were con-ducted between two and four weeks apart.
Table 4 Item Disutilities (Mean TTO Scores)
Response level Dimension 1 Dimension 2 Dimension 3 Dimension 4 Dimension 5 Dimension 6
Item 1 Item 5 Item 8 Item 12 Item 15 Item 18
1 0.00 0.00 0.00 0.00 0.00 0.00
2 0.07 0.07 0.13 0.06 0.13 0.03
3 0.44 0.46 0.39 0.34 0.64 0.22
4 0.82 0.84 0.84 0.72 1.00 0.62
5 1.00 1.00 1.00 1.00 0.84
6 1.00
Item 2 Item 6 Item 9 Item 13 Item 16 Item 19
1 0.00 0.00 0.00 0.00 0.00 0.00
2 0.03 0.19 0.14 0.06 0.20 0.02
3 0.24 0.76 0.39 0.38 0.76 0.20
4 0.47 1.00 0.82 0.77 1.00 0.59
5 0.84 1.00 1.00 0.83
6 1.00 1.00
Item 3 Item 7 Item 10 Item 14 Item 17 Item 20
1 0.00 0.00 0.00 0.00 0.00 0.00
2 0.04 0.20 0.10 0.06 0.07 0.19
3 0.25 0.65 0.33 0.42 0.33 0.70
4 0.57 1.00 0.78 0.83 0.75 1.00
5 0.83 1.00 1.00 1.00
6 1.00
Item 4 Item 11
1 0.00 0.00
2 0.04 0.06
3 0.30 0.37
4 0.80 0.84
5 1.00 1.00
Note: Item best and worst disutilities are set equal to 0.00 and 1.00 respectively.
76 The Australian Economic Review March 2004
2004 The University of Melbourne, Melbourne Institute of Applied Economic and Social Research
Mean values, reported in Table 6, reveal imper-fect test–retest reliability with the second re-sults generally lower than the first, suggestingthat, after deliberation, health states appearsomewhat less serious than when they are firstcontemplated. The reported median scores areconsistent with mean values and particularlythose from the second interview.
The theoretically more plausible ‘delibera-tive’ results from the second survey were usedin the reported results here in preference tospontaneous weights. Evidence presented byShiell et al. (2000) suggests that utilities elic-ited from a second interview are likely to re-flect stable future values.
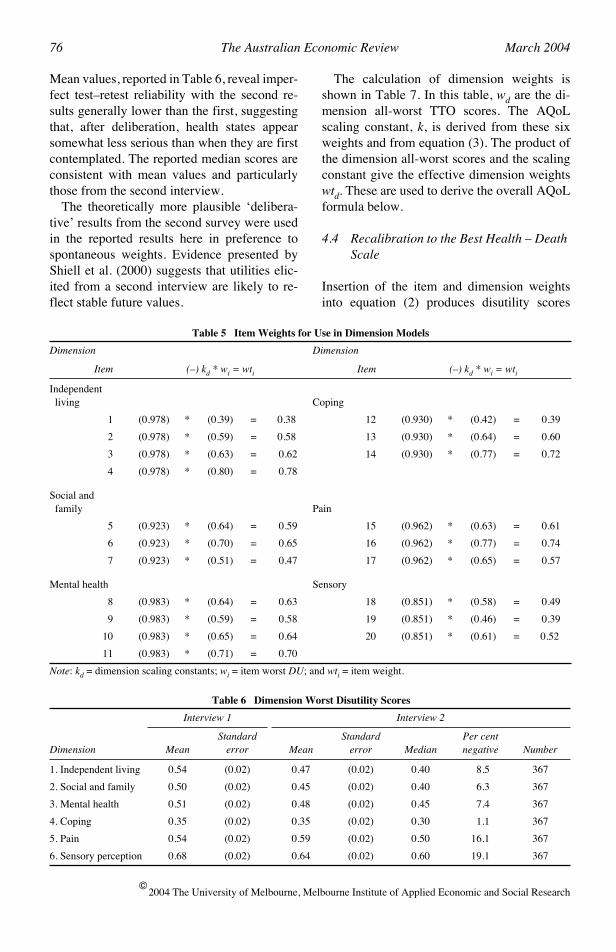
The calculation of dimension weights isshown in Table 7. In this table, wd are the di-mension all-worst TTO scores. The AQoLscaling constant, k, is derived from these sixweights and from equation (3). The product ofthe dimension all-worst scores and the scalingconstant give the effective dimension weightswtd. These are used to derive the overall AQoLformula below.
4.4 Recalibration to the Best Health – Death Scale
Insertion of the item and dimension weightsinto equation (2) produces disutility scores
Table 5 Item Weights for Use in Dimension Models
Dimension Dimension
Item (–) kd * wi = wti Item (–) kd * wi = wti
Independent living Coping
1 (0.978) * (0.39) = 0.38 12 (0.930) * (0.42) = 0.39
2 (0.978) * (0.59) = 0.58 13 (0.930) * (0.64) = 0.60
3 (0.978) * (0.63) = 0.62 14 (0.930) * (0.77) = 0.72
4 (0.978) * (0.80) = 0.78
Social and family Pain
5 (0.923) * (0.64) = 0.59 15 (0.962) * (0.63) = 0.61
6 (0.923) * (0.70) = 0.65 16 (0.962) * (0.77) = 0.74
7 (0.923) * (0.51) = 0.47 17 (0.962) * (0.65) = 0.57
Mental health Sensory
8 (0.983) * (0.64) = 0.63 18 (0.851) * (0.58) = 0.49
9 (0.983) * (0.59) = 0.58 19 (0.851) * (0.46) = 0.39
10 (0.983) * (0.65) = 0.64 20 (0.851) * (0.61) = 0.52
11 (0.983) * (0.71) = 0.70
Note: kd = dimension scaling constants; wi = item worst DU; and wti = item weight.
Table 6 Dimension Worst Disutility Scores
Interview 1 Interview 2
Dimension MeanStandard
error MeanStandard
error MedianPer centnegative Number
1. Independent living 0.54 (0.02) 0.47 (0.02) 0.40 8.5 367
2. Social and family 0.50 (0.02) 0.45 (0.02) 0.40 6.3 367
3. Mental health 0.51 (0.02) 0.48 (0.02) 0.45 7.4 367
4. Coping 0.35 (0.02) 0.35 (0.02) 0.30 1.1 367
5. Pain 0.54 (0.02) 0.59 (0.02) 0.50 16.1 367
6. Sensory perception 0.68 (0.02) 0.64 (0.02) 0.60 19.1 367

Richardson et al.: Measurement of the Quality of Life 77
2004 The University of Melbourne, Melbourne Institute of Applied Economic and Social Research
constrained to the range 0.00 to 1.00. For theoverall AQoL model these endpoints corre-spond with the AQoL best and worst healthstate respectively. To recalibrate to an AQoLbest health – death scale, where death equals1.00, requires the multiplication of the (0–1)model scores by W, the disutility of the AQoLall-worst health state measured on a life–death(0–1) scale. This latter value was 1.102.
The final dimension and overall AQoL for-mulae are obtained by inserting the item and di-mension weights from Tables 5 and 7 intoequation (1), rescaling to the full health – deathscale as described above and converting dis-utility into utility using equation (4). Resultsare presented in Figure 5.
An example of the use of these formulae toobtain a health state utility score is given in Ap-pendix 2.
5. Discussion and Future Work
There are numerous unresolved issues associ-ated with the construction of MAU instrumentsand, more fundamentally, with the measure-ment and the valuation of the outcomes fromhealth-related interventions. As decisions con-cerning patient treatment and the net benefit ofdifferent services for a health scheme are beingmade daily, it is important that these are basedupon current best practice. This rationale ex-tends to the construction of instruments formeasuring the quality of life.
Table 7 Dimension Weights for Use in AQoL Model
Dimension k * wd = wtd
1. Independent living 0.965 * (0.47) = 0.454
2. Social 0.965 * (0.45) = 0.434
3. Mental health 0.965 * (0.48) = 0.463
4. Coping 0.965 * (0.35) = 0.338
5. Pain 0.965 * (0.59) = 0.570
6. Senses 0.965 * (0.64) = 0.618
AQoL W/k = 1.132/0.965
= 1.17
Note: k = AQoL scaling constant; wd = dimension all-worst; wtd = dimension weight; and W = AQoL all-worst(full health – death scale).
Figure 5 Multiplicative Utility Formulae
General formula for utility modela
Independent living U1 = 1.02i[(0.62 + 0.38u1)(0.42 + 0.58u2)(0.38 + 0.62du)(0.22 + 0.78u4)] – 0.02
Social and family U2 = 1.08i[(0.41 + 0.59u5)(0.36 + 0.64u6)(0.53 + 0.47u7)] – 0.08
Mental health U3 = 1.02i[(0.37 + 0.63u8)(0.42 + 0.58u9)(0.36 + 0.64u10)(0.30 + 0.70u11)] – 0.02
Coping U4 = 1.08i[(0.61 + 0.39u12)(0.41 + 0.59u13)(0.28 + 0.72u14)] – 0.08
Pain U5 = 1.04i[(0.39 + 0.61u15)(0.26 + 0.74u16)(0.37 + 0.63u17)] – 0.04
Senses U6 = 1.18i[(0.51 + 0.49u18)(0.61 + 0.39u19)(0.49 + 0.51u20)] – 0.18
AQoL general formula
= 1.17[(0.546 + 0.454u1)(0.566 + 0.434u2)(0.537 + 0.463u3) (0.662 + 0.338u4)(0.430 + 0.570u5)(0.382 + 0.618u6)] – 0.17
Note: (a) The utility formula is derived from equations (2) and (4) earlier. Ud = utility score, dimension d; ui = utility score, item i; kd = scaling constant, dimension d; k = scaling constant, AQoL; wi = item worst, item i; and wd = dimension worst, dimension d.
Ud1kd----- 1 kd– wi 1 ui–( )[ ]
i 1=
n
∏⋅ 1kd----- 1–
–=
U AQoLWk----- 1 kwd– 1 Ud–( )[ ]
d 1=
n
∏⋅ W1k--- 1–
–=
U AQoL

78 The Australian Economic Review March 2004
2004 The University of Melbourne, Melbourne Institute of Applied Economic and Social Research
Despite this, it is important to recognise thelimitations of current state-of-the-art instru-ment construction and to progressively im-prove measurement. Some of these limitationsmotivated the present study and have been ad-dressed in the present article. These includethe need for deliberation before values areelicited from respondents and an interviewprotocol which explicitly overcomes the fo-cusing effect. Technical ‘validity’ has been in-creased by using standard psychometricprocedures for constructing a model in theform currently used in the MAU literature andby the introduction of multi-level modelling asa superior methodology for explaining vari-ance and covariance between the manifestitem responses.
During the two-stage interviews, data werecollected which allow two other methodologi-cal developments. While most utility measure-ments now employ the TTO or SG (whichproduce very similar results) the PTO has alsobeen advocated. In particular, the PTO is prob-ably the preferred scaling instrument if a ‘com-munity’ perspective is desired—the PTO asksrespondents for a judgement concerning the al-location of health between others, and in a waythat leaves the respondent personally unaf-fected. The technique is important as it was theprocedure used in the calculation of disability-adjusted life years (DALYs) in the WorldHealth Organization (WHO) Global Burden ofDisease Study which estimates the DALY bur-den of every disease in every country (Murrayand Lopez 1996). The procedure has been pro-moted vigorously through WHO workshopsand it has been widely adopted in economicevaluation studies and, in particular, in Austra-lia. The choice between the personal perspec-tive of the TTO and the social perspective ofthe PTO is an ethical, and not a technical, issue.Consequently, PTO scores have been collectedand a PTO version of the AQoL algorithm willbe forthcoming.
Modelling in the MAU literature has beenrelatively unsophisticated. The multiplicativemodel represents a significant improvementupon the additive model. However, it is still arelatively simple combination rule which im-poses a questionable degree of uniformity in
the relationships between items and dimen-sions: there is no difference in this relationshipin the vicinity of full health and in the vicinityof death. The same multiplicative relationshipis assumed to exist between all items and di-mensions. As there is no theoretical rationalefor this uniformity a second stage adjustment isbeing developed to introduce flexibility intoboth of these relationships. This involves theeconometric ‘explanation’ of TTO scores for arepresentative sample of multi-attribute healthstates, using survey data and, in principle, anyother relevant patient characteristics as the in-dependent variables. The econometric relation-ship which best explains the multi-attributeTTO scores will be the corrected genericAQoL instrument.
It was noted earlier that the multiplicativemodels in the literature—the HUI 1–3 andAQoL 1—produce lower utility scores thanthe other models. An additional reason for thesecond stage was to correct any such down-ward bias arising from the multiplicativemodel.
To date, the more than 1000 TTO scores ob-tained for selected multi-attribute health stateshave been used as dependent variables in aneconometric analysis which has employed amodified power function which constrains thefunction to pass through the pivotal points (0,0) and (1, 1) (see Richardson et al. 2003b). Ifthe Stage 1 multiplicative model explained allof the systematic variation in the utility ofhealth states then the resulting ‘power func-tion’ would have an exponent of 1.00; that is,the function would be the linear relationship U= UAQoL. If the multiplicative model does notexplain all of the systematic variation then thefunction will be more complex. In principle,any variable which improves the functional re-lationship might be included in the formula.The interval property of the resulting utilityscores would be promoted, not confounded,by the transformation. The key assumptionhere—and in the relevant literature—is thatthis property applies to the utility of the multi-attribute health states (the left-hand side of theequation). The multiplicative approximation(right-hand side) will not have this propertyunless it is identical to the MAU scores. The

Richardson et al.: Measurement of the Quality of Life 79
2004 The University of Melbourne, Melbourne Institute of Applied Economic and Social Research
independent variables used to date in this an-alysis have been the predicted AQoL scorefrom the multiplicative model, dummy vari-ables for the quartile of the (0–1) range of thisscore and six variables repeating the dimen-sion scores used in the Stage 1 model. Resultsfrom the analysis have been encouraging withR2 coefficients between 0.67 and 0.76 (inequations where the constant term has beensuppressed). Importantly, this ‘second stagecorrection’ may be used to obtain low-cost ad-aptations of the AQoL for atypical diseases orpopulation groups with an atypical preferencestructure.
6. Conclusions
While we have attempted to improve upon thecurrent methodologies, the work reported inthis article does not, of course, guarantee valid-ity and reliability. This question remains prob-lematical as no one has devised a test for goldstandard validation. This would require, interalia, demonstration that utility weights accu-rately represented the desired trade-off be-tween the quality and quantity of life. Therehas been widespread acceptance in the MAUliterature that the gold standard should employcommunity-stated preferences. However, thisview is contestable. Elsewhere in economics,consumer (revealed) preferences are usuallysovereign. Current practice might be rationa-lised by arguing that community preferencesrepresent patient preferences. This is not uni-versally true as patients with long-term healthproblems undergo significant adaptation totheir health state. The extent of the divergencebetween adapted and non-adapted preferencesand its relevance have not been properly docu-mented or discussed (Menzel et al. 2002).
Even with the more tractable concept ofcommunity preferences, there are unresolvedtheoretical and measurement issues. With ei-ther concept, benefits are conceptualised as anincreased quality or quantity of life. Neitherconcept addresses the numerous other proce-dural and distributive elements of health-related social wellbeing which authors haveposited in the recent literature. Nord (1999) andNord et al. (1999) have suggested that the term
‘Cost Value Analysis’ be used to indicate ashift from individual utility as the relevant met-ric in economic evaluation studies to ‘socialvalue’ as measured by a QALY adjusted to in-clude presently neglected elements of socialwellbeing.
The chief justification for the present gener-ation of measurement methods is that they arean improvement upon the methods of the pastand that the systematic inclusion of an increas-ing number of socially desirable attributes andthe use of increasingly sophisticated methodol-ogies will result in better decision making. It isalmost self-evident, however, that these meth-odologies are incomplete and should be viewedas an aid to decision making and not as a defin-itive algorithm for social choice.
First version received July 2003;final version accepted December 2003 (Eds).
Appendix 1: Assessment of Quality of Life (AQoL) Mark 2
How to answer
Please read the Explanatory Statement and signa consent form before you begin.
Each question has two parts. You answer thefirst part by ticking the box next to the responsethat best fits your situation. The second part ofeach question is a horizontal scale. You mark across somewhere along the scale to show howyour quality of life is affected by the situationyou describe in your answer to the first part ofthe question. Look at the example answer formore information.

80 The Australian Economic Review March 2004
2004 The University of Melbourne, Melbourne Institute of Applied Economic and Social Research
When you finish answering all the questions,please hand the questionnaire back.
Many thanks!
Assessment of Quality of Life (AQoL) Mark 2
Q1 How much help do I need with householdtasks (e.g. preparing food, cleaning the houseor gardening)?❑ I can do all these tasks very quickly and ef-
ficiently without any help❑ I can do these tasks relatively easily without
help❑ I can do these tasks only very slowly with-
out help❑ I cannot do most of these tasks unless I have
help❑ I can do none of these tasks by myself.
Q2 Thinking about how easy or difficult it isfor me to get around by myself outside myhouse (e.g. shopping, visiting): ❑ getting around is enjoyable and easy❑ I have no difficulty getting around outside
my house❑ a little difficulty❑ moderate difficulty❑ a lot of difficulty❑ I cannot get around unless somebody is
there to help me.
Q3 Thinking about how well I can walk: ❑ I find walking or running very easy❑ I have no real difficulty with walking or
running❑ I find walking or running slightly difficult. I
cannot run to catch a tram or train, I findwalking uphill difficult.
❑ walking is difficult for me. I walk short dis-tances only, I have difficulty walking upstairs.
❑ I have great difficulty walking. I cannotwalk without a walking stick or frame, orsomeone to help me.
❑ I am bedridden.
Q4 Thinking about washing myself, toileting,dressing, eating or looking after my appear-ance:
Example answer
Mr Smith’s relationships with his family make him generally happy, so he marks the second box from the top to show his answer:
i) My relationships with my family makeme:❑ very happy❑✓ generally happy❑ neither happy nor unhappy❑ generally unhappy❑ very unhappy❑ this question is not relevant to me.
Mr Smith feels his quality-of-life is greatly improved by the fact that his relationships with his family make him ‘generally unhappy’, so he marks a cross on the left hand end of the scale.
How does this affect my quality of life?
×greatlyimproved
no effecteither way
totallyruined
How does this affect my quality of life?
greatlyimproved
no effecteither way
totallyruined
How does this affect my quality of life?
greatlyimproved
no effecteither way
totallyruined
How does this affect my quality of life?
greatlyimproved
no effecteither way
totallyruined

Richardson et al.: Measurement of the Quality of Life 81
2004 The University of Melbourne, Melbourne Institute of Applied Economic and Social Research
❑ these tasks are very easy for me❑ I have no real difficulty in carrying out these
tasks❑ I find some of these tasks difficult, but I
manage to do them on my own❑ many of these tasks are difficult, and I need
help to do them❑ I cannot do these tasks by myself at all.
Q5 My close and intimate relationships (in-cluding any sexual relationships) make me: ❑ very happy ❑ generally happy❑ neither happy nor unhappy❑ generally unhappy ❑ very unhappy.
Q6 Thinking about my health and my rela-tionship with my family: ❑ my role in the family is unaffected by my
health❑ there are some parts of my family role I can-
not carry out❑ there are many parts of my family role I
cannot carry out❑ I cannot carry out any part of my family
role.
Q7 Thinking about my health and my role inmy community (that is to say neighbourhood,sporting, work, church or cultural groups):
❑ my role in the community is unaffected bymy health
❑ there are some parts of my community roleI cannot carry out
❑ there are many parts of my community roleI cannot carry out
❑ I cannot carry out any part of my commu-nity role.
Q8 How often did I feel in despair over thelast seven days? ❑ never❑ occasionally❑ sometimes❑ often❑ all the time.
Q9 And still thinking about the last sevendays: how often did I feel worried? ❑ never❑ occasionally❑ sometimes❑ often❑ all the time.
Q10 How often do I feel sad? ❑ never ❑ rarely❑ some of the time❑ usually ❑ nearly all the time.
How does this affect my quality of life?
greatlyimproved
no effecteither way
totallyruined
How does this affect my quality of life?
greatlyimproved
no effecteither way
totallyruined
How does this affect my quality of life?
greatlyimproved
no effecteither way
totallyruined
How does this affect my quality of life?
greatlyimproved
no effecteither way
totallyruined
How does this affect my quality of life?
greatlyimproved
no effecteither way
totallyruined
How does this affect my quality of life?
greatlyimproved
no effecteither way
totallyruined

82 The Australian Economic Review March 2004
2004 The University of Melbourne, Melbourne Institute of Applied Economic and Social Research
Q11 When I think about whether I am calmand tranquil or agitated: ❑ always calm and tranquil❑ usually calm and tranquil❑ sometimes calm and tranquil, sometimes
agitated❑ usually agitated❑ always agitated.
Q12 Thinking about how much energy I haveto do the things I want to do, I am: ❑ always full of energy❑ usually full of energy❑ occasionally energetic❑ usually tired and lacking energy❑ always tired and lacking energy.
Q13 How often do I feel in control of my life? ❑ always❑ mostly❑ sometimes❑ only occasionally❑ never.
Q14 How much do I feel I can cope with life’sproblems? ❑ completely❑ mostly❑ partly❑ very little❑ not at all.
Q15 Thinking about how often I experienceserious pain. I experience it: ❑ very rarely❑ less than once a week❑ three to four times a week❑ most of the time.
Q16 How much pain or discomfort do I expe-rience? ❑ none at all❑ I have moderate pain❑ I suffer from severe pain❑ I suffer unbearable pain.
Q17 How often does pain interfere with myusual activities? ❑ never ❑ rarely❑ sometimes ❑ often ❑ always.
How does this affect my quality of life?
greatlyimproved
no effecteither way
totallyruined
How does this affect my quality of life?
greatlyimproved
no effecteither way
totallyruined
How does this affect my quality of life?
greatlyimproved
no effecteither way
totallyruined
How does this affect my quality of life?
greatlyimproved
no effecteither way
totallyruined
How does this affect my quality of life?
greatlyimproved
no effecteither way
totallyruined
How does this affect my quality of life?
greatlyimproved
no effecteither way
totallyruined
How does this affect my quality of life?
greatlyimproved
no effecteither way
totallyruined

Richardson et al.: Measurement of the Quality of Life 83
2004 The University of Melbourne, Melbourne Institute of Applied Economic and Social Research
Q18 Thinking about my vision (using myglasses or contact lenses if needed): ❑ I have excellent sight❑ I see normally❑ I have some difficulty focusing on things, or
I do not see them sharply. E.g. small print, anewspaper or seeing objects in the distance.
❑ I have a lot of difficulty seeing things. Myvision is blurred. I can see just enough to getby with.
❑ I only see general shapes. I need a guide tomove around.
❑ I am completely blind.
Q19 Thinking about my hearing (using myhearing aid if needed): ❑ I have excellent hearing❑ I hear normally❑ I have some difficulty hearing or I do not
hear clearly. I have trouble hearing softly-spoken people or when there is backgroundnoise.
❑ I have difficulty hearing things clearly.Often I do not understand what is said. Iusually do not take part in conversations be-cause I cannot hear what is said.
❑ I hear very little indeed. I cannot fully un-derstand loud voices speaking directly tome.
❑ I am completely deaf.
Q20 When I communicate with others, e.g. bytalking, listening, writing or signing: ❑ I have no trouble speaking to them or under-
standing what they are saying❑ I have some difficulty being understood by
people who do not know me. I have no trou-ble understanding what others are saying tome.
❑ I am understood only by people who knowme well. I have great trouble understandingwhat others are saying to me.
❑ I cannot adequately communicate with oth-ers.
AQoL Study Background Questions
Please tick ✓ one box per question.
21 Are you:❑ male ❑ female
22 In what year were you born? 19____
23 Where were you born?❑ Australia ❑ Other country ☞ Which one? ____________
24 Is English your first language?❑ yes ❑ no ☞ Specify: ____________
25 What is your highest level of education?❑ primary schooling only❑ secondary schooling completed❑ secondary schooling not completed.
☞ How many years completed? ____❑ trade qualification or TAFE:
☞ Specify course: _____________❑ University or other tertiary study❑ Other or not applicable: please describe: ______________________
26 Which best describes your work situation?(Tick as many boxes as apply)❑ full-time: self-employed or employee
How does this affect my quality of life?
greatlyimproved
no effecteither way
totallyruined
How does this affect my quality of life?
greatlyimproved
no effecteither way
totallyruined
How does this affect my quality of life?
greatlyimproved
no effecteither way
totallyruined
How does this affect my quality of life?
greatlyimproved
no effecteither way
totallyruined

84 The Australian Economic Review March 2004
2004 The University of Melbourne, Melbourne Institute of Applied Economic and Social Research
❑ part-time: self-employed or employee ❑ unemployed, seeking work❑ working in the home / home duties❑ retired❑ student❑ other: please describe: ______________________
If You Are Employed Or Self-Employed Or Seeking Work:
27 What is your occupation?______________________
28 What do you do in your job?______________________
29 Do you receive any Government pension orbenefit?❑ no❑ yes ☞ Which pension(s) or benefit(s)? ______________________
30 Are you:❑ married or living with a partner❑ single: never married❑ single: widowed ❑ single: divorced or separated
31 How would you rate your current level ofhealth, for someone of your age?❑ excellent❑ very good❑ good❑ fair❑ poor❑ very poor❑ extremely poor
32 Mark one box on the scale to show how im-portant or unimportant religion or spiritual-ity is in your life❑ ❑ ❑ ❑ ❑ ❑ ❑⇓ ⇓ ⇓ ⇓
very important unimportant veryimportant unimportant
33 Please mark one box to show your HOUSE-HOLD income, either annually, monthly orweekly. Include income that comes to the
household from all sources. You may esti-mate either before or after tax.❑ yearly under $20,000
monthly under $1,665fortnightly under $800weekly under $385
❑ yearly $20,001–$30,000monthly $1,665–$2,500fortnightly $800–$1,155weekly $385–$575
❑ yearly $30,001–$40,000monthly $2,501–$3,330fortnightly $1,156–$1,535weekly $576–$770
❑ yearly $40,001–$50,000monthly $3,331–$4,165fortnightly $1,536–$1,925weekly $771–$960
❑ yearly $50,001–$60,000monthly $4,166–$5,000fortnightly $1,926–$2,305weekly $961–$1,155
❑ yearly $60,001–$80,000monthly $5,001–$6665fortnightly $2,306–$3,075weekly $1,156–$1,540
❑ yearly more than $80,000monthly more than $6665fortnightly more than $3,075weekly more than $1,540
34 Please mark a box to show whether your an-swer is before or after tax.❑ before tax❑ after tax
Appendix 2: Obtaining a Health State Utility from the AQoL Algorithm: A Worked Example
Obtaining a utility score for a health state in-volves the following steps.
(i) Complete the AQoL questionnaire anddetermine the 20 response levels whichdefine the health state.
Thank you! Please bring this questionnairewith you when you attend the group ses-sion/interview.

Richardson et al.: Measurement of the Quality of Life 85
2004 The University of Melbourne, Melbourne Institute of Applied Economic and Social Research
(ii) Read the 20 item disutility scores, dui,which correspond with the response lev-els from Table 4. These ‘disutilities’ aremeasured on a (1–0) scale with the itembest and worst defining the endpoints.
(iii) Enter the item disutility scores, dui, intothe corresponding equation in Figure 5.Calculate the six dimension disutilityscores DUd. These disutilities are mea-sured on a (0–1) scale where the endpointsare the dimension best and dimension ‘allworst’ (all items at their worst level).
(iv) Enter the six dimension DUd scores intothe final AQoL equation in Figure 5. Thescore obtained is the predicted disutilityfor the health state.
(v) Convert disutilities into utilities using theequation U = 1 – DU.
These steps are illustrated for a randomly cho-sen health state in Figure A1.
Endnotes
1. TTO and SG techniques are described inTorrance (1986) and Richardson (1991). TheTTO quantifies preferences by asking the num-ber of years (of a given maximum) whichwould be sacrificed by an individual to be inbest health rather than in the health state beingmeasured. The SG is similar but uses the prob-ability of death rather than the number of yearssacrificed as the device for eliciting prefer-ences.
2. In principle every health state may be indi-vidually measured. In practice, the number ofhealth states in the descriptive system is nor-mally so large that this is infeasible. The onlyexample of this approach is the original Rosser
Figure A1 Calculating a Utility Score: A Numerical Example
1. Complete the AQoL questionnaire to obtain 20 response levels; 1 per item
Example: Response levels are:
D1(1, 1, 2, 1); D2(2, 2, 1); D3(3, 2, 3, 1); D4(1, 1, 1); D5(2, 1, 1); D6(2, 1, 2)
2. Read the 20 disutility scores DU from Table 4
D1(0, 0, 0.04, 0); D2(0.07,0.19, 0); D3(0.39, 0.14, 0.33, 0); D4(0, 0, 0); D5(0.13, 0, 0); D6(0.03, 0, 0.19)
3. Convert to utilities U = 1 – DU
D1(1.0, 1.0, 0.96, 1.0); D2(0.93, 0.81, 1.0); D3(0.61, 0.86, 0.67, 1.0)D4(1.0, 1.0, 1.0); D5(0.87, 1.0, 1.0); D6(0.97, 1.0, 0.81)
4. Enter the 20 utility scores into the relevant equation in Figure 5 and calculate dimension scores
Dimension utilities
U1 = 1.02i{[0.62 + 0.38(1.0)][0.42 + 0.58(1.0)][0.38 + 0.62(0.96)][0.22 + 0.78(1.0)]} – 0.02 = 0.975
U2 = 1.08i{[0.41 + 0.59(0.93)][0.36 + 0.64(0.81)][0.53 + 0.47(1.0)]} – 0.08 = 0.829
U3 = 1.02i{[0.37 + 0.63(0.61)][0.42 + 0.58(0.86)][0.36 + 0.64(0.67)][0.30 + 0.70(1.0)]} – 0.02 = 0.54
U4 = 1.08i{[0.61 + 0.39(1.0)][0.41 + 0.59(1.0)][0.28 + 0.72(1.0)]} – 0.08 = 1.00
U5 = 1.04i{[0.39 + 0.61(0.87)][0.26 + 0.74(1.0)][0.37 + 0.63(1.0)]} – 0.04 = 0.918
U6 = 1.18i{[0.51 + 0.49(0.97)][0.61 + 0.39(1.0)][0.49 + 0.51(0.8)]} – 0.18 = 0.864
5. Enter the six dimension scores into the AQoL formula in Figure 5 and calculate the health state utility
Health state utility
= 1.17{[0.546 + 0.454(0.975)][0.566 + 0.434(0.829)][0.537 + 0.463(0.54)] [0.662 + 0.338(1.0)][0.430 + 0.570(0.918)][0.382 + 0.618(0.864)]} – 0.17 = 0.569U AQoL

86 The Australian Economic Review March 2004
2004 The University of Melbourne, Melbourne Institute of Applied Economic and Social Research
Kind Index which is now seldom used becauseof its limited sensitivity.
3. These three approaches have been used re-spectively to construct the EQ5D (EuroQoL)(Williams 1995), the Quality of Wellbeing(QWB) (Kaplan et al. 1996), the 15D (Sin-tonen and Pekurinen 1993), the Health UtilitiesIndex (HUI) 1–3 (Feeny, Torrance and Fur-long 1996), and AQoL 1 (Hawthorne et al.1997).
4. See Richardson (1994) for a critique of therating scale as a method for eliciting utility val-ues. In recent literature the rating scale hasbeen largely abandoned in this context.
5. We are grateful to an anonymous reviewerfor drawing our attention to this reference.
6. There is a long list of such contentious is-sues. For example, there is a clear preference inthe literature for eliciting utilities from the gen-eral population. It is, however, possible toargue that it is the preferences of patients or po-tential patients which should be elicited. Thisethical question and numerous others are re-viewed in Brazier et al. (1999).
7. The initial instrument consisted of 15 suchitems but the three items describing ‘illness’were removed as a result of the validationstudy.
8. This problem is distinct from the issue of ad-aptation which occurs when people alter theirlives, their expectations or their values in a waywhich accommodates their poor health states.This issue is highly contentious and includes,inter alia, the question of whose preferencesshould be elicited, the general public, un-adapted patients or patients following adapta-tion. As with all MAU instruments, AQoL 1and AQoL 2 employed the preferences of thegeneral public. It is likely that different resultswould be obtained for all instruments (andother utility studies) if post-adaptation prefer-ences of patients were adopted. This issue isoutside the scope of the present article but isdiscussed more fully in Menzel et al. (2002).
9. It is possible for a number of health states toindependently impact catastrophically uponthe QoL. For example, intense pain and intensedepression may both reduce the QoL to zero.This cannot be described in a simple additivemodel where importance weights must sum tounity and, consequently, the importanceweights on depression and upon pain must benumerically small. In contrast, the multiplica-tive model permits any dimension to reduceQoL to a level equivalent to death.
10. The Chi-squared value for the model is460.73 with 164 degrees of freedom. The asso-ciated probability is close to zero, indicatingthat, according to the Chi-squared test, ourmodel is very unlikely to represent the exactvalue of the data. However, the Chi-squared isrecognised as a misleading statistic in this con-text as the hypothesis of interest is that themodel is a good (if not perfect) fit. Thus, as thesample size increases, the probability that themodel is a perfect fit decreases for any value ofthe Chi-squared. An analogy is to consider therelationship Y = 0.99X which models the truerelationship Y = X. With a sufficient samplesize we could reject with any level of confi-dence the hypothesis that Y = X but the model,nevertheless, provides a very good approxima-tion. This limitation on the Chi-squared mea-sure is documented in the literature and is notedin the LISREL program documentation whereit is stated that ‘since Chi-squared N – 1 timesthe minimum value of the fit function, Chi-squared tends to be large in large samples if themodel does not hold. A number of goodness offit measures have been proposed to eliminateor reduce its dependence on sample size’ (LIS-REL Help File, Goodness of Fit Indices).
11. Negative TTO scores are obtained by offer-ing the option of immediate death or the healthstate of interest for n years followed by fullhealth for the remainder of the person’s life. Ifdeath is preferred the implied value of thehealth state is negative. Calculating disutilitiesfrom these results is problematical as there isno lower limit to the implied negative ‘utility’.The problem is discussed in Richardson andHawthorne (2001).

Richardson et al.: Measurement of the Quality of Life 87
2004 The University of Melbourne, Melbourne Institute of Applied Economic and Social Research
References
Brazier, J., Deverill, M., Green, C., Harper, R.and Booth, A. 1999, ‘A review of the use ofhealth status measures in economic evalua-tion’, Health Technology Assessment, vol. 3,no. 9, pp. 1–154.
Carr-Hill, R. A. 1992, ‘Health related qualityof life measurement—Euro style’, HealthPolicy, vol. 20, pp. 321–8.
Cook, T. D. and Campbell, D. T. 1978, Quasi-Experimentation: Design and Analysis Issuesfor Field Settings, Houghton Miffin, Boston.
Cronbach, J. and Meehl, P. 1955, ‘Constructvalidity in psychological tests’, Psychologi-cal Bulletin, vol. 52, pp. 281–302.
Feeny, D., Torrance, G. and Furlong, W. 1996,‘Health Utilities Index’, in Quality of Lifeand Pharmacoeconomics in Clinical Trials,ed. B. Spilker, Lippincott Raven Publishers,Philadelphia.
Furlong, W., Feeny, D., Torrance, G. et al.1998, ‘Multiplicative multi-attribute utilityfunction for the Health Utilities Index Mark3 (HUI3) system: A technical report’, Work-ing Paper 98-11, Centre for Health Econom-ics and Policy Analysis, Hamilton McMasterUniversity.
Hawthorne, G., Richardson, J. and Day, N. A.2001, ‘A comparison of the Assessment ofQuality of Life (AQoL) with four other ge-neric utility instruments’, Annals of Medi-cine, vol. 33, pp. 358–70.
Hawthorne, G., Richardson, J., Osborne, R.and McNeil, H. 1997, ‘The Assessment ofQuality of Life (AQoL) instrument: Con-struction, initial validation and utility scal-ing’, Working Paper 76, Centre for HealthProgram Evaluation, Monash University.
Hogan, A., Hawthorne, G., Kethel, L. et al.2001, ‘Health-related quality-of-life out-comes from adult cochlear implantation: Across-sectional survey’, Cochlear ImplantsInternational, vol. 2, pp. 115–28.
Kaplan, R., Ganiats, T., Sieber, W. and Ander-son, J. P. 1996, ‘The quality of wellbeingscale’, Medical Outcomes Trust Bulletin,vol. 4, pp. 2–3.
Menzel, P., Dolan, P., Richardson, J. andOlsen, J. A. 2002, ‘The role of adaptation to
disability and disease in health state valua-tion: A preliminary normative analysis’, So-cial Science and Medicine, vol. 55, pp.2149–58.
Murray, C. and Lopez, A. 1996, The GlobalBurden of Disease, Harvard School of PublicHealth on behalf of World Health Organiza-tion and World Bank, Cambridge, Massa-chusetts.
Nord, E. 1999, Cost Value Analysis, Cam-bridge University Press, Cambridge.
Nord, E., Pinto, J.-L., Richardson, J., Menzel,P. and Ubel, P. 1999, ‘Incorporating societalconcerns for fairness in numerical valuationsof health programmes’, Health Economics,vol. 8, pp. 25–39.
Nord, E., Richardson, J. and Macarounas-Kirchmann, K. 1993, ‘Social evaluation ofhealth care versus personal evaluation ofhealth states: Evidence on the validity of fourhealth-state scaling instruments using Nor-wegian and Australian survey data’, Interna-tional Journal of Technology Assessment inHealth Care, vol. 9, pp. 463–78.
Osborne, R. H., Hawthorne, G., Lew, E. A. andGray, L. C. 2003, ‘Quality of life assessmentin the community-dwelling elderly: Valida-tion of the Assessment of Quality of Life(AQoL) instrument and comparison with theSF-36’, Journal of Clinical Epidemiology,vol. 56, pp. 138–47.
Peacock, S., Richardson, J., Hawthorne, G.,Day, N. A. and Iezzi, A. 2003, ‘The Assess-ment of Quality of Life (AQoL) 2 instru-ment: The effect of deliberation andalternative utility weights in a multi attributeutility instrument’, Working Paper 143,Health Economics Unit, Monash University,<http://heu.buseco.monash.edu.au>.
Richardson, J. 1991, ‘Economic assessment ofhealth care: Theory in practice’, AustralianEconomic Review, 1st quarter, pp. 4–21.
Richardson, J. 1994, ‘Cost utility analysis:What should be measured?’, Social Scienceand Medicine, vol. 39, pp. 7–21.
Richardson, J. 2002, ‘The conceptual basis forsummary measures of population health:Qualifying DALYs; dallying with QALYs’,in Summary Measures of PopulationHealth: Concepts, Ethics, Measurement and

88 The Australian Economic Review March 2004
2004 The University of Melbourne, Melbourne Institute of Applied Economic and Social Research
Applications, eds C. J. L. Murray, J. A.Salomon, C. D. Mathers and A. D. Lopez,World Health Organization, Geneva.
Richardson, J. and Hawthorne, G. 2001, ‘Neg-ative utility scores and evaluating the AQoLall worst health state’, Working Paper 113,Centre for Health Program Evaluation, Mo-nash University.
Richardson, J., Hawthorne, G., Day, N. A.,Peacock, S. and Iezzi, A. 2003a, ‘The As-sessment of Quality of Life (AQoL) II instru-ment: Conceptualising the Assessment ofQuality of Life instrument Mark 2 (AQoL 2)methodological innovations and the devel-opment of the AQoL descriptive system’,Working Paper 141, Health Economics Unit,Monash University, <http://heu.buseco.mo-nash.edu.au>.
Richardson, J., Peacock, S., Day, N. A., Haw-thorne, G. and Iezzi, A. 2003b, ‘The As-sessment of Quality of Life (AQoL) 2instrument: Derivation of the scaling weightsusing a multiplicative model and economet-ric second stage correction’, Working Paper142, Health Economics Unit, Monash Uni-versity, <http://heu.buseco.monash.edu.au>.
Richardson, J., Peacock, S., Hawthorne, G.,Day, N. A. and Iezzi, A. 2003c, ‘The Assess-ment of Quality of Life (AQoL) 2 instrument:Overview of the Assessment of Quality ofLife Mark 2 project’, Working Paper 144,Health Economics Unit, Monash University,<http://heu.buseco.monash.edu.au>.
Shiell, A., Seymour, J., Hawe, P. and Cameron,S. 2000. ‘Are preferences over health states
complete?’, Health Economics, vol. 9, pp.47–55.
Sintonen, H. and Pekurinen, M. 1993, ‘A fif-teen dimensional measure of health relatedquality of life (15D) and its applications’, inQuality of Life Assessment, eds S. Walkerand R. Rosser, Kluwer Academic Publishers,Dordrecht.
Sturm, J. W., Osborne, R. H., Dewey, H. M.,Donnan, G. A., Macdonell, R. A. L. andThrift, A. G. 2002, ‘Brief comprehensivequality of life assessment after stroke: TheAssessment of Quality of Life instrument inthe North East Melbourne Stroke IncidenceStudy (NEMESIS)’, Stroke, vol. 33, pp.2888–94.
Torrance, G. 1986, ‘Measurement of healthstate utilities for economic appraisal: A re-view’, Journal of Health Economics, vol. 5,pp. 1–30.
Ubel, P. A., Loewenstein, G., Hershey, J.,Baron, J., Mohr, T., Asch, D. A. and Jepson,C. 2001, ‘Do nonpatients underestimate thequality of life associated with chronic healthconditions because of a focusing illusion?’,Medical Decision Making, vol. 21, pp. 190–9.
Von Winterfeldt, D. V. and Edwards, W. 1986,Decision Analysis and Behavioural Re-search, Cambridge University Press, Cam-bridge.
Williams, A. 1995, ‘The measurement and val-idation of health: A chronicle’, DiscussionPaper 136, Centre for Health Economics,University of York.