measurement of the length and strength of adhesive
TRANSCRIPT
FULL P
APER
© 2015 WILEY-VCH Verlag GmbH & Co. KGaA, Weinheim (1 of 11) 1400547wileyonlinelibrary.com
Measurement of the Length and Strength of Adhesive Interactions in a Nanoscale Silicon–Diamond Interface
Tevis D. B. Jacobs ,* Joel A. Lefever , and Robert W. Carpick*
Prof. T. D. B. Jacobs 538-E Benedum Hall 3700 O’Hara St , Pittsburgh , PA 15208 , USA E-mail: [email protected] J. A. Lefever 3231 Walnut St. , Philadelphia , PA 19104 , USA Prof. R. W. Carpick 229 Towne Bldg 220 S. 33 rd St. , Philadelphia , PA 19104 , USA E-mail: [email protected]
DOI: 10.1002/admi.201400547
the interaction (characterized by the range of adhesion z 0 ).
The intrinsic work of adhesion W adh is the energy per unit area required to sepa-rate two planar surfaces from equilibrium contact to infi nite separation. In terms of surface energy (γ i of surface i ) and inter-facial energy (γ ij between surfaces i and j ), the work of adhesion is calculated as follows:
adhW i j ijγ γ γ( )= + − (1)
In accordance with prior literature on adhesion and roughness, [ 9 ] the intrinsic work of adhesion W adh,int is defi ned as the work of adhesion between two per-fectly fl at, planar surfaces. While W adh,int is a continuum concept, it can be robustly mapped onto an atomistic description of two atomically fl at, single-crystal surfaces in contact. The effective work of adhesion, W adh,eff , is defi ned as the work of adhesion for the same material pair and the same
global geometry (planar), but with the addition of local surface roughness on one or both surfaces. The distinction between W adh,int and W adh,eff is shown schematically in Figure 1 . The W adh,int is determined by the identity of the materials in contact, and the environment, whereas W adh,eff is a function of W adh,int and the local surface topography. For hard, non-conforming materials, W adh,eff is typically much smaller than W adh,int . The primary reason for this is that the roughness increases the effective separation between the two materials, and therefore signifi cantly increases γ ij between the materials as they can no longer make intimate contact. Roughness can also increase the surface energies γ i and γ j , but this effect is typically over-whelmed by the change in γ ij . This distinction is drawn because many experimental techniques exist to measure W adh,eff (for example, using microfabricated beam tests [ 10 ] ), but generally applicable techniques to deduce from this the W adh,int are not well established.
Physically, z 0 describes the equilibrium separation distance between perfectly fl at surfaces, i.e., the separation distance at which their interaction force is zero. However, in many math-ematical descriptions of adhesion (for instance, refs. [ 5,7,8,11 ] ) z 0 also scales the distance over which adhesion acts for a par-ticular material. Therefore, the parameter z 0 is referred to in this paper as the “range of adhesion,” (in accordance with Greenwood, [ 5 ] who calls it the “range of action of the surface forces”).
The adhesive interactions between nanoscale silicon atomic force microscope (AFM) probes and a diamond substrate are characterized using in situ adhe-sion tests inside of a transmission electron microscope (TEM). In particular, measurements are presented both for the strength of the adhesion acting between the two materials (characterized by the intrinsic work of adhesion W adh,int ) and for the length scale of the interaction (described by the range of adhesion z 0 ). These values are calculated using a novel analysis technique that requires measurement of the AFM probe geometry, the adhesive force, and the position where the snap-in instability occurs. Values of W adh = 0.66 J m −2 and z 0 = 0.25 nm are extracted using this technique. This value of work of adhesion is 70% higher than the work of adhesion calculated if one uses a conventional paraboloidal asperity model. Comparing to literature, the work of adhesion obtained using the new method is signifi cantly higher than most experimental and simulation values for similar material pairs. The discrepancy is attributed to nanoscale roughness, which was not accounted for previously. Furthermore, the value of the range of adhesion is comparable to previously reported values, but is signifi cantly larger than the commonly assumed value of the interatomic spacing.
1. Introduction
Accurate characterization of adhesion is critical for the design and commercial use of nanoscale devices. [ 1 ] It is also needed to understand the relationship between surface chemistry and adhesion, i.e., without the complicating effects of roughness. Fortunately, well-established adhesion models [ 2,3 ] exist to pre-dict adhesive forces for arbitrary geometries. However, even for effectively rigid bodies, these models require knowledge of the intrinsic parameters governing the adhesive interaction in addition to the geometry of the bodies. In the common, two-variable descriptions of adhesion, [ 4–8 ] these parameters are the strength of the adhesive interaction (characterized by the intrinsic work of adhesion W adh,int, ) and the length scale of
Adv. Mater. Interfaces 2015, 2, 1400547
www.advmatinterfaces.dewww.MaterialsViews.com

FULL
PAPER
© 2015 WILEY-VCH Verlag GmbH & Co. KGaA, Weinheimwileyonlinelibrary.com1400547 (2 of 11)
In previous reports (for example [ 12 ] ) simplifying assump-tions—such as simple geometries, or an estimated value of z 0 —are required in order to analyze adhesion using continuum models. In other cases, geometry-dependent tip/sample interac-tion parameters can be determined. For example, one can use conventional AFM where snap-in can be avoided (i.e. for suffi -ciently weak adhesion and/or suffi ciently stiff cantilevers, thus requiring extremely high sensitivity [13] ). Alternately, dynamic AFM modes [14–16] or force-feedback instrumentation can be used. [16–19] However even with such techniques, without knowl-edge of the tip geometry, only effective parameters can be deter-mined. We have developed a technique, the Snap-in/pull-off Numerical Adhesion Parameter (SNAP) method, in which AFM-like adhesion tests are performed using tips of precharacterized geometry. This allows simultaneous extraction of both W adh,int and z 0 ; the technique is summarized in the methods section—technical details can be found elsewhere. [ 20 ]
In the present paper, this technique is applied to silicon AFM probes (with native oxide) in contact with a fl at single-crystal diamond punch in order to measure W adh,int and z 0 for this interface. Silicon is widely used for microscopy and device applications. Ultra-hard, diamond-like materials are emerging as solutions to reduce friction, adhesion, and wear of the same components. [ 21 ] Therefore, interfaces between these two mate-rials have signifi cant technological relevance.
We fi rst review many of the important prior investigations into nano- and microscale adhesion, which report values for the work of adhesion W adh of two contacting surfaces. We organize these prior investigations into two broad categories: measure-ments performed on nominally planar interfaces using micro-fabricated devices/surfaces; and measurements performed using nonplanar, single-asperity contacts.
Several signifi cant adhesion investigations have been per-formed, primarily on silicon, using techniques and materials from the semiconductor and microfabrication industry, such as microfabricated cantilever beams [ 10,22 ] and direct wafer bonding. [ 23 ] These studies used micro- and macroscale devices to perform experiments, and analyzed results using well-established elasticity and fracture mechanics theories. In these analyses, the contacting surfaces were treated as fl at, and meas-urements were made of the energy per unit of nominal contact area required to separate them. For self-mated silicon inter-faces, these studies report effective work of adhesion values in the range of W adh,eff = 0.010–0.250 J m −2 , [ 24,25 ] and demonstrate the signifi cant effect of surface chemistry, surface roughness, and ambient environment.
As mentioned, the present article follows the convention of Persson [ 26 ] and designates values measured on rough sur-faces as effective works of adhesion W adh,eff , distinct from the intrinsic work of adhesion W adh,int , which is the value used in continuum models, which would be measured on perfectly fl at surfaces composed of the same material pair. This distinction is illustrated by delRio et al. [ 22 ] The authors performed a micrometer-scale cantilever beam experiment, with additional characterization of the nanoscale surface topography of both contacting surfaces using atomic force microscopy. The con-tacting materials (silicon beams coated with a low-adhesion fl u-orocarbon monolayer in contact with a silicon substrate with a native oxide) were estimated to have an intrinsic work of adhe-sion of approximately 33 mJ m −2 , but an effective work of adhe-sion for the whole cantilever beam of less than 0.010 mJ m −2 . This large difference arises because of the roughness of the interfaces, which reduces the average separation of the two bodies, and thus signifi cantly reduces the interfacial energy γ 12 of their contact. This illustrates a limitation of the above meas-urements of W adh,eff , as they depend sensitively on the exact geometry and fi nal roughness of the surfaces in contact. There-fore, results cannot be easily generalized from one contacting interface to another.
A second category of adhesion investigations uses nanoscale, single asperity contacts, and attempts to extract the intrinsic work of adhesion W adh,int . This quantity is the correct one for use in continuum contact models [ 4–6,8,27,28 ] as well as in rough-ness models. [ 26,29,30 ] The investigations in this second category have employed the atomic force microscope (AFM), [ 8,12,31–34 ] the related interfacial force microscope (IFM), [ 35 ] and the sur-face forces apparatus (SFA) [ 36,37 ] to conduct adhesion tests with high-force resolution using a single-asperity contact, typically on the nanometer length scale. Since these are not fl at sur-faces, a value for work of adhesion requires using a contact mechanics model to fi t the data. By applying certain assump-tions, the work of adhesion can be extracted. For example, Grierson [ 31 ] describes a general method for extracting work of adhesion from AFM pull-off force data, and the authors go on to measure work of adhesion values for silicon tips on silicon substrates. Other researchers [ 12,32,33 ] applied similar techniques with silicon- and/or carbon-based interfaces. Burnham [ 34 ] car-ried out extensive pull-off force measurements between silicon AFM tips and silicon substrates and analyzed results using a related approach. In another study, the IFM was used to study a silicon/silicon interface under a variety of conditions. [ 35 ] Results varied widely between different tests, even for similar
Adv. Mater. Interfaces 2015, 2, 1400547
www.advmatinterfaces.de www.MaterialsViews.com
Figure 1. Intrinsic and effective works of adhesion can differ signifi cantly. a,b) A micro/macroscopic adhesion test typically measures an effective value, due to roughness of the contact. c) The intrinsic work of adhesion describes contact between perfectly fl at surfaces and is therefore determined solely by the materials in contact.
FULL P
APER
© 2015 WILEY-VCH Verlag GmbH & Co. KGaA, Weinheim (3 of 11) 1400547wileyonlinelibrary.com
conditions. For instance, for self-mated silicon interfaces (with a native oxide) in air, work of adhesion values were reported to range from [ 32 ] 0.040 J m −2 up to [ 12 ] 0.83 J m −2 —likely due to differences in roughness and surface preparation. Quantitative results from each of the above studies, and from related molec-ular dynamics simulations, are presented in the Discussion section. A limitation of all of the above measurements is that the sharp tip is assumed to be a paraboloid, as required by typ-ical contact mechanics models (DMT, JKR, Maugis), [ 4,27,28 ] but the detailed geometry and roughness of the nanoscale tip are unknown.
More recently, adhesion tests have been performed using tips that have been precharacterized using transmission elec-tron microscope (TEM). [ 8,38–42 ] Such investigations enable more accurate application of contact mechanics models, especially characterizing the probe apexes and then modeling them as paraboloidal [ 40,41 ] or higher-order power-law [ 8 ] geometries, or as shapes with nanometer- and Ångström-scale roughness. [ 42 ] These investigations alleviated the need for some of the geo-metric assumptions of previous studies, and demonstrated how probe shapes can change with sliding [ 8,40,41 ] and the strong effect of roughness on apparent measurements of work of adhesion W adh,eff . [ 42 ] However, a signifi cant remaining limi-tation of these investigations is the need to assume a certain value for the range of adhesion z 0 .
While many detailed investigations of adhesion have been carried out, values for the range of adhesive interactions have
not been well characterized. Several studies have estimated a value using order-of-magnitude arguments, then used this esti-mated value to accurately fi t experimental data. [ 7,43–47 ] Values have ranged from 0.1 up to 4–5 nm for a variety of materials, as described in more detail in the Discussion section. However, none of these techniques enable a robust method for extracting reliable values for both z 0 and W adh,int . The present technique (the SNAP method, described in the methods section) is used to accomplish this.
2. Results of In Situ Adhesion Testing, and Extracting Adhesion Parameters
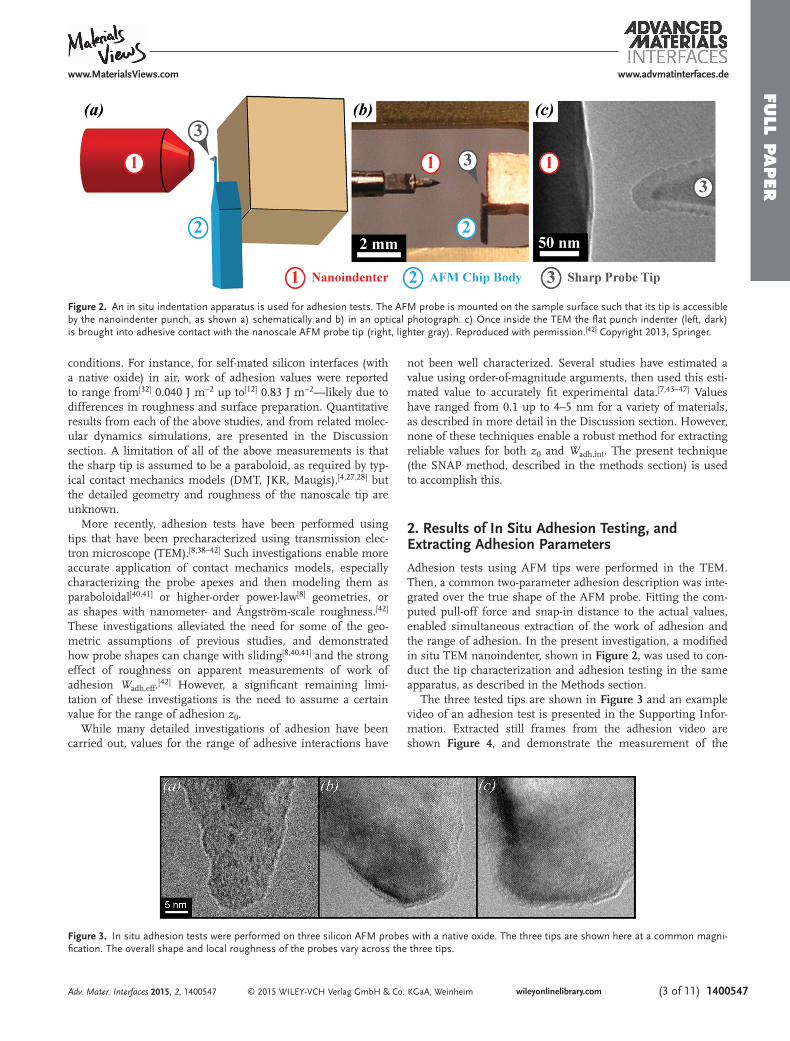
Adhesion tests using AFM tips were performed in the TEM. Then, a common two-parameter adhesion description was inte-grated over the true shape of the AFM probe. Fitting the com-puted pull-off force and snap-in distance to the actual values, enabled simultaneous extraction of the work of adhesion and the range of adhesion. In the present investigation, a modifi ed in situ TEM nanoindenter, shown in Figure 2 , was used to con-duct the tip characterization and adhesion testing in the same apparatus, as described in the Methods section.
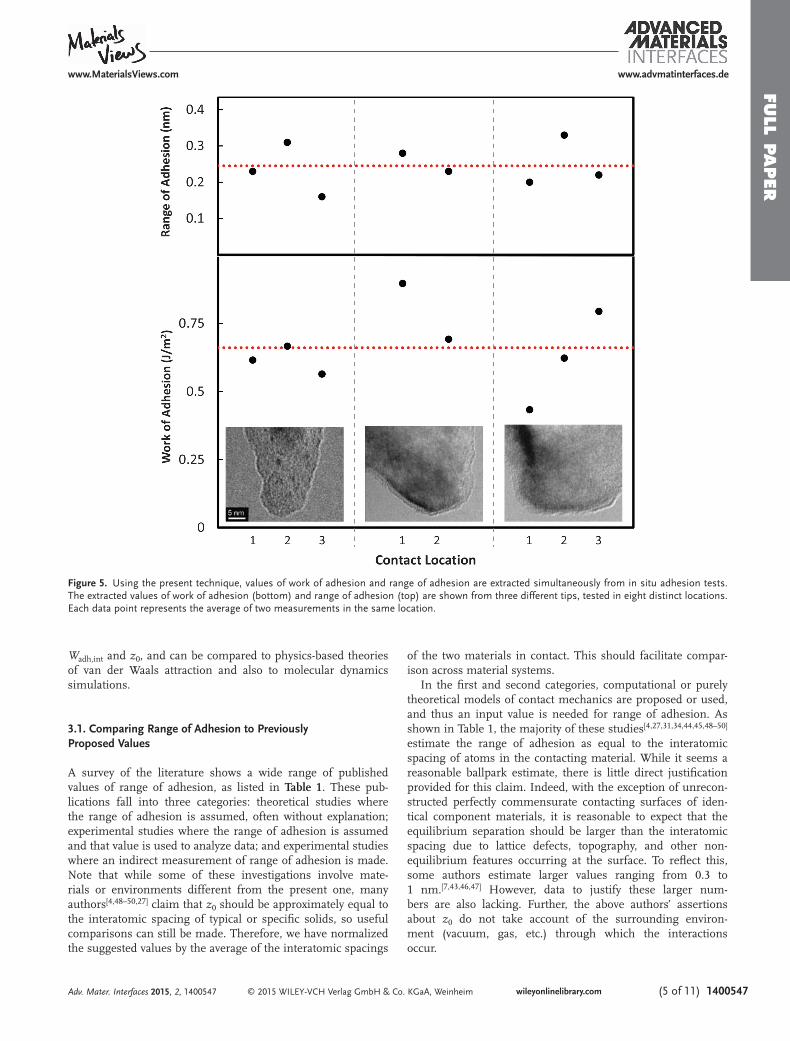
The three tested tips are shown in Figure 3 and an example video of an adhesion test is presented in the Supporting Infor-mation. Extracted still frames from the adhesion video are shown Figure 4 , and demonstrate the measurement of the
Adv. Mater. Interfaces 2015, 2, 1400547
www.advmatinterfaces.dewww.MaterialsViews.com
Figure 2. An in situ indentation apparatus is used for adhesion tests. The AFM probe is mounted on the sample surface such that its tip is accessible by the nanoindenter punch, as shown a) schematically and b) in an optical photograph. c) Once inside the TEM the fl at punch indenter (left, dark) is brought into adhesive contact with the nanoscale AFM probe tip (right, lighter gray). Reproduced with permission. [ 42 ] Copyright 2013, Springer.
Figure 3. In situ adhesion tests were performed on three silicon AFM probes with a native oxide. The three tips are shown here at a common magni-fi cation. The overall shape and local roughness of the probes vary across the three tips.

FULL
PAPER
© 2015 WILEY-VCH Verlag GmbH & Co. KGaA, Weinheimwileyonlinelibrary.com1400547 (4 of 11)
snap-in distance d snap-in and the pull-off force F pull-off . From these and the measured tip geometry, W adh,int and z 0 were extracted using the SNAP method.
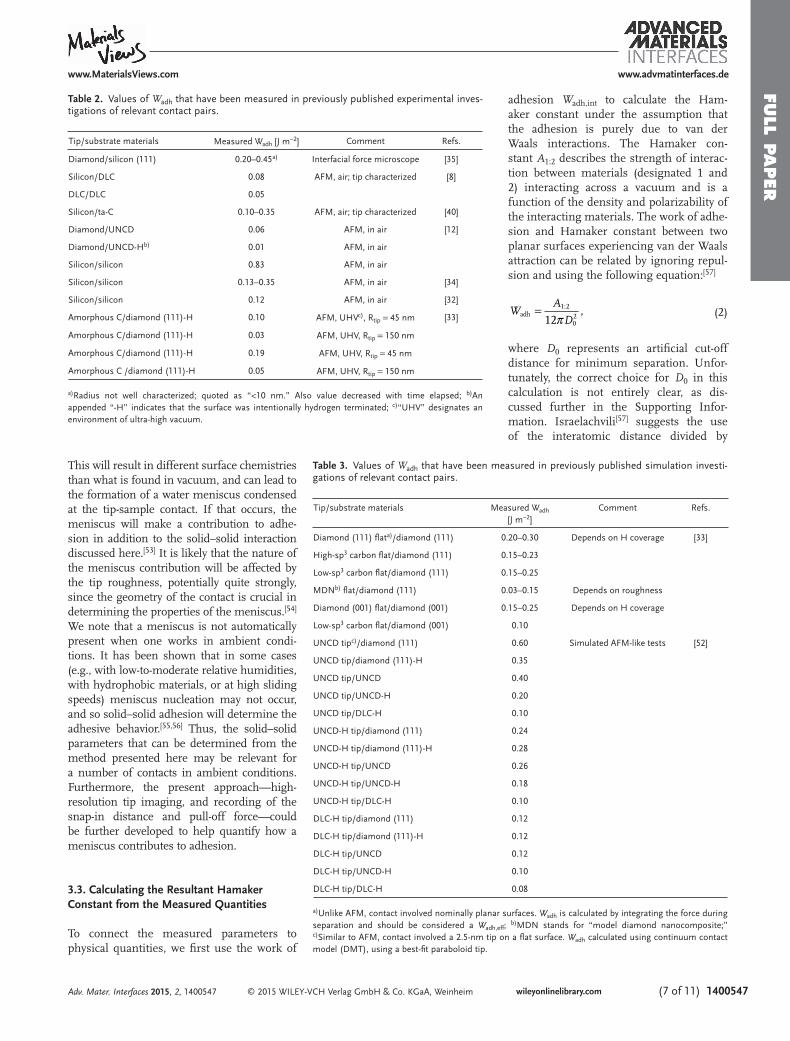
Three different nanoscale tips were used in adhesion tests inside the TEM; the probes are shown in their pre-test confi gu-rations in Figure 3 . For every tip, adhesion tests were performed in at least two distinct locations on the diamond punch to average out effects of local topography and/or variations in the surface chemistry of the punch. For each location, the tips were imaged before the adhesion tests, and then two adhesion tests were performed. Every pull-off test was captured with real-time video such that the magnitude of the snap-in and pull-off events could be measured during post-processing, as described in the Methods section. Extracted values from the adhesion tests at each location are shown in Figure 5 . Taken together, the aver-aged values for silicon (with a native oxide) interacting with dia-mond are W adh,int = 0.66 ± 0.14 J m −2 and z 0 = 0.25 ± 0.06 nm.
The scatter that exists in the data can be attributed to the intrinsic variability of adhesion that occurs even on a per-fect diamond (111) single-crystal surface depending on the alignment of the tip and sample atoms. For example, Piotrowski et al. [ 33 ] found in atomistic simulations that changing the relative position of two defect-free H-terminated diamond (111) surfaces could lead to 60%–70% changes in the apparent work of adhesion. The scatter may also be due to heterogeneity in the nanoscale topography or composition of the diamond counter surface. To investigate these possi-bilities further, the surface of the punch was characterized ex situ using AFM and is smooth relative to the sharp tips (RMS roughness of 0.091 nm over a 100 × 100 nm 2 area, as shown in the Supporting Information). However, the fl at-punch
substrate was not electron transparent and therefore local variations could not be resolved in the TEM. Although the diamond punch was cleaned, with the fi nal step involving exposure to a H plasma, it is possible that the degree of hydrogentation may vary locally. Even with this variability, the measurements are a fundamental improvement over those acquired using conventional techniques (such as the applica-tion of spherical contact mechanics), where the roughness is neither measured nor accounted for on either side of the con-tact. By contrast, knowledge of the Ångstrom-scale tip topog-raphy in the present technique enables measurements that can be more meaningfully compared with atomistic models such as those in ref. [ 33 ] . Furthermore, and very importantly, despite the scatter the results are meaningfully different from many previously published values as discussed in the following section. While future experiments can incorpo-rate electron transparency of the substrate to account more directly for sample roughness, the present measurements rep-resent a signifi cant advance towards fundamental, predictive adhesion parameters.
3. Discussion
The present experimental results are compared to previously published values for range of adhesion and for work of adhe-sion. Then, the present measurements are used to calculate values for underlying atomic-scale interactions: the Hamaker constant and the parameters for an interatomic Lennard–Jones interaction. The Hamaker constant and interatomic Lennard–Jones interactions have more direct physical interpretation than
Adv. Mater. Interfaces 2015, 2, 1400547
www.advmatinterfaces.de www.MaterialsViews.com
Figure 4. Still images are captured from the video for analysis. Here, the tip is shown a) immediately before snap-in and b) immediately after. c) Red- and green-colored traces of the two positions indicate the relative motion. Likewise, video frames are shown d) before and e) after pull-off, with the difference indicated in (f). From this distance, the pull-off force can be calculated. Note that (e–f) are shown approximately 2 s after the pull-off event, to allow the tip to stabilize for a clear image. Images (a–c) and (d–f), respectively, are at a common magnifi cation.
FULL P
APER
© 2015 WILEY-VCH Verlag GmbH & Co. KGaA, Weinheim (5 of 11) 1400547wileyonlinelibrary.com
W adh,int and z 0 , and can be compared to physics-based theories of van der Waals attraction and also to molecular dynamics simulations.
3.1. Comparing Range of Adhesion to Previously Proposed Values
A survey of the literature shows a wide range of published values of range of adhesion, as listed in Table 1 . These pub-lications fall into three categories: theoretical studies where the range of adhesion is assumed, often without explanation; experimental studies where the range of adhesion is assumed and that value is used to analyze data; and experimental studies where an indirect measurement of range of adhesion is made. Note that while some of these investigations involve mate-rials or environments different from the present one, many authors [ 4,48–50,27 ] claim that z 0 should be approximately equal to the interatomic spacing of typical or specifi c solids, so useful comparisons can still be made. Therefore, we have normalized the suggested values by the average of the interatomic spacings
of the two materials in contact. This should facilitate compar-ison across material systems.
In the fi rst and second categories, computational or purely theoretical models of contact mechanics are proposed or used, and thus an input value is needed for range of adhesion. As shown in Table 1 , the majority of these studies [ 4,27,31,34,44,45,48–50 ] estimate the range of adhesion as equal to the interatomic spacing of atoms in the contacting material. While it seems a reasonable ballpark estimate, there is little direct justifi cation provided for this claim. Indeed, with the exception of unrecon-structed perfectly commensurate contacting surfaces of iden-tical component materials, it is reasonable to expect that the equilibrium separation should be larger than the interatomic spacing due to lattice defects, topography, and other non-equilibrium features occurring at the surface. To refl ect this, some authors estimate larger values ranging from 0.3 to 1 nm. [ 7,43,46,47 ] However, data to justify these larger num-bers are also lacking. Further, the above authors’ assertions about z 0 do not take account of the surrounding environ-ment (vacuum, gas, etc.) through which the interactions occur.
Adv. Mater. Interfaces 2015, 2, 1400547
www.advmatinterfaces.dewww.MaterialsViews.com
Figure 5. Using the present technique, values of work of adhesion and range of adhesion are extracted simultaneously from in situ adhesion tests. The extracted values of work of adhesion (bottom) and range of adhesion (top) are shown from three different tips, tested in eight distinct locations. Each data point represents the average of two measurements in the same location.

FULL
PAPER
© 2015 WILEY-VCH Verlag GmbH & Co. KGaA, Weinheimwileyonlinelibrary.com1400547 (6 of 11)
The experimentally determined values in the present study do not support the common assumption that z 0 should be equal to atomic spacing. The interatomic spacings of the component materials are 0.154 nm for single-crystal diamond, 0.234 nm in silicon, and approximately 0.163 nm (the Si O bond length) for silicon oxide. The measured value of z 0 = 0.25 ± 0.06 nm is larger than all of these values and larger than the average inter-atomic spacing of the surface materials (0.16 nm is the average of bond length in the diamond and the silicon oxide, 0.18 nm is the arithmetic mean of all three materials).
Only one study [ 8 ] was found that falls into the third category, in which an indirect measurement was made of the range of adhe-sion. Here, the authors perform wear studies on an AFM probe, with periodic measurements of the adhesive force and the probe shape. The probes are initially approximated as paraboloidal, and thus a work of adhesion can be calculated directly from the adhesive force without knowledge of range of adhesion. [ 4 ] As the probes wear, they are fi t with power-law geometries–for which the adhesive force depends on both work of adhesion and range of adhesion. Here, the work of adhesion is assumed to maintain its pre-wear value throughout the wear test, and then the range of adhesion can be directly calculated. The authors use this method to calculate a range of adhesion of 4–5 nm. In these experiments, the work of adhesion may be changing over the course of a wear test due to changes in surface topography or surface chemistry, so the assumption that it is constant may not be perfectly valid. Further, Grierson et al. attribute the large adhesion range value to either longer-range forces such as capillary action (the investi-gation was conducted in air) or to surface roughness that is not accounted for in the power law fi tting. Also, differences in the properties of the contact materials (density, polarizability, surface topography, and surface contamination) will also have an effect on van der Waals adhesion.
3.2. Comparing Work of Adhesion to Previ-ously Proposed Values
Values of work of adhesion have been far more widely reported than values of z 0 ; therefore there is a larger body of literature for comparison. While few investigations have directly measured the work of adhesion between a silicon tip and a diamond surface, there have been many prior reports of work of adhesion of related contact pairs: a dia-mond tip on silicon; a silicon tip in contact with ultrananocrystalline diamond (UNCD) or hydrogenated amorphous carbon (a-C:H) (a form of diamond-like carbon); or any of those materials in a self-mated confi gura-tion. While single-crystal diamond contains exclusively sp 3 -hybridized carbon in a dia-mond-cubic packing structure, with some recrystallization and H- or OH-termination on the surface; UNCD is composed of 5–10 nm single-crystal grains, separated by grain boundaries of approximately 0.5 nm thick-ness, which are composed of a mix of sp 2 and sp 3 carbon. [ 51 ] There will be a similar reconstruction and passivation on the sur-
face. Therefore these materials are expected to have similar adhesive interactions, with the biggest difference being sur-face roughness, which is not often accounted for. Hydrogen-ated amorphous carbon contains a higher fraction of sp 2 carbon and therefore will behave differently from single-crystal dia-mond. With regard to dispersion forces specifi cally, [ 52 ] a-C:H has a lower number density of atoms as compared to single-crystal diamond, but the electrical conductivity is much higher, as is the polarizability of atoms. The surface termination and amount of hydrogen on the surface have also been shown to have an effect on work of adhesion. [ 33 ]
Relevant measured results for work of adhesion are shown for experimental investigations in Table 2 and for simulated investigations in Table 3 . Measured values range widely from 0.01 J m −2 (a hydrogen-terminated, self-mated UNCD pair) to 0.83 J m −2 (a self-mated silicon contact pair). While the present result ( W adh,int = 0.66 J m −2 ) lies in that range, it is signifi cantly larger than most reported values from similar materials. This difference is attributed to two factors. First, most (but not all) of the AFM studies were performed in air, where contamination and water adsorption can passivate the surface. Second, none of the previous studies took account of surface roughness, which can cause up to an order of magnitude drop in adhesion (as discussed in ref. [ 42 ] ). When the data from the present study is analyzed under the assumption of parabolic tips (ignoring sur-face roughness) and using a single-asperity contact model (in accordance with most of the studies in Table 2 ), the measured work of adhesion is just 0.38 J m −2 . This highlights the impor-tance of taking surface roughness into account when quantita-tive and predictive values of work of adhesion are needed.
The measurements presented here are acquired in the TEM, where the background pressure is approximately 10 −6 Pa. Many adhesion measurements are conducted in ambient conditions.
Adv. Mater. Interfaces 2015, 2, 1400547
www.advmatinterfaces.de www.MaterialsViews.com
Table 1. Values of z 0 that have been proposed in previously published investigations.
Proposed z 0 [nm]
z 0 /atom spacing a)
Estimated or fi t to data
Materials Refs.
0.16 b) 1 Estimated N/A—generic calculation [4]
0.16 b) 1 Estimated N/A—generic calculation [27]
0.16 b) 1 Estimated N/A—generic calculation [48]
0.16 b) 1 Estimated N/A—generic calculation [49]
0.16 b) 1 Estimated N/A—generic calculation [50]
0.30 N/A Estimated N/A—generic calculation [43]
1.0 N/A Estimated N/A—generic calculation [7]
0.15 0.70 Estimated, used to fi t data Tungsten carbide/diamond [31]
0.165 0.70 Estimated, used to fi t data Silicon/silicon [34]
0.20 0.91 Estimated, used to fi t data Platinum/mica [44]
0.20 0.93 Estimated, used to fi t data Tungsten carbide/diamond [45]
0.30 1.37 Estimated, used to fi t data Glass/platinum [46]
0.30 1.40 Estimated, used to fi t data Silicon/ TiO 2 [47]
4–5 28–34 Indirectly calculated DLC/DLC [8]
a) To enable comparison between different material systems, we normalize by the interatomic spacing. Where two distinct materials are involved, the bond lengths were averaged between them; b) These investi-gations suggest z 0 equal to interatomic spacing; for silicon oxide on diamond, the average of their intera-tomic spacings is 0.16 nm.
FULL P
APER
© 2015 WILEY-VCH Verlag GmbH & Co. KGaA, Weinheim (7 of 11) 1400547wileyonlinelibrary.com
This will result in different surface chemistries than what is found in vacuum, and can lead to the formation of a water meniscus condensed at the tip-sample contact. If that occurs, the meniscus will make a contribution to adhe-sion in addition to the solid–solid interaction discussed here. [ 53 ] It is likely that the nature of the meniscus contribution will be affected by the tip roughness, potentially quite strongly, since the geometry of the contact is crucial in determining the properties of the meniscus. [ 54 ] We note that a meniscus is not automatically present when one works in ambient condi-tions. It has been shown that in some cases (e.g., with low-to-moderate relative humidities, with hydrophobic materials, or at high sliding speeds) meniscus nucleation may not occur, and so solid–solid adhesion will determine the adhesive behavior. [ 55,56 ] Thus, the solid–solid parameters that can be determined from the method presented here may be relevant for a number of contacts in ambient conditions. Furthermore, the present approach—high-resolution tip imaging, and recording of the snap-in distance and pull-off force—could be further developed to help quantify how a meniscus contributes to adhesion.
3.3. Calculating the Resultant Hamaker Constant from the Measured Quantities
To connect the measured parameters to physical quantities, we fi rst use the work of
adhesion W adh,int to calculate the Ham-aker constant under the assumption that the adhesion is purely due to van der Waals interactions. The Hamaker con-stant A 1:2 describes the strength of interac-tion between materials (designated 1 and 2) interacting across a vacuum and is a function of the density and polarizability of the interacting materials. The work of adhe-sion and Hamaker constant between two planar surfaces experiencing van der Waals attraction can be related by ignoring repul-sion and using the following equation: [ 57 ]
12,adh
1:2
02W
A
Dπ=
(2)
where D 0 represents an artifi cial cut-off distance for minimum separation. Unfor-tunately, the correct choice for D 0 in this calculation is not entirely clear, as dis-cussed further in the Supporting Infor-mation. Israelachvili [ 57 ] suggests the use of the interatomic distance divided by
Adv. Mater. Interfaces 2015, 2, 1400547
www.advmatinterfaces.dewww.MaterialsViews.com
Table 2. Values of W adh that have been measured in previously published experimental inves-tigations of relevant contact pairs.
Tip/substrate materials Measured W adh [J m −2 ] Comment Refs.
Diamond/silicon (111) 0.20–0.45 a) Interfacial force microscope [35]
Silicon/DLC 0.08 AFM, air; tip characterized [8]
DLC/DLC 0.05
Silicon/ta-C 0.10–0.35 AFM, air; tip characterized [40]
Diamond/UNCD 0.06 AFM, in air [12]
Diamond/UNCD-H b) 0.01 AFM, in air
Silicon/silicon 0.83 AFM, in air
Silicon/silicon 0.13–0.35 AFM, in air [34]
Silicon/silicon 0.12 AFM, in air [ 32]
Amorphous C/diamond (111)-H 0.10 AFM, UHV c) , R tip = 45 nm [33]
Amorphous C/diamond (111)-H 0.03 AFM, UHV, R tip = 150 nm
Amorphous C/diamond (111)-H 0.19 AFM, UHV, R tip = 45 nm
Amorphous C /diamond (111)-H 0.05 AFM, UHV, R tip = 150 nm
a) Radius not well characterized; quoted as “<10 nm.” Also value decreased with time elapsed; b) An appended “-H” indicates that the surface was intentionally hydrogen terminated; c) “UHV” designates an environment of ultra-high vacuum.
Table 3. Values of W adh that have been measured in previously published simulation investi-gations of relevant contact pairs.
Tip/substrate materials Measured W adh [J m −2 ]
Comment Refs.
Diamond (111) fl at a) /diamond (111) 0.20–0.30 Depends on H coverage [33]
High- sp 3 carbon fl at/diamond (111) 0.15–0.23
Low- sp 3 carbon fl at/diamond (111) 0.15–0.25
MDN b) fl at/diamond (111) 0.03–0.15 Depends on roughness
Diamond (001) fl at/diamond (001) 0.15–0.25 Depends on H coverage
Low- sp 3 carbon fl at/diamond (001) 0.10
UNCD tip c) /diamond (111) 0.60 Simulated AFM-like tests [52]
UNCD tip/diamond (111)-H 0.35
UNCD tip/UNCD 0.40
UNCD tip/UNCD-H 0.20
UNCD tip/DLC-H 0.10
UNCD-H tip/diamond (111) 0.24
UNCD-H tip/diamond (111)-H 0.28
UNCD-H tip/UNCD 0.26
UNCD-H tip/UNCD-H 0.18
UNCD-H tip/DLC-H 0.10
DLC-H tip/diamond (111) 0.12
DLC-H tip/diamond (111)-H 0.12
DLC-H tip/UNCD 0.12
DLC-H tip/UNCD-H 0.10
DLC-H tip/DLC-H 0.08
a) Unlike AFM, contact involved nominally planar surfaces. W adh is calculated by integrating the force during separation and should be considered a W adh,eff ; b) MDN stands for “model diamond nanocomposite;” c) Similar to AFM, contact involved a 2.5-nm tip on a fl at surface. W adh calculated using continuum contact model (DMT), using a best-fi t paraboloid tip.
FULL
PAPER
© 2015 WILEY-VCH Verlag GmbH & Co. KGaA, Weinheimwileyonlinelibrary.com1400547 (8 of 11)
2.5 as an empirical rule that applies to a wide variety of com-pounds. Therefore, using the arithmetic mean of the intera-tomic spacings of diamond and silicon oxide (0.154 and 0.163 nm, respectively) and dividing by 2.5 yields D 0 = 0.063 nm. This in turn yields a Hamaker constant A Si:C = 9.9 × 10 −20 J. For comparison, theoretical calculations of the Hamaker con-stants for the component materials ( A C:C and A SiO2:SiO2 of 3.0 × 10 −19 and 6.5 × 10 −20 J, respectively) [ 57 ] can be com-bined to describe contact between dissimilar surfaces using the semi-empirical combining rule 1:2 1:1 2:2A A A= (the geo-metric mean). This yields an expected Hamaker constant of A C:Si = 1.4 × 10 −19 J. This is 40% larger than the experimentally derived value; the difference can be attributed to the fact that the expected value ignored surface effects such as reconstruc-tion and passivation of bonds. [ 33 ] This further demonstrates the importance of measuring an experimental value for a given environment and set of conditions, rather than relying on reference values.
3.4. Calculating the Interatomic Lennard–Jones Parameters from the Measured Quantities
The interatomic Lennard–Jones 6–12 potential is an approxi-mate mathematical description of the energy of interactions between two atoms, and has two independent parameters, σ LJ and ε LJ . [ 57 ] It has been more extensively studied and veri-fi ed (for instance, by its use in the AIREBO potential of molec-ular dynamics simulation) [ 58 ] than the Lennard–Jones surface potential (discussed in Section 5). By integrating the inter-atomic potential over two infi nite half-spaces and then com-paring terms, the interatomic parameters can be calculated as follows: [ 59 ]
15
2
1/6
0zLJσ = ⎛⎝⎜
⎞⎠⎟
(3)
4 21 2
6
ALJε
π ρ ρ σ=
(4)
where ρ 1 , ρ 2 designate the number density of atoms in the two interacting solids. Assuming values for number density of atoms in diamond and thermal silicon oxide (1.76 × 10 29 and 2.28 × 10 28 m −3 , respectively) [ 60 ] and using the Hamaker con-stant calculated above ( A Si:C = 9.9 × 10 −20 J), fi tting to the experi-mental results yields σ LJ = 0.35 nm and ε LJ = 3.4 × 10 −22 J = 0.0021 eV. For comparison, empirical values from the molecular dynamics literature are 0.34 nm and 0.00284 eV for carbon [ 58 ] and 0.22 nm and 0.0021 eV for silicon. [ 61 ] As with the Hamaker constant, the geometric mean of these two values is appropriate for ε LJ , while an arithmetic mean is used to combine σ LJ ; [ 58 ] yielding combined empirically derived values of σ LJ ,Si:C = 0.28 nm and ε LJ ,Si:C = 0.0024 eV. These empirically derived values are in reasonable agreement with the values measured here. Differ-ences between them are not surprising because: a) these empir-ically derived values are for single-crystal materials (ignoring surface contamination, oxidation, and reconstruction); and b) empirical combining rules were used.
4. Conclusion
In this paper, a novel technique was used for simultaneously extracting fundamental, geometry-independent interaction parameters—intrinsic work of adhesion and range of adhesion—for two effectively rigid materials described using a two-para-meter adhesion law. Fully in situ adhesion tests were performed with silicon AFM probes containing a native oxide contacting a diamond substrate in vacuum. The measured value of intrinsic work of adhesion, W adh,int = 0.66 ± 14 J m −2 , was signifi cantly higher than most previous experimental and simulation meas-urements. The difference may be due to the fact that we explic-itly account for surface roughness down to the sub-nanometer scale, unlike previous measurements. Importantly, this value is 70% higher than the value that would have been measured under assumptions that are common in AFM testing (parabolic tip, DMT model). This demonstrates the critical importance of accounting for Ångström-scale roughness in nanocontacts. The measured range of adhesion, z 0 = 0.25 ± 0.06 nm, represents the most direct experimental measurement of this quantity to date. It falls within the range of previous measurements, but is larger than the value predicted using the common estimation that the range of adhesion is equal to the atomic spacing of the compo-nent materials. Finally, the measured quantities were used to estimate values of the Hamaker constant (assuming pure van der Waals interactions) and of the parameters needed to rep-resent the adhesion between these materials using a Lennard–Jones interatomic potential; physically reasonable values are obtained. More broadly, we have demonstrated a novel and gen-eral technique for experimentally determining two independent interaction parameters—the length scale and the strength of the adhesion—that can comprehensively describe the adhesive interaction between a pair of materials. Knowledge of these parameters enables the use of continuum models for prediction of adhesion forces and contact behavior in any arbitrary contact geometry.
5. Experimental Section Summarizing the Novel Snap-in/Pull-off Numerical Adhesion
Parameter Method : The SNAP method is a numerical technique for simultaneously determining the work of adhesion and range of adhesion from knowledge of three measurements from an AFM-like adhesion test: 1) the tip shape; 2) the adhesive force; and 3) the position during approach at which the snap-in instability [ 62 ] occurs. The SNAP method is summarized here, and described in more detail in ref. [ 20 ] . Mathematically, the total interaction force between the tip and sample F tip/sample can be calculated by integrating the commonly used Lennard–Jones 3–9 traction-separation relation [ 4,5,8,48 ] over the geometry of the tip. More specifi cally, the normal stress σ normal acting between the tip and sample for any differential element of tip area can be computed (as a function of separation distance z sep ) by using the Lennard–Jones 3–9 traction–separation relation: [ 5 ]
σ ( ) = − ⎛⎝⎜
⎞⎠⎟
− ⎛⎝⎜
⎞⎠⎟
⎡
⎣⎢⎢
⎤
⎦⎥⎥
zW
zz
zz
z8
3normal sepadh,int
0
0
sep
30
sep
9
(5)
Then, integration of this equation over the full tip geometry yields the tip/sample interaction force F tip/sample as a function of tip/sample sepa-ration distance d :
Adv. Mater. Interfaces 2015, 2, 1400547
www.advmatinterfaces.de www.MaterialsViews.com

FULL P
APER
© 2015 WILEY-VCH Verlag GmbH & Co. KGaA, Weinheim (9 of 11) 1400547wileyonlinelibrary.com
,
83
2
tip/sample normal sep normal sep
00
2
adh,int
0
0
tip
30
tip
9
0
F z dA z r r dr d
Wz
zz d
zz d
r dr
Area∫ ∫∫
∫
σ σ θ θ
π
( ) ( )( )= =
= +⎛⎝⎜
⎞⎠⎟
− +⎛⎝⎜
⎞⎠⎟
⎡
⎣⎢⎢
⎤
⎦⎥⎥
⎧⎨⎪
⎩⎪
⎫⎬⎪
⎭⎪
π ∞
∞
(6)
Note that the separation of any differential element of area is the sum of its height on the tip z tip and the tip/sample separation distance (i.e., z sep = z tip + d ). Once the F tip/sample (d) is known, then the computed adhesive force and snap-in distance can be calculated for a wide range of input values of W adh,int and z 0 . By matching the computed values of adhesive force and snap-in distance to the measured values, the correct W adh,int and z 0 can be extracted. In general, with tips of arbitrary geometry, only a single pair of ( W adh,int , z 0 ) values will correctly predict the measured values.
Apparatus and Materials for Fully In Situ Adhesion Testing : In the present experiments, a TEM nanoindenter (Picoindenter PI-95, Hysitron Inc., Minneapolis, MN) is used to perform in situ adhesion testing inside of a TEM (2010F, JEOL, Tokyo, Japan). The TEM has a fi eld-emission source and was operated at a 200-keV accelerating voltage. Each adhesion test was conducted by bringing the fl at punch indenter tip into contact with a calibrated [ 63 ] AFM cantilever, which is mounted rigidly on the sample stage of the nanoindenter, as shown in Figure 2 . The fl at punch indenter tip mimics the fl at substrate that is inserted into a traditional AFM and, as with such an instrument, the force exerted by the sample on the tip is monitored by detecting the defl ection of the cantilever—in this case using direct imaging of the vertical defl ection of the cantilever’s tip.
Three AFM probes (PPP-CONT, Nanosensors, Neuchatel, Switzerland) were tested against a fl at indenter tip (Flat Punch probe, Hysitron, Minneapolis, MN). The probes are composed of silicon with a native oxide and contain a sharp nanoscale tip; no special preparation was performed except to mount the probes on the indenter stage. The spring constants of the three cantilevers were 0.239, 0.199, and 0.162 N m −1 for the tips shown in Figure 3 a, b, c, respectively. Contact-mode cantilevers were chosen to maximize the force sensitivity. The fl at punch indenter was composed of single-crystal diamond, terminating in a (100) face. The punch was mechanically cleaned with acetone on a cotton swab, followed by 20 min of sonication in each of isopropanol, acetone, and methanol, followed by a 5-min oxygen/hydrogen treatment in a plasma cleaner (Solarus 950, Gatan, Inc., Pleasanton, CA). The RMS roughness of the diamond punch was 0.091 nm as measured using ex situ scanning over several 100 × 100 nm 2 areas using an AFM (MFP-3D, Asylum Research, Santa Barbara, CA). The topography image is shown in the Supporting Information. The geometries of the sharp silicon probe apexes were determined using high-resolution TEM imaging of the AFM tips when out of contact. These images are used to characterize the profi le of the tip in detail before testing, and permit much higher magnifi cation images than are achievable during the adhesion test itself, when the surfaces are moving.
Determination of Tip Shape, Pull-off Force and Snap-in Distance : High-resolution TEM images of the tip were taken immediately before the adhesion tests were performed, similar to those shown in Figure 3 . The Ångström-scale morphology of these tips were measured by tracing the outer contours of the tip using post-processing image analysis, using a technique similar to ref. [ 64 ] , as shown in Figure 6 . In order to compare with the DMT single-asperity contact models, a circle has been fi t to each contour in order to extract the best-fi t radius to be used in calculations. Parabolic fi ts to these contours yielded nearly identical effective radii. The 3D shape of the probes was assumed to be axisymmetric, in accordance with prior studies. [ 64 ]
The adhesion tests were then immediately conducted inside the same TEM. The indenter punch was brought toward the AFM probe at a rate of 1 nm s −1 . As the punch approached, there was an observable “snap-in” event, in which the AFM cantilever suddenly defl ected, bringing the tip in contact with the punch. After contact was established, the direction of motion of the indenter punch was reversed. Upon retraction, adhesion held the tip and punch in contact, causing the cantilever to elastically
defl ect in the direction of the punch. Eventually, the tip/punch contact separated suddenly in a “pull-off” event, in which the AFM cantilever suddenly returns to its free (unloaded) position.
The adhesion tests were recorded using a video-rate camera at approximately 30 frames per second, and captured using a digital video recorder. An example video of a typical adhesion test can be found in the Supporting Information. In post-processing, the motion of the AFM tip is measured at all points throughout the test relative to its free, unloaded position. Additionally, the motion of the tip is a direct measurement of the elastic defl ection Δ of the cantilever, and can be multiplied by the spring constant of the cantilever, k lever , to calculate the total interaction force ( F total = k lever · Δ). The magnitude of the defl ection during snap-in d snap-in was recorded. The magnitude of the defl ection during pull-off was also recorded, and multiplied by the spring constant of the lever to determine the value of the pull-off force F pull-off .
A fi nal experimental consideration is the effect of vibration of the nanoindenter. The nanoindenter tip is spring-mounted and exhibits constant vibration at the natural resonance frequency of the force transducer, which for the present apparatus is 119.8 Hz. Therefore, the apparent position of the indenter tip in the video (which is captured at 30 frames per second) is the time-averaged position; the actual position of the spring-mounted indenter varies around this average approximately sinusoidally with time. Immediately prior to every set of experiments, several at-rest displacement measurements were taken to characterize the standard deviation of the vibration at that specifi c time and day. The vibration is determined by measuring the capacitance of a three-plate capacitor system in which the tip is rigidly attached to the central plate (similar to what is described in ref. [ 65 ] ). This varied throughout the day and depended on the use of other active nearby equipment and various external variables. The time-scale for snap-in to occur is on the order of a single period of vibration of the AFM cantilever, which for a typical cantilever resonance frequency of 10 kHz is 0.1 ms. This is approximately two orders of magnitude faster than the period of oscillation for the nanoindenter tip. Therefore, the indenter’s displacement noise can be considered as quasistatic, and thus the true snap-in distance relevant for adhesion characterization is the distance of closest approach during the nanoindenter’s oscillation, not the
Adv. Mater. Interfaces 2015, 2, 1400547
www.advmatinterfaces.dewww.MaterialsViews.com
Figure 6. The shape of the tip was measured using high-resolution TEM images. The outer contour (solid, blue line) was traced based on contrast variation, and was used in the calculation of W adh and z 0 . For the com-parison calculation using the single-asperity DMT model, a circle was fi t to the data (red, dashed line) for extraction of a best-fi t radius.

FULL
PAPER
© 2015 WILEY-VCH Verlag GmbH & Co. KGaA, Weinheimwileyonlinelibrary.com1400547 (10 of 11) Adv. Mater. Interfaces 2015, 2, 1400547
www.advmatinterfaces.de www.MaterialsViews.com
time-averaged position of the nanoindenter tip. Thus, the true value for snap-in d snap-in,true is smaller than the measured (time-averaged) distance d snap-in,meas. by the amplitude of the nanoindenter’s vibration A vib and, for sinusoidal vibration, is given by:
2 ,snap-in,true snap-in,meas vib snap-in,meas vibd d A d σ= − = −
(7)
where σ vib is the standard deviation of vibration that is measured before experimentally. The value of σ vib was 1.34 nm for the test shown in Figure 4, and 2.67 and 1.21 nm for the tips shown in Figure 3a,b, respectively. Thus, the snap-in distance used to extract adhesion parameters is the true value of snap-in, calculated according to Equation ( 7) .
Supporting Information Supporting Information is available from the Wiley Online Library or from the author.
Acknowledgements The authors acknowledge useful discussions with K. Turner and D. Grierson, as well as atomic force microscopy assistance by G. Wabiszewski. Use of the Nanocharacterization Facility at the University of Pennsylvania is acknowledged. R.W.C and T.D.B.J. acknowledge support from National Science Foundation under award No. CMMI12–00093. R.W.C., T.D.B.J., and J.A.L. acknowledge support from the UPenn MRSEC Program of the National Science Foundation under award No. DMR11–20901. R.W.C acknowledges support from AFOSR under Contract No. FA2386–14–1–4071 AOARD.
Received: December 11, 2014 Revised: March 8, 2015
Published online: May 13, 2015
[1] C. M. Mate , Tribology on the Small Scale: a Bottom Up Approach to Friction, Lubrication, and Wear , Oxford University Press , Oxford, UK 2008 .
[2] D. Maugis , Contact, Adhesion and Rupture of Elastic Solids , Springer , Berlin, Heidelberg , 2000 .
[3] C.-Y. Hui , R. Long , J. Adhes. 2012 , 88 , 70 . [4] D. Maugis , J. Coll. Int. Sci. 1992 , 150 , 243 . [5] J. A. Greenwood , Phil. Mag. 2009 , 89 , 945 . [6] Z. Zheng , J. Yu , J. Coll. Int. Sci. 2007 , 310 , 27 . [7] H. Yao , M. Ciavarella , H. Gao , J. Coll. Int. Sci. 2007 , 315 , 786 . [8] D. S. Grierson , J. Liu , R. W. Carpick , K. T. Turner , J. Mech. Phys. Sol.
2013 , 61 , 597 . [9] B. Persson , Phys. Rev. Lett. 2002 , 89 , 245502 .
[10] C. H. Mastrangelo , C. H. Hsu , Solid-State Sensor and Actuator Work-shop, 5th Technical Digest, IEEE 1992 , 208 .
[11] J. Q. Feng , J. Coll. Int. Sci. 2001 , 238 , 318 . [12] A. Sumant , D. Grierson , J. Gerbi , J. Carlisle , O. Auciello , R. Carpick ,
Phys. Rev. B 2007 , 76 , 235429. [13] B. Cappella, G. Dietler , Surf. Sci. Rep. 1999 , 34 , 1 . [14] F. J. Giessibl , Rev. Mod. Phys. 2003 , 75 , 949 . [15] R. Garcia, R. Perez , Surf. Sci. Rep. 2002 , 47 , 197 . [16] S. P. Jarvis, A. Oral, T. P. Weihs, J. B. Pethica , Rev. Sci. Instrum. 1993 ,
64 , 3515 . [17] S. P. Jarvis, H. Yamada, S.-I. Yamamoto, H. Tokumoto , Rev. Sci.
Instrum. 1996 , 67 , 2281 . [18] P. D. Ashby, L. W. Chen, C. M. Lieber , J. Am. Chem. Soc. 2000 , 122 ,
9467 .
[19] S. A. Joyce, J. E. Houston , Rev. Sci. Instrum. 1991 , 62 , 710 . [20] T. D. B. Jacobs , J. A. Lefever , R. W. Carpick , Tribol. Lett. 2015 , DOI:
10.1007/s11249-015-0539-9 . [21] O. Auciello , S. Pacheco , A. Sumant , C. Gudeman , S. Sampath ,
A. Datta , R. Carpick , V. Adiga , P. Zurcher , Z. Ma , H.-C. Yuan , J. Carlisle , B. Kabius , J. Hiller , S. Srinivasan , IEEE Microwave 2007 , 8 , 61 .
[22] F. W. DelRio , M. P. de Boer , J. A. Knapp , E. David Reedy , P. J. Clews , M. L. Dunn , Nat. Mater. 2005 , 4 , 629 .
[23] K. T. Turner , S. M. Spearing , Proc. Roy. Soc. A 2005 , 462 , 171 . [24] R. Maboudian , C. Carraro , Annu. Rev. Phys. Chem. 2004 , 55 , 35 . [25] N. Miki , S. M. Spearing , J. Appl. Phys. 2003 , 94 , 6800 . [26] B. N. J. Persson , E. Tosatti , J. Chem. Phys. 2001 , 115 , 5597 . [27] B. V. Derjaguin , V. M. Muller , Y. P. Toporov , J. Colloid Interface 1975 ,
53 , 314 . [28] K. L. Johnson , K. Kendall , A. D. Roberts , Proc. Roy. Soc. A 1971 , 324 ,
301 . [29] K. Fuller , D. Tabor , Proc. Roy. Soc. A 1975 , 345 , 327 . [30] D. Maugis , J. Adhes. Sci. Technol. 1996 , 10 , 161 . [31] D. Grierson , E. Flater , R. Carpick , J. Adhes. Sci. Technol. 2005 , 19 ,
291 . [32] A. V. Sumant , D. S. Grierson , J. E. Gerbi , J. Birrell , U. D. Lanke ,
O. Auciello , J. A. Carlisle , R. W. Carpick , Adv. Mater. 2005 , 17 , 1039 . [33] P. L. Piotrowski , R. J. Cannara , G. Gao , J. J. Urban , R. W. Carpick ,
J. A. Harrison , J. Adhes. Sci. Technol. 2010 , 24 , 2471 . [34] D. L. Liu , J. Martin , N. A. Burnham , Appl. Phys. Lett. 2007 , 91 ,
043107 . [35] N. W. Moore , J. E. Houston , J. Adhes. Sci. Technol. 2010 , 24 , 2531 . [36] R. G. Horn , J. N. Israelachvili , F. Pribac , J. Coll. Int. Sci. 1987 , 115 ,
480 . [37] H. K. Christenson , J. Phys. Chem. 1993 , 97 , 12034 . [38] K. Chung , Y. Lee , D. Kim , Ultramicroscopy 2005 , 102 , 161 . [39] K.-H. Chung , D.-E. Kim , Ultramicroscopy 2007 , 108 , 1 . [40] J. Liu , J. K. Notbohm , R. W. Carpick , K. T. Turner , 2010 , ACS Nano ,
4 , 3763 . [41] J. Liu , D. Grierson , N. Moldovan , J. Notbohm , S. Li , P. Jaroenapibal ,
S. O’Connor , A. Sumant , N. Neelakantan , J. Carlisle , Small 2010 , 6 , 1140 .
[42] T. D. B. Jacobs , K. E. Ryan , P. L. Keating , D. S. Grierson , J. A. Lefever , K. T. Turner , J. A. Harrison , R. W. Carpick , Tribol. Lett. 2013 , 50 , 81 .
[43] B. Persson , Wear 2003 , 254 , 832 . [44] R. W. Carpick , N. Agrait , D. F. Ogletree , M. Salmeron , J. Vac. Sci.
Tech. B 1996 , 14 , 1289 . [45] M. Enachescu , R. van den Oetelaar , R. W. Carpick , D. F. Ogletree ,
C. Flipse , M. Salmeron , Phys. Rev. Lett. 1998 , 81 , 1877 . [46] Y. Rabinovich , J. Coll. Int. Sci. 2000 , 232 , 17 . [47] J. Katainen , M. Paajanen , E. Ahtola , V. Pore , J. Lahtinen , J. Coll. Int.
Sci. 2006 , 304 , 524 . [48] J. Greenwood , Proc. Roy. Soc. A 1997 , 453 , 1277 . [49] D. Tabor , J. Coll. Int. Sci. 1977 , 58 , 2 . [50] V. M. Muller , V. S. Yushchenko , B. V. Derjaguin , J. Coll. Int. Sci. 1980 ,
77 , 91 . [51] O. Auciello , J. Birrell , J. A. Carlisle , J. E. Gerbi , X. Xiao , B. Peng ,
H. D. Espinosa , J. Phys. Condens. Matter 2004 , 16 , R539 . [52] K. E. Ryan , P. L. Keating , T. D. Jacobs , D. S. Grierson , K. T. Turner ,
R. W. Carpick , J. A. Harrison , Langmuir 2014 , 30 , 2028 . [53] D. B. Asay , M. P. de Boer , S. H. Kim , J. Adhes. Sci. Technol. 2010 ,
24 , 2363 . [54] M. P. de Boer , P. C. T. de Boer , J. Coll. Int. Sci. 2007 , 311 , 171 . [55] C. Greiner , J. R. Felts , Z. Dai , W. P. King , R. W. Carpick , ACS Nano
2012 , 6 , 4305 . [56] E. Riedo , F. Lévy , H. Brune , Phys. Rev. Lett. 2002 , 88 ,
185505 . [57] J. N. Israelachvili , Intermolecular and Surface Forces , Academic
Press , San Francisco, CA 2011 .

FULL P
APER
© 2015 WILEY-VCH Verlag GmbH & Co. KGaA, Weinheim (11 of 11) 1400547wileyonlinelibrary.com
[58] S. Stuart , A. Tutein , J. A. Harrison , J. Chem. Phys. 2000 , 112 , 6472 . [59] N. Yu , A. A. Polycarpou , J. Coll. Int. Sci. 2004 , 278 , 428 . [60] D. R. Lide , CRC Handbook of Chemistry and Physics , CRC Press ,
London, England , 2004 . [61] P. M. Zimmerman , M. Head-Gordon , A. T. Bell , J. Chem. Theory
Comput. 2011 , 7 , 1695 . [62] H.-J. Butt , B. Cappella , M. Kappl , Surf. Sci. Rep. 2005 , 59 , 1 .
[63] J. E. Sader , J. A. Sanelli , B. D. Adamson , J. P. Monty , X. Wei , S. A. Crawford , J. R. Friend , I. Marusic , P. Mulvaney , E. J. Bieske , Rev. Sci. Instrum. 2012 , 83 , 103705 .
[64] T. D. B. Jacobs , R. W. Carpick , Nat. Nanotechnol. 2013 , 8 , 108 .
[65] B. Bhushan , A. V. Kulkarni , W. Bonin , J. T. Wyrobek , Phil. Mag. A 1996 , 74 , 1117 .
Adv. Mater. Interfaces 2015, 2, 1400547
www.advmatinterfaces.dewww.MaterialsViews.com