measurement of the cosmic ray positron spectrum with...
TRANSCRIPT

Measurement of the cosmic ray positron spectrum with the Fermi LAT using the Earth’s magnetic field
Justin Vandenbroucke (KIPAC, Stanford / SLAC)
for the Fermi LAT collaboration
International Cosmic Ray Conference, Beijing August 15, 2011

Outline
1. Motivation
2. The Fermi Large Area Telescope
3. Charge identification with the geomagnetic field
4. Background subtraction
5. Results
ICRC 2011, Beijing Justin Vandenbroucke: Fermi LAT positron spectrum 1

Motivation: PAMELA measurement of increasing positron fraction, 10-100 GeV
ICRC 2011, Beijing Justin Vandenbroucke: Fermi LAT positron spectrum 2
Nature 458, 607 (2009)
GALPROP diffuse
secondary production
model (Moskalenko &
Strong 1998)
Possible explanations: primary astrophysical sources, dark matter,
nonstandard secondary production, …
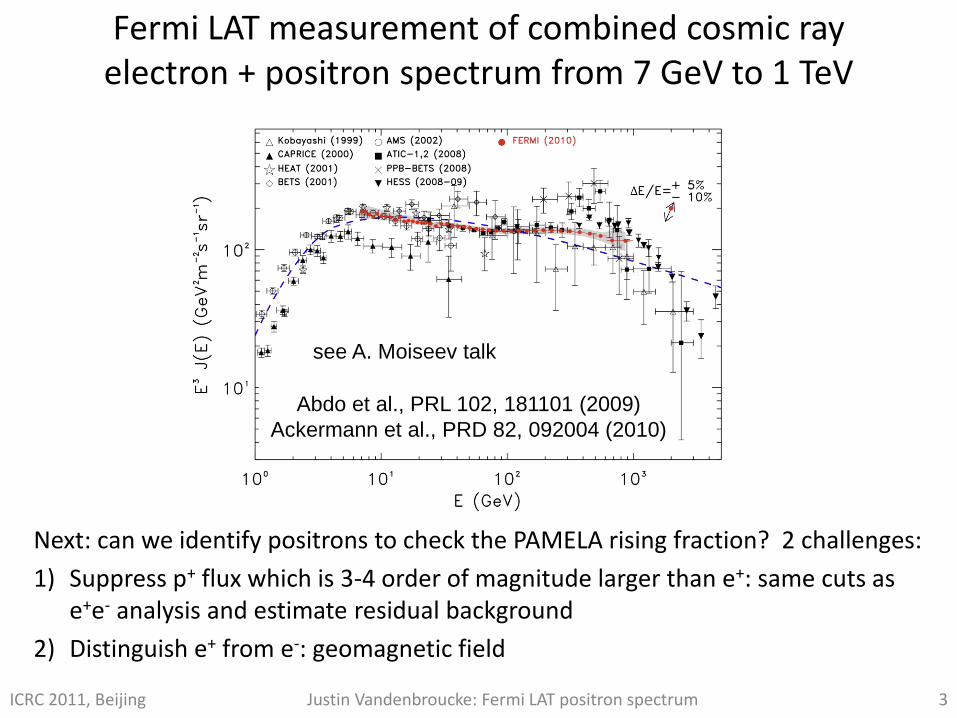
Fermi LAT measurement of combined cosmic ray electron + positron spectrum from 7 GeV to 1 TeV
Abdo et al., PRL 102, 181101 (2009)
Ackermann et al., PRD 82, 092004 (2010)
ICRC 2011, Beijing Justin Vandenbroucke: Fermi LAT positron spectrum 3
Next: can we identify positrons to check the PAMELA rising fraction? 2 challenges:
1) Suppress p+ flux which is 3-4 order of magnitude larger than e+: same cuts as e+e- analysis and estimate residual background
2) Distinguish e+ from e-: geomagnetic field
see A. Moiseev talk

The Fermi Large Area Telescope (LAT): a pair-conversion telescope with ~1 m2 effective area
Calorimeter
ACD
Tracker
~1.8 m
e+ e-
γ
ICRC 2011, Beijing 4 Justin Vandenbroucke: Fermi LAT positron spectrum
• Anti-Coincidence Detector: charged particle veto surrounding Tracker, 89 plastic scintillator tiles + 8 ribbons, 0.9997 efficiency for tagging singly charged particles
• Tracker: 16 modules: tungsten conversion foils + 80 m2 of silicon strip detectors in 36 layers, 1.5 radiation lengths on-axis
• Calorimeter: 16 modules: 96 Cesium Iodide crystals per module, 8.6 radiation lengths on-axis, segmented for 3D energy deposition distribution
Atwood et al., ApJ 697, 1071 (2009)
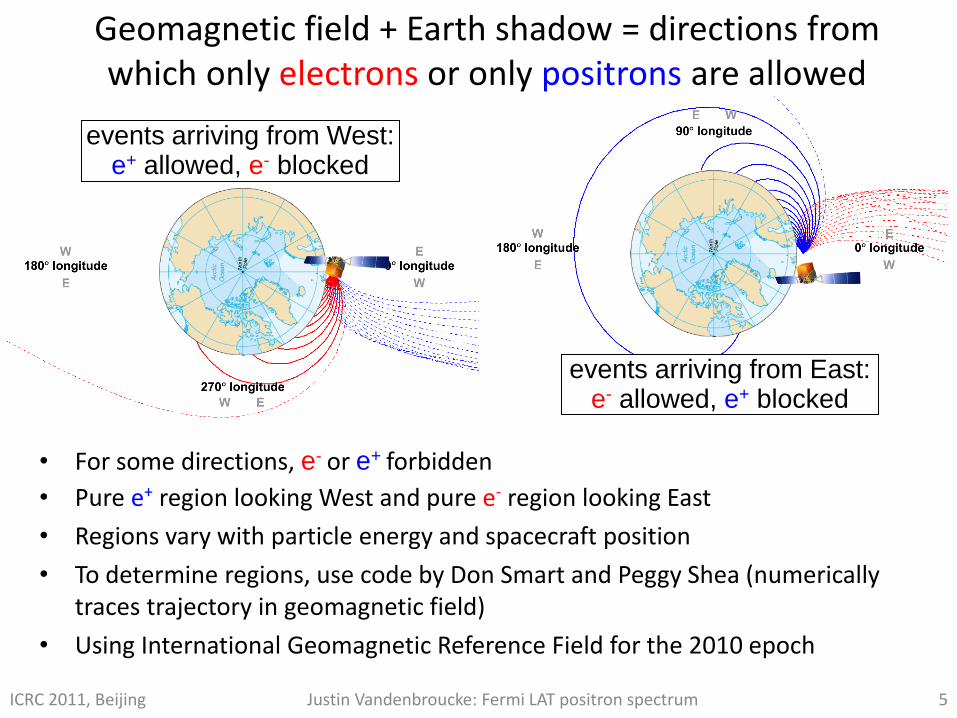
Geomagnetic field + Earth shadow = directions from which only electrons or only positrons are allowed
ICRC 2011, Beijing Justin Vandenbroucke: Fermi LAT positron spectrum 5
events arriving from West: e+ allowed, e- blocked
• For some directions, e- or e+ forbidden
• Pure e+ region looking West and pure e- region looking East
• Regions vary with particle energy and spacecraft position
• To determine regions, use code by Don Smart and Peggy Shea (numerically traces trajectory in geomagnetic field)
• Using International Geomagnetic Reference Field for the 2010 epoch
events arriving from East: e- allowed, e+ blocked

Time-dependent region selection
ICRC 2011, Beijing Justin Vandenbroucke: Fermi LAT positron spectrum 6
e+ only region e- only region
both-allowed region
• “Deflected horizon” = boundary between allowed and shadowed trajectories
• Use instantaneous spacecraft position to determine two horizons for each energy
• Three regions: positron-only, electron-only, both-allowed
e- deflected horizon
(e- forbidden inside)
e+ deflected horizon
(e+ forbidden inside)

Validation of magnetic field model + tracer code
1. Geographical distribution of geomagnetic cutoffs predicted from code matches LAT data (arXiv:1108.0201)
2. Atmospheric positrons (and electrons) detected precisely from deflected direction expected from code:
ICRC 2011, Beijing Justin Vandenbroucke: Fermi LAT positron spectrum 7

Exposure maps: 2 example energy bins for all 3 regions
ICRC 2011, Beijing Justin Vandenbroucke: Fermi LAT positron spectrum 8
32-40 GeV e+ 32-40 GeV e-
63-80 GeV e+e- 63-80 GeV e+ 63-80 GeV e-
32-40 GeV e+e-
Exposure units: m2 s

Two background subtraction methods: (1) Monte Carlo (2) fit transverse shower size in flight data
• One example energy bin
• Fit with sum of two Gaussians
• Wide hadronic + narrow electromagnetic showers
e+ + e-
region
e-
region
e+
region
ICRC 2011, Beijing Justin Vandenbroucke: Fermi LAT positron spectrum 9

Two background subtraction methods produce consistent results
Three cross checks:
• Two background subtraction methods consistent
• Summed flux from e- and e+ regions matches flux from both-allowed region
• Flux from both-allowed region matches previously published e+e- total flux
ICRC 2011, Beijing Justin Vandenbroucke: Fermi LAT positron spectrum 10
Fit-based background subtraction MC-based background subtraction

Systematic uncertainties in spectra
Effect MC-based method
Fit-based method
Effective area ±5% ±5%
Onboard filter efficiency ±5% ±5%
Atmospheric e± (<100 GeV) +0%, -3% +0%, -3%
Atmospheric e± (>100 GeV) +0%, -10% +0%, -10%
Data-MC p+ rate agreement 8% NA
Background proton index 2-10% NA
Fit parameterization NA 5%
Reference θ distribution NA 2-4%
Total 8-19% 6-13%
ICRC 2011, Beijing Justin Vandenbroucke: Fermi LAT positron spectrum 11
Uncertainty of positron fraction is smaller (Aeff uncertainty cancels)

Final results: electron-only, positron-only, and both-allowed spectra
ICRC 2011, Beijing Justin Vandenbroucke: Fermi LAT positron spectrum 12
Use fit-based result (lower uncertainty than MC-based) except for highest energy bin, where statistics insufficient for fitting

Final results: positron fraction
ICRC 2011, Beijing Justin Vandenbroucke: Fermi LAT positron spectrum 13
• Fraction = ϕ(e+) / [ϕ(e+) + ϕ(e-)]
• We don’t use the both-allowed region except as a cross check
• Positron fraction increases with energy from 20 to 200 GeV

extra slides
ICRC 2011, Beijing Justin Vandenbroucke: Fermi LAT positron spectrum 14

Angular distribution of events above 100 GeV (with respect to deflected positron horizon, for events
below deflected electron horizon)
ICRC 2011, Beijing Justin Vandenbroucke: Fermi LAT positron spectrum 15

The Fermi Gamma-ray Space Telescope
• Launched by NASA at Cape Canaveral June 11, 2008
• Routine science began August 2008
• Two instruments – Large Area Telescope: 20 MeV – 300 GeV
– Gamma-ray Burst Monitor: 8 keV – 40 MeV
• Data publicly available since August 2009
• Orbit: 565 km, 25.6o inclination, circular
• Field of view = 2.4 sr (38% of 2π)
• Observe entire sky every 2 orbits = 3 hrs
• Expect thousands of sources, with spectra for hundreds
• ~0.1° resolution at 10 GeV, ~0.5° at 1 GeV, ~4° at 100 MeV
ICRC 2011, Beijing Justin Vandenbroucke: Fermi LAT positron spectrum 16

ATIC (Advanced Thin Ionization Calorimeter): bump in combined electron + positron spectrum at 300-800 GeV
• 3 balloon flights in Antarctica, 2000-2008
• 70 events between 300 and 800 GeV
ICRC 2011, Beijing Justin Vandenbroucke: Fermi LAT positron spectrum 17
ATIC
AMS-01
BETS, PPB-BETS
PPB-BETS
x PPB-BETS
- GALPROP
--- GALPROP with solar modulation
Nature 456:362, 2008

Recently updated PAMELA electron + positron analysis
ICRC 2011, Beijing Justin Vandenbroucke: Fermi LAT positron spectrum 18
PRL 106, 201101 (May 20, 2011)

Recently updated PAMELA electron + positron analysis
ICRC 2011, Beijing Justin Vandenbroucke: Fermi LAT positron spectrum 19
PRL 106, 201101 (May 20, 2011)
e- spectrum
positron fraction

• ~E-2.7 power law
• Proton flux an order of magnitude larger than alpha flux
PAMELA proton and alpha spectra
ICRC 2011, Beijing Justin Vandenbroucke: Fermi LAT positron spectrum 20
protons
Science 332 (6025): 69-72 (2011)
alphas

PAMELA antiproton fraction
Consistent with diffuse model, unlike positron spectrum
ICRC 2011, Beijing Justin Vandenbroucke: Fermi LAT positron spectrum 21
PRL 102, 051101 (2009)

Fermi LAT orbits and exposure
• Nearly uniform exposure every two orbits
• Typical point on sky viewed for 30 minutes every 3 hours
• Rocking: alternate North-pointing orbit with South-pointing orbit
• This survey mode has been used exclusively except for an initial pointed-mode commissioning period and several pointed-mode observations of a few days each (Crab Nebula twice, Cyg X-3 once, and very bright blazar flare – 3C 454.3 – once)
ICRC 2011, Beijing Justin Vandenbroucke: Fermi LAT positron spectrum 22
Atwood et al., ApJ 697, 1071 (2009)

Fermi LAT data taking
• Launched June 11, 2008 (3 years old!)
• Normal data taking since August 4, 2008
• Data are publicly available, along with analysis software, from the Fermi Science Support Center (http://fermi.gsfc.nasa.gov/ssc)
• 175 billion events at trigger level as of May 10, 2011 (~2 kHz)
• 40 billion events sent from satellite to ground (after onboard filtering)
• Photons available for download, few hours after being detected
• As of May 2011, ~600 million photon events available, collected since August 4, 2008
• Detecting 6.3 gamma rays per second
ICRC 2011, Beijing Justin Vandenbroucke: Fermi LAT positron spectrum 23

Separating electrons and positrons from gammas and protons
• Anti-coincidence detector (ACD = set of scintillator tiles surrounding instrument) usually required to not fire, to reject charged particles and keep gamma rays
• Here we require the ACD to fire, to select charged particles and reject the gamma ray “background”
• Proton rejection: require broader, clumpier shower in CAL, TKR, and ACD:
ICRC 2011, Beijing Justin Vandenbroucke: Fermi LAT positron spectrum 24
Increasing cut level
and background
rejection: required
~103 to 104 proton
rejection achieved

Hadron-lepton separation and data – Monte Carlo comparison
ICRC 2011, Beijing Justin Vandenbroucke: Fermi LAT positron spectrum 25
after calorimeter cuts after tracker cuts
after anti-coincidence cuts after classification tree cuts

Acceptance and residual background contamination
ICRC 2011, Beijing Justin Vandenbroucke: Fermi LAT positron spectrum 26
• Acceptance (“geometric factor) = 1-3 m2sr in 20 GeV to 1 TeV range
• Residual hadron contamination = 5 to 20 %
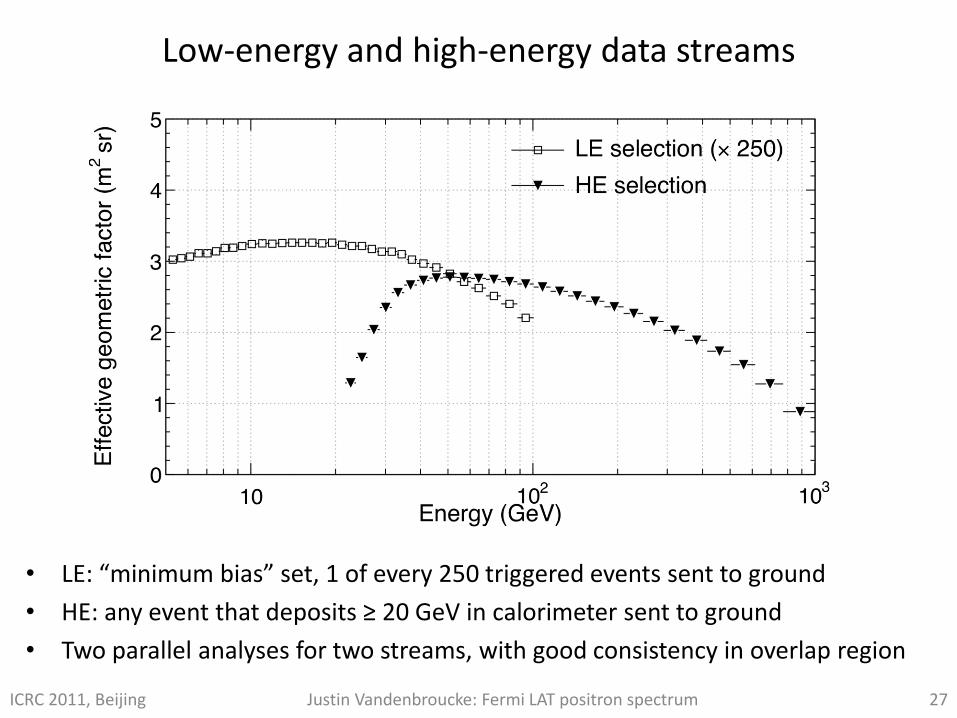
Low-energy and high-energy data streams
ICRC 2011, Beijing Justin Vandenbroucke: Fermi LAT positron spectrum 27
• LE: “minimum bias” set, 1 of every 250 triggered events sent to ground
• HE: any event that deposits ≥ 20 GeV in calorimeter sent to ground
• Two parallel analyses for two streams, with good consistency in overlap region

Energy resolution, measured with beam test: ~15%
ICRC 2011, Beijing Justin Vandenbroucke: Fermi LAT positron spectrum 28

e+e- interpretation 1: conventional diffuse model
ICRC 2011, Beijing Justin Vandenbroucke: Fermi LAT positron spectrum 29
• Black: electron + positron, blue: electron only
• Dashed: without solar modulation

e+e- interpretation 2: softer diffuse secondary model, plus additional source at high energy
ICRC 2011, Beijing Justin Vandenbroucke: Fermi LAT positron spectrum 30
• Tuned to the data: softer diffuse injection spectrum, plus an additional component at high energy (pulsar? dark matter?)

Search for anisotropy in cosmic ray electron + positron flux
• 1.6 M candidate electrons above 60 GeV in first year
• Entire sky searched for anisotropy with range of angular scales (10° to 90°) and energies
• Dipole upper limits: 0.5% to 10% (comparable to expectation for single nearby source: models are not constrained)
Ackermann et al, PRD 82, 092003 (2010)
ICRC 2011, Beijing Justin Vandenbroucke: Fermi LAT positron spectrum 31
upper
limits

Cosmic ray electron/positron separation at ~ TeV with MAGIC and the Moon shadow?
ICRC 2011, Beijing Justin Vandenbroucke: Fermi LAT positron spectrum 32
• Measure electrons/positrons using imaging atmospheric Cherenkov telescopes like HESS, but use the Moon shadow to separate electrons and positrons (two shadows separated by ~1° at ~1 TeV)
• Moon phase must be < ~50% to avoid damaging PMTs
• They have made observations and are analyzing
e-
shadow
e+
shadow
MAGIC, arXiv:0907.1026

Geomagnetic cutoff rigidities
• Determine geomagnetic cutoff energy as a function of geomagnetic orbital coordinates (higher McIlwainL lower cutoff energy)
• in each McIlwainL interval, measure spectrum for primary component above the cutoff, then recombine different spectra in the global spectrum
• BONUS: this can be used to measure the absolute energy scale of the LAT
Below 20 GeV, we need to consider
the shielding
effect of the geo-
magnetic field
ICRC 2011, Beijing 33 Justin Vandenbroucke: Fermi LAT positron spectrum

Spectra: p+, e+e-, e+, p-bar
ICRC 2011, Beijing Justin Vandenbroucke: Fermi LAT positron spectrum 34
From A. Strong cosmic ray database and M. Pesce-Rollins PhD thesis

Proton flux 3-4 orders of magnitude larger than positron flux
ICRC 2011, Beijing Justin Vandenbroucke: Fermi LAT positron spectrum 35
From A. Strong cosmic ray database and M. Pesce-Rollins PhD thesis

Example interpretation with modified secondary
production
ICRC 2011, Beijing Justin Vandenbroucke: Fermi LAT positron spectrum 36
Stawarz et al., ApJ 710:236 (2010)
• Diffuse Galactic gammas pair produce on stellar photon field
• Requires high starlight and gas densities
• Both could be high near primary sources (e.g. SNRs)