measurement of step- down dc / dc converters with bode 100
TRANSCRIPT

Smart Measurement Solutions
Bode 100 - Application NoteMeasurements of Step-Down DC / DC Converters
Page 1 of 17
Down DC / DC Converters with
Bode 100
Measurement of Step-
Strongly supported by
by Stephan Synkule ©2007 Linear Technology and Omicron Lab Visit www.omicron-lab.com
for more information. Contact [email protected] for technical support.

Smart Measurement Solutions
Bode 100 - Application NoteMeasurements of Step-Down DC / DC Converters
Page 2 of 17
Table of Contents
......................3
......................3
......................4
......................4
......................5 5
......................8
....................12
4 Conclusion.................................................................................................................14 5 Annex: ........................................................................................................................15
No like setting-up, adjusting and calibrating Bode 100 are
described in the operational manual of Bode 100. Therefore these procedures
Note: All measurements with Bode 100 were done using the Bode Analyzer Suite V2.2
some mentioned functions may not be available if you use an earlier version of the Bode Analyzer Suite. You can download the latest version at www.omicron-lab.com
1 Executive Summary ..............................................................................
2 Measurement Tasks .............................................................................. 3 Measurement Setup & Results.............................................................
3.1 A short note on designing DC/DC converters with SwitcherCAD III ..3.2 Stability analysis of a LT1976 control circuit......................................
3.2.1 Theory and measurement setup ........................................................................3.2.2 Influences of supply voltage changes on the stability ..................3.2.3 Influences of load changes on the stability ..................................
te: Basic procedures
are not described in detail in this application note.
.
All pictures showing Linear Technology components are used with the permission of Linear Technology Germany.

Smart Measurement Solutions
Bode 100 - Application NoteMeasurements of Step-Down DC / DC Converters
Page 3 of 17
ol loop behavior ll be given an
n methods to asses the stability of switched mode power supplies. In addition you will be shown how you can visualize the influence of supply voltage or load changes.
ges on the output of a DC/DC converter loop, compensation designs are necessary. The quality of
erter. The control loops with
ing a Linear Technology 1976IFE Step-Down
ts with this demo circuit the following topics are assessed:
control loop
3.) Stability analysis of control circuits including gain margin and phase margin
4.) Analysis of influences caused by supply voltage and load changes
5.) Using the shaped level function of Bode 100
1 Executive Summary This application note explains how to analyze the stability and the controf DC power supplies containing step-down DC/DC converters. You wiinsight o
2 Measurement Tasks To minimize the influences of supply voltage variations and load chanvoltage this control circuit design defines the stability of the entire DC/DC convfollowing pages show you how you can asses the stability of such Bode 100. All measurements in this application note were performed usemo circuit 481A for which the main component is the LTCd
Switching Regulator. Based on measuremen
1.) A short note on designing DC/DC converters with SwitcherCAD III 2.) Setup for the signal injection into a
Detailed information on all the LT products used can be found at http://www.linear.com.

Smart Measurement Solutions
Bode 100 - Application NoteMeasurements of Step-Down DC / DC Converters
Page 4 of 17
3 Measurement Setup & Results
rCAD III
/DC converters as well as other electronic cherCAD III which is distributed by Linear
3.1 A short note on designing DC/DC converters with Switche
A quick way to design and simulate DCcircuits is the use of the design software SwitTechnology and can be downloaded for free at www.linear.com/designtools/software/switchercad.jsp. SwitcherCAD III is a powerful circuit simulator and schematic capture program, providing macro models for 80% of Linear Technology's switching regulator, over 200 Op-Amp models, as well as resistors, transistors and MOSFET models.
SwitcherCAD III is the third generation switching regulator design progTechnology. The program consists of a hig
ram by Linear h performance SPICE simulator extended
ic SPICE devices for
program includes an integrated hierarchical schematic capture program that allows users to edit example SMPS circuits or design new circuits. An integrated waveform viewer displays the simulated waveforms and allows further analysis of the simulation data. There is a built-in database for most of Linear Technology's power ICs and many passive components. The device database, schematic editing, simulation control and waveform analysis are integrated into one program. All schematics used in this application note were drawn with SwitcherCAD III.
with a mixed mode simulation capability that includes new intrinsmacro modeling Switch Mode Power Supply (SMPS) controllers and regulators. The

Smart Measurement Solutions
Bode 100 - Application Note
Measurements of Step-Down DC / DC ConvertersPage 5 of 17
3.2 Stability analysis of a LT1976 control circuit
d below 1 frequency exists at which the gain is higher than
1 and the phase shift is exactly 180°. In this specific case we have a positive feedback which will lead to instability of the control loop.
3.2.1 Theory and measurement setup
A loop is stable when its phase reaches -180° after the gain has droppe(=0dB). If this condition is not fulfilled a
The Bode plot above shows a phase shift of 117° at a gain of 0dB. From these values we can calculate a phase margin of 63° (=180°-117°). The Bode plot further shows a gain of -10dB at the point where a phase shift of -180° is reached – the gain margin is therefore 10dB (= 0dB -(-10dB)). Note: : Depending on the chosen feedback behaviour at the measurement point the
phase margin is either referenced towards +/- 180° or 0°.
Gain margin 10dB
Phase margin 63°
Gain 0dB

Smart Measurement Solutions
Bode 100 - Application NoteMeasurements of Step-Down DC / DC Converters
Page 6 of 17
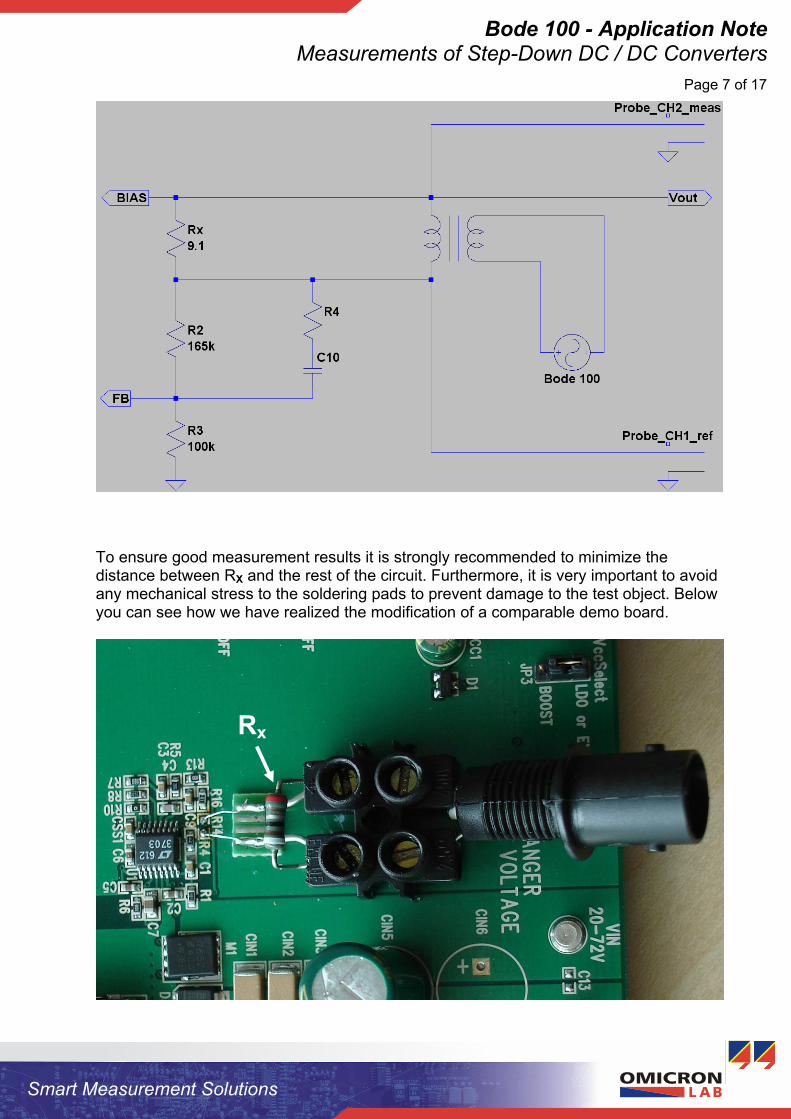
The following schematic shows the circuit of the demo board 481A:
To inject Bode 100's source signal into the control loop we need to hook a resistor RX into the feedback loop. To avoid any influences on the measurement result RX needs to
R3, which build the
RX using an injection transformer. The measurement signal for Bode 100 is picked up at the pin of RX which is connected to the DC/DC converter's output. The reference for the measurement is picked up from the other pin of RX. It is recommended to use probes to pick up these signals. In our example we used 1:1 probes but 10:1 probes are possible as well. The described connection setup is shown on the next page.
be negligible (= very small, we used 9.1Ω) in comparison to R2 and feedback divider of the selected DC/DC converter. The Bode 100's source signal itself is injected via
Smart Measurement Solutions
Bode 100 - Application NoteMeasurements of Step-Down DC / DC Converters
Page 7 of 17
To ensure good measurement results it is strongly recommended to minimize the distance between RX and the rest of the circuit. Furthermore, it is very important to avoid any mechanical stress to the soldering pads to prevent damage to the test object. Below you can see how we have realized the modification of a comparable demo board.
Rx

Smart Measurement Solutions
Bode 100 - Application Note
Measurements of Step-Down DC / DC ConvertersPage 8 of 17
heck how supply voltage changes influence the
ttings in the frequency sweep mode:
Hz or less
r more and CH2
o Sweep mode: logarithmic o Trace 1: - Measurement = Gain
- Format = Mag (dB) o Trace 2: -Measurement = Gain
- Format = Phase (°)
3.2.2 Influences of supply voltage changes on the stability
With our first measurement we will ccharacteristic of the LT1976's control circuit.
Apply the following se
o f(min) = 1 kHzo f(max) = 200 kHz
e external o Referenco Attn 20 dB o Receiver Bandwidth: 100o DUT delay 0s o Num ober of points: 401o high impedance for CH1
Note: With a narrow receiver bandwidth only little noise will affect the measurement but
the sweep time will increase. Note: By using the external reference input the measured Gain is defined as the ratio
between the voltages measured at the input of CH1 and CH2. For the calibration of the probes the only required condition is that both probes get the same signal. Therefore we recommend connecting both probes directly to the source output of Bode 100 as shown on the next page.

Smart Measurement Solutions
Bode 100 - Application NoteMeasurements of Step-Down DC / DC Converters
Page 9 of 17
Hint: Probe to BNC adapters are a big help during calibration.
• Perform a THRU calibration to remove the probe influences
• After calibration the chart should show a flat magnitude (0dB) and phase (0°). • Connect the probes and the injection transformer to your board as shown below:

Smart Measurement Solutions
Bode 100 - Application NoteMeasurements of Step-Down DC / DC Converters
Page 10 of 17
allows us to for the demo for the board
out rectly compared with the extract from
• Supply your demo circuit 481A with 12V and initiate the frequency sweep
allows us to for the demo for the board
out rectly compared with the extract from
• Supply your demo circuit 481A with 12V and initiate the frequency sweep
• For our measurements we have chosen a load current of 1A. This directly compare our results with charts in the LT Quick Start Guidecircuit 481. To achieve this current we used a 3.3Ω resistor as load (V = 3.3V). The measured curves can be di
For our measurements we have chosen a load current of 1A. This directly compare our results with charts in the LT Quick Start Guidecircuit 481. To achieve this current we used a 3.3Ω resistor as load (V = 3.3V). The measured curves can be dithe Linear Quick Start Guide on the next page. the Linear Quick Start Guide on the next page.
magnitude(Gain) in dB
phase(Gain) in °
f/Hz2000 5000 10000 20000 50000 100000
TR2/°
-200
-150
-100
-50
0
50
100
150
TR1/dB
-50
-40
-30
-20
-10
0
10
20
30
• Change the supply voltage to 5.0V and perform a sweep again
magnitude(Gain) in dB
phase(Gain) in °
f/Hz00000
TR2/°
-200
-150
-100
-50
0
50
100
150
TR1/dB
-20
-10
0
10
20
30
2000 5000 10000 20000 50000 1
-40
-30
Note: We injected our signal into a degenerative feedback loop and measure this signal at the output of the DC/DC converter. For a stable circuit it is required that the signal measured at the output of the DC/DC converter is not in phase with the injected signal. Therefore the phase margin and the amplitude margin are referenced towards 0°. Note: To compare to measurements you can use the Data→Memory function as
described in the user manual.
Phase margin 80°
Phase margin 45°
Gain margin 21dB

Smart Measurement Solutions
Bode 100 - Application NoteMeasurements of Step-Down DC / DC Converters
Page 11 of 17
Resul esults
y Linear Technologies in the Quick Start Guide for the selected Demonstration Circuit. In the second measurement you can see a higher rising of the phase and a deeper drop in gain at a frequency around 50 kHz. These deviations can result from different injection resistors RX and different capacitive loads of the probes used for the different measurements. The increased noise in the results above may result from a wider receiver bandwidth. The most important point is that the gain crossover frequencies match for both measurements.
t: The measurements received with Bode 100 match almost the rpublished b

Smart Measurement Solutions
Bode 100 - Application NoteMeasurements of Step-Down DC / DC Converters
Page 12 of 17
3.2.3 Influences of load changes on the stability
pply voltage of 10V.
• For the first measurement we used a load resistor of 5.1Ω (=0.647A), the measurement itself was performed with the settings and as described in 3.2.2
The following steps will illustrate the influences of different load currents on the control circuit. To perform these measurements we used a constant su
magnitude(Gain) in dB
phase(Gain) in °
f/Hz2000 5000 10000 20000 50000 100000
TR2/°
-200
-150
-100
-50
0
50
100
150
TR1/dB
-50
-40
-30
-20
-10
0
10
20
30
• The next measurement was done with a load resistor of 43Ω (=76.7mA). As a result
we received a curve showing a non-linearity between 3.5 kHz and 11 kHz.
magnitude Data(Gain) in dB
phase Data(Gain) in °
f/Hz2000 5000 10000 20000 50000 10000
-40
0
TR2/°
-200
-150
-100
-50
0
50
100
150
TR1/dB
-30
-20
-10
0
10
20
30
Result: This is caused due to slew rate distortions. These distortions can be also
visualized measuring the Vout of the power supply unit using an oscilloscope.

Smart Measurement Solutions
Bode 100 - Application NoteMeasurements of Step-Down DC / DC Converters
Page 13 of 17
By reducing Bode's output signal to -10dBm this non-linearity can be avoided.
•
magnitude Data(Gain) in dB
phase Data(Gain) in °
f/Hz2000 5000 10000 20000 50000 10 00
TR2/°
-200
-150
-100
-50
0
50
100
150
TR1/dB
-40
-30
-20
-10
0
10
20
30
00
Result: The circuit is back in its linear operation mode. But the reduced output signal
level results in an increased noise at the lower and upper end of the e noise is a result of the decreased output level in
nd-pass like behavior of the terminated injection
non linearity you can use the shaped level function of Bode 100. This function allows you to selectively reduce the output level of Bode 100 for the critical frequency range (3.5 kHz – 11 kHz), while keeping the level high for the rest of the sweep.
Note: Detailed information on the shaped function can be found in chapter 5.
frequency range. Thcombination with the batransformer.
To avoid this noise as well as the

Smart Measurement Solutions
Bode 100 - Application NoteMeasurements of Step-Down DC / DC Converters
Page 14 of 17
After having adjusted the level shape you can restart your measurement again:
•
magnitude Data(Gain) in dB
phase Data(Gain) in °
f/Hz2000 5000 10000 20000 50000 10 00
TR2/°
-200
-150
-100
-50
0
50
100
150
TR1/dB
-40
-30
-20
-10
0
10
20
30
00
Result: Due to the higher output level at low and high frequencies the noise in the
curve is eliminated while the level reduction in the critical area (3.5 kHz – 11 kHz) removes the non-linearity.
Bode 100 can be easily used to measure the gain margin and phase margin which are indicators for the stability of a control loop. Furthermore, the influence of supply voltage and load current changes can be visualized, which provides precious information on the behavior of a DC/DC converter in real life operation. In addition we demonstrated how non-linearity can be overcome by using Bode 100's level shape function.
4 Conclusion

Smart Measurement Solutions
Bode 100 - Application Note
Measurements of Step-Down DC / DC ConvertersPage 15 of 17
5 Annex:
The Shaped Level Function allows varying the Bode 100's output level throughout its
To activate this functionality change from the "Level" to the "Shaped Level" mode by pushing the button beside the word "Level " as shown in the picture below.
frequency range.
By clicking the shaped level button you can open the Shaped Level window which allows predefining Bode 100's output level at various frequencies. Just enter the delta level for a defined frequency point and Bode 100 will calculate the output level for the respective frequency (Output Level = Reference Level + Delta Level)
entered value calculated value

Smart Measurement Solutions
Bode 100 - Application NoteMeasurements of Step-Down DC / DC Converters
Page 16 of 17
els at three cies. By changing the reference level the entire level curve can be
shifted up or down.
The example below shows a level curve defined by entering delta levdifferent frequen
original curve (ref. level: 0dBm) changed curve (ref. le
vel: 5dBm)
The green indicators beside the output level reading confirm that Bode 100 is able to generate the required output level (Bode 100's output level range is -27dBm to 13 dBm).
If an entered delta level results in an output level outside Bode 100's source level range the output level is limited accordingly. In addition a red indicator is displayed.

Smart Measurement Solutions
Bode 100 - Application NoteMeasurements of Step-Down DC / DC Converters
Page 17 of 17
values for one the order of theses entries it is possible to select if the
The order of the delta levels at one frequency point can be adjusted by right mouse click on the respective frequency cell.
It is possible to program very steep slopes by entering two delta levelfrequency point. By adjusting slope shows a rising or falling edge.
original curve changed curve
reset curve