measurement of regional cerebral plasma pool and hematocrit
TRANSCRIPT

utilization in the temporal cortex of affectively ill patients: positron emissiontomography. Biol Psychiatry 1987;22:545—553.
9. KanayaT, YonekawaM. Regionalcerebralbloodflowin depression.JpnJ PsychNeurol 1990;44:571—576.
10. AustinMP,DougallN,RossM,etal.Single-photonemissiontomographywith @“Tcexametazime in major depression and the pattern of brain activity underlying thepsychotic/neurotic continuum. J Affect Disord 1992;26:31—43.
11. MaybergHS,JeffreyPJ,WagnerHN,Simpson5G.Regionalcerebralbloodflowinpatients with refractory unipolar depression measured with @‘Tc-HMPAO/SPECT[Abstract]. J Nuci Med l99I;32:951.
12. Kazim MY, Oziem K, Belkis E, Erhan V, Cengiz G, Coskun FB. Assessment ofchanges in regional cerebral blood flow in patients with major depression using
@“Tc-HMPAOsingle-photon emission tomography method. Eur J Nuci Med 1992;19:1038—1043.
13. Delvenne V, Delecluse F, Hubain PP. Schoutens A, DeMaertelaer v, Mendlewicz J.Regional cerebral blood flow in patients with affective disorders. Br J Psychiatry1990;l57:359—365.
14. 5chlegel 5, Aldenhoff 18, Eissner D, Lindner P. Nickel 0. Regional cerebral bloodflow in depression: associations with psychopathology. J Affective Disord 1989;17:21 1—218.
15. Sackeim HA, Prohovnik I, Moeller JR. et al. Regional cerebral blood flow in mooddisorders. Arch Gen Psychiatry 1990;47:60—70.
16. MathewRJ,MeyerJS,FrancisDJ,SemchukKM.MortelK,ClaghornJL.Cerebralblood flow in depression. Am J Psychiatry I980;137: 1449—1450.
17. Silfverskiold P, Risberg J. Regional cerebral blood flow in depression and mania. ArchGen Psychiatry l989;46:253—259.
18. GoldsteinPC,BrownGG,WelchKMA,MarcusA, EwingJR.RosenbaumG.Agerelated decline ofrCBF in schizophrenia and major affective disorder. J Cereb BloodFlow Metab 1985;5:203—204.
19. Gur RE, Skolnick BE, Gur RC, et al. Brain function in psychiatric disorders. H:regional cerebral blood flow in medicated unipolar depressives. Arch Gen Psychiatry1984;41 :695—699.
20. Volk 5, Kaendler SH, Weber R, et al. Evaluation of the effects of total sleepdeprivation on cerebral blood flow using single-photon emission computed tomography. Acta PsychiatrScand l992;86:478—483.
21. Ebert D, Feistel H, Barocka A. Effect of sleep deprivation on the limbic system andfrontal lobes in affective disorders: a study with @“Tc-HMPAOSPECT. PsychiatryResNeuroimaging 1991;40:247—251.
22. Wu IC, Gillin JC, Buchsbaum MS, Hershey 1, Johnson JC, Bunney WE. Effect ofsleep deprivation on brain metabolism of depressed patients. Am J Psychiatryl992;149:538—543.
23. SilfverskioldP.GustafsonL,RisbergJ,RosenI.Acuteandlateeffectsof electroconvulsive therapy: clinical outcome of regional cerebral blood flow and electroencephalogram. Ann NYAcad Sci l986;462:236—248.
24. Prohovnik I, Sackeim HA, Decina P. Malitz 5. Acute reductions of regional cerebralblood flow following electroconvulsive therapy. Interactions with modality and time.Ann NY Acad Sci l986;462:249—262.
25. RosenbergR, vostrt@p5, AndersenA, Bolwig T. EffectofECT on cerebralblood flowin melancholia assessed with SPECT. Convulsive Ther I988;4:62—73.
26. Scott AIF, Dougall N, Ross M, et al. Short-term effects ofelectroconvulsive treatmenton the uptake of@―Tc-exametazime into brain in major depression with single photontomography. J Affective Disord 1994;30:37—44.
27. volkow ND, Bellar 5, MullaniN, Jould L, Dewey S. Effects of electroconvulsivetherapy on brain glucose metabolism: a preliminary study. Convulsive Ther 1988;4:199—205.
28. Guze BH, Baxter LR Jr, Schwartz JM, Szuba MP, Liston EH. Electroconvulsivetherapy and brain glucose metabolism. Convulsive Ther l99l;7:l5—l9.
29. NoblerM5,SackeimHA,Prohovnik1,et al. Regionalcerebralbloodflowin mooddisorders. III. treatment and clinical response. Arch Gen Psychiatry 1994;51:884—897.
30. American Psychiatric Association. Diagnostic and statistical manual of mentaldisorders,3rded.rev.Washington,DC: AmericanPsychiatricAssociation;1987.
31. Hamilton M. A rating scale for depression. J Neurol Neurosurg Psychiatry 1960;23:56—62.
32. Sackeim HA, Decina P. Prohovnik I, Malitz 5. Seizure threshold in ECT. Arch GenPsychiatryI987;44:355—360.
33. Talairach J, Zilkha 0, Tournoux P, et al. Atlas d ‘anatomiestereotactique dutelencephale.Masson;Paris: 1988.
34. Rubin RT, villanueva-Meyer J, Ananth J, Trajmar PG, Mena I. Regional xenon-133cerebral blood flow and cerebral technetium-99m-HMPAO uptake in unmedicatedpatients with obsessive-compulsive disorder and matched normal control subjects.ArchGenPsychiatry1992;49:695—702.
35. Baxter LR. Brain imaging as a tool in establishing a theory of brain pathology inobsessive-compulsive disorder. J Clin Psych 1990;51(suppl):22—25.
36. KongHF.Newtechnetium-99m-labeledbrainperfusionimagingagents.SeminNucIMed 1990;2:l50—158.
37. Mayberg HS, Lewis PJ, Regenold W, Wagner HN Jr. Paralimbic hypoperfission inunipolar depression. J Nuci Med 1994;3:929—934.
38. Robinson RG, Kubos KL, Starr LB. et al. Mood disorders in stroke patients:importance oflocation of lesion. Brain 1984;107:81—93.
39. Starkstein SE, Robinson RG, Price TR. Comparison ofcortical and subcortical lesionsin the production of post-stroke mood disorders. Brain 1987;l 10:1045—1059.
40. Grafman J, Vance SC, Weingartner H, et al. The effects of lateralized frontal lesionson mood regulation. Brain 1986; 109: 1127—1148.
41. Ross ED, Rush AJ. Diagnosis and neuroanatomical correlates of depression inbrain-damaged patients. Arch Gen Psychiatry 198I;39:l344—1354.
42. Altshuler LL, Devinsky 0, Post RM, Theodore W. Depression, anxiety and temporallobe epilepsy: laterality of focus and symptoms. Arch Neurol l990;47:284—288.
hematocrit ratio was obtained for both cerebral hemispheres in eachsubject. Resufts Mean regional cerebral hematocrit and meancerebral/large-vessel hematocrit ratio in the 12 normal volunteerswere 38.3 ±3.45% and 0.88 ±0.06, respectively. In the sevenpatients with cerebrovascular disease, regknal cerebral hematocritwas significanfly kwer on the hypoperfused skie than the normalhemisphere.The images of rCPV and rCRCV from these patientsdemonstrated a greater increase in rCPV than I'CRCV in the hypoperfused area. Conclusion: These results suggest that @CuHSA-DTScan be used formeasurement of plasma volumeand thatregionalcerebral hematocrit may provide valuable informationregardingthe microcirculationinthe braln.
Key Words PET;copper-62-labeled human serum albumin-dithiosemicarbazone; plasma volume; regional hematocrit
J NuciMed1996 37:1080-1085
We developedcopper-62-Iabeledhumanserum albumin-dithksemicarbazone (@Cu-HSA-DTS)as a blood-pool imaging agent forPET.To evaluate saCu@HSA@DTSfor plasma-pool imagingand tomeasure the regional cerebral hematocrit, 12 normal volunteers and7 patientswithcerebrovasculardiseaseunderwentPETstudieswith
@Cu-HSA-DTh and 150-labeled carbon monoxide (C150).Methods: The normal subjects were studied with both C150 and
@Cu-HSA-DTS.i@Jlpatientswereexaminedby 150-gasstudiestomeasure cerebral perfusion and oxygen metabolism, followed bymeasurement of plasma volume with @Cu-HSA-DTSfor analysis ofregional cerebral hematocrit. Regional cerebral hematocrit wascalculated from regional cerebral red cell volume (rCRCV)measuredby C150 and regionalplasmavolume(rCPV)measuredby @CuHSA-DTS in eath subject, and the regional cerebral,large-vessel
Received May 22, 1995; revision accepted Oct. 20, 1995.Fcrcorrespondenceorreprints contact H@et@koOkazawa, MD, Montreal Neuroleg@elInstitute,[email protected],Montreal,Quebec,
Canada H3A 2B4.
1080 THEJOURNALOFNUCLEARMEDICINE•Vol. 37 •No. 7 •July 1996
Measurement of Regional Cerebral Plasma Pool andHematocrit with Copper-62-Labeled HSA-DTSHidehiko Okazawa, YoshiharuYonekura,Yasuhisa Fujibayashi,Hiroshi Yamauchi, Koichi Ishizu, SadahikoNishizawa,Yasuhiro Magata,Nagara Tamaki, Hidenao Fukuyama,Akira Yokoyama and Junji KonishiFaculties ofMedicine and Pharmaceutical Sciences, Kyoto University, Kyoto; and Biomedical Imaging Research Center,Fukui Medical School, Fukui, Japan
by on February 2, 2018. For personal use only. jnm.snmjournals.org Downloaded from

Patient no. Age Sex Disease Timeafter onsetMRIfindings1
74 M RICAocclusion 2.2 yrSeveral lacunar infarcts, including right basalganglia263 M RICAocclusion 2 moSubcortical infarctionin rightfrontallobe362 F RICAocclusion 3.4 yrSome lacunarinfarctsand mild brainatrophy461 M UCAocclusion 2.5 yrSome lacunar infarctsin leftcerebralhemisphere5*61 F RICAocclusion >1 yrOcclusion ofRICA649 F RMCAocclusion 1 moSubcortical infarctionin righthemisphere769 M UCAocclusion 5.3yrLeft panetal infarction,includingcortex*Right
internalcarotid artery (RICA)occlusionwas found accidentallyon MRImore than 1yr before PETstudy.LICA= left internalcarotid artery;RMCA= rightmiddle cerebral artery.
The62ZnJ'@2Cupositrongeneratorhasbeenproposedasapossible source of generator-produced radiopharmaceuticals forpositron emission tomography (PET) studies without use of anin-house cyclotron (1 ), and copper (II) @yruva1dehyde bis(N4-methylthiosemicarbazone) labeled with 2Cu (62Cu-PTSM) hasbeen applied as a perfusion tracer (2—6). For the plasma-poolimaging agent, 62Cu-labeled human serum albuthiñ-dithiosemicarbazone(62Cu-HSA-DTS)(7) andbenzyl-1,4,8,11-tetraaza
an' ‘-tetraacetic acid-albumin (62Cubenzyl-TETA-HSA) (8) were developed and investigated.Measurement of plasma volume and red cell volume enablesestimation ofthe regional cerebral hematocrit (Hct), and severalsuch investigations in the human brain have been reported(9—14). In tomographic measurement of cerebral Hct in humanbrain, the regional cerebral/large-vessel Hct ratio (Hct ratio: r)was reported to be 0.69 in a PET study by Lammertsma et al.(11 ), 0.76 in a SPECT study by Sakai et al. (12) and 0.87 in aSPECT study of normal subjects by Loutfi et al. (14).
In the present study, 62Cu-HSA-DTS was used as a cerebralplasma volume imaging agent, and regional cerebral Hct wasmeasured with this agent and 150-labeled carbon monoxide(C150) in normal volunteers and patients with cerebrovasculardisease. In the normal subjects, we sought to confirm thenormal cerebral Hct ratio using 62Cu-HSA-DTS and to evaluatethe feasibility of measurement of regional cerebral Hct in aclinical study. In the patients, the chronic stage of cerebrovascular disease was investigated and compared with the acutestage of stroke reported previously (14,15).
MATERIALS AND METhODS
Preparation of Copper-62-HSA-DTSA 62Zn/62Cu generator was prepared with 62ZnCl2 aqueous
solution (1 . 1 GBq, pH 5.0), and HSA-DTS was synthesized by themethod reported previously (7, 16). The 62Cu labeling of HSA-DTSwas performed by simple mixing of 4 ml of an HSA-DTS solution(5 mg/ml in saline buffer [pH 6.0]) and 4 ml of the 62Cu generatoreluate. The 62Cu-HSA-DTS was easily obtained by a ligandexchange reaction (7).
SubjectsThe study included 12 normal male volunteers (24—46 yr old)
and 7 patients with cerebrovascular disease confirmed by angiography (Table 1). All 12 normal subjects were studied with both‘50-labeled carbon monoxide (C'50) and 62Cu-HSA-DTS byblood sampling from the cubital vein. Six ofthe 12 normal subjectsalso underwent a ‘50-labeled water study to obtain cerebral bloodflow (CBF) images. All seven patients underwent ‘5O-gasstudiesto measure cerebral perfusion and oxygen metabolism with arterialblood sampling and a 62Cu-HSA-DTS study to measure regionalplasma volume for analysis of regional Hct. The PET study was
carried out under the guidance of the Ethical Committee of theFaculty of Medicine of Kyoto University, and written informedconsent was obtained from all subjects before the study.
PET ImagesPET images were obtainedfrom a scanner(6,17) thatpermits
simultaneousacquisitionof 15 transversesliceswitha center-tocenter distance of 7 mm. All scans were performed at a resolutionof9-mm FWHM in the transaxial direction and 6.5 mm in the axialdirection. The field of view and pixel size of the reconstructedimages were 256 and 2 mm, respectively.
The subject's head was immobilized with a head-holder. Thehead was positioned with light beams to obtain transaxial slicesparallel to the orbitomeatal (OM) line. In the normal volunteers, asmall cannula was placed in the cubital vein contralateral to theadministration side of the tracer. In the patients, a small cannulawas placed in the brachial artery. Before all emission measurements, tomographic transmission data were obtained using astandard plate source of 68Ge/@8Gafor attenuation correction. Thetissue activity concentration in the PET images was cross-calibrated against a scintillation counter using a cylindrical phantomfilled with ‘8Fsolution.
For the ‘5O-gasstudy in the patients, ‘50-labeledcarbon dioxidel @O2)and molecular oxygen (l @O2)were inhaled continuously at
300 and 500 MBq/min, respectively, and the scan time was 5 mm.The C'50 was inhaled as a single dose of 1200 MBq, and the PETscan was started 30 sec after the arrival of the peak count of thebrain tissue and continued for 3 mm. Arterial blood was sampledthree times during each scan of the@ @O2and@ @O2studies andtwice for the C'50 study. For the C'50 study in the normalsubjects, venous blood was sampled as in the study of the patients.The blood samples thus obtained were immediately measured withthe scintillation counter to determine arterial radioactivity. TheCBF,oxygenextractionfraction(OEF)andcerebralmetabolicrateof oxygen (CMRO2) were obtained by the steady-state method(18). The cerebral blood volume (CBV) was calculated from theC'50 scan data and was incorporatedinto the correctionof thevascular space for CMRO2 and OEF (19). In the calculation ofCBV, a conventional Hct ratio of 0.85 was used.
To obtain plasma volume images, 296—740MBq (8—20mCi) of62Cu-HSA-DTS was injected intravenously over 15 sec in a totalvolume of 8 ml. PET data acquisition was started 3 mm afteradministration of 62Cu-HSA-DTS and continued for 8 mm. Bloodsamples were obtained at 1, 5 and 7 mm after injection of62Cu-HSA-DTS, and both whole-blood and plasma radioactivitywere counted. In six normal subjects, a CBF image with relativevalues was obtained by a noninvasive method with@ 50-water (20)15 mm before the 62Cu-HSA-DTS study for reference in selectingthe regions of interest (ROIs).
TABLE IClinical Characteristics of Seven Patients with Cerebrovascular Disease
CLINICAL APPLICATION OF C0PPER-62-HSA-DTS •Okazawa et al. 1081
by on February 2, 2018. For personal use only. jnm.snmjournals.org Downloaded from
62Cu-HSA-DTS
@ nCi/ml.‘ .e@ @• .200
a.
@ @1h,I
C@@
C150 0
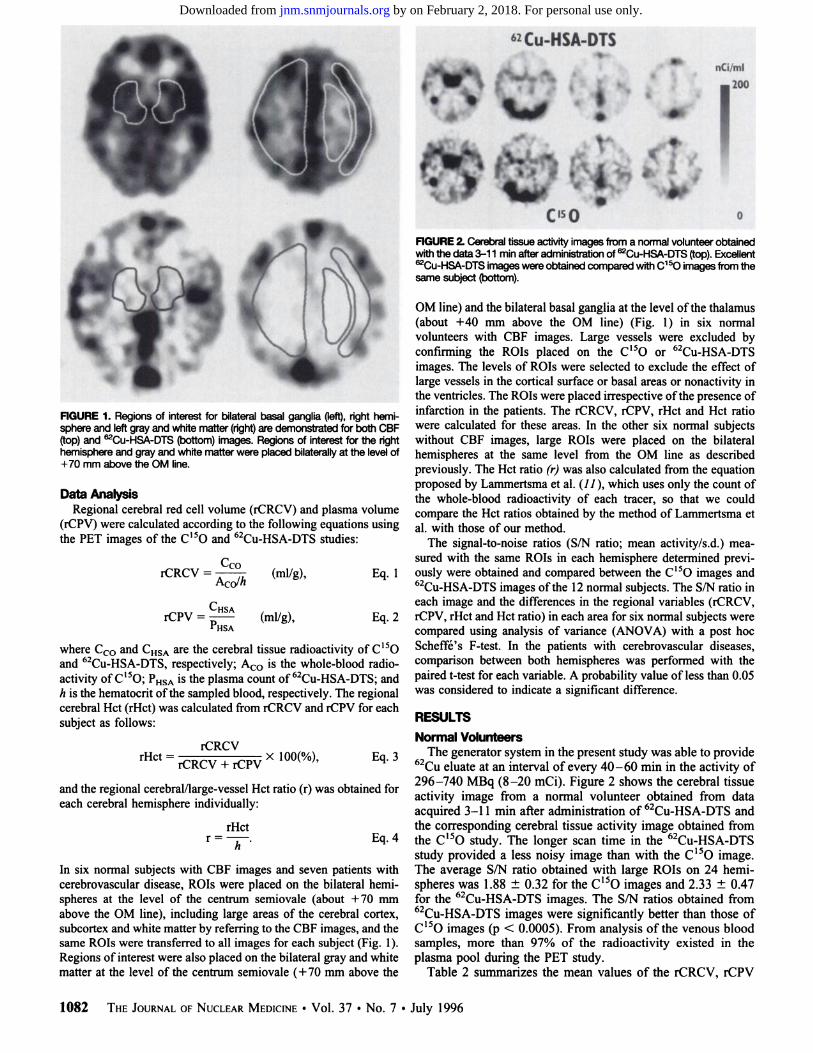
FIGURE2.Cerebraltissueactivityimagesfroma normalvolunteerobtainedwith the data 3-1 1 mm after administration of@Cu-HSA-DTS (top). Excellent
@Cu-HSA-DTSimageswereobtainedcompared wfthC150imagesfromthesame subject (bottom).
OMline)andthebilateralbasalgangliaatthe level ofthe thalamus(about +40 mm above the OM line) (Fig. 1) in six normalvolunteers with CBF images. Large vessels were excluded byconfirmingthe ROIs placed on the C'50 or 62Cu-HSA-DTSimages. The levels of ROIs were selected to exclude the effect oflarge vessels in the cortical surface or basal areas or nonactivity inthe ventricles. The ROIs were placed irrespective ofthe presence of
FiGURE 1. Regions of interest for bilateralbasal ganglia Qeft),righthemi- infarction in the patients. The rCRCV, rCPV, rHct and Hct ratiosphere and leftgrayand whitematter (right)are demonstrated for both CBF were calculated for these areas. In the other six normal subjects(top)and @Cu-HSA-DTS(bottom)images. Regionsof interestfor the right without CBF images, large ROIs were placed on the bilateralhemisphereand grayand whitematterwere placed bilaterallyat the levelof hemispheres at the same level from the OM line as described
+70 mm above the OM line. previously. The Hct ratio (r) was also calculated from the equation. proposed by Lammertsma et al. (11 ), which uses only the count of
Data AnalysIs the whole-bloodradioactivityof eachtracer, so that we couldRegional cerebral red cell volume (rCRCV) and plasma volume compare the Hct ratios obtained by the method of Lammertsma et
(rCPV) were calculated according to the following equations using al. with those of our method.
the PET images of the C'5O and 62Cu-HSA-DTS studies: The signal-to-noise ratios (S/N ratio; mean activity/s.d.) meaCCO sured with the same ROIs in each hemisphere determined previ
rCRCV = h (ml/g), Eq. 1 ously were obtained and compared between the C'5O images andACO/ 62Cu-HSA-DTS images ofthe 12 normal subjects. The S/N ratio in
CHSA each image and the differences in the regional variables (rCRCV,rCPV = (mllg), Eq. 2 rCPV, rHct and Hct ratio) in each area for six normal subjects were
PHSA compared using analysis of variance (ANOVA) with a post hoc
where CCOand CHSAare the cerebral tissue radioactivity of C'50 Scheffé'sF-test. In the patients with cerebrovascular diseases,and 62Cu-HSA-DTS, respectively; A@ is the whole-blood radio- comp@@sonbetween both hemispheres was performed with theactivity of C'5O; @HSAis the plasma count of 62Cu-HSA-DTS; and paired t-test for each variable. A probability value ofless than 0.05
h is the hematocrit of the sampled blood, respectively. The regional was considered to indicate a significant difference.cerebral Hct (rHct) was calculated from rCRCV and rCPV for eachsubject as follows: RESULTS
Normal VolunteersrHct = rCRCV@ lOO(%) Eq. 3 The generator system in the present study was able to provide
rCRCV + rCPV ‘ 62Cu eluate at an interval of every 40—60mm in the activity of. . . 296—740 MBq (8—20 mCi). Figure 2 shows the cerebral tissue
and the regional cerebral/large-vessel Hct ratio (r) was obtained for . . .. . . . activity image from a normal volunteer obtained from data
each cerebral hemisphere individually: . . . . . 62acquired 3—11 mm after administration of Cu-HSA-DTS and
rHct the corresponding cerebral tissue activity image obtained fromr = —h-—. Eq. 4 the C'50 study. The longer scan time in the 62Cu-HSA-DTS
study provided a less noisy image than with the C'50 image.In six normal subjects with CBF images and seven patients with The average S/N ratio obtained with large ROIs on 24 hemicerebrovascular disease, ROIs were placed on the bilateral hemi- spheres was 1.88 ±0.32 for the C'50 images and 2.33 ±0.47spheres at the level of the centrum semiovale (about +70 mm for the 62Cu-HSA-DTS images. The S/N ratios obtained fromabove the OM line), including large areas of the cerebral cortex, 62Cu-HSA-DTS images were significantly better than those ofsubcortex and white matter by referring to the CBF images, and the C'5O images (p < 0.0005). From analysis of the venous bloodsame ROIs were transferred to all images for each subject (Fig. 1). samples, more than 97% of the radioactivity existed in theRegions of interest were also placed on the bilateral gray and white plasma pool during the PET study.matter at the level of the centrum semiovale (+70 mm above the Table 2 summarizes the mean values of the rCRCV, rCPV
1082 THEJOURNALOFNUCLEARMEDICINE•Vol. 37 •No. 7 •July 1996
by on February 2, 2018. For personal use only. jnm.snmjournals.org Downloaded from

Measure RighthemisphereLefthemisphereMeanrCRCV
(mVlOOg) 0.98 ±0.160.97 ±0.110.98 ±0.14rCPV(mVlOO g) 1.59 ±0.261.57 ±0.221.58 ±0.24Cerebral
Hct (%) 38.2 ±3.7138.3 ±3.3838.3 ±3.45Hctratio 0.87 ±0.060.88 ±0.050.88±0.06*Data
are mean value ±s.d. at slice level70 mm above the orbitomeatalline.rCRCV= regionalcerebral red cellvolume;rCPV= regionalcerebral plasma volume;Hct= hematocrft@
(mlIIts)g)
0S@
$.4
F@@ S.
0.6rCRCV rCP@' Hct ratio
FiGURE3. Mean values of rCRCV,rCPVand Hct ratio in the gray matter,white matter and basal ganglia in six normal subjects (mean ±s.d.). TherCRCVand rCPVvalues were significanilylowerin the whitematter than inthe cortex or basal ganglia.The Hctratiowas significantlygreaterinthe basalgangliathaninthe grayorwhitematter.*p< 0.05, tp < 0.0001 byanalysisof vanance.
and regional Hct obtained from 24 ROIs on the cerebralhemispheres of the 12 normal volunteers. The average regionalcerebral Hct was 38.3 ±3.45% and the mean cerebral/largevessel Hct ratio was 0.88 ±0.06. No significant difference wasfound between the right and left hemispheres. The resultobtained with the method of Lammertsma et al. (11 ) was0.88 ±0.07 for the cerebral/large-vesselHct ratio, and nosignificant difference was observed compared with our method.In the sinuses, the mean Hct ratio was 1.03 ±0.05.
Table 3 shows the normal values of the rCRCV, rCPV,regional cerebral Hct and Hct ratio in the gray matter, whitematter and basal ganglia obtained from six healthy volunteers.Although the average rCRCV and rCPV values were greater inthe gray matter than in the white matter, the regional Hct andHct ratios were similar in both areas. No significant differencesbetween the right and left were seen in any area. Figure 3displays the average rCRCV, rCPV and Hct ratio for each areaand the differences among those areas. The rCRCV and rCPVvalues were significantly smaller in the white matter than in thecortex or basal ganglia.No significantdifferenceswere foundbetween the gray matter and the basal ganglia. However, theHct ratio in the basal ganglia was significantly greater than inthe gray or white matter.
PatientsTable 4 summarizes the mean values of each variable in
hypoperfused and normal hemispheres in the seven patients.Increases in the CBV, OEF, rCRCV and rCPV and decreases inthe CMRO2 and cerebral Hct were seen in the hypoperfusedhemispheres. Significant differences were seen in the CBF,OEF, rCPV, cerebral Hct and Hct ratio (p < 0.05, paired t-test).Figure 4 demonstrates a greater increase in rCPV than rCRCVin the hypoperfused area of a patient with occlusion of the leftinternal carotid artery (ICA).
TABLE 2Regional Cerebral Red Cell Volume, Regional Plasma Volume and Hematocrit in 12 Healthy Volunteers*
CLINICAL APPLICATION OF C0PPER-62-HSA-DTS •Okazawa et al. 1083
Left ICAOcdusioni.0
rCBFe.g ,
‘ . .@ . ‘S.,,
•1 @&.@ ‘ .
\J.@ I-.,. ml@00g
@ @,
FCRCY
@ 0
FiGURE4. Images showing CBF, rCRCVand rCPVin a patientwith left ICAocclusion. Note the greater increase in rCPVthan rCRCVin the hypoperfused area.
DISCUSSION
Feasibility of Plasma-Pool ImagingThe major purpose of the present study was to evaluate the
clinical feasibility of 62Cu-HSA-DTS for PET imaging. Copper-62-HSA-DTS is considered an important tracer for plasmapool imaging not only in PET centers without an in-housecyclotron, but also in those with a cyclotron for measuringregional cerebral Hct. Copper-62-HSA-DTS can be easilylabeled, and its image quality was excellent compared with theCBV image obtained by the C'50 bolus inhalation methodbecause of its longer physical half-life (9.74 mm) and longerscanning time. In fact, the S/N ratio of the 62Cu-HSA-DTSimages was greater than that of the C150 images. The scan inthe °2Cu-HSA-DTSstudy started at 3 mm after the injection andlasted for 8 mm because the half-life was approximately 10 mm,and a longer scan time than that used in the present study wasnot considered to provide better image quality. A previous invivo study in rabbits found that the blood clearance of 62CuHSA-DTS was similar to that for 131I-HSA,a well-establishedradiopharmaceutical for plasma volume studies, and the radioactivity in the blood was almost stable from 5 to 15 mm (7).Although the stability of62Cu-HSA-DTS in the plasma was notmeasured in the present study, more than 97% of the bloodactivity was counted in the plasma for 11 mm after the injection,indicating excellent characteristics for plasma-pool imaging.Combination of 62Cu-HSA-DTS and C'50 makes it possible toeasily measure the rCPV, rCRCV and regional cerebral Hct byPET.
Regional Cerebral HematocritThe second purpose of the present study was to measure the
regional cerebral Hct in normal subjects and in patients with
by on February 2, 2018. For personal use only. jnm.snmjournals.org Downloaded from

rCRCVrCP@/RegionalRegion(mVlOO g)(mVlOO g)Hct (%) Hct ratio
Measure Occlusionside p value* Normalside
*Pairedt-test, occlusionside versus normalside.CBF = cerebral blood flow; CBV = cerebral blood volume; ns = not
significant;CMRO2= cerebral metabolic rate of oxygen; OEF = oxygenextraction fraction; rCRCV = regional cerebral red cell volume; rCPV =regional cerebral plasma volume Hct = hematocrit.
TABLE 3Regional Cerebral Red Cell Volume, Regional Cerebral Plasma
Volume and Regional Cerebral HematocritRatio in Six Healthy Volunteers*
however, the regional Hct and Hct ratio were larger than that inthe gray and white matter. In this area, the blood pool in largevessels might affect the brain tissue count. However, the mainreason for this result was the lower rCPV in the basal gangliathan in the other cortices despite the similar value for therCRCV (Table 3). Ifthe radioactivity in the large vessels affectsthe tissue count, the values of rCPV should also be affected. Asignificant difference was found between the gray matter andthe basal ganglia when the values of rCPV were compared bythe paired t-test, whereas no difference was seen in the valuesof rCRCV. With our method, the CBV image can be calculateddirectly by simple addition of the rCRCV and rCPV imageswithout correction for the inhomogeneity of the regional Hctratio in the brain.
Regional Hematocrit in Cerebrovascular DiseaseIn the patients with cerebrovascular disease, significant
decreases in the regional cerebral Hct and Hct ratio wereobserved in the hypoperfused side compared with the normalside. Although the Hct ratio in the normal hemisphere wasslightly higher than the mean value in the normal subjects, theHct ratios of the patients were calculated using the Hct ofarterial blood samples. The average Hct values ofthe peripheralarterial blood and venous blood in the seven patients were35.8 ±1.63% and 37.3 ±1.73%, respectively. If the Hct ratioof the patients is corrected with the mean values of the arterialand venous Hct, the Hct ratio on the normal side is 0.86.Further, the Hct ratio on the occluded side is corrected to be0.82, which is significantly lower than the normal side. Thedecrease in the regional Hct on the occluded side was caused bythe significant increase in rCPV and almost stable rCRCV(Table 4). Because all seven patients were in the chronic phaseof major vascular occlusion at least 1 mo after onset, it is notlikely that there was leakage of 62Cu-HSA-DTS across theblood-brain barrier (BBB) into the brain parenchyma, causingan increase in the regional retention of the tracer. In fact, allpatients but one had no major infarction, and the affectedhemispheres were not enhanced on the CT or MRI study in anyof the patients. Compensation for oxygen metabolism seemedto have occurred because no significant decrease in CMRO2was observed on the occluded side. In the report of Loutfi et al.(14), a significantly higher regional Hct value was observed onthe affected side in three ofeight patients with stroke. However,their study was performed in the acute phase of ischemic attack,which was different from our study, and four of eight patients
TABLE 4Regional Cerebral Blood Flow, Cerebral Blood Volume, Oxygen
Metabolism and Hematocrit in Seven Patients withCerebrovascular Disease (mean ±s.d.)
Rightgray matterLeft gray matterMean1
.30 ±0.271.33 ±0.271.31 ±0.262.21
±0.422.26 ±0.472.23 ±0.4337.0
±4.537.1 ±3.737.0 ±3.90.85
±0.080.85 ±0.060.85 ±0.07Right
whitematterLeft white matterMean0.74
±0.120.71 ±0.120.72 ±0.121.23
±0.261.22 ±0.191.23 ±0.2237.6
±3.136.7 ±4.037.2 ±3.40.87
±0.070.84 ±0.070.86 ±0.07Right
basal gangliaLeftbasalgangliaMean •1
.35 ±0281.36±0.331.35 ±0.222.04
±0.281.99±0.332.02 ±0.3139.9
±2.440.4±2.540.2 ±2.40.92
±0.040.93±0.040.92±0.04
*D@*@are mean value ±s.d.; slice levels were 70 mm above theorbitomeatal line in gray and white matter and 40 mm above in basal ganglia.
rCRCV= regionalcerebral red cell volume;rCPV = regionalcerebralplasma volume;Hct = hematocrit.
cerebrovascular disease. Previous studies have reported cerebral Hct to be smaller than that of large vessels (9—15),and aregional cerebral/large-vessel Hct ratio (r) ofO.85 has generallybeen accepted for correction ofthe cerebral Hct in measurementof the rCBV by PET with C'5O as a marker of the red cellvolume (21,22). Recently, several investigators reported theHct ratio to be smaller than 0.85 when measured by PET orSPECT (11—13).Although Lammertsmaet al. (11) reportedthat the mean Hct ratio in nine subjects was 0.69 ±0.07, exceptfor one normal subject, the subjects were all patients with abrain tumor or cerebrovascular disease. The greatest number ofnormal subjects was studied by Sakai et al. (12) using SPECT,and they reported an Hct ratio of 75.9 ±2.1% for 10 healthysubjects, which was approximately 10% lower than 85%. In thepresent study, the mean Hct ratio was 0.88 ±0.06 for the 24normal cerebral hemispheres of the 12 normal subjects, whichwas greater than 0.85, and r was 1.03 ±0.05 in the sinuses. Ifthe Hct in the sinuses is considered to be the same as that in themajor vessels, the cerebral Hct ratio is corrected to 0.85. Thecerebral activity and cerebral/blood ratio may change within thefirst 10 mm (11 ); thus, the earlier scan timing in the presentstudy may have caused the difference in the Hct ratio. However,the Hct ratio of almost 1.0 in the sinuses seems to validate theaccuracy ofour methods. Loutfi et al. (14) reported the cerebralHct ratio in three normal subjects (six hemispheres) to be0.81—0.90(mean 0.87 ±0.03) and 0.94—1.00in the sinuses,consistent with our findings. In addition, they reported that themean Hct ratio in 15 patients with cerebrovascular disease was0.77 ±0.07 in 30 cerebral hemispheres and 0.85 ±0.06 in thesinuses. By performing correction using r in the sinuses, the Hctratio of patients in their study was 0.90. The correction for theHct in the sinuses is considered to be a reasonable method formeasurement of the cerebral Hct. The calculations with themethod of Lammertsma et al. (11 ) using the data of presentstudy revealed results similar to those calculated by our method.Although our method requires measurement of plasma count,both rCRCV and rCPV can be measured directly, and calculation of the regional cerebral Hct is simple.
No differences were observed in the rHct or Hct ratio in thegray matter and white matter at the level of the centrumsemiovale in the six healthy subjects. This result is consistentwith the report of Lammertsma et al. (11). In the basal ganglia,
CBF(mVmin/100g)25.6 ±6.77<0.0530.3 ±6.57CBV(mVlOOg)2.93 ±0.76ns2.80 ±0.49CMRO2
(mVmin/100g)1 .82 ±0.29ns2.04 ±0.32OEF0.45±0.06>0.050.42 ±0.05rCRCV
(mVlOOg)0.87 ±0.12ns0.86 ±0.18rCPV(mVlOOg)2.01 ±0.33>0.051 .81 ±0.26Cerebral
Hct (%)30.4 ±423<0.0532.2 ±5.25Hctratio0.85 ±0.05<0.050.90 ±0.08
1084 THEJOURNALOFNUCLEARMEDICINE•Vol. 37 •No. 7 •July 1996
by on February 2, 2018. For personal use only. jnm.snmjournals.org Downloaded from

with stroke and six of six patients with a transient ischemicattack showed no significant difference between both hemispheres. One patient in their study underwent SPECT twice, inthe acute and subacute phases (1 and 6 days, respectively, afterthe onset of stroke). The affected hemisphere showed a significantly higher regional cerebral Hct than the uninvolved hemisphere in the acute phase, but in the subacute phase it decreasedto a value similar to that in the uninvolved hemisphere. Anotherpatient with multi-infarct dementia in the study of Lammertsmaet al. (11 ) showed a lower Hct ratio than the other patients (r =0.59). In the chronicphase,sufficientcompensationfor cerebralischemia might cause an increase in rCPV, which may decreaseblood viscosity and improve the microcirculation. Further studyof cerebrovascular disease is needed to elucidate the details ofthe cerebral microcirculation.
Possible LimitationsThere are some limitations on the use of 62Cu-HSA-DTS for
measuring plasma volume and regional cerebral Hct. One is thepossibility of leakage of this compound into the cerebralparenchyma in the case of acute injury or a brain neoplasm,where the BBB may not be intact. In the case of such leakage,rCPV may increase and Hct may decrease in the affected areascompared with the areas where the BBB is intact. Anotherlimitation is that the short half-life of 62Cu (10 mm) does notpermit a longer scanning time. Because the method assumes anequilibrium state in the vascular space after administration ofthe tracer, the scanning time in the present study might be tooearly, especially in diseased areas such as a vascular-rich tumor.To clarify the scope of these limitations, further investigation isneeded using ‘‘COand dynamic PET imaging.
CONCLUSIONThe results in both normal subjects and patients with cere
brovascular disease demonstrated the possibility of heterogeneity in regional cerebral Hct and the Hct ratio (r), even in theglobal comparison of hemispheres. These findings suggest thatmeasurement of the regional Hct may provide useful information for assessment ofthe cerebral circulation. Copper-62-HSADTS appears to be useful for measurement of the plasmavolume and regional Hct in clinical studies.
ACKNOWLEDGMENTSWe thank Y. Ouchi, MD, and Y. Nagahama, MD, for their
invaluable clinical assistance and suggestions, and Mr. H. Kitanoand Mr. H. Taniuchi for their excellent technical assistance.
REFERENCES1. Robinson GD, Zielinski FW, Lee AW. The zinc-62/copper-62 generator: a convenient
source of copper-62 radiopharmaceuticals. mt i Appl Radiat Isot l980;3l:l 11—116.
2. Green MA. A positron copper radiopharmaceutical for imaging the heart and brain:copper-labeled pyruvaldehyde bis(N4-methylthiosemicarbazone). NuclMedBiol 1987;14:59—61.
3. Green MA, Klippenstein DL, Tennison JR. Copper(1I) bis(thiosemicarbazone) cornplexes as potential tracers for evaluation of cerebral and myocardial blood flow withPET. JNucl Med 1988;29:1549—1557.
4. Mathias Ci, Welch MJ, Raichle ME, et al. Evaluation of a potential generatorproduced PET tracer for cerebral perfusion imaging: single-pass cerebral extractionmeasurements and imaging with radiolabeled Cu-PT5M. J NucI Med 1990;31:351—359.
5. Green MA, Mathias CJ, Welch MJ, et al. Copper-62-labeled pyruvaldehyde bisfN4-methylthiosemicarbazonato)copper(II): synthesis and evaluation as a positron emissiontomography tracer for cerebral and myocardial perfusion. J Nuci Med l990;31:1989-1996.
6. Okazawa H, Yonekura Y, Fujibayashi Y, et al. Clinical application and quantitativeevaluation of generator-produced 62Cu-PTSM as a brain perfusion tracer for PET.JNucl Med 1994;35:l910—1915.
7. Fujibayashi Y, Matsumoto K, Arano Y, Yonekura Y, Konishi J, Yokoyama A.62Cu-labeling of human serum alburnin-dithiosemicarbazone (HSA-DTS) conjugatefor regional plasma volume measurement: application of new 62Zn/@2Cugeneratorsystem. Chem Pharm Bull (Tokyo) 1990;38:l946—I948.
8. Mathias Ci, Welch MJ, Green MA, et al. In vivo comparison of copper blood-poolagents: potential radiopharmaceuticals for use with copper-62. J NucI Med 1991;32:475—480.
9. Larsen OA, Lassen NA. Cerebral hematocrit in normal man. J App! Physiol1964;19:571—574.
10. Oldendorf WH, Kitano M, Shirnizu 5, Oldendorf SZ. Hematocrit of the human cranialblood pool. Circ Res 1965;17:532—539.
11. Larnmertsrna AA, Brooks Di, Beaney RP, et al. In vivo measurement of regionalcerebral hematocrit using positron emission tomography. J Cereb Blood Flow Metab1984;4:3I7—322.
12. Sakai F, Nakazawa K, Tazaki Y, et al. Regional cerebral blood volume and hernatocntmeasured in normal human volunteers by single-photon emission computed tomography.J CerebBloodFlow Metab 1985;5:207—213.
13. Brooks Di, Beaney RP, Lammertsma AA, et al. Studies on regional cerebralhematocrit and blood flow in patients with cerebral tumors using positron emissiontomography. Microvasc Res 1986;31:267—276.
14. Loutfi I, Frackowiak RSJ, Myers MJ, Lavender JP. Regional brain hematocrit in strokeby single-photon emission computed tomography imaging. Am J Physiol Imaging1987;2:10—16.
15. Frackowiak RSJ. Measurement of local hematocrit, energy metabolism and hemodynamics in cerebral ischemia with positron tomography. Acta Neurol Scand 1989;l27(suppl): i4—21.
16. Fujibayashi Y, Matsumoto K, Yonekura Y, Konishi J, Yokoyama A. A newzinc-62/copper-62 generator as a copper-62 source for PET radiopharmaceuticals.JNuclMed i989;30:1838—I842.
17. Sadato N, Yonekura Y, Senda M, Ct al. PET and the autoradiographic method withcontinuous inhalation of oxygen-l5-gas: theoretical analysis and comparison withconventional steady-state methods. J Nuci Med 1993;34:1672—l680.
18. Frackowiak RSJ, Lenzi GL, Jones T, Heather JD. Quantitative measurement ofregional cerebral blood flow and oxygen metabolism in man using ‘@Oand positronemission tomography: theory, procedure and normal values. J Comput Assist TomogrI980;4:727—736.
19. Lammertsma AA, Jones T. Correction for the presence of intravascular oxygen-l5 inthe steady-state technique for measuring regional oxygen extraction ratio in the brain:1. Description of the method. J Cereb Blood Flow Metab 1983;3:416—424.
20. Sadato N, Yonekura Y, Sends M, et al. Noninvasive measurement ofregional cerebralblood flow change with H215O and positron emission tomography using a mechanicalinjector and a standard arterial input function. IEEE Trans Med Imag 1993;MI-l2:703—710.
21. Phelps ME, Grubb RL, Ter-Pogossian MM. Correlation between PaCO2 and regionalcerebral blood volume by x-ray fluorescence. J App! Physiol 1973;35:274—280.
22. Phelps ME, Huang SC, Hoffman El, KuhI DE. Validation of tomographic measurement ofcerebral blood volume with@ ‘C-labeledcarboxyhemoglobin. J NucI 1979;20:328—334.
[email protected] C0PPER-62-HSA-DTS •Okazawa et al. 1085
by on February 2, 2018. For personal use only. jnm.snmjournals.org Downloaded from

1996;37:1080-1085.J Nucl Med. Yasuhiro Magata, Nagara Tamaki, Hidenao Fukuyama, Akira Yokohama and Junji KonishiHidehiko Okazawa, Yoshiharu Yonekura, Yasuhisa Fujibayashi, Hiroshi Yamauchi, Koichi Ishizu, Sadahiko Nishizawa, Copper-62-Labeled HSA-DTSMeasurement of Regional Cerebral Plasma Pool and Hematocrit with
http://jnm.snmjournals.org/content/37/7/1080This article and updated information are available at:
http://jnm.snmjournals.org/site/subscriptions/online.xhtml
Information about subscriptions to JNM can be found at:
http://jnm.snmjournals.org/site/misc/permission.xhtmlInformation about reproducing figures, tables, or other portions of this article can be found online at:
(Print ISSN: 0161-5505, Online ISSN: 2159-662X)1850 Samuel Morse Drive, Reston, VA 20190.SNMMI | Society of Nuclear Medicine and Molecular Imaging
is published monthly.The Journal of Nuclear Medicine
© Copyright 1996 SNMMI; all rights reserved.
by on February 2, 2018. For personal use only. jnm.snmjournals.org Downloaded from