measurement of hydroquinone - health and safety executive · hplc using a zorbax cn column (25cm x...
TRANSCRIPT

Harpur Hill, Buxton Derbyshire, SK17 9JN T: +44 (0)1298 218000 F: +44 (0)1298 218590 W: www.hsl.gov.uk
Measurement of Hydroquinone
HSL/1998/02
Author: Emma Scobbie
Science Group: Environmental Measurement
© Crown copyright (1998)

SUMMARY
OBJECTIVES
The aim of this project was to investigate a method for the measurement of hydroquinone inair, in order to be able to demonstrate compliance with the proposed occupational exposurelimit (OEL).
MAIN FINDINGS
As hydroquinone may occur in both the vapour and particulate phases, effective samplingrequires a combination of a particle collector and a vapour collector. The sampler evaluatedwas a glass fibre filter contained in a multi-holed sampler which collects the particulatebacked up with a tenax tube to collect any vapour. The samples were desorbed intoacetonitrile and analysed by High Performance Liquid Chromatography (HPLC). Thismethod was shown to be effective at measuring hydroquinone over the range 0.1 to 2 timesthe target exposure limit of 0.5 mg/m3 for 8 hours.
MAIN RECOMMENDATIONS
The following recommendations are made for sampling and analysis of airbornehydroquinone;
SAMPLING - Air samples are taken onto glass fibre filters with back-up tenax tubes at aflow rate of 2 l/min.
ANALYSIS - The filters and tenax tubes are immediately desorbed into acetonitrile andanalysed by HPLC.

CONTENTS
PAGE
1. INTRODUCTION 1
2. OVERVIEW OF THE PROJECT 1
3. EVALUATION PROCEDURE 2
4. ANALYTICAL METHOD 2
5. MEASUREMENT RANGE 3
6. EVALUATION OF METHOD FOR HYDROQUINONE 3
6.1 Determination of desorption efficiency 3
6.1.1 Experimental 3
6.1.2 Results 3
6.1.3 Conclusions 4
6.2 The effect of temperature, humidity and concentration - preliminary
study 4
6.2.1 Experimental 4
6.2.2 Results 5
6.2.3 Conclusions 6
6.3 The effect of temperature, humidity and concentration - further
experiments 6
6.3.1 Experimental 6
6.3.2 Results 7
6.3.3 Conclusions 7

6.4 Storage 8
6.4.1 Experimental 8
6.4.2 Results 8
6.4.3 Conclusions 10
7. OVERALL UNCERTAINTY 10
8. FIELD TRIALS 11
7.1 Field trial 1 11
7.2 Field trial 2 11
9. DISCUSSION AND CONCLUSIONS 12
10. REFERENCES 13
APPENDIX 1 DETECTION AND QUANTIFICATION LIMITS 15

1. INTRODUCTION
The main purpose of this work was to investigate methods for measuring personal exposureto hydroquinone and to demonstrate the adequacy of the developed method to cope withproposed occupational exposure limits. The target occupational exposure limit (OEL) wastaken as 0.5 mg/m3 (8 hour time weighted average, TWA).
Exposure to hydroquinone can cause skin irritation and sensitisation, and irritation to theeyes, nose and throat (HSC, 1995). Hydroquinone has also been shown to be mutagenic inanimals and a no-adverse-effect-level cannot be identified in humans. Acute poisoning cancause dizziness, headache, unconsciousness, low temperature, tinnitus, breathing difficultiesand a fast or feeble pulse. Hydroquinone is classified on the Approved Supply List(Chemicals (Hazard Information and Packaging) Regulations, 1994) as harmful and islabelled with risk phrases R20 and R22 : harmful by inhalation and if swallowed.
Hydroquinone is likely to occur in both the vapour and particulate phases in someatmospheres (Perez and Soderholm, 1991). It is subject to auto-oxidation in the presence oftrace amounts of oxygen and can be oxidised easily in the presence of water vapour to formbenzoquinone which is more volatile than hydroquinone. It is also oxidised when exposed tolight.
Hydroquinone is used as a developer in black and white photography; an antioxidant for fatsand oils; a polymerization inhibitor; a stabilizer in paints, varnishes, motor fuels, oils; anintermediate for rubber-processing chemicals; in the production of mono- and dialkyl-ethers;and as a depigmenting agent. In the photographic industry exposure to hydroquinone dust andsolutions may occur during the manufacture of developers, and exposure to aerosols andmists containing hydroquinone may occur during bottle-filling. In other industrieshydroquinone dust in the air is the major source of potential exposure.
Although some methods to measure exposure to hydroquinone have been published in theliterature they have not been used by HSE and have not been fully validated.
2. OVERVIEW OF THE PROJECT
A search of the literature indicated several possible methods for the measurement ofhydroquinone (Gattrell and Kirk, 1987; Huang et al, 1984; Levin, 1988; NIOSH, 1984;Risner, 1990; Risner and Cash, 1990). Hydroquinone may occur in both the vapour andparticulate phases in some atmospheres (Perez and Soderholm, 1991) and the possibility alsoexists for oxidation to benzoquinone, present in vapour form. MDHS 14/2 (HSE, 1997)recommends personal samplers for total inhalable dust. Only one of the methods found in theliterature (Levin, 1988) involves sampling for both vapour and particulate, but does not use asampler recommended in MDHS 14/2 or distinguish between hydroquinone andbenzoquinone.
1

The multi-orifice sampler recommended in MDHS 14/2 was used in this study, containing aglass fibre filter at a flow rate of 2 l/min. A back-up adsorbent tube was used behind the filterhead to collect any hydroquinone or benzoquinone which may be present in the vapour phase.
Analysis was carried out by High Performance Liquid Chromatography (HPLC).
3. EVALUATION PROCEDURE
The performance of the samplers was tested under a range of conditions using the Europeantesting protocol BS EN 482 for guidance.
4. ANALYTICAL METHOD
Samples were collected at 2 l/min onto glass fibre filters contained in multi-orifice headsaccording to MDHS 14 (HSE, 1997) with back-up tubes containing Tenax (50/100mg,dimensions 8x100mm). The samples were desorbed into acetonitrile (3ml) and analysed byHPLC using a Zorbax CN column (25cm x 4.6mm i.d.). The flow rate through the columnwas 1.5 ml/min. Hydroquinone was measured at 290 nm and benzoquinone at 245 nm. Thespectra are shown in Figure 1.
Choice of mobile phase
Acetonitrile : water
A 30:70 acetonitrile : water mobile phase was found to give effective separation ofhydroquinone (2.8 mins) and benzoquinone (3.4 mins). However, conversion ofhydroquinone to benzoquinone appeared to be taking place in the system. The extent of thisconversion varied with the concentration of hydroquinone, the amount of conversion beinggreater in the lower concentration hydroquinone standards.
Acetonitrile : dilute sulphuric acid(0.02%)
The oxidation of hydroquinone to benzoquinone is sensitive to pH. The water in the mobilephase was replaced with 0.02% sulphuric acid (~pH 2), in order to lower the pH and preventoxidation occuring.
When the hydroquinone standards were analysed using this mobile phase, no benzoquinonewas detected. Similarly no hydoquinone was detected in benzoquinone standards. Thereforeuse of an acidic mobile phase prevents interconversion of hydroquinone to benzoquinone inthe HPLC system. However, under these conditions the HPLC column was being used at thelimit of its recommended pH range. As a consequence, the chromatography graduallydeteriorated and poor peak shapes were observed.
2
Acetonitrile : phosphate
The dilute sulphuric acid was replaced with 0.01M sodium dihydrogen orthophosphate(~pH4). This mobile phase appeared to prevent interconversion of hydroquinone andbenzoquinone without adversely affecting the HPLC column.
5. MEASUREMENT RANGE
The current exposure limit for hydroquinone is 2 mg/m3 although in future it is likely to beset at 0.5 mg/m3 (over 8 hours). The target OEL for this work was therefore taken as 0.5mg/m3. A suitable analytical method must be able to measure 0.1 to 2 times the exposurelimit to satisfy the requirements of the CEN protocol.
A sample taken at 2 l/min for 8 hours (960 l) at 0.5 mg/m3 is equivalent to a collected mass of0.48 mg. The analytical method must therefore be able to measure 0.048 - 0.96 mg persample. If the samples are desorbed into 3 ml of acetonitrile then this range is equivalent to0.016 - 0.32 mg/ml (or 160 - 3200 ng per injection of 10 µl). A linear response was observedfor hydroquinone in this range.
Limits of detection and quantification are detailed in Appendix 1.
6. EVALUATION OF METHOD FOR HYDROQUINONE
6.1 Determination of desorption efficiency
6.1.1 Experimental
The desorption efficiencies of the filters and Tenax tubes were tested at 3 different levels byspiking with hydroquinone (a 10 µl solution in acetonitrile) and desorbing into acetonitrile (3ml). An equivalent amount of hydroquinone was added to 3 ml acetonitrile for comparison.Similarly, the desorption efficiency of benzoquinone from Tenax was also tested at lowlevels.
The desorption efficiency was calculated as (the mass found on filter or tube / mass found insolution) x 100.
6.1.2 Results
The results are shown in Tables 1 to 3.
3
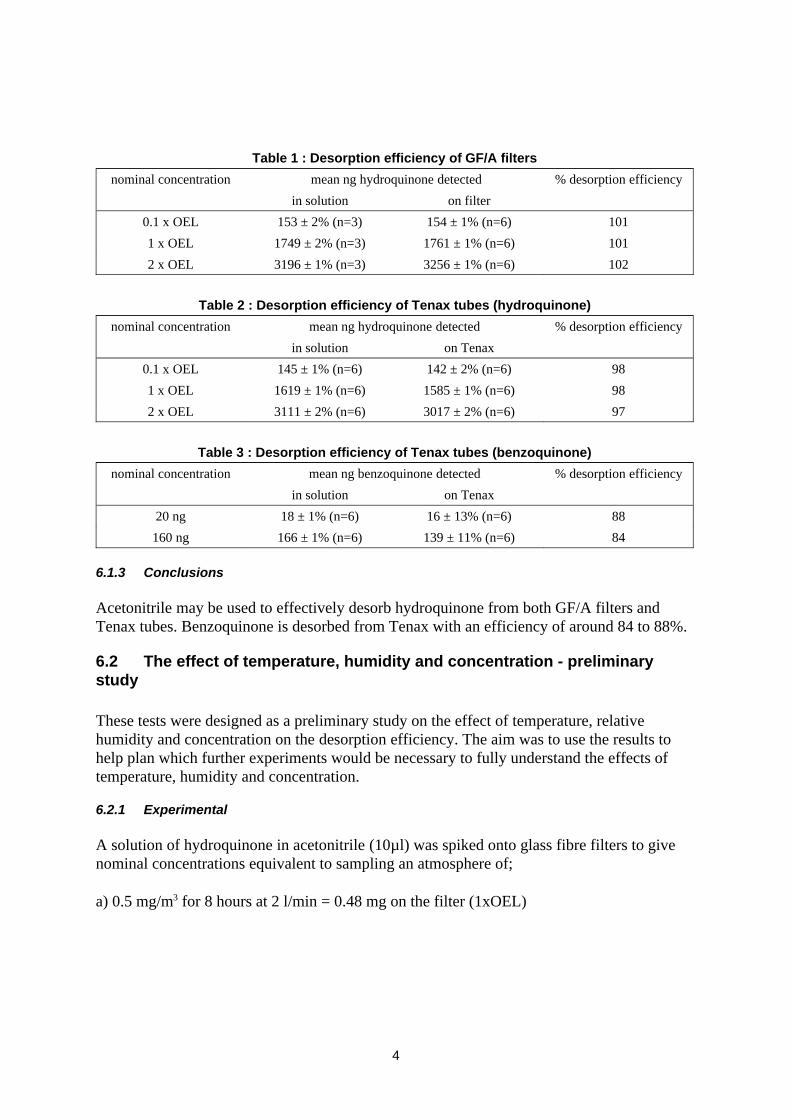
1023256 ± 1% (n=6)3196 ± 1% (n=3)2 x OEL1011761 ± 1% (n=6)1749 ± 2% (n=3)1 x OEL101154 ± 1% (n=6)153 ± 2% (n=3)0.1 x OEL
on filterin solution% desorption efficiency mean ng hydroquinone detectednominal concentration
Table 1 : Desorption efficiency of GF/A filters
973017 ± 2% (n=6)3111 ± 2% (n=6)2 x OEL981585 ± 1% (n=6)1619 ± 1% (n=6)1 x OEL98142 ± 2% (n=6)145 ± 1% (n=6)0.1 x OEL
on Tenaxin solution% desorption efficiencymean ng hydroquinone detectednominal concentration
Table 2 : Desorption efficiency of Tenax tubes (hydroquinone)
84139 ± 11% (n=6)166 ± 1% (n=6)160 ng8816 ± 13% (n=6)18 ± 1% (n=6)20 ng
on Tenaxin solution% desorption efficiencymean ng benzoquinone detectednominal concentration
Table 3 : Desorption efficiency of Tenax tubes (benzoquinone)
6.1.3 Conclusions
Acetonitrile may be used to effectively desorb hydroquinone from both GF/A filters andTenax tubes. Benzoquinone is desorbed from Tenax with an efficiency of around 84 to 88%.
6.2 The effect of temperature, humidity and concentration - preliminarystudy
These tests were designed as a preliminary study on the effect of temperature, relativehumidity and concentration on the desorption efficiency. The aim was to use the results tohelp plan which further experiments would be necessary to fully understand the effects oftemperature, humidity and concentration.
6.2.1 Experimental
A solution of hydroquinone in acetonitrile (10µl) was spiked onto glass fibre filters to givenominal concentrations equivalent to sampling an atmosphere of;
a) 0.5 mg/m3 for 8 hours at 2 l/min = 0.48 mg on the filter (1xOEL)
4

b) 0.05 mg/m3 for 8 hours at 2 l/min = 0.048 mg on the filter (0.1xOEL)
The filters were desorbed into 3 ml acetonitrile and then 10µl injected into the HPLC foranalysis, to give nominal concentrations of;
a) 0.16 mg/ml = 1600 ng/injection
b) 0.016 mg/ml = 160 ng/injection
Preliminary experiments were carried out at each concentration under three differentcombinations of temperature and relative humidity. For each set of conditions 12 filters werespiked. Six were placed into tins (controls) and six put into 7-hole head samplers. Three ofthe 7-hole heads were backed up with Tenax tubes. The flow rates were set at 2 l/min and thesamplers placed in a standard atmosphere of air adjusted to the required conditions oftemperature and humidity. Air was drawn through the samplers for approximately 6hours.The filters and Tenax tube sections were each desorbed into 3 ml acetonitrile andanalysed by HPLC.
6.2.2 Results
The results are shown in Table 4. At concentrations equivalent to 1 x OEL good recoveries ofhydroquinone from the filter were found at temperatures of 20 and 30°C and humidities of 0and 80% RH. Some hydroquinone was found on the back-up Tenax tube, typically 1 or 2% .A small amount of benzoquinone was also found on the Tenax tubes, typically 1 or 2% oftotal hydroquinone added (benzoquinone figures not tabulated).
At concentrations equivalent to 0.1 x OEL recoveries of hydroquinone from the filter werepoor, between about 20 and 70%, depending on the conditions of temperature and relativehumidity. An increase in temperature from 20 to 30°C appeared to cause a marked decreasein recovery. An increase in relative humidity between 0 and 80% RH may cause a slightdecrease in recovery although the results are not conclusive. The hydroquinone lost from thefilter appears to be trapped on the back-up Tenax tube. The recovery of hydroquinone fromthe filter + back-up was between about 80 and 90%. Some benzoquinone was also detectedon the back-up tubes, between 2 and 6%.
5

81211184943014680%RH30°C0.1xOEL 823113387550163dry30°C0.1xOEL 866813602910715840%RH20°C0.1xOEL
989312710701201129780%RH30°C1xOEL 908913810161365153080%RH20°C1xOEL
10098145103214191450dry20°C1xOEL back frontsamplescontrolshumiditytemp.concn.
totalrecovery
%
recoveryfrom
filter %
total HQng/injection
mean hydroquinoneon Tenax ng/injection
(n=3)
mean hydroquinoneon filter ng/injection
(n=6)
conditionsTable 4 : Effect of temperature, humidity and concentration
6.2.3 Conclusions
Good recovery of hydroquinone was obtained from filters spiked at 1xOEL regardless ofconditions of temperature and humidity. However poor recovery was obtained from filtersspiked at 0.1xOEL.
The hydroquinone lost from the filters was found mainly as hydroquinone on the back-uptubes. A small percentage of benzoquinone was found on the back-up tubes.
Further experiments are required to clarify the results obtained, especially at lowconcentrations of hydroquinone.
6.3 The effect of temperature, humidity and concentration - furtherexperiments
6.3.1 Experimental
In order to clarify the results obtained at low hydroquinone concentrations (Section 6.2) afurther more extensive series of experiments was carried out at the 0.1xOEL level under thefollowing conditions;
10°C, 20%RH and 70%RH; 20°C, 20%RH and 70%RH; 30°C, 20%RH and 70%RH
Experiments were also carried out at 1x and 2x OEL at the extremes of temperature andhumidity in order to confirm the findings of the preliminary tests.
For each set of conditions 12 filters were spiked. Six were placed into tins (controls) and sixput into 7-hole head samplers. Each of the 7-hole heads were backed up with Tenax tubes.The flow rates were set at 2 l/min and air was drawn through the samplers for approximately6 hours at the required conditions of temperature and humidity.The filters and Tenax tubesections were each desorbed into 3 ml acetonitrile and analysed by HPLC.
6

6.3.2 Results
The results are shown in Table 5. At 0.1 x OEL the results show good recovery ofhydroquinone from the filter at 10°C regardless of humidity. Approximately 3 or 4 % of thehydroquinone was found on the Tenax. At 20°C, about 70% of the hydroquinone wasrecovered from the filter at both 20%RH and 70%RH. Another 20% was found on the Tenax,giving a good total recovery. At 30°C poor recovery of hydroquinone was obtained from thefilter and about 70 to 80% found on the Tenax. The total recovery was over 90% at the lowhumidity but only about 80% at the high humidity.
At 1 x OEL and 2 x OEL good recoveries were obtained at the extremes of temperature andhigh relative humidity.
9992333610245308133652xOEL, 30°C, 70%RH101101328205327732562xOEL, 10°C, 70%RH
9779165216294135817111xOEL, 30°C, 70%RH100100176305175817611xOEL, 10°C, 70%RH
79131316104211670.1xOEL, 30°C, 70%RH91191466109311600.1xOEL, 30°C, 20%RH89701420301121590.1xOEL, 20°C, 70%RH93661440431011540.1xOEL, 20°C, 20%RH9693148051431540.1xOEL, 10°C, 70%RH9894132071251330.1xOEL, 10°C, 20%RH
back frontsamplescontrols
totalrecovery
%
recoveryfrom
filter %
total HQng/injection
mean hydroquinoneon Tenax ng/injection
(n=6)
mean hydroquinoneon filter ng/injection
(n=6)
conditionsTable 5 : Effect of temperature, humidity and concentration
6.3.3 Conclusions
At low hydroquinone concentrations temperature appears to have a significant effect on therecovery from the filter. Less is recovered at high temperature and more passes through ontothe Tenax tube. The total recovery from the filter and back-up tube is good (90%+) undermost conditions of temperature and humidity. At the extreme of high temperature and highhumidity the total recovery falls to about 80%.
At higher concentrations of hydroquinone the effects of temperature and humidity are lessmarked.
7

6.4 Storage
This test is intended to establish how long samplers which have been exposed tohydroquinone may be stored before analysis. BS EN 482 requires that the mean values for the2 sets of results corresponding to 0 and 14 days storage should not differ by more than 10%.
6.4.1 Experimental
Filters
Eighteen GF/A filters were spiked with 10µl of a hydroquinone solution in acetonitrile. Thefilters were then stored at room temperature in tins for up to 28 days in batches of 3, beforebeing desorbed into acetonitrile (3 ml) and analysed. This was carried out at 2 levels ofhydroquinone; 0.48 mg per sample (equivalent to 0.5 mg/m3 at 2 l/min for 8 hours, 1 x OEL)and 0.048 mg per sample (equivalent to 0.05 mg/m3 at 2 l/min for 8 hours, 0.1 x OEL).
Desorbed filters
Eighteen GF/A filters were spiked with 10µl of a hydroquinone solution in acetonitrile. Thefilters were desorbed immediately into acetonitrile (3 ml) and these solutions stored at roomtemperature for periods of up to about a month before being analysed. This was carried out at2 levels of hydroquinone; 0.48 mg per sample (equivalent to 0.5 mg/m3 at 2 l/min for 8 hours)and 0.048 mg per sample (equivalent to 0.05 mg/m3 at 2 l/min for 8 hours).
Tenax tubes
Eighteen Tenax tubes were spiked with 10µl of a hydroquinone solution in acetonitrile at ahydroquinone concentration of 0.048 mg per sample (equivalent to 0.05 mg/m3 at 2 l/min for8 hours). The tubes were capped and stored at room temperature in batches of 3 in plasticbags for up to a month. The tubes were then desorbed into acetonitrile (3 ml) and analysed.
6.4.2 Results
Filters
The results in Table 6 show that for filters spiked with a concentration around the OEL thereis a 5% difference between the samples stored for 0 and 14 days, and a 10% differencebetween the samples stored for 0 and 28 days. However, for filters spiked with lower levelsof hydroquinone (equivalent to 0.05mg/m3 over 8 hours) a quarter of the hydroquinonespiked onto the filter is lost over 14 days and almost half is lost over approximately 1 month.
Desorbed filters
The results in Table 7 show that once the filters are desorbed into acetonitrile, there is littleloss of hydroquinone over a month.
8

Tenax tubes
The results (Table 8) show that for Tenax tubes spiked with a concentration equivalent toexposure at around 0.1 x OEL over 8 hours there is little loss of hydroquinone over 14 days(5% loss). However, a quarter of the hydroquinone is lost over 28 days. Table 8 shows thatthis observed loss of hydroquinone appears to be due to conversion of hydroquinone tobenzoquinone. If benzoquinone levels are accounted for then the increasing losses ofhydroquinone with time are compensated for by increasing levels of benzoquinone found.
5793 ± 7.8%3369113 ± 4.1%1975123 ± 5.9%1482134 ± 2.3%795155 ± 0.4%2---163 ± 0.5%0
b) ~ 0.1 x OEL901413 ± 3.6%28921446 ± 1.2%21951500 ± 0.5%14
1001573 ± 1.7%7951500 ± 0.7%1---1573 ± 0.3%0
a) ~ 1 x OELstored / fresh (%)ng hydroquinone foundstorage time (days)
Table 6 : The effect of storage on filters spiked with hydroquinone
9

99150 ± 1.9%3399151 ± 2.0%21
101153 ± 2.1%14100152 ± 1.1%7100152 ± 0.4%1---152 ± 0.4%0
stored / fresh (%)ng hydroquinone foundstorage time (days)Table 7 : The effect of storage on desorbed filters (~ 0.1 x OEL)
10175154 ± 1.1%114 ± 31.9%289378143 ± 11.8%120 ± 13.0%219995151 ± 2.6%145 ± 0.9%149793149 ± 3.6%142 ± 2.3%79392143 ± 8.0%141 ± 4.8%1---------153 ± 2.9%0
hydroquinone +benzoquinone
hydroquinonehydroquinone +benzoquinone
hydroquinonestored / fresh (%)ng foundstorage time (days)
Table 8 : The effect of storage on Tenax tubes spiked with hydroquinone (~ 0.1 x OEL)
6.4.3 Conclusions
The ability to store filters which have been exposed to hydroquinone depends on the amountof hydroquinone collected. Filters with hydroquinone levels equivalent to exposure at theOEL over 8 hours may be stored at room temperature for up to a month. However significantlosses occur when filters with lower amounts of hydroquinone are stored. Some conversionof hydroquinone to benzoquinone occurs when Tenax tubes exposed to hydroquinone arestored. Therefore it is not appropriate to store filters or Tenax tubes which have been used tosample hydroquinone.
Exposed filters and Tenax tubes should be desorbed into acetonitrile as soon as possible aftersampling. The solutions may then be stored for a month.
7. OVERALL UNCERTAINTY
The overall uncertainty for a measuring procedure is defined in BS EN 482 (BritishStandards Institution, 1994) as "the quantity used to characterise as a whole the uncertainty ofthe result given by a measuring procedure", and is quoted as a percentage combining bias andprecision using the following equation:-
10

An additional 5% is usually included to allow for the variability of the pump flow rate. Theperformance requirements quoted in BS EN 482 for overall uncertainty are ±50% for samplesin the range 0.1 to 0.5 LV and ±30% for samples in the range 0.5 to 2.0 LV (LV = LimitValue).
The overall uncertainty of the method was determined to be less than ± 14% for samples inthe range 0.1 to 0.5 LV and less than ± 11% for samples in the range 0.5 to 2.0 LV, i.e. wellwithin the EN 482 specifications.
8. FIELD TRIALS
The primary aim of the field trials was to study the effect of any interferences which may bepresent in the workplace. Samples were taken at two locations where exposure tohydroquinone in the air may occur, either in the vapour phase (Field Trial 1) or as particulate(Field Trial 2).
8.1 Field Trial 1
This field trial was carried out in two separate hospital X-Ray Processing departments wherehydroquinone was a constituent of the X-Ray film developers used. In each department therewere two automatic X-Ray film processors which were in constant use throughout the day.The processing occurs at a temperature raised above ambient, approximately 30°C, and it wasthought that hydroquinone may be present in the air in its vapour form. Six samplers wereplaced on top of a processor in each department and samples were taken over 6 hours at 2l/min. The samples were desorbed into acetonitrile on the day after sampling.
The levels of hydroquinone were below the detection limit (i.e. < 0.4 µg/m3). Also nobenzoquinone was found. No interference was observed from other species which may bepresent in the air in such areas, such as volatile components of the developer or fixersolutions.
8.2 Field Trial 2
This field trial was carried out at a site where film developers are produced. Samples weretaken during the addition of bulk hydroquinone to the mixing vessel. During this procedure,which takes approximately 40 minutes, the operator cuts open 25kg bags of hydroquinone
11
Overall Uncertainty =xrefx + 2sxref
× 100
where :x
x ref
s
is the mean value of results of a number n of repeated measurements;
is the true or accepted reference value of concentration;
is the standard deviation of measurements

and empties their contents into the mixer. The mixer is under extraction throughout. Sixsamplers were placed on top of the mixer (samples 1 to 6) and six were placed by the side ofthe mixer at ground level (samples 7 to 12). A further sampler was attached to the lapel of theoperator (sample 13).
Samples 1 to 6 were below the detection limit (i.e. < 2 µg/m3). The results for samples 7 to 13are shown in Table 9. Example chromatograms are shown in Figures 2 and 3.
47.7 18.3 4.29 2.46 1.83 9013 (personalsample)
12.6 -1.26 1.26 -1001221.3 6.3 2.13 1.50 0.63 1001125.2 7.5 2.52 1.77 0.75 1001027.0 8.1 2.70 1.89 0.81 100926.1 9.0 2.61 1.71 0.90 100825.5 5.7 2.55 1.98 0.57 1007totalhydroquinonetotalbenzoquinone#hydroquinone*
µg/m3µg detected on samplersample volume lsamplerTable 9 : Results of Field Trial 2
* found on filter section; # found on Tenax back-up section
The results for samples 7 to 12 (Table 9) show that very low levels of hydroquinone andbenzoquinone were detected in the static samples. The hydroquinone was all found on thefilter section, whereas all of the benzoquinone was found on the adsorbent back-up. There isgood agreement between samplers 7 to 11. Sampler 12 appears to be an outlier.
Slightly higher levels were detected on sampler 13 which was worn by the worker whose jobwas to add the bulk hydroquinone to the vessel. This would be expected as this sampler wasclosest to the procedure involving the hydroquinone.
No interferences were caused by other species present in the workplace atmosphere. Themain possible interferent in this situation would be potassium carbonate which is added to themixing vessel immediately after the hydroquinone.
9. DISCUSSION AND CONCLUSIONS
Pumped sampling onto glass fibre filters with back-up Tenax tubes offers an effective meansof monitoring hydroquinone. The method appears to have sufficient sensitivity to cover therange 0.1 to 2 times the target exposure limit of 0.5 mg/m3 for 8 hours.
12

The desorption efficiency of hydroquinone from GF/A filters and Tenax tubes was shown tobe effectively 100%. For most conditions of temperature and humidity the recovery ofhydroquinone (from combined filter and back-up) is good (>90%). However lower recoveriesare seen (~80%) at the extremes of high temperature and humidity. The distribution of thehydroquinone between the filter and back-up depends on temperature.
Losses of hydroquinone may occur from exposed filters and therefore filters should bedesorbed into acetonitrile as soon as possible after sampling. These solutions can then bestored for up to a month.
10. REFERENCES
British Standards Institution (1994) Workplace atmospheres - General requirements for theperformance of procedures for the measurement of chemical agents., European Standard BSEN 482 BSI 1994 ISBN 0 580 23644.
Gattrell, M.A. and Kirk, D.W., Interconversion of hydroquinone and benzoquinone duringstyrene-divinylbenzene resin-based ion-exclusion chromatography., J. Chromatogr., 409,404-408 (1987).
Health and Safety Commission Advisory Committee on Toxic Substances, Draft criteriadocument for an Occupational Exposure Limit (Not for publication) (1995).
Health and Safety Executive, Chemicals (Hazard Information and Packaging for Supply)Regulations 1994 (SI 1994/3247) as amended by the Chemicals (Hazard Information andPackaging for supply) (Amendment) Regulations 1996 SI 1996/1092.
Health and Safety Executive, MDHS 14/2 General methods for the sampling and analysis ofrespirable and total inhalable dust., Methods for the Determination of Hazardous Substances(1997).
Huang, J.X., Stuart, J.D., Melander, W.R. and Horvath, C., High Performance LiquidChromatography of substituted p-benzoquinones and p-hydroquinones I. Interplay ofon-column redox reaction and the chromatographic retention process., J. Chromatogr., 316,151-161 (1984).
Levin, J. O., High Performance Liquid Chromatographic determination of hydroquinone inair as benzoquinone, using combined oxidising filter and XAD-2 adsorbentpreconcentration., Chemosphere, Vol. 17, No. 4, 671-679 (1988).
NIOSH 5004, Hydroquinone., NIOSH manual of analytical methods., National Institute forOccupational Safety and Health, USA (1984).
13

Perez, Carlos and Soderholm, Sidney C., Some chemicals requiring special considerationwhen deciding whether to sample the particle, vapour, or both phases of an atmosphere.,Appl. Occup. Environ. Hyg. 6 (10), 859-864 (1991).
Risner, C. H., The quantification of hydroquinone, catechol, phenol, 3-methylcatechol,scopoletin, m + p-cresol and o-cresol in indoor air samples by High Performance LiquidChromatography., J. Chromatogr., 16(18), 4117-4140 (1993).
Risner, C. H. and Cash, S. L., A High Performance Liquid Chromatographic determination ofmajor phenolic compounds in tobacco smoke., Journal of Chromatographic Science, Vol. 28,239-244 (1990).
Risner, C. H. and Cash, S. L., The determination of hydroquinone, catechol, phenol and m +p-cresols in indoor air samples by High Performance Liquid Chromatography.,Environmental Technology, Vol. 11, 345-352 (1990).
14

APPENDIX 1
DETECTION AND QUANTIFICATION LIMITS
The limit of detection (LOD) gives an indication of the smallest amount of hydroquinone in asample which may be positively identified. It is defined as the concentration which gives asignal to noise ratio of 3 : 1.
The limit of quantification (LOQ) is defined as the smallest amount of hydroquinone whichmay be confidently quantified in a sample.It is defined as the concentration which gives asignal to noise ratio of 10 : 1.
Typical LOD and LOQ values observed during this work were :-
LOD = 1 ng per 10 µl injection (= 0.3 µg per sample when desorbed into 3 ml = 0.3 µg/m3
for an 8 hour sample taken at 2 l/min)
LOQ = 4 ng per 10 µl injection (= 1.2 µg per sample when desorbed into 3 ml = 1.3 µg/m3
for an 8 hour sample taken at 2 l/min)
15

Figue;
HEALTH AND SAFETY -TORY ~~-de . .H . .n ldS lh -

Figure 2 : HPLC trace for hydroquinone;
A standard; B sample; C Hank
-... HEAiTH AND SAFETY LABORATORY
U - J :.- w..s m we:, EX&*

1 Figure 3 : HPLC trace for 'kmoquinone;
A standard; B sample; C blank