measurement of helium-3/ helium-4 ratios in soil gas … · pnnl-13675 measurement of helium-3/...
TRANSCRIPT
PNNL-13675
Measurement of Helium-3/ Helium-4 Ratios in Soil Gas at the 618-11 Burial Ground K. B. Olsen P. E. Dresel J. C. Evans October 2001 Prepared for the U.S. Department of Energy under Contract DE-AC06-76RL01830

DISCLAIMER This report was prepared as an account of work sponsored by an agency of the United States Government. Reference herein to any specific commercial product, process, or service by trade name, trademark, manufacturer, or otherwise does not necessarily constitute or imply its endorsement, recommendation, or favoring by the United States Government or any agency thereof, or Battelle Memorial Institute. PACIFIC NORTHWEST NATIONAL LABORATORY operated by BATTELLE for the UNITED STATES DEPARTMENT OF ENERGY under Contract DE-AC06-76RL01830 Printed in the United States of America Available to DOE and DOE contractors from the Office of Scientific and Technical Information, P.O. Box 62, Oak Ridge, TN 37831; prices available from (615) 576-8401. Available to the public from the National Technical Information Service, U.S. Department of Commerce, 5285 Port Royal Rd., Springfield, VA 22161
This document was printed on recycled paper.
PNNL-13675
Measurement of Helium-3/Helium-4 Ratios in Soil Gas at the 618-11 Burial Ground K. B. Olsen P. E. Dresel J. C. Evans October 2001 Prepared for Bechtel Hanford, Inc. and the U.S. Department of Energy under Contract DE-AC06-76RL01830 Pacific Northwest National Laboratory Richland, Washington 99352
iii
Summary Pacific Northwest National Laboratory, in support of Bechtel Hanford, Inc., sampled and analyzed soil gas for helium-3 and helium-4 concentrations from the vicinity of the 618-11 burial ground. Helium-3, the first daughter product from tritium decay, was used to investigate the source and extent of tritium contamination in the area. Helium-3 is a non-reactive tracer for tritium in groundwater or the vadose zone. Seventy soil gas sampling points were installed around the perimeter of the 618-11 burial ground, approximately 122 meters (400 feet) downgradient of well 699-13-3A, and in four transects downgradient of the burial ground to a maximum distance of 945.5 meters (3,100 feet). Soil gas samples were col-lected, analyzed for helium isotopes, and helium-3/helium-4 ratios were calculated from these 70 points. Helium-3/helium-4 ratios determined from the sampling points showed significant enrichments, com-pared to ambient air helium-3/helium-4 ratios. The highest helium-3/helium-4 ratios (normalized to the abundances in ambient air) were located along the north perimeter of the burial ground. Helium-3/ helium-4 ratios ranged from 1.0 to 62 around the burial ground. The helium-3/helium-4 ratios from the 4 transect downgradient of the burial ground ranged from 0.988 to 1.68. The helium-3/helium-4 ratios from around the burial ground suggest there is a vadose zone source of tritium along the north side of the burial ground. This vadose zone source is likely the source of tritium in the groundwater. The helium-3/helium-4 ratios also suggest the groundwater plume is traveling east-northeast from the burial ground and the highest groundwater tritium value may be to the north of well 699-13-3A. Finally, there appears to be no immediately upgradient sources of tritium impacting the burial ground since all the upgradient helium-3/helium-4 ratios approach or equal the air background level of 1.0. Based on the helium-3/helium-4 results from the soil gas survey, six downgradient groundwater grab and well locations were identified to verify the tritium groundwater plume locations, tritium ground-water concentrations as a function of depth in aquifer, and tritium groundwater concentrations. The measurement of helium isotopes in soil gas provided a rapid and cost-effective technique to define the shape and extent of tritium contamination from the 618-11 burial ground.
v
Acknowledgments We would like to acknowledge the help of CH2M HILL Hanford, Inc. staff for their assistance installing the soil gas sampling points. We would like to also acknowledge Dr. Robert Poreda of the University of Rochester for rapid analysis of the soil gas samples and assistance in data interpretation. Special thanks go to James (Mike) Faurote, William McMahon, Jane Borghese, and Roger Ovink. This project was funded by the U.S. Department of Energy, Richland Operations Office, Richland, Washington, through Bechtel Hanford, Inc.
vii
Contents Summary ............................................................................................................................................ iii Acknowledgments.............................................................................................................................. v Introduction........................................................................................................................................ 1 Historical Background ....................................................................................................................... 1 Methods ............................................................................................................................................. 2 Sample Point Installation........................................................................................................... 2 Sample Collection...................................................................................................................... 3 Sample Analysis ........................................................................................................................ 3 Results and Discussion ...................................................................................................................... 5 Burial Ground Results ............................................................................................................... 5 Downgradient Results................................................................................................................ 8 Conclusions........................................................................................................................................ 11 References.......................................................................................................................................... 12 Appendix A – Installation Parameters of Soil Gas Sampling Points ................................................. A.1 Appendix B – Complete Gas Analytical Results for all Soil Gas Samples Collected ....................... B.1
viii
Figures 1 Schematic Diagram of the Soil Gas Sampling System Used for Collection of Helium Soil Gas sample. ........................................................................................................... 4 2 Helium-3/Helium-4 Ratio Results from Soil Gas Samples from Around 618-11 Burial Ground and Immediately Downgradient of Well 699-13-3A.................................................... 6 3 Tritium Concentrations from Well 699-13-3A.......................................................................... 7 4 Helium-3/Helium-4 Ratio Results from Soil Gas Samples from the East Side of the 618-11 Burial Ground................................................................................................................ 7 5 Results of Helium-3/Helium-4 Ratio Results from Soil Gas Samples Downgradient of the 618-11 Burial Ground.......................................................................................................... 9 6 Helium-3/Helium-4 Ratio Results from Soil Gas Samples from Transect 1............................. 11
1
Introduction This study measured helium-3/helium-4 ratios relative to ambient air in soil gas samples to detect and delineate groundwater tritium plumes originating from the 618-11 burial ground. This approach is a modification of a successful technique developed in the late 1960s used for age-dating deep ocean water as part of the GEOSECS ocean monitoring program and applied to shallow aquifers in the late 1980s by Poreda et al. (1988) and Schlosser et al. (1988). An earlier study was conducted in 1999 on the Hanford Site to demonstrate proof of concept of using helium-3 as a tool to locate vadose zone sources of tritium and tracking groundwater tritium plumes (Olsen et. al. 1999). All these studies were based on the presence of tritium, which decays to a stable, inert isotope, helium-3, i.e.:
3H 3He + β- t½ = 12.32 yr When soil moisture reacts with tritium waste, the result is tritiated moisture that is released into the vadose zone. The soil moisture mixes with meteoritic moisture and migrates downward to mix with groundwater. Concurrent with tritium’s release to the vadose zone its daughter isotope, helium-3, begins to build up in the vadose zone and groundwater at the rate of tritium decay. The helium-3 then diffuses away from its vadose or groundwater source and migrates toward the surface. Throughout this process helium-3, acts as a nonreactive tracer for tritium. Because of helium-3 nonreactive behavior it is a good surrogate tracer for tritium in the vadose zone and groundwater. This helium soil-gas survey was part of a study designed to help define the tritium plume originating from the 618-11 burial ground. This study began in January 2000 after elevated tritium was detected in well 699-13-3A, immediately east of the burial ground.
Historical Background The 618-11 burial ground consists of 3 trenches, 2 to 5 large-diameter caissons, and 50 vertical pipe storage units. The site covers an area of 3.5 hectares (8.6 acres) and is located adjacent to Energy Northwest Plant 2. The trenches are 274 meters (900 feet) long by 15 meters (50 feet) wide; vertical pipe units are five 208 liter (55 gallon) drums welded together end-to-end and are approximately 4.6 meters (15 feet) long by 56 centimeters (22 inches.) in diameter. The caissons are metal pipe 2.4 meters (8 feet) in diameter, 3 meters (10 feet) long, buried vertically 4.6 meters (15 feet) below grade, connected to the surface by offset pipe 91 centimeters (36 inches) in diameter pipe with a dome-type cap. All vertical pipe units and caissons were capped with concrete and covered with dirt (Demiter and Greenhalgh 1997). The burial ground received low to high-activity dry waste, fission products, plutonium, and other transuranic constituents in a variety of waste forms from research operations associated with the 300 Area (DOE 2000). The burial ground operated from 1962 through 1967 (DOE 2000). The operation of this burial ground coincided with the development of the lithium aluminate tritium target project on the

2
Hanford Site. Circumstantial evidence suggests that tritium targets, as irradiated lithium aluminate, may have been disposed to the burial ground during its operational lifetime. Driven by the strategic need for tritium production by our weapons program, it was recognized that co-production of plutonium and tritium during operations of the reactor would be technically, econom-ically and strategically attractive. Thus, General Electric Company initiated a coproduct program for N Reactor early in 1963. Several fuel-target models were tested in the reactor and testing culminated in October 1965 with the selection of the Mark II design used for full reactor demonstrations. After irradi-ation tritium must efficiently be removed from the targets. Development of a tritium extraction process for ceramic targets was jointly assigned to Battelle, Pacific Northwest Laboratory and Savannah River Laboratories. Initial research in the development of a process for recovering tritium from irradiated lithium aluminate was done with samples weighing less than one gram. Production-size pellets (70 grams [2.5 ounces]) became available on February 7, 1966 (Johnson et al. 1976). These pellets were used in a series of experiments designed to determine the characteristics of the tritium extraction. Results of this study estimated that each target contained approximately 51 curies of tritium and that 35% of the tritium was recovered in a non-condensable form at -196°C with the remainder recovered in a condensable form as T2O or HTO. Furthermore, residual tritium remaining with the lithium aluminate target after proc-essing ranged from <0.4 to 5% (Yunker 1976). Based on the aforementioned information, tritium remaining in each target could range from 0.204 curies to 2.55 curies. The condensable form is believed to be what mainly remains within the lithium aluminate target material after processing. This form is also an environmental labile form, which when released to the environment reacts with soil moisture in the vadose zone and can be carried downward with meteoritic water to groundwater.
Methods Seventy points to sample soil gas were installed during the course of this study. Forty-three sampling points were installed in August 2000 around the 618-11 burial ground and within 122 meters (400 feet) to the east (downgradient) of the burial ground. Twenty-seven sampling points were installed in April to May 2001 in four transects to the east of the burial ground. Sampling points ranging from 305 meters (1,000 feet) to the north, 518.5 meters (1,700 feet) to the south, and 945.5 meters (3,100 feet) to the east of groundwater monitoring well 699-13-3A. The logic for locating the soil gas points in the four transects are presented in the discussion section of this report. Sample Point Installation Sampling points for soil gas were installed using a truck mounted GeoprobeTM Model 5400 system equipped with a probe 3.2 centimeters (1.25 inches) in diameter with a detachable steel tip. Target depth of installation of the screen interval was 6.1 meters (20 feet) below ground surface (bgs), but actually ranged from 4.4 to 6.3 meters (14.5 to 20.5 feet) bgs. When the tip achieved its desired depth, a 20.3 centimeter (8 inch) long, fine-mesh, stainless steel sampling point connected to the surface with a
3
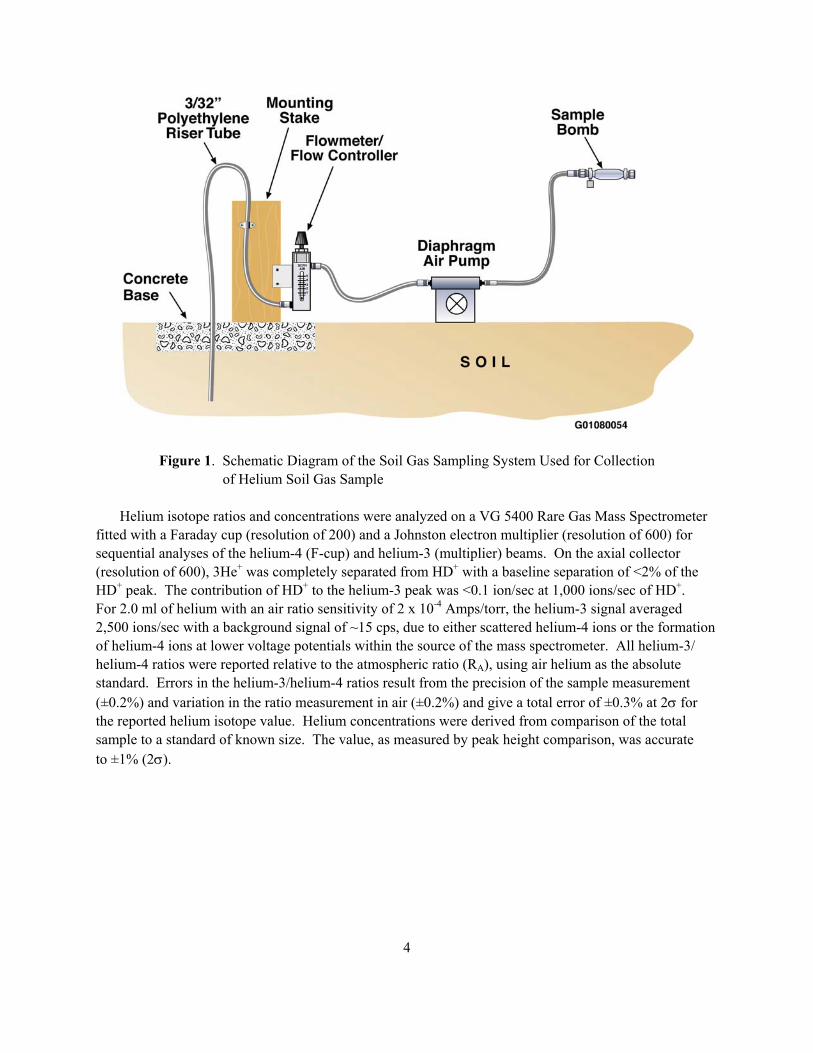
polyethylene tube 1/4 inch outside diameter by 3/32 inch inside diameter that was strung down the center of the push rod. The rod assembly was withdrawn 15.2 centimters (6 inches) to release the steel tip and allow the sampling point to extend into the void space just below the push rod. Approximately 250 milli-liters of 20 to 40 mesh washed silica sand was added around the sampling point through the center of the push rod. The push rod was slowly withdrawn and bentonite pellets were added through the center of the push rod. The bentonite was hydrated with 240 milliliters water several feet above the screened interval. Bentonite pellets were added to the surface of the hole. To complete those sampling points, a cement cap was poured around the sampling tube at the ground surface. Each sampling location was allowed to equilibrate for at least 24 hours and up to several weeks before soil gas samples were collected. Sample Collection All samples were collected with the aid of a Thomas Model 107CA14 flexible diaphragm pump. Power to the pumps was supplied with a portable generator. Pressurized samples were collected for helium analysis from each sampling location. The sampling vessels were 50-milliliter stainless steel cylinders with one end sealed with a pipe plug and the other end with a high vacuum needle valve with a 1/4-inch SwagelokTM fitting. Each vessel was evacuated to less than 5 torr before sampling. The sampling configurations used to collect helium-3 samples can be seen in Figure 1. After a short equilibration period (minutes), a Kurz InstrumentsTM mass flow meter was placed in the flow stream between the polyethylene raiser tube and the bottom of the rotometer. The initial flow was adjusted to 1 liter (0.035 cubic foot) per minute. The soil gas sampling point was allowed to purge at 1 liter (0.035 cubic foot) per minute for a minimum of 15 minutes. At the end of the purging period a hose was connected to the pressure side of the pump, and the sampling cylinder was pressurized to the maximum pressure of the pump, allowed to vent to atmospheric pressure twice without removing the sampling tube from the sample cylinder, then allowed to pressurize to the maximum pressure of the pump. Random duplicates were collected at 1 for every 20 samples, and an air background sample was included for each sampling day. When there were discontinuities in sampling (e.g., a day or weeks) a previously sampled soil gas location was resampled. Sample Analysis After collection, soil gas samples were sent to the University of Rochester for helium isotopes (helium-3 and helium-4) analysis. Upon receipt of the samples, a 0.5 milliliters aliquot of soil gas was processed through a high vacuum line constructed of stainless steel and Corning-1724 glass to minimize helium diffusion. After removal of water vapor and carbon dioxide at -90°C and -195°C respectively, the amount of non-condensable gas (helium, neon, argon, oxygen, nitrogen, and methane) was measured using a calibrated volume and a capacitance manometer. Gas ratios (argon, nitrogen, methane) were analyzed on a Dycor Quadrupole mass spectrometer fitted with a variable leak valve. The results are combined with the capacitance manometer measurement to obtain gas concentrations (±2%). Prior to helium isotope analyses, nitrogen and oxygen were removed by reaction with zirconium/aluminum alloy (SAES ST707), argon and neon were adsorbed on activated charcoal at 77°K and at 40°K, respectively. SAES-ST-101 Getters (one in the inlet line and 2 in the mass spectrometer) reduced the HD+ background to ~1,000 ions/sec.
4
Figure 1. Schematic Diagram of the Soil Gas Sampling System Used for Collection of Helium Soil Gas Sample Helium isotope ratios and concentrations were analyzed on a VG 5400 Rare Gas Mass Spectrometer fitted with a Faraday cup (resolution of 200) and a Johnston electron multiplier (resolution of 600) for sequential analyses of the helium-4 (F-cup) and helium-3 (multiplier) beams. On the axial collector (resolution of 600), 3He+ was completely separated from HD+ with a baseline separation of <2% of the HD+ peak. The contribution of HD+ to the helium-3 peak was <0.1 ion/sec at 1,000 ions/sec of HD+. For 2.0 ml of helium with an air ratio sensitivity of 2 x 10⁻⁴ Amps/torr, the helium-3 signal averaged 2,500 ions/sec with a background signal of ~15 cps, due to either scattered helium-4 ions or the formation of helium-4 ions at lower voltage potentials within the source of the mass spectrometer. All helium-3/ helium-4 ratios were reported relative to the atmospheric ratio (RA), using air helium as the absolute standard. Errors in the helium-3/helium-4 ratios result from the precision of the sample measurement (±0.2%) and variation in the ratio measurement in air (±0.2%) and give a total error of ±0.3% at 2σ for the reported helium isotope value. Helium concentrations were derived from comparison of the total sample to a standard of known size. The value, as measured by peak height comparison, was accurate to ±1% (2σ).
5
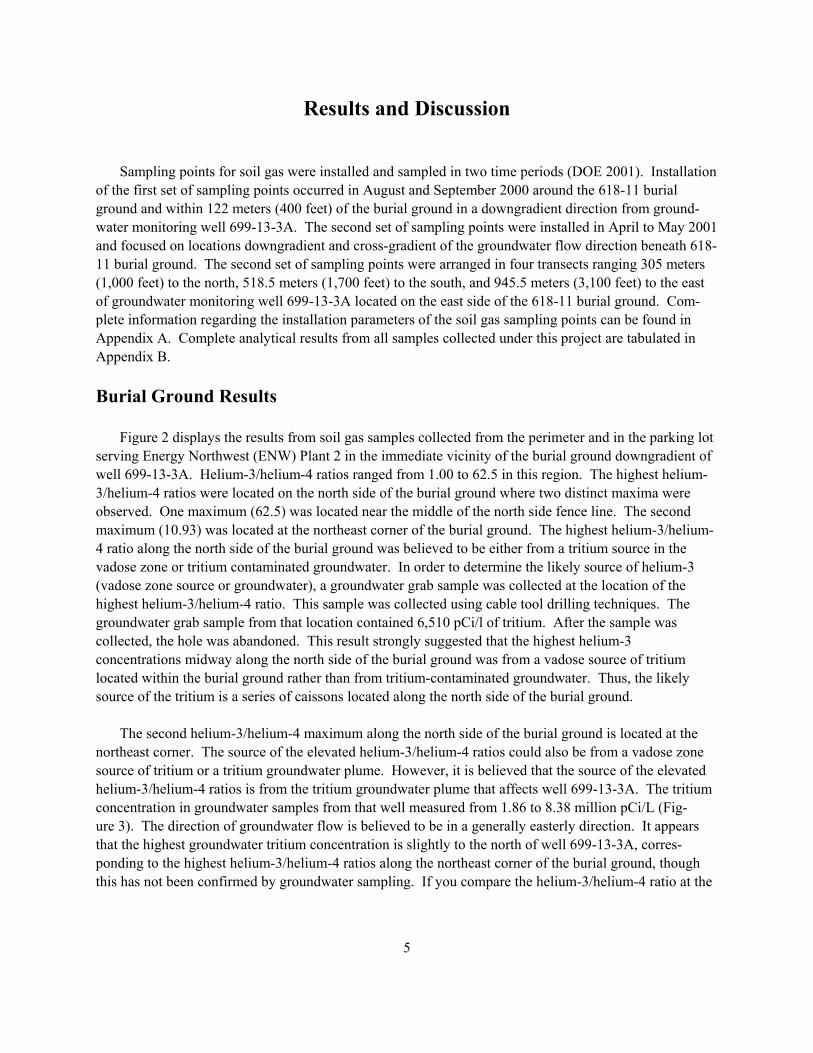
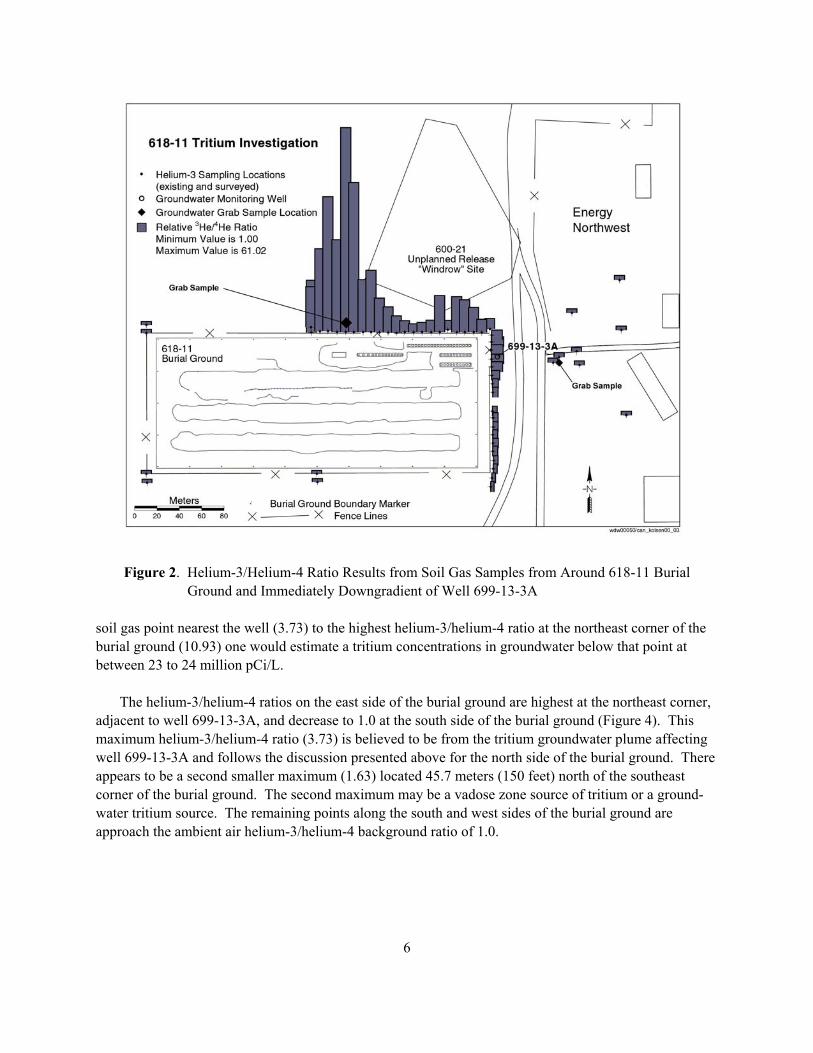
Results and Discussion Sampling points for soil gas were installed and sampled in two time periods (DOE 2001). Installation of the first set of sampling points occurred in August and September 2000 around the 618-11 burial ground and within 122 meters (400 feet) of the burial ground in a downgradient direction from ground-water monitoring well 699-13-3A. The second set of sampling points were installed in April to May 2001 and focused on locations downgradient and cross-gradient of the groundwater flow direction beneath 618-11 burial ground. The second set of sampling points were arranged in four transects ranging 305 meters (1,000 feet) to the north, 518.5 meters (1,700 feet) to the south, and 945.5 meters (3,100 feet) to the east of groundwater monitoring well 699-13-3A located on the east side of the 618-11 burial ground. Com-plete information regarding the installation parameters of the soil gas sampling points can be found in Appendix A. Complete analytical results from all samples collected under this project are tabulated in Appendix B. Burial Ground Results Figure 2 displays the results from soil gas samples collected from the perimeter and in the parking lot serving Energy Northwest (ENW) Plant 2 in the immediate vicinity of the burial ground downgradient of well 699-13-3A. Helium-3/helium-4 ratios ranged from 1.00 to 62.5 in this region. The highest helium-3/helium-4 ratios were located on the north side of the burial ground where two distinct maxima were observed. One maximum (62.5) was located near the middle of the north side fence line. The second maximum (10.93) was located at the northeast corner of the burial ground. The highest helium-3/helium-4 ratio along the north side of the burial ground was believed to be either from a tritium source in the vadose zone or tritium contaminated groundwater. In order to determine the likely source of helium-3 (vadose zone source or groundwater), a groundwater grab sample was collected at the location of the highest helium-3/helium-4 ratio. This sample was collected using cable tool drilling techniques. The groundwater grab sample from that location contained 6,510 pCi/l of tritium. After the sample was collected, the hole was abandoned. This result strongly suggested that the highest helium-3 concentrations midway along the north side of the burial ground was from a vadose source of tritium located within the burial ground rather than from tritium-contaminated groundwater. Thus, the likely source of the tritium is a series of caissons located along the north side of the burial ground. The second helium-3/helium-4 maximum along the north side of the burial ground is located at the northeast corner. The source of the elevated helium-3/helium-4 ratios could also be from a vadose zone source of tritium or a tritium groundwater plume. However, it is believed that the source of the elevated helium-3/helium-4 ratios is from the tritium groundwater plume that affects well 699-13-3A. The tritium concentration in groundwater samples from that well measured from 1.86 to 8.38 million pCi/L (Fig-ure 3). The direction of groundwater flow is believed to be in a generally easterly direction. It appears that the highest groundwater tritium concentration is slightly to the north of well 699-13-3A, corres-ponding to the highest helium-3/helium-4 ratios along the northeast corner of the burial ground, though this has not been confirmed by groundwater sampling. If you compare the helium-3/helium-4 ratio at the
6
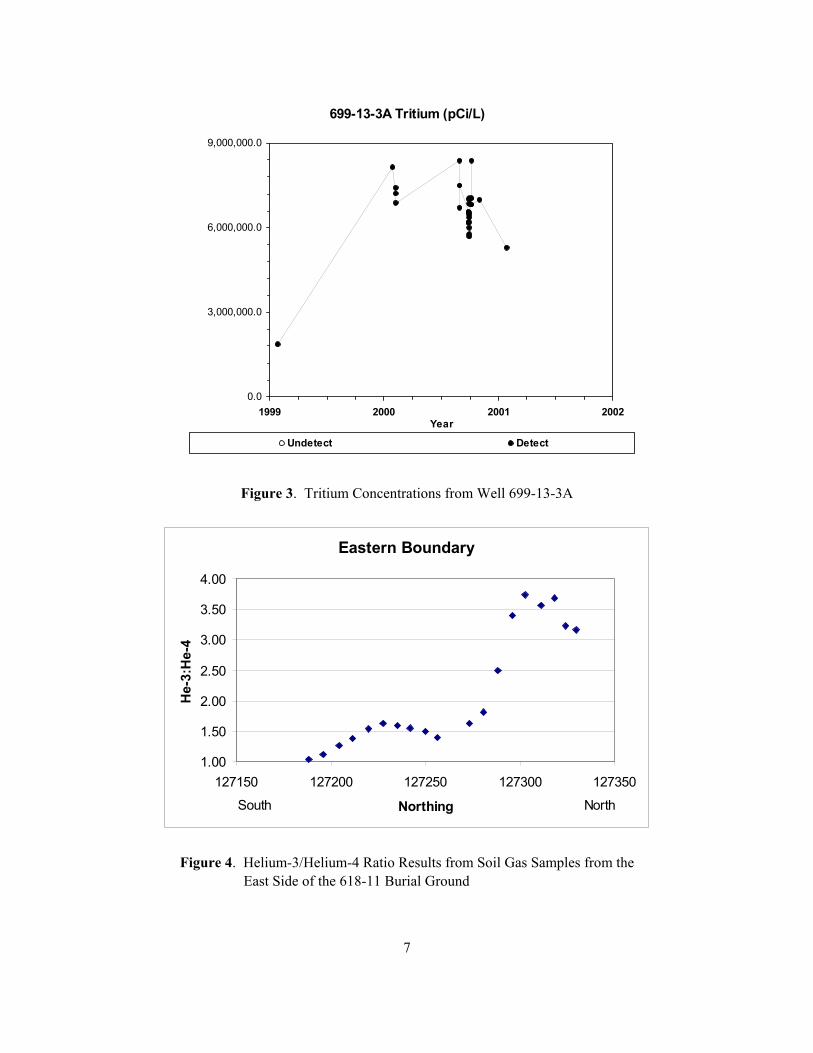
Figure 2. Helium-3/Helium-4 Ratio Results from Soil Gas Samples from Around 618-11 Burial Ground and Immediately Downgradient of Well 699-13-3A soil gas point nearest the well (3.73) to the highest helium-3/helium-4 ratio at the northeast corner of the burial ground (10.93) one would estimate a tritium concentrations in groundwater below that point at between 23 to 24 million pCi/L. The helium-3/helium-4 ratios on the east side of the burial ground are highest at the northeast corner, adjacent to well 699-13-3A, and decrease to 1.0 at the south side of the burial ground (Figure 4). This maximum helium-3/helium-4 ratio (3.73) is believed to be from the tritium groundwater plume affecting well 699-13-3A and follows the discussion presented above for the north side of the burial ground. There appears to be a second smaller maximum (1.63) located 45.7 meters (150 feet) north of the southeast corner of the burial ground. The second maximum may be a vadose zone source of tritium or a ground-water tritium source. The remaining points along the south and west sides of the burial ground are approach the ambient air helium-3/helium-4 background ratio of 1.0.
7
699-13-3A Tritium (pCi/L)
0.0
3,000,000.0
6,000,000.0
9,000,000.0
1999 2000 2001 2002Year
Undetect Detect
Figure 3. Tritium Concentrations from Well 699-13-3A
Eastern Boundary
1.00
1.50
2.00
2.50
3.00
3.50
4.00
127150 127200 127250 127300 127350
Northing
He-
3:H
e-4
South North
Figure 4. Helium-3/Helium-4 Ratio Results from Soil Gas Samples from the East Side of the 618-11 Burial Ground
8
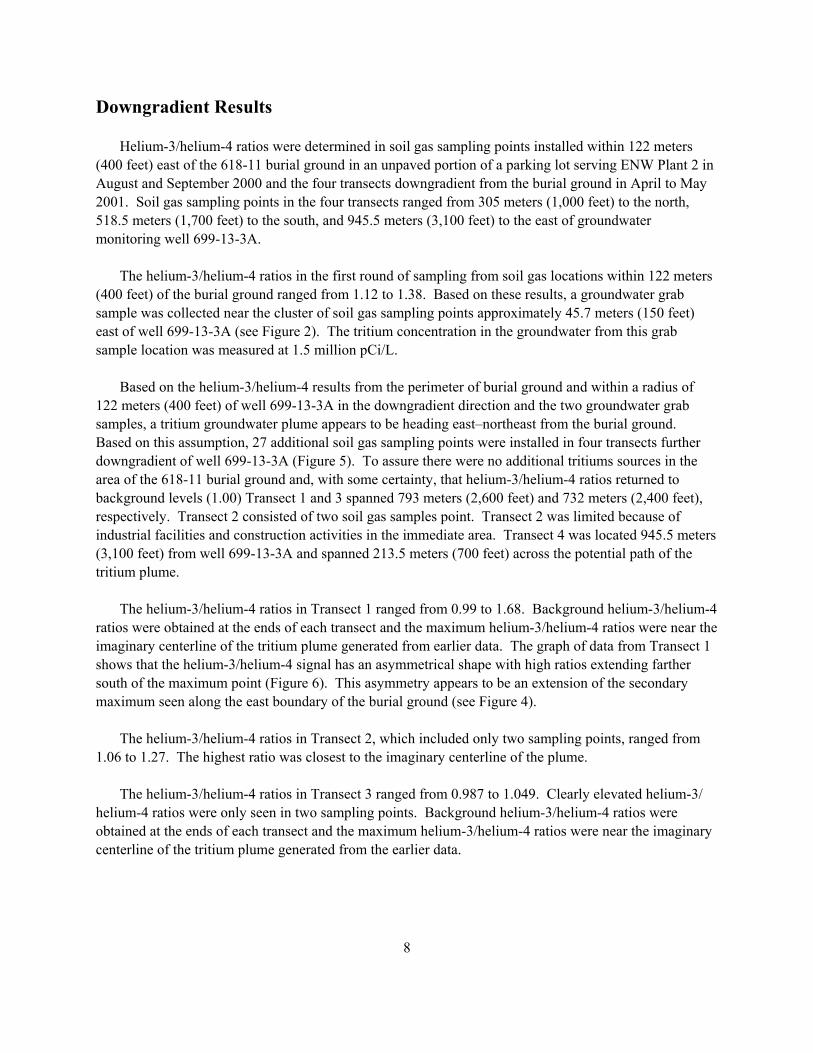
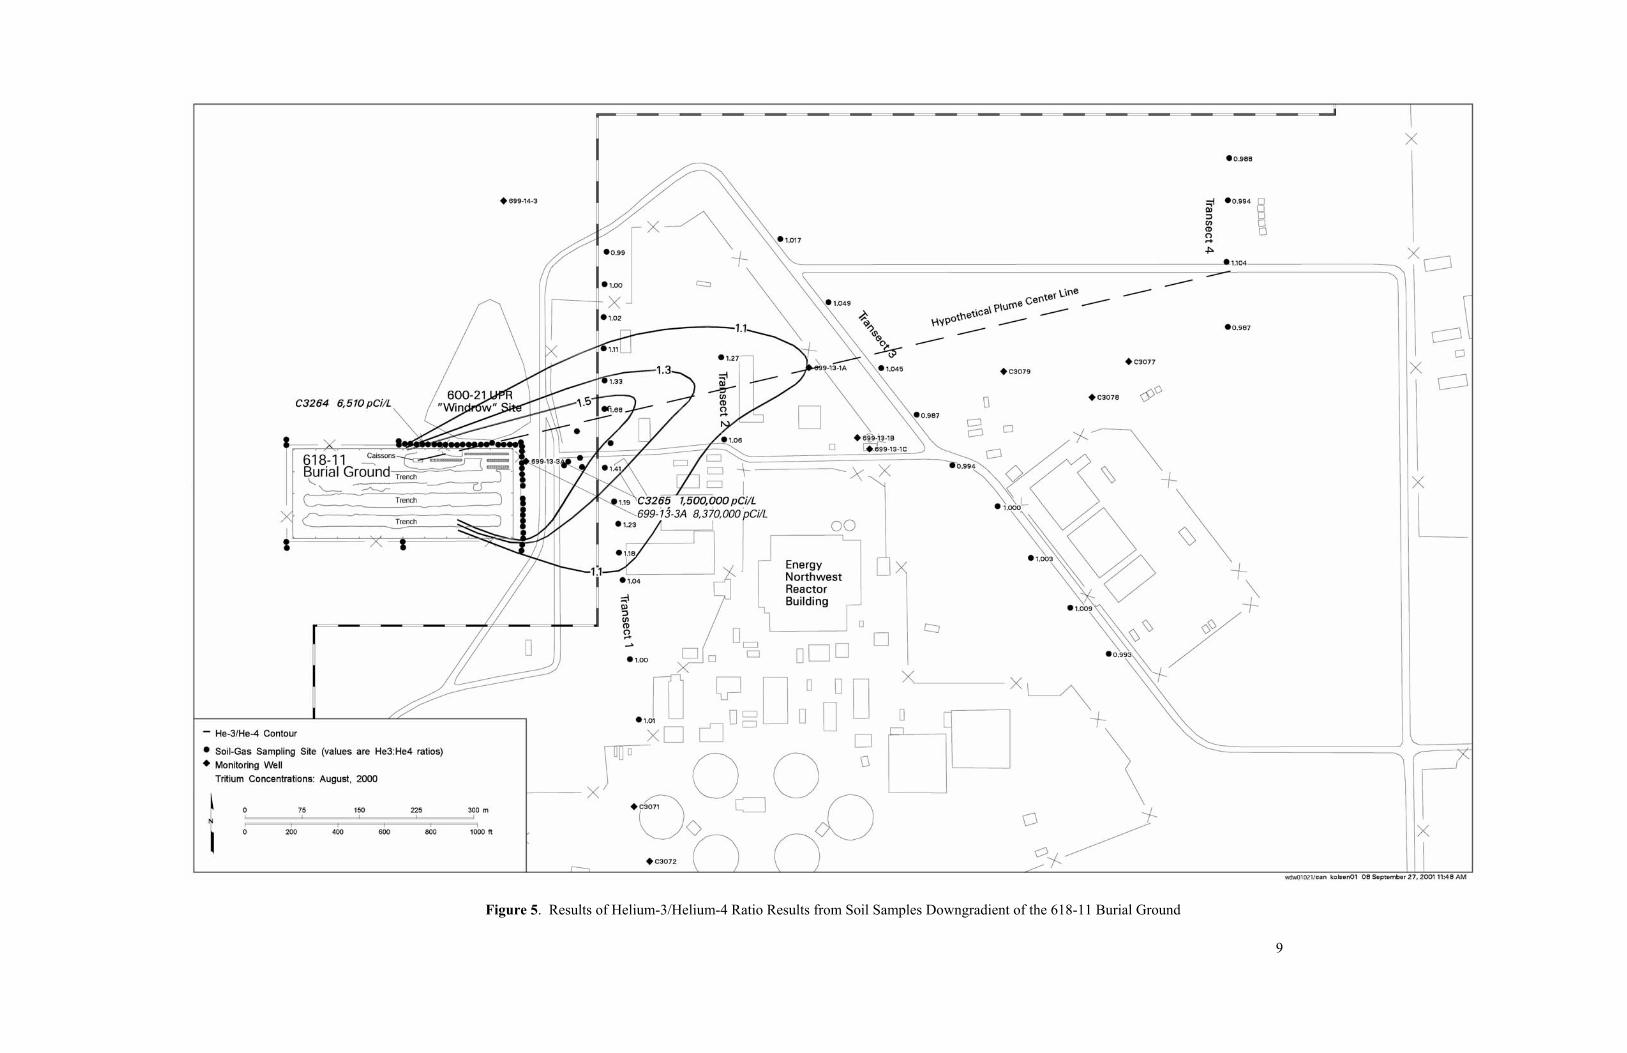
Downgradient Results Helium-3/helium-4 ratios were determined in soil gas sampling points installed within 122 meters (400 feet) east of the 618-11 burial ground in an unpaved portion of a parking lot serving ENW Plant 2 in August and September 2000 and the four transects downgradient from the burial ground in April to May 2001. Soil gas sampling points in the four transects ranged from 305 meters (1,000 feet) to the north, 518.5 meters (1,700 feet) to the south, and 945.5 meters (3,100 feet) to the east of groundwater monitoring well 699-13-3A. The helium-3/helium-4 ratios in the first round of sampling from soil gas locations within 122 meters (400 feet) of the burial ground ranged from 1.12 to 1.38. Based on these results, a groundwater grab sample was collected near the cluster of soil gas sampling points approximately 45.7 meters (150 feet) east of well 699-13-3A (see Figure 2). The tritium concentration in the groundwater from this grab sample location was measured at 1.5 million pCi/L. Based on the helium-3/helium-4 results from the perimeter of burial ground and within a radius of 122 meters (400 feet) of well 699-13-3A in the downgradient direction and the two groundwater grab samples, a tritium groundwater plume appears to be heading east–northeast from the burial ground. Based on this assumption, 27 additional soil gas sampling points were installed in four transects further downgradient of well 699-13-3A (Figure 5). To assure there were no additional tritiums sources in the area of the 618-11 burial ground and, with some certainty, that helium-3/helium-4 ratios returned to background levels (1.00) Transect 1 and 3 spanned 793 meters (2,600 feet) and 732 meters (2,400 feet), respectively. Transect 2 consisted of two soil gas samples point. Transect 2 was limited because of industrial facilities and construction activities in the immediate area. Transect 4 was located 945.5 meters (3,100 feet) from well 699-13-3A and spanned 213.5 meters (700 feet) across the potential path of the tritium plume. The helium-3/helium-4 ratios in Transect 1 ranged from 0.99 to 1.68. Background helium-3/helium-4 ratios were obtained at the ends of each transect and the maximum helium-3/helium-4 ratios were near the imaginary centerline of the tritium plume generated from earlier data. The graph of data from Transect 1 shows that the helium-3/helium-4 signal has an asymmetrical shape with high ratios extending farther south of the maximum point (Figure 6). This asymmetry appears to be an extension of the secondary maximum seen along the east boundary of the burial ground (see Figure 4). The helium-3/helium-4 ratios in Transect 2, which included only two sampling points, ranged from 1.06 to 1.27. The highest ratio was closest to the imaginary centerline of the plume. The helium-3/helium-4 ratios in Transect 3 ranged from 0.987 to 1.049. Clearly elevated helium-3/ helium-4 ratios were only seen in two sampling points. Background helium-3/helium-4 ratios were obtained at the ends of each transect and the maximum helium-3/helium-4 ratios were near the imaginary centerline of the tritium plume generated from the earlier data.
9
Figure 5. Results of Helium-3/Helium-4 Ratio Results from Soil Samples Downgradient of the 618-11 Burial Ground
11
Transect 1
0.91
1.11.21.31.41.51.61.71.8
126900 127000 127100 127200 127300 127400 127500 127600
Northing
He-
3:H
e-4
South North
Figure 6. Helium-3/Helium-4 Ratio Results from Soil Gas Samples from Transect 1 The helium-3/helium-4 ratios in Transect 4 ranged from 0.987 to 1.104. Background helium-3/helium-4 ratios were obtained at the ends of each transect and elevated helium-3/helium-4 ratios were observed in only one sampling point. Transect 4 is topographically lower than the other transects so the sample points are closer to the water table. This may explain why the maximum helium-3/helium-4 ratio seen in Transect 4 is greater than the maximum seen closer to the source, in Transect 3.
Conclusions The helium soil gas measurement provided a rapid and cost-effective technique to define the probable shape and extent of tritium contamination from the 618-11 burial ground. Based on the helium-3/helium-4 ratio results from around the burial ground and the groundwater grab samples from the highest helium-3/helium-4 ratio on the north side, the main vadose zone source of the tritium is likely from within the burial ground near the mid point of the north side. The second helium-3/helium-4 ratio maximum located at the northeast corner of the burial ground is probably from the groundwater tritium plume affecting well 699-13-3A. Based upon the helium-3/helium-4 ratio data immediately downgradient of burial ground 618-11 and the downgradient transects, a groundwater tritium plume appears to be traveling toward the east-northeast direction. The tritium groundwater plume has reached the furthest transect for the burial ground 950 meters (3,100 feet) downgradient of the burial ground. The width of the tritium plume is estimated to
12
be 305 meters (1,000 feet) at Transect 1, 204.3 meters (670 feet) at Transect 3, and 88.5 meters (290 feet) at Transect 4. The helium-3/helium-4 ratio results also suggest there are no other tritium sources either upgradient of the burial ground or cross gradient of the burial ground. Based on the helium-3/helium-4 results from the soil gas survey, 6 downgradient groundwater grab and well locations were identified to verify the tritium groundwater plume locations, tritium groundwater concentrations as a function of depth in aquifer, and tritium groundwater concentrations.
References Demiter, J.A., and W.O. Greenhalgh. 1997. Characterization of the 618-11 Solid Waste Burial Ground, Disposed Waste, and Description of the Waste-Generating Facilities. HNF-EP-0649, Waste Manage-ment Federal Services, Inc., Richland, Washington. DOE. 2000. Soil Vapor/Groundwater Sampling and Analysis Plane for Phase IIa Plume Investigation Near Burial Ground 618-11. DOE/RL-2000-53, Rev 0, U.S. Department of Energy, Richland Operations Office, Richland, Washington. DOE. 2001. Soil Vapor/Groundwater Sampling and Analysis Plan for Phase IIa Plume Investigation Near Burial Ground 618-11. DOE/RL-2000-53 Rev. 1, U.S. Department of Energy, Richland Operations Office, Richland, Washington. Johnson, A.B., T.J. Kabele, and W.E. Gurwell. 1976. Tritium Production from Ceramic Targets: A Summary of the Hanford Coproduct Program. BNWL-2097, Battelle Northwest Laboratories, Richland, Washington. Poreda, R.J., T.E. Cerling, and D.K. Salomon. 1988. “Tritium and Helium Isotopes as Hydrologic Tracers in a Shallow Unconfined Aquifer.” Journal of Hydrology 103:1-9. Olsen, K. B., G. W. Patton, P. Evan Dresel, J. C. Evans, and R. Poreda. 1999. Measurement of Tritium in Gas Phase Soil Moisture and Helium-3 in Soil Gas at the Hanford Townsite and 100-K Area. PNNL-13217, Pacific Northwest National Laboratory, Richland, Washington. Schlosser, P., M. Stute, H. Dőrr, C. Sonntag, and K.O. Munnich. 1988. “Tritium/3He Dating of Shallow Groundwater.” Earth and Planetary Science Letters 89, 353. Yunker, W. (ed.). 1976. Extraction of Tritium from Lithium Aluminate. HEDL-TME 76-81, Hanford Engineering Development Laboratory, Westinghouse Hanford Company, Richland, Washington.
Appendix A
Installation Parameters of Soil Gas Sampling Points
A.1
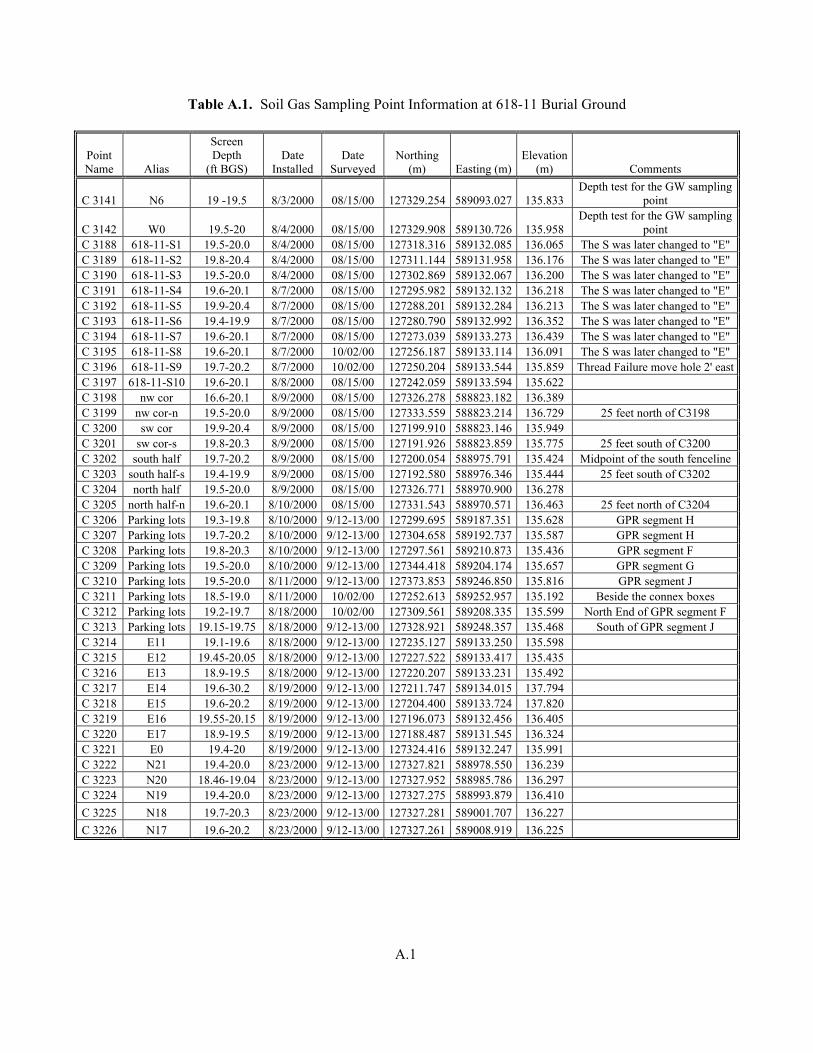
Table A.1. Soil Gas Sampling Point Information at 618-11 Burial Ground
Point Name Alias
Screen Depth
(ft BGS) Date
Installed Date
Surveyed Northing
(m) Easting (m)Elevation
(m) Comments
C 3141 N6 19 -19.5 8/3/2000 08/15/00 127329.254 589093.027 135.833 Depth test for the GW sampling
point
C 3142 W0 19.5-20 8/4/2000 08/15/00 127329.908 589130.726 135.958 Depth test for the GW sampling
point C 3188 618-11-S1 19.5-20.0 8/4/2000 08/15/00 127318.316 589132.085 136.065 The S was later changed to "E" C 3189 618-11-S2 19.8-20.4 8/4/2000 08/15/00 127311.144 589131.958 136.176 The S was later changed to "E" C 3190 618-11-S3 19.5-20.0 8/4/2000 08/15/00 127302.869 589132.067 136.200 The S was later changed to "E" C 3191 618-11-S4 19.6-20.1 8/7/2000 08/15/00 127295.982 589132.132 136.218 The S was later changed to "E" C 3192 618-11-S5 19.9-20.4 8/7/2000 08/15/00 127288.201 589132.284 136.213 The S was later changed to "E" C 3193 618-11-S6 19.4-19.9 8/7/2000 08/15/00 127280.790 589132.992 136.352 The S was later changed to "E" C 3194 618-11-S7 19.6-20.1 8/7/2000 08/15/00 127273.039 589133.273 136.439 The S was later changed to "E" C 3195 618-11-S8 19.6-20.1 8/7/2000 10/02/00 127256.187 589133.114 136.091 The S was later changed to "E" C 3196 618-11-S9 19.7-20.2 8/7/2000 10/02/00 127250.204 589133.544 135.859 Thread Failure move hole 2' eastC 3197 618-11-S10 19.6-20.1 8/8/2000 08/15/00 127242.059 589133.594 135.622 C 3198 nw cor 16.6-20.1 8/9/2000 08/15/00 127326.278 588823.182 136.389 C 3199 nw cor-n 19.5-20.0 8/9/2000 08/15/00 127333.559 588823.214 136.729 25 feet north of C3198 C 3200 sw cor 19.9-20.4 8/9/2000 08/15/00 127199.910 588823.146 135.949 C 3201 sw cor-s 19.8-20.3 8/9/2000 08/15/00 127191.926 588823.859 135.775 25 feet south of C3200 C 3202 south half 19.7-20.2 8/9/2000 08/15/00 127200.054 588975.791 135.424 Midpoint of the south fenceline C 3203 south half-s 19.4-19.9 8/9/2000 08/15/00 127192.580 588976.346 135.444 25 feet south of C3202 C 3204 north half 19.5-20.0 8/9/2000 08/15/00 127326.771 588970.900 136.278 C 3205 north half-n 19.6-20.1 8/10/2000 08/15/00 127331.543 588970.571 136.463 25 feet north of C3204 C 3206 Parking lots 19.3-19.8 8/10/2000 9/12-13/00 127299.695 589187.351 135.628 GPR segment H C 3207 Parking lots 19.7-20.2 8/10/2000 9/12-13/00 127304.658 589192.737 135.587 GPR segment H C 3208 Parking lots 19.8-20.3 8/10/2000 9/12-13/00 127297.561 589210.873 135.436 GPR segment F C 3209 Parking lots 19.5-20.0 8/10/2000 9/12-13/00 127344.418 589204.174 135.657 GPR segment G C 3210 Parking lots 19.5-20.0 8/11/2000 9/12-13/00 127373.853 589246.850 135.816 GPR segment J C 3211 Parking lots 18.5-19.0 8/11/2000 10/02/00 127252.613 589252.957 135.192 Beside the connex boxes C 3212 Parking lots 19.2-19.7 8/18/2000 10/02/00 127309.561 589208.335 135.599 North End of GPR segment F C 3213 Parking lots 19.15-19.75 8/18/2000 9/12-13/00 127328.921 589248.357 135.468 South of GPR segment J C 3214 E11 19.1-19.6 8/18/2000 9/12-13/00 127235.127 589133.250 135.598 C 3215 E12 19.45-20.05 8/18/2000 9/12-13/00 127227.522 589133.417 135.435 C 3216 E13 18.9-19.5 8/18/2000 9/12-13/00 127220.207 589133.231 135.492 C 3217 E14 19.6-30.2 8/19/2000 9/12-13/00 127211.747 589134.015 137.794 C 3218 E15 19.6-20.2 8/19/2000 9/12-13/00 127204.400 589133.724 137.820 C 3219 E16 19.55-20.15 8/19/2000 9/12-13/00 127196.073 589132.456 136.405 C 3220 E17 18.9-19.5 8/19/2000 9/12-13/00 127188.487 589131.545 136.324 C 3221 E0 19.4-20 8/19/2000 9/12-13/00 127324.416 589132.247 135.991 C 3222 N21 19.4-20.0 8/23/2000 9/12-13/00 127327.821 588978.550 136.239 C 3223 N20 18.46-19.04 8/23/2000 9/12-13/00 127327.952 588985.786 136.297 C 3224 N19 19.4-20.0 8/23/2000 9/12-13/00 127327.275 588993.879 136.410 C 3225 N18 19.7-20.3 8/23/2000 9/12-13/00 127327.281 589001.707 136.227 C 3226 N17 19.6-20.2 8/23/2000 9/12-13/00 127327.261 589008.919 136.225
A.2
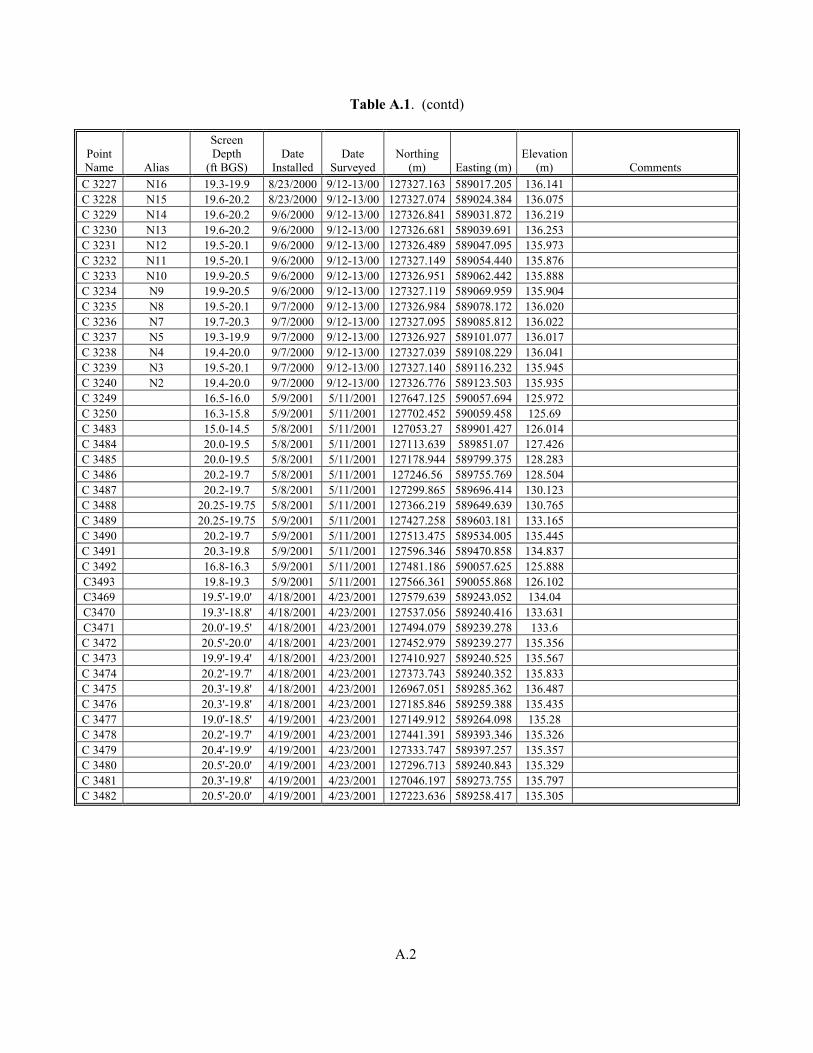
Table A.1. (contd)
Point Name Alias
Screen Depth
(ft BGS) Date
Installed Date
Surveyed Northing
(m) Easting (m)Elevation
(m) Comments C 3227 N16 19.3-19.9 8/23/2000 9/12-13/00 127327.163 589017.205 136.141 C 3228 N15 19.6-20.2 8/23/2000 9/12-13/00 127327.074 589024.384 136.075 C 3229 N14 19.6-20.2 9/6/2000 9/12-13/00 127326.841 589031.872 136.219 C 3230 N13 19.6-20.2 9/6/2000 9/12-13/00 127326.681 589039.691 136.253 C 3231 N12 19.5-20.1 9/6/2000 9/12-13/00 127326.489 589047.095 135.973 C 3232 N11 19.5-20.1 9/6/2000 9/12-13/00 127327.149 589054.440 135.876 C 3233 N10 19.9-20.5 9/6/2000 9/12-13/00 127326.951 589062.442 135.888 C 3234 N9 19.9-20.5 9/6/2000 9/12-13/00 127327.119 589069.959 135.904 C 3235 N8 19.5-20.1 9/7/2000 9/12-13/00 127326.984 589078.172 136.020 C 3236 N7 19.7-20.3 9/7/2000 9/12-13/00 127327.095 589085.812 136.022 C 3237 N5 19.3-19.9 9/7/2000 9/12-13/00 127326.927 589101.077 136.017 C 3238 N4 19.4-20.0 9/7/2000 9/12-13/00 127327.039 589108.229 136.041 C 3239 N3 19.5-20.1 9/7/2000 9/12-13/00 127327.140 589116.232 135.945 C 3240 N2 19.4-20.0 9/7/2000 9/12-13/00 127326.776 589123.503 135.935 C 3249 16.5-16.0 5/9/2001 5/11/2001 127647.125 590057.694 125.972 C 3250 16.3-15.8 5/9/2001 5/11/2001 127702.452 590059.458 125.69 C 3483 15.0-14.5 5/8/2001 5/11/2001 127053.27 589901.427 126.014 C 3484 20.0-19.5 5/8/2001 5/11/2001 127113.639 589851.07 127.426 C 3485 20.0-19.5 5/8/2001 5/11/2001 127178.944 589799.375 128.283 C 3486 20.2-19.7 5/8/2001 5/11/2001 127246.56 589755.769 128.504 C 3487 20.2-19.7 5/8/2001 5/11/2001 127299.865 589696.414 130.123 C 3488 20.25-19.75 5/8/2001 5/11/2001 127366.219 589649.639 130.765 C 3489 20.25-19.75 5/9/2001 5/11/2001 127427.258 589603.181 133.165 C 3490 20.2-19.7 5/9/2001 5/11/2001 127513.475 589534.005 135.445 C 3491 20.3-19.8 5/9/2001 5/11/2001 127596.346 589470.858 134.837 C 3492 16.8-16.3 5/9/2001 5/11/2001 127481.186 590057.625 125.888 C3493 19.8-19.3 5/9/2001 5/11/2001 127566.361 590055.868 126.102 C3469 19.5'-19.0' 4/18/2001 4/23/2001 127579.639 589243.052 134.04 C3470 19.3'-18.8' 4/18/2001 4/23/2001 127537.056 589240.416 133.631 C3471 20.0'-19.5' 4/18/2001 4/23/2001 127494.079 589239.278 133.6 C 3472 20.5'-20.0' 4/18/2001 4/23/2001 127452.979 589239.277 135.356 C 3473 19.9'-19.4' 4/18/2001 4/23/2001 127410.927 589240.525 135.567 C 3474 20.2'-19.7' 4/18/2001 4/23/2001 127373.743 589240.352 135.833 C 3475 20.3'-19.8' 4/18/2001 4/23/2001 126967.051 589285.362 136.487 C 3476 20.3'-19.8' 4/18/2001 4/23/2001 127185.846 589259.388 135.435 C 3477 19.0'-18.5' 4/19/2001 4/23/2001 127149.912 589264.098 135.28 C 3478 20.2'-19.7' 4/19/2001 4/23/2001 127441.391 589393.346 135.326 C 3479 20.4'-19.9' 4/19/2001 4/23/2001 127333.747 589397.257 135.357 C 3480 20.5'-20.0' 4/19/2001 4/23/2001 127296.713 589240.843 135.329 C 3481 20.3'-19.8' 4/19/2001 4/23/2001 127046.197 589273.755 135.797 C 3482 20.5'-20.0' 4/19/2001 4/23/2001 127223.636 589258.417 135.305
A.3
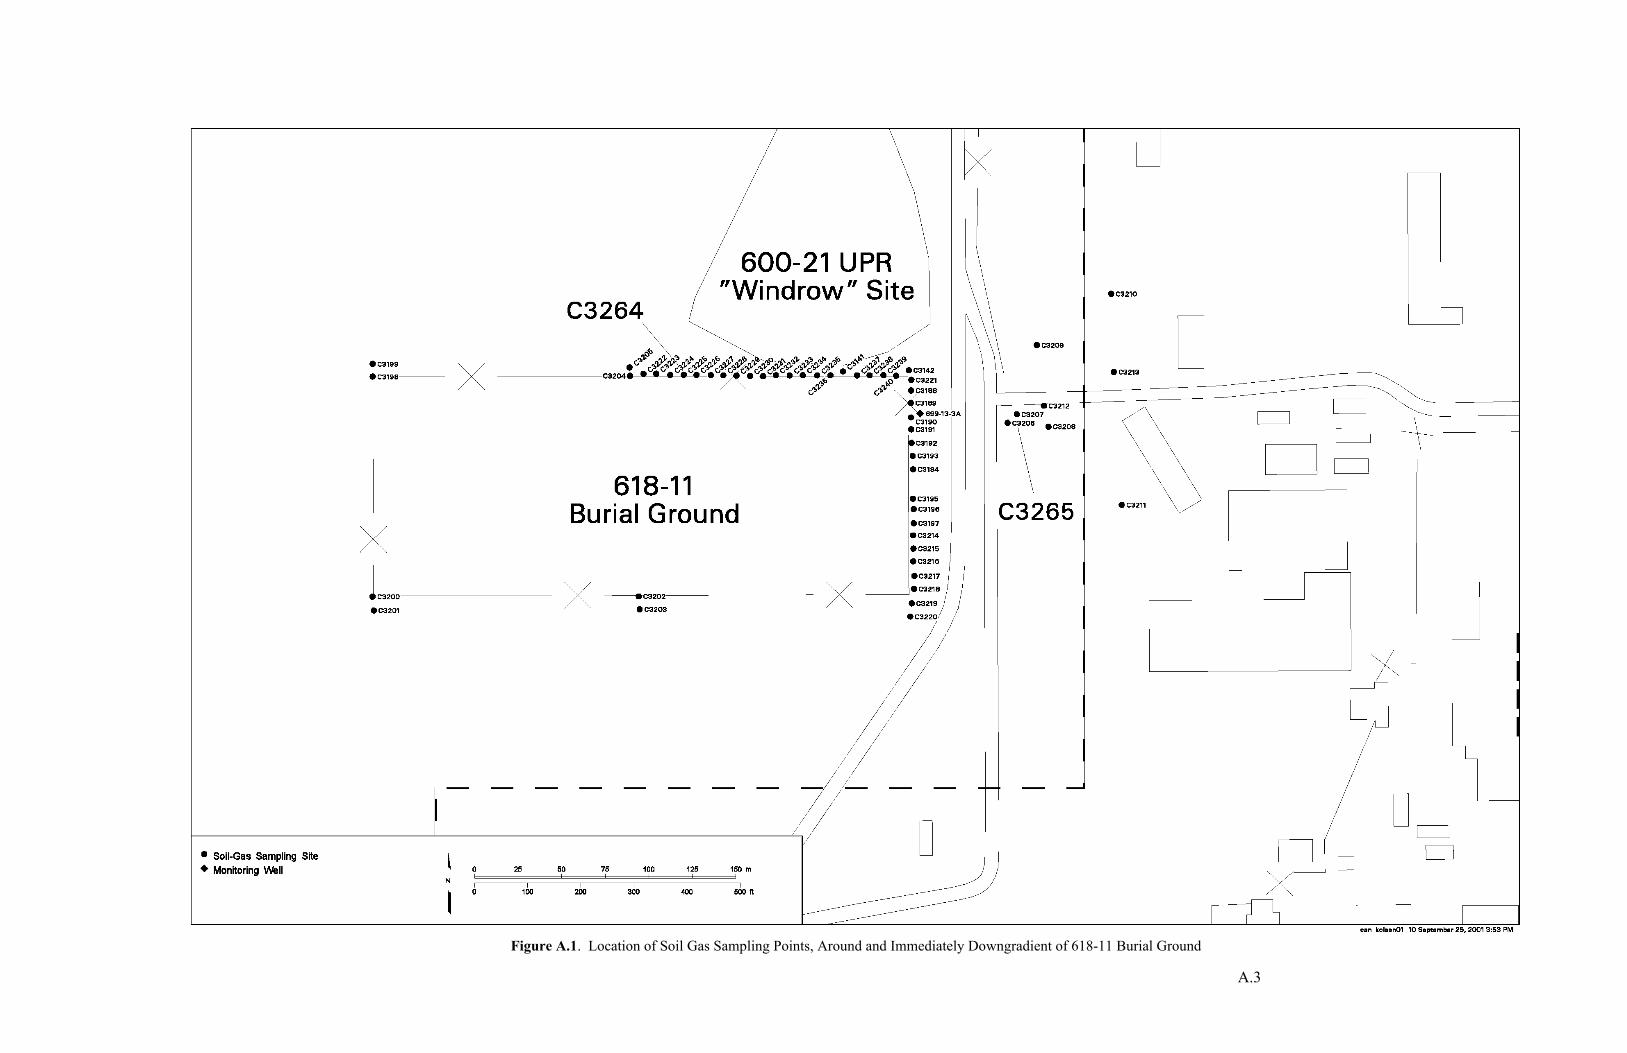
Figure A.1. Location of Soil Gas Sampling Points, Around and Immediately Downgradient of 618-11 Burial Ground

A.5
Figure A.2. Location of Soil Gas Sampling Points in Transect 1-4, Downgradient of 618-11 Burial Ground
Appendix B
Complete Gas Analytical Results for all Soil Gas Samples Collected
B.1
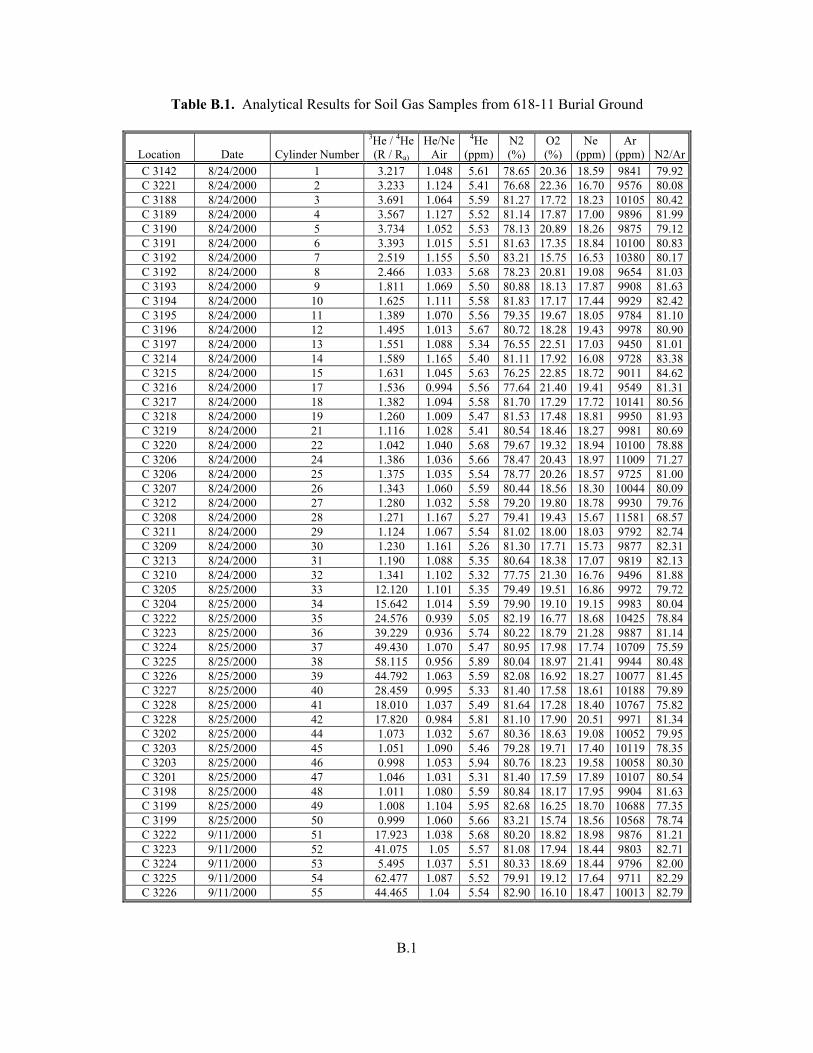
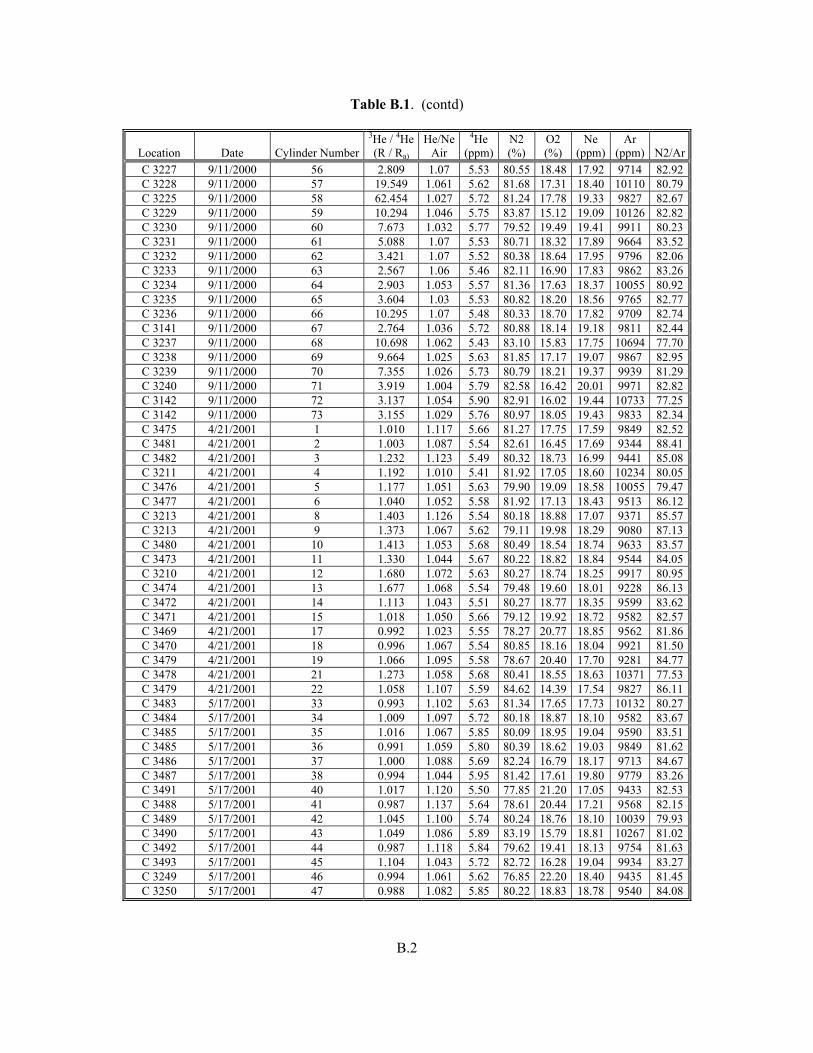
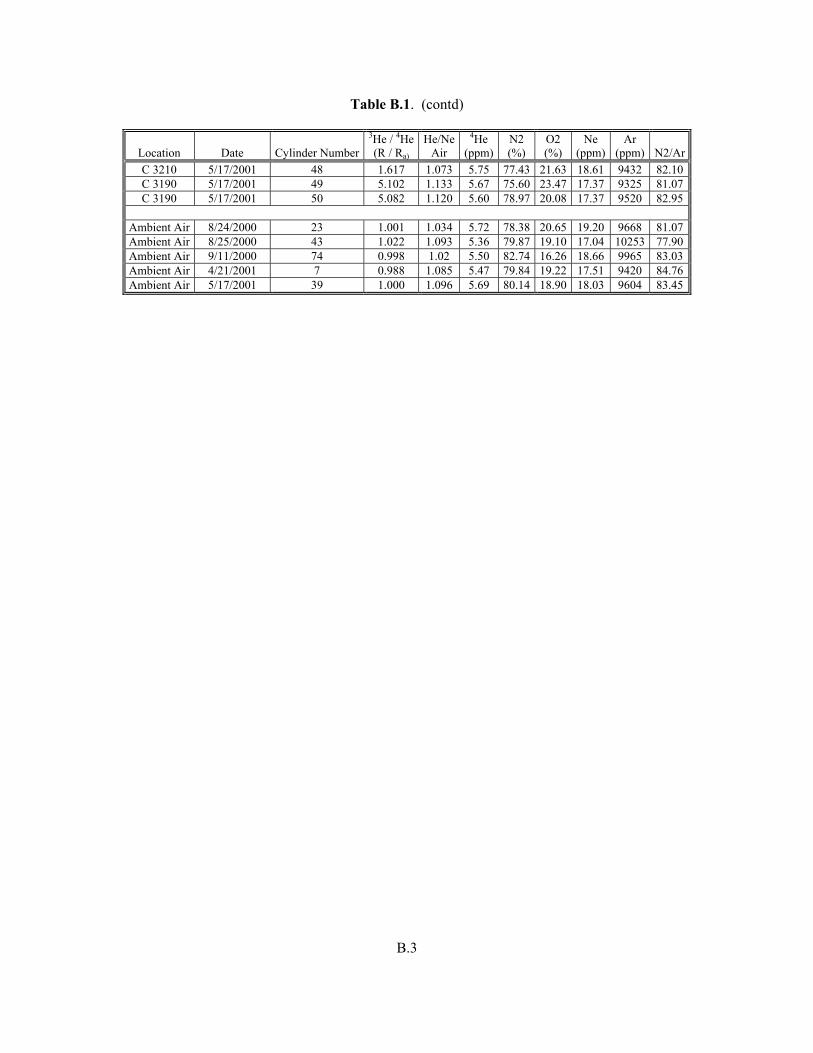
Table B.1. Analytical Results for Soil Gas Samples from 618-11 Burial Ground
Location Date Cylinder Number3He / 4He(R / Ra)
He/NeAir
4He(ppm)
N2(%)
O2(%)
Ne (ppm)
Ar (ppm) N2/Ar
C 3142 8/24/2000 1 3.217 1.048 5.61 78.65 20.36 18.59 9841 79.92C 3221 8/24/2000 2 3.233 1.124 5.41 76.68 22.36 16.70 9576 80.08C 3188 8/24/2000 3 3.691 1.064 5.59 81.27 17.72 18.23 10105 80.42C 3189 8/24/2000 4 3.567 1.127 5.52 81.14 17.87 17.00 9896 81.99C 3190 8/24/2000 5 3.734 1.052 5.53 78.13 20.89 18.26 9875 79.12C 3191 8/24/2000 6 3.393 1.015 5.51 81.63 17.35 18.84 10100 80.83C 3192 8/24/2000 7 2.519 1.155 5.50 83.21 15.75 16.53 10380 80.17C 3192 8/24/2000 8 2.466 1.033 5.68 78.23 20.81 19.08 9654 81.03C 3193 8/24/2000 9 1.811 1.069 5.50 80.88 18.13 17.87 9908 81.63C 3194 8/24/2000 10 1.625 1.111 5.58 81.83 17.17 17.44 9929 82.42C 3195 8/24/2000 11 1.389 1.070 5.56 79.35 19.67 18.05 9784 81.10C 3196 8/24/2000 12 1.495 1.013 5.67 80.72 18.28 19.43 9978 80.90C 3197 8/24/2000 13 1.551 1.088 5.34 76.55 22.51 17.03 9450 81.01C 3214 8/24/2000 14 1.589 1.165 5.40 81.11 17.92 16.08 9728 83.38C 3215 8/24/2000 15 1.631 1.045 5.63 76.25 22.85 18.72 9011 84.62C 3216 8/24/2000 17 1.536 0.994 5.56 77.64 21.40 19.41 9549 81.31C 3217 8/24/2000 18 1.382 1.094 5.58 81.70 17.29 17.72 10141 80.56C 3218 8/24/2000 19 1.260 1.009 5.47 81.53 17.48 18.81 9950 81.93C 3219 8/24/2000 21 1.116 1.028 5.41 80.54 18.46 18.27 9981 80.69C 3220 8/24/2000 22 1.042 1.040 5.68 79.67 19.32 18.94 10100 78.88C 3206 8/24/2000 24 1.386 1.036 5.66 78.47 20.43 18.97 11009 71.27C 3206 8/24/2000 25 1.375 1.035 5.54 78.77 20.26 18.57 9725 81.00C 3207 8/24/2000 26 1.343 1.060 5.59 80.44 18.56 18.30 10044 80.09C 3212 8/24/2000 27 1.280 1.032 5.58 79.20 19.80 18.78 9930 79.76C 3208 8/24/2000 28 1.271 1.167 5.27 79.41 19.43 15.67 11581 68.57C 3211 8/24/2000 29 1.124 1.067 5.54 81.02 18.00 18.03 9792 82.74C 3209 8/24/2000 30 1.230 1.161 5.26 81.30 17.71 15.73 9877 82.31C 3213 8/24/2000 31 1.190 1.088 5.35 80.64 18.38 17.07 9819 82.13C 3210 8/24/2000 32 1.341 1.102 5.32 77.75 21.30 16.76 9496 81.88C 3205 8/25/2000 33 12.120 1.101 5.35 79.49 19.51 16.86 9972 79.72C 3204 8/25/2000 34 15.642 1.014 5.59 79.90 19.10 19.15 9983 80.04C 3222 8/25/2000 35 24.576 0.939 5.05 82.19 16.77 18.68 10425 78.84C 3223 8/25/2000 36 39.229 0.936 5.74 80.22 18.79 21.28 9887 81.14C 3224 8/25/2000 37 49.430 1.070 5.47 80.95 17.98 17.74 10709 75.59C 3225 8/25/2000 38 58.115 0.956 5.89 80.04 18.97 21.41 9944 80.48C 3226 8/25/2000 39 44.792 1.063 5.59 82.08 16.92 18.27 10077 81.45C 3227 8/25/2000 40 28.459 0.995 5.33 81.40 17.58 18.61 10188 79.89C 3228 8/25/2000 41 18.010 1.037 5.49 81.64 17.28 18.40 10767 75.82C 3228 8/25/2000 42 17.820 0.984 5.81 81.10 17.90 20.51 9971 81.34C 3202 8/25/2000 44 1.073 1.032 5.67 80.36 18.63 19.08 10052 79.95C 3203 8/25/2000 45 1.051 1.090 5.46 79.28 19.71 17.40 10119 78.35C 3203 8/25/2000 46 0.998 1.053 5.94 80.76 18.23 19.58 10058 80.30C 3201 8/25/2000 47 1.046 1.031 5.31 81.40 17.59 17.89 10107 80.54C 3198 8/25/2000 48 1.011 1.080 5.59 80.84 18.17 17.95 9904 81.63C 3199 8/25/2000 49 1.008 1.104 5.95 82.68 16.25 18.70 10688 77.35C 3199 8/25/2000 50 0.999 1.060 5.66 83.21 15.74 18.56 10568 78.74C 3222 9/11/2000 51 17.923 1.038 5.68 80.20 18.82 18.98 9876 81.21C 3223 9/11/2000 52 41.075 1.05 5.57 81.08 17.94 18.44 9803 82.71C 3224 9/11/2000 53 5.495 1.037 5.51 80.33 18.69 18.44 9796 82.00C 3225 9/11/2000 54 62.477 1.087 5.52 79.91 19.12 17.64 9711 82.29C 3226 9/11/2000 55 44.465 1.04 5.54 82.90 16.10 18.47 10013 82.79
B.2
Table B.1. (contd)
Location Date Cylinder Number3He / 4He(R / Ra)
He/NeAir
4He(ppm)
N2(%)
O2(%)
Ne (ppm)
Ar (ppm) N2/Ar
C 3227 9/11/2000 56 2.809 1.07 5.53 80.55 18.48 17.92 9714 82.92C 3228 9/11/2000 57 19.549 1.061 5.62 81.68 17.31 18.40 10110 80.79C 3225 9/11/2000 58 62.454 1.027 5.72 81.24 17.78 19.33 9827 82.67C 3229 9/11/2000 59 10.294 1.046 5.75 83.87 15.12 19.09 10126 82.82C 3230 9/11/2000 60 7.673 1.032 5.77 79.52 19.49 19.41 9911 80.23C 3231 9/11/2000 61 5.088 1.07 5.53 80.71 18.32 17.89 9664 83.52C 3232 9/11/2000 62 3.421 1.07 5.52 80.38 18.64 17.95 9796 82.06C 3233 9/11/2000 63 2.567 1.06 5.46 82.11 16.90 17.83 9862 83.26C 3234 9/11/2000 64 2.903 1.053 5.57 81.36 17.63 18.37 10055 80.92C 3235 9/11/2000 65 3.604 1.03 5.53 80.82 18.20 18.56 9765 82.77C 3236 9/11/2000 66 10.295 1.07 5.48 80.33 18.70 17.82 9709 82.74C 3141 9/11/2000 67 2.764 1.036 5.72 80.88 18.14 19.18 9811 82.44C 3237 9/11/2000 68 10.698 1.062 5.43 83.10 15.83 17.75 10694 77.70C 3238 9/11/2000 69 9.664 1.025 5.63 81.85 17.17 19.07 9867 82.95C 3239 9/11/2000 70 7.355 1.026 5.73 80.79 18.21 19.37 9939 81.29C 3240 9/11/2000 71 3.919 1.004 5.79 82.58 16.42 20.01 9971 82.82C 3142 9/11/2000 72 3.137 1.054 5.90 82.91 16.02 19.44 10733 77.25C 3142 9/11/2000 73 3.155 1.029 5.76 80.97 18.05 19.43 9833 82.34C 3475 4/21/2001 1 1.010 1.117 5.66 81.27 17.75 17.59 9849 82.52C 3481 4/21/2001 2 1.003 1.087 5.54 82.61 16.45 17.69 9344 88.41C 3482 4/21/2001 3 1.232 1.123 5.49 80.32 18.73 16.99 9441 85.08C 3211 4/21/2001 4 1.192 1.010 5.41 81.92 17.05 18.60 10234 80.05C 3476 4/21/2001 5 1.177 1.051 5.63 79.90 19.09 18.58 10055 79.47C 3477 4/21/2001 6 1.040 1.052 5.58 81.92 17.13 18.43 9513 86.12C 3213 4/21/2001 8 1.403 1.126 5.54 80.18 18.88 17.07 9371 85.57C 3213 4/21/2001 9 1.373 1.067 5.62 79.11 19.98 18.29 9080 87.13C 3480 4/21/2001 10 1.413 1.053 5.68 80.49 18.54 18.74 9633 83.57C 3473 4/21/2001 11 1.330 1.044 5.67 80.22 18.82 18.84 9544 84.05C 3210 4/21/2001 12 1.680 1.072 5.63 80.27 18.74 18.25 9917 80.95C 3474 4/21/2001 13 1.677 1.068 5.54 79.48 19.60 18.01 9228 86.13C 3472 4/21/2001 14 1.113 1.043 5.51 80.27 18.77 18.35 9599 83.62C 3471 4/21/2001 15 1.018 1.050 5.66 79.12 19.92 18.72 9582 82.57C 3469 4/21/2001 17 0.992 1.023 5.55 78.27 20.77 18.85 9562 81.86C 3470 4/21/2001 18 0.996 1.067 5.54 80.85 18.16 18.04 9921 81.50C 3479 4/21/2001 19 1.066 1.095 5.58 78.67 20.40 17.70 9281 84.77C 3478 4/21/2001 21 1.273 1.058 5.68 80.41 18.55 18.63 10371 77.53C 3479 4/21/2001 22 1.058 1.107 5.59 84.62 14.39 17.54 9827 86.11C 3483 5/17/2001 33 0.993 1.102 5.63 81.34 17.65 17.73 10132 80.27C 3484 5/17/2001 34 1.009 1.097 5.72 80.18 18.87 18.10 9582 83.67C 3485 5/17/2001 35 1.016 1.067 5.85 80.09 18.95 19.04 9590 83.51C 3485 5/17/2001 36 0.991 1.059 5.80 80.39 18.62 19.03 9849 81.62C 3486 5/17/2001 37 1.000 1.088 5.69 82.24 16.79 18.17 9713 84.67C 3487 5/17/2001 38 0.994 1.044 5.95 81.42 17.61 19.80 9779 83.26C 3491 5/17/2001 40 1.017 1.120 5.50 77.85 21.20 17.05 9433 82.53C 3488 5/17/2001 41 0.987 1.137 5.64 78.61 20.44 17.21 9568 82.15C 3489 5/17/2001 42 1.045 1.100 5.74 80.24 18.76 18.10 10039 79.93C 3490 5/17/2001 43 1.049 1.086 5.89 83.19 15.79 18.81 10267 81.02C 3492 5/17/2001 44 0.987 1.118 5.84 79.62 19.41 18.13 9754 81.63C 3493 5/17/2001 45 1.104 1.043 5.72 82.72 16.28 19.04 9934 83.27C 3249 5/17/2001 46 0.994 1.061 5.62 76.85 22.20 18.40 9435 81.45C 3250 5/17/2001 47 0.988 1.082 5.85 80.22 18.83 18.78 9540 84.08
B.3
Table B.1. (contd)
Location Date Cylinder Number3He / 4He(R / Ra)
He/NeAir
4He(ppm)
N2(%)
O2(%)
Ne (ppm)
Ar (ppm) N2/Ar
C 3210 5/17/2001 48 1.617 1.073 5.75 77.43 21.63 18.61 9432 82.10C 3190 5/17/2001 49 5.102 1.133 5.67 75.60 23.47 17.37 9325 81.07C 3190 5/17/2001 50 5.082 1.120 5.60 78.97 20.08 17.37 9520 82.95
Ambient Air 8/24/2000 23 1.001 1.034 5.72 78.38 20.65 19.20 9668 81.07Ambient Air 8/25/2000 43 1.022 1.093 5.36 79.87 19.10 17.04 10253 77.90Ambient Air 9/11/2000 74 0.998 1.02 5.50 82.74 16.26 18.66 9965 83.03Ambient Air 4/21/2001 7 0.988 1.085 5.47 79.84 19.22 17.51 9420 84.76Ambient Air 5/17/2001 39 1.000 1.096 5.69 80.14 18.90 18.03 9604 83.45
PNNL-13675
Distr.1
Distribution No. of Copies OFFSITE R. Poreda Department of Earth and Environmental Sciences 227 Hutchison Hall University of Rochester Rochester, NY 14627 ONSITE 16 DOE Richland Operations Office M. J. Furman A5-13 R. D. Hildebrand A5-13 R. G. McLeod H0-12 J. G. Morse A5-13 K. M. Thompson (10) A5-13 Public Reading Room (2) H2-53
No. of Copies 2 Bechtel Hanford, Inc. M. J. Graham H0-09 G. B. Mitchem H0-21 7 CH2M HILL Hanford, Inc. J. V. Borghese (5) H9-03 R. W. Ovink H9-01 L. C. Swanson H9-02 17 Pacific Northwest National Laboratory P. E. Dresel K6-96 J. S. Fruchter K6-96 J. W. Lindberg K6-81 S. P. Luttrell K6-96 K. B. Olsen (10) K6-96 R. E. Peterson K6-96 Hanford Technical Library (2) P8-55