measurement of friction coefficient on specialized duct · pdf filemeasurement of friction...
TRANSCRIPT

Measurement of friction coefficient on specialized duct tract
STANISLAV SEHNALEKTomas Bata University in ZlinFaculty of Applied Informatics
Nad Stranemi 4511, 760 05 ZlinCZECH [email protected]
MARTIN ZALESAKTomas Bata University in ZlinFaculty of Applied Informatics
Nad Stranemi 4511, 760 05 ZlinCZECH [email protected]
Abstract: Proposed paper dealing with determination of pressure loss coefficient for air duct equipments. Mea-surement was performed at newly build track in Laboratory of Environmental Engineering, Tomas Bata Universityin Zln. At the beginning of the article is definition of fan track with two options of flow direction available. Thisis followed by description of accesible volumetric flow control alternatives. In the article is described calculatemethod of minor loss coefficient from standard ISO 7235. In the result section is presented findings with discussionabout results for each measurement. Paper is concluded with outline for further research.
Key–Words: friction coefficient, air flow measurement, turbulence, pressure measurement, duct track
1 Introduction
Aerodynamic properties of air is in the scope of inter-est of researchers for more than a century. The air flowparameters were investigated by Hagen, Reyleigh,Reynolds [1], followed up by Prandtl, Moody [2],Colebrook [3], Von Karman [4] and many others.[5] The knowledge of concept properties concerningHVAC components is a prerequisite for successful de-sign technique. In the draft of ventilation ducts, thepressure loss is an important parameter to know basedon different velocities of transported air. Determina-tion of parameters for specific HVAC devices are inscope of specialized laboratories. Laboratory of suchcapabilities is maintained by authors of this article atTomas Bata University in Zlin, Faculty of Applied In-formatics and is involved in this paper. Special inter-est in actual development is put on acoustic silencersfor mounting in the ducts which is an important ele-ment within HVAC systems. With the silencers thereare two main parameters which should considered.The first one is a sound attenuation the and second oneis pressure losses. It is regrettable that these parame-ters are in opposition to each other. In the authors’ fa-cility, the Laboratory of Environmental Engineering,it is possible to test the silencers for both parametersand thus combine both parameters for better perfor-mances. In the presented paper, the focus is on mea-surement methods described by standard ISO 7235 [6]and comparison of results obtained by this standardwith analytical calculations with different approach.Mainly, this standard lacks any details of how to ac-complish such measurement of friction losses. Inves-
tigation of such procedure is a subject of the presentedpaper, where three possible ways how to execute themeasurement are compared.
Firstly, the article describes the methods of mea-surement with the test track, and the descriptionof calculation for losses by standard and alternativemethod. Above mentioned is linked with the descrip-tion of the measurement method with characterizationof used samples. Then the measured results are de-scribed, followed by discussion. The article is con-cluded by used methods and samples.
2 Methods
There is a possibility to measure minor loss coefficientof any equipment determined for installation inside aduct. For these measurements is used multiple-nozzlechamber to resolve flow rate through the duct con-figuration. There is a wall taping mounted on ductsfor measurement of static pressure before and aftersurveilled object. Such measurements and consequen-tial calculations are in scope of this article. This sec-tion will cover the description of the duct tract andtwo options for determination of minor loss coeffi-cient. Firstly by ISO 7235 [6] and subsequently byhydraulic equation. The methods section ends with abrief summary of the samples.
2.1 Fan track
There are two available dimensions for the track. Thediameters are 200mm and 400mm. For each dimen-sion there are available several types of duct which
WSEAS TRANSACTIONS on SYSTEMS Stanislav Sehnalek, Martin Zalesak
E-ISSN: 2224-2678 282 Volume 15, 2016

can be connected with each other. This function leadsto many measurement variations. The track allowsmeasurements of fan performance curve, loss coef-ficient, acoustic parameters, leakage and others. Allcomponents of the track are made in accordance withInternational standard ISO 5801. Controlling systemof the track is handled by PLC with touch panel in-cluding visualization. All measured data are period-ically saved to local FTP server in form of CSV file.The whole controlling board is depicted on Figure 1.On the left can be seen frequency converters for fans,next to these are buttons for switching circuit breaker,a touch panel with visualization for setting experimentand on the right is a computer unit. For the purpose ofresults evaluation was used an automated excel sheet,where a manually loaded data and all calculations areensued by graphical output. The data collection isstarted after two minutes phase to get equilibrium con-ditions and then the data are collected every half of asecond, for one minute. This means that for each pointwere collected 120 values which are time-weightedaverage afterwards.
The measurement track is depicted in Figure 2.The whole length without the sample is more than 9mlong. There are two options to carry out the measure-ment. First one is at inlet side of fan. That track is at2a and consists of inlet, ducts, sample, ducts, straight-ener, size extension, multiple-nozzle chamber (MNC),fan, duct and outlet. Ducts before MNC is of diameter200mm, tract after MNC are of dimension 400mm.Second option is 2b and is at outlet side of fan, lengthsare similar as previous and only difference is in se-quence of parts.
2.2 Minor loss coefficient by CSN EN ISO7235
In the following text will describe a method to mea-sure minor loss coefficient by international standardISO 7235. [6] This norm is mainly used for duct si-lencers and describes the measurement of sound atten-uation as well as the measurement of minor loss coef-
Figure 1: Controlling board for duct tract
ficient. Evaluation of friction coefficient is done bysubtracting the pressure difference at substituted ductfrom static pressure difference of silencer. All com-putational steps are described by following equations.
∆ptot = ps1(I) − ps1(II) (1)
Where is ∆ptot total pressure [Pa]ps1(I) pressure drop at measured [Pa]
deviceps1(II) pressure drop of substituted [Pa]
duct
The value ps1(I) is the difference of static pres-sure between the measured sample. The value ps1(II)is the same as before only performed on substitutedduct. There is also included measurement betweenstatic pressure before sample and atmospheric pres-sure ps1(a) only for graphical representation of results.In the following equations 2, 3 is shown how to calcu-late dynamic pressure and determine density of inletair.
pd =%in2v2 =
%in2
(qvA
)2(2)
Where is pd inlet dynamic pressure [Pa]v flow velocity [ms ]A area at the point of [m]
measurement of static pressure%in density of inlet air [ kg
m3 ]qv volumetric flow rate [m
3
s ]
%in =ps1 + pa
R (θin + 273)(3)
Where is R gas constant 287[N ·mkg·K ]
θin temperature of air [◦C]before sample
The coefficient of the total pressure loss ξ aver-aging over a range of flow rate is calculated from theequation (4).
ξiso =∆ptotpd
=∆ptot
ρ2
(qVA
)2 (4)
Where is ξiso minor loss coefficient [-]by ISO 7235
A area of duct [m2]
Mean loss coefficient is then calculated fromequation (5).
WSEAS TRANSACTIONS on SYSTEMS Stanislav Sehnalek, Martin Zalesak
E-ISSN: 2224-2678 283 Volume 15, 2016

(a) suction pressure
(b) discharge pressure
Figure 2: Track for measurement of friction loss coefficient
ξiso,m =1
N
N∑j=1
ps1(I)j
pdj− 1
M
M∑k=1
ps1(II)k
pdk(5)
Where is N number of measured [-]points of silencer
M number of measured [-]points of substitution
2.3 Minor loss coefficient from Bernoulliequation
Other option could be the determination of ξ from en-ergy equation which is summarized in (6), which isknown also as Bernoulli Equation.
p1 +ρv212
+ h1ρg = p2 +ρv222
+ h2ρg +∆ploss (6)
Where is p static pressure [Pa]h elevation height [m]g acceleration of gravity [m
s2]
∆ploss pressure loss [Pa]
The focus is now on ∆ploss which is specified byequation (7).
∆ploss = ∆pλ +∆pξ (7)
Where is ∆pλ major loss [Pa]∆pξ minor loss [Pa]
The equation (8) summarizes the Darcy-Weisbach Equation for calculation of major loss andin equation (9) is noted the calculation of minor loss .
∆pλ = λl
dpd = λ
l
d
ρ
2v2 = λ
l
d
ρ
2
(qVA
)2(8)
Where is λ friction coefficient [-]l length of the duct [m]d hydraulic diameter of duct [m]pd dynamic pressure [Pa]
Minor loss coefficient, also known as friction co-efficient, is dependent only on Reynolds number forlaminar flow. For turbulent flow matters the frictioncoefficient function of Reynolds number as well asthe roughness of the duct. In 1937 Colebrook andWhite presented an experiment of friction coefficientin roughness duct and established Colebrook-White
WSEAS TRANSACTIONS on SYSTEMS Stanislav Sehnalek, Martin Zalesak
E-ISSN: 2224-2678 284 Volume 15, 2016
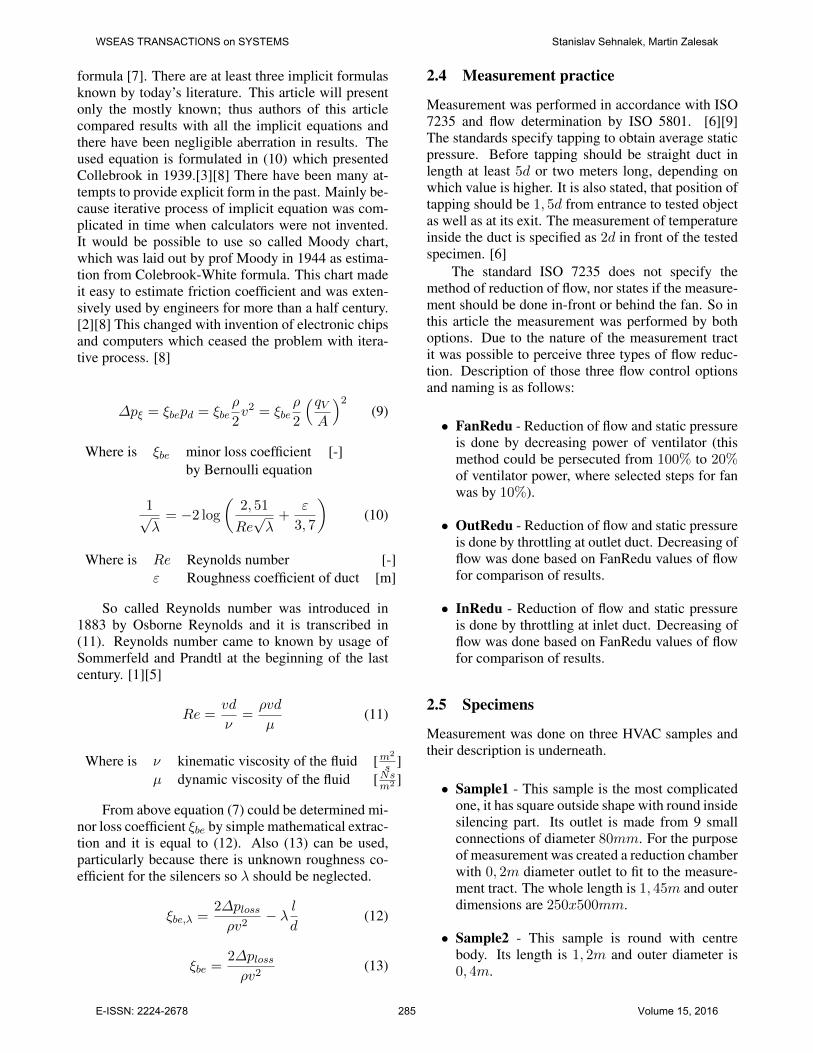
formula [7]. There are at least three implicit formulasknown by today’s literature. This article will presentonly the mostly known; thus authors of this articlecompared results with all the implicit equations andthere have been negligible aberration in results. Theused equation is formulated in (10) which presentedCollebrook in 1939.[3][8] There have been many at-tempts to provide explicit form in the past. Mainly be-cause iterative process of implicit equation was com-plicated in time when calculators were not invented.It would be possible to use so called Moody chart,which was laid out by prof Moody in 1944 as estima-tion from Colebrook-White formula. This chart madeit easy to estimate friction coefficient and was exten-sively used by engineers for more than a half century.[2][8] This changed with invention of electronic chipsand computers which ceased the problem with itera-tive process. [8]
∆pξ = ξbepd = ξbeρ
2v2 = ξbe
ρ
2
(qVA
)2(9)
Where is ξbe minor loss coefficient [-]by Bernoulli equation
1√λ= −2 log
(2, 51
Re√λ+
ε
3, 7
)(10)
Where is Re Reynolds number [-]ε Roughness coefficient of duct [m]
So called Reynolds number was introduced in1883 by Osborne Reynolds and it is transcribed in(11). Reynolds number came to known by usage ofSommerfeld and Prandtl at the beginning of the lastcentury. [1][5]
Re =vd
ν=ρvd
µ(11)
Where is ν kinematic viscosity of the fluid [m2
s ]µ dynamic viscosity of the fluid [Ns
m2 ]
From above equation (7) could be determined mi-nor loss coefficient ξbe by simple mathematical extrac-tion and it is equal to (12). Also (13) can be used,particularly because there is unknown roughness co-efficient for the silencers so λ should be neglected.
ξbe,λ =2∆plossρv2
− λ ld
(12)
ξbe =2∆plossρv2
(13)
2.4 Measurement practice
Measurement was performed in accordance with ISO7235 and flow determination by ISO 5801. [6][9]The standards specify tapping to obtain average staticpressure. Before tapping should be straight duct inlength at least 5d or two meters long, depending onwhich value is higher. It is also stated, that position oftapping should be 1, 5d from entrance to tested objectas well as at its exit. The measurement of temperatureinside the duct is specified as 2d in front of the testedspecimen. [6]
The standard ISO 7235 does not specify themethod of reduction of flow, nor states if the measure-ment should be done in-front or behind the fan. So inthis article the measurement was performed by bothoptions. Due to the nature of the measurement tractit was possible to perceive three types of flow reduc-tion. Description of those three flow control optionsand naming is as follows:
• FanRedu - Reduction of flow and static pressureis done by decreasing power of ventilator (thismethod could be persecuted from 100% to 20%of ventilator power, where selected steps for fanwas by 10%).
• OutRedu - Reduction of flow and static pressureis done by throttling at outlet duct. Decreasing offlow was done based on FanRedu values of flowfor comparison of results.
• InRedu - Reduction of flow and static pressureis done by throttling at inlet duct. Decreasing offlow was done based on FanRedu values of flowfor comparison of results.
2.5 Specimens
Measurement was done on three HVAC samples andtheir description is underneath.
• Sample1 - This sample is the most complicatedone, it has square outside shape with round insidesilencing part. Its outlet is made from 9 smallconnections of diameter 80mm. For the purposeof measurement was created a reduction chamberwith 0, 2m diameter outlet to fit to the measure-ment tract. The whole length is 1, 45m and outerdimensions are 250x500mm.
• Sample2 - This sample is round with centrebody. Its length is 1, 2m and outer diameter is0, 4m.
WSEAS TRANSACTIONS on SYSTEMS Stanislav Sehnalek, Martin Zalesak
E-ISSN: 2224-2678 285 Volume 15, 2016

Figure 3: Log-log plot of inlet reduction for Sample1by suction pressure
• Sample3 - The last sample is the same as thefirst one, but outlet part with 9 connections is re-moved and it is directly connected to 0, 2m fit-ting. The length is in this case 1, 3m.
3 Results
The following section contains results and findingsgathered during the performed measurements. Firstly,it covers the InRedu method and its results, then re-sults of OutRedu and FanRedu methods for all sam-ples. All presented graphs are in log-log scale. Thissection concludes with a comparison of two types ofcalculations which were described in Methods sec-tion and introduction to option for backward findingof roughness coefficient.
3.1 Results for InRedu method by suctionpressure
This method was tested only on Sample1 and is de-picted in Figure 3. The method could be hardly usedfor appropriate presentation of results, neverthelessthe minor loss coefficient was in the end similar asin other methods which will be presented.
3.2 Results for OutRedu and FanRedu meth-ods by suction pressure
Pressure drop and flow through the duct with methodOutRedu and FanRedu are depicted in Figures 4, 5and 6. Difficulty during the measurement occurredwhen there was a necessity to measure substitutedduct with the FanRedu method. When the measure-ment of substituted duct was executed, it should pro-ceed with the same flow as sample which was at thebeginning always around 60% with inequivalent steps.
Table 1: Comparison of methods with calculation byCSN for suction pressure
Sample Method ξcsn[−] diff [−]
Sample1OutRedu 2,851
0,044FanRedu 2,808
Sample2OutRedu 2,598
0,054FanRedu 2,544
Sample3OutRedu 0,924
0,014FanRedu 0,911
Table 2: Minimal and maximal Reynolds number foreach sample and method for suction pressure
Sample Method Re min [−] Re max [−]
Sample1OutRedu 49 730 254 576FanRedu 89 678 257 955
Sample2OutRedu 81 719 258 050FanRedu 76 512 258 035
Sample3OutRedu 93 414 316 163FanRedu 95 922 317 042
The reason of this is due to steep losses of supplemen-tary duct. This is reflected by the substituted curve,which has less points because fan can not go less than20% of power. From the figures can be seen that bothmethods are similar and could be commuted. This factis also digested in Table 1, where could be seen dif-ferences in methods by friction coefficient. The mostsignificant difference in methods was ξ = 0, 054 andoccurred with Sample2, and is fractional number.
From the Table 2 can be seen that all flows werein turbulent region based on Reynolds numbers.
Results concerning calculation of ξbe are recordedin Table 3, where the most significant difference withSample1 is evident. The inequality with standardmethod is due to the fact that method measured bysubtracting pressure with substituted duct could in-clude inaccuracy.
In the Table 5 are compared two ways of calcu-lation of ξ, namely equation (5) with (13). The dif-ference is fluctuating around 0, 3. This diversity ismainly because in ξcsn was taken total pressure sub-tracted by pressure of substituted duct as for opposi-tion is taken only total pressure of sample for ξbe.
There are significant differences of coefficientswithin the used methods and samples. This is causedbasically because there is difference in ξ calculated byboth methods.
Table 4 summarizes all friction loss coefficients.First line is used for sample and method, thus S1-ORmeans Sample1 - OutRedu method and so on. In some
WSEAS TRANSACTIONS on SYSTEMS Stanislav Sehnalek, Martin Zalesak
E-ISSN: 2224-2678 286 Volume 15, 2016

(a) OutRedu (b) FanRedu
Figure 4: Loglog plots for Sample1 by suction pressure
(a) OutRedu (b) FanRedu
Figure 5: Loglog plots for Sample2 by suction pressure
(a) OutRedu (b) FanRedu
Figure 6: Loglog plots for Sample3 by suction pressure
cases coefficients are missing, this is due to the natureof method where was low limit reached in different
points. It is obvious that minor loss coefficient is in-dependent on velocity inside the duct, this fact is valid
WSEAS TRANSACTIONS on SYSTEMS Stanislav Sehnalek, Martin Zalesak
E-ISSN: 2224-2678 287 Volume 15, 2016

Table 3: Comparison of methods with calculation byBE for suction pressure
Sample Method ξbe[−] diff [−]
Sample1OutRedu 3,099
0,117FanRedu 3,216
Sample2OutRedu 2,834
0,042FanRedu 2,876
Sample3OutRedu 1,154
0,007FanRedu 1,147
Table 4: Match of loss coefficient for samples bymethod for suction pressure
S1-OR S1-FR S2-OR S2-FR S2-OR S3-FR2,6570 2,5516 2,5070 2,5112 0,8982 0,89872,7585 2,5658 2,5255 2,5225 0,9055 0,90302,7043 2,4402 2,5405 2,4592 0,8845 0,89172,7276 2,5009 2,5066 2,4307 0,8919 0,88482,7509 2,4317 2,7151 2,4446 0,9330 0,87312,8609 2,3580 2,5236 2,5303 0,8695 0,89712,7070 2,1497 2,7128 2,6119 0,9272 0,94422,7780 2,3227 2,6556 2,8450 0,9530 0,99253,1028 - 2,6998 - 1,0556 -3,0284 - - - - -
only for velocity from 3 to 24m
s. Thus in this range
the measurements were executed. It would be inter-esting to accomplish measurement with velocity un-der the range achieved in this article.
3.3 Results for InRedu and FanRedu meth-ods by discharge pressure
In this case the InRedu and FanRedu methods wereused. The reason is that for OutRedu would be thesame result as for InRedu in previous case due to na-ture of flow. For discharge pressure, the measurementwas performed only for sample1. Graphs are depicted
Table 5: Comparison between option CSN and BEfor suction pressure
Sample Method ξcsn[−] ξbe[−] diff [−]
Sample1OutRedu 2,851 3,099 0,248FanRedu 2,808 3,216 0,409
Sample2OutRedu 2,598 2,834 0,236FanRedu 2,544 2,876 0,332
Sample3OutRedu 0,924 1,154 0,230FanRedu 0,911 1,147 0,236
Table 6: Comparison of methods with calculation byCSN for discharge pressure
Sample Method ξcsn[−] diff [−]
Sample2InRedu 2,519
0,073FanRedu 2,446
Table 7: Minimal and maximal Reynolds number forsample2 for discharge pressure
Sample Method Re min [−] Re max [−]
Sample2InRedu 172 029 250 848
FanRedu 110 431 253 610
(a) InRedu
(b) FanRedu
Figure 7: Loglog plots for Sample2 by dischargepressure
in figure 7, the results are in table 6.
From the graph is obvious that all the measure-ment were performed for static pressure higher than10Pa which is in accordance with ISO 7235 wherein ANSI/ASHRAE Standard 120-2008 is no such re-striction. [6] [10]
WSEAS TRANSACTIONS on SYSTEMS Stanislav Sehnalek, Martin Zalesak
E-ISSN: 2224-2678 288 Volume 15, 2016
4 Conclusion
The purpose of the paper was to evaluate and outlinethree ways of measurement for HVAC equipment atthe suction and discharge part of fan. Comparison offriction coefficient calculation by standard ISO 7235was presented as well. Three types of air flow con-trol options were compared with three types of dif-ferent samples. Each sample had diverse constructionthus results have broad meaning. This leads to neces-sity for wide meassurement of different speciments tomake statistical conclusions for selection of the bestflow controling options for meassurement. Also, theextensive numerical simulation by CFD and compar-ison with physical measurements will be realized inthe future.
Acknowledgements: This work was supportedby the Ministry of Education, Youth and Sportsof the Czech Republic within the National Sustain-ability Programme project No. LO1303 (MSMT-7778/2014) and also by the Internal Grant Agency ofTomas Bata University in Zlin under the project No.IGA/CebiaTech/2016/001.
References:
[1] O. Reynolds, “An experimental investigation ofthe circumstances which determine whether themotion of water shall be direct or sinuous, andof the law of resistance in parallel channels.[abstract],” Proceedings of the Royal Societyof London, vol. 35, p. 24, 1883. [Online].Available: http://www.jstor.org/stable/114354
[2] L. F. Moody, Transaction of the A.S.M.E.,vol. 66, p. 14, 1944.
[3] C. F. Colebrook, “Turbulent flow in pipes, withparticular reference to the transition region be-tween the smooth and rough pipe laws,” Jour-nal of the Insitution of Civil Engineers, vol. 11,no. 4, p. 29, 1939.
[4] T. Von Karman and L. Edson, The Wind and Be-yond: Theodore Von Karman, Pioneer in Avia-tion and Pathfinder in Space. Little, Brown,1967.
[5] P. A. Davidson, Y. Kaneda, K. Moffatt, andK. R. Sreenivasan, A voyage through turbulence.Cambridge University Press, 2011.
[6] “Acoustics - Laboratory measurement proce-dures for ducted silencers and air-terminal units- Insertion loss, flow noise and total pressure
loss,” Czech office for standards metrology andtesting, Prague, CZ, Standard, 2010.
[7] C. F. Colebrook and C. M. White, “Experimentswith fluid friction in roughened pipes,” Proceed-ings of the Royal Society of London A: Math-ematical, Physical and Engineering Sciences,vol. 161, no. 906, p. 15, 1937.
[8] S. Genic, I. Arandjelovic, P. Kolendic, M. Jaric,N. Budimir, and V. Genic, “A Review of Ex-plicit Approximations of Colebrook ’ s Equa-tion,” FME Transactions, vol. 39, no. 2, p. 4,2011.
[9] “Industrial fans - Performance testing usingstandardized airways,” Czech office for stan-dards metrology and testing, Prague, CZ, Stan-dard, May 2009.
[10] “Method of Testing the Determine Flow Re-sistance of HVAC Ducts and Fittings,” Ameri-can Society of Heating, Refrigerating and Air-Conditioning Engineers, Inc., Atlanta, USA,Standard, 2008.
WSEAS TRANSACTIONS on SYSTEMS Stanislav Sehnalek, Martin Zalesak
E-ISSN: 2224-2678 289 Volume 15, 2016