measurement of aperture areas using anlib.tkk.fi/diss/2007/isbn9789525610413/article2.pdf · an...
TRANSCRIPT

II
Publication II
B. Hemming, E. Ikonen, and M. Noorma, “Measurement of Aperture Diameters using an Optical Coordinate Measuring Machine”, International Journal of Optomechatronics, 1, 297 – 311 (2007). .
© 2007 Taylor & Francis, www.informaworld.com
Reprinted with permission.

Dow
nloa
ded
By:
[Hem
min
g, B
jörn
] At:
07:0
5 11
Sep
tem
ber 2
007
MEASUREMENT OF APERTURE AREAS USING ANOPTICAL COORDINATE MEASURING MACHINE
Bjorn Hemming,1 Erkki Ikonen,1,2 and Mart Noorma2,3
1Centre for Metrology and Accreditation (MIKES), Espoo, Finland2Metrology Research Institute, Helsinki University of Technology (TKK),Finland3University of Tartu, Tartu, Estonia
The use of an optical coordinate measuring machine (CMM) for the diameter measure-
ment of optical apertures is described. The traceability and mechanical stability of the aper-
ture areas are of importance for accurate photometric and radiometric measurements.
Detailed evaluation of the measurement uncertainty for the aperture diameter is presented.
High-accuracy mechanical CMM was used to confirm the validity of the optical CMM
results. The difference between the contact and non-contact measurement was 0.1mm for
the mean diameter result. If the required standard uncertainty for the mean diameter is
of the order of 1 mm, the optical CMM provides an efficient method for aperture area
measurements.
1. INTRODUCTION
Apertures are used in optical radiometry� to define a precisely known area ofan incoming radiation field in front of a detector. When the detector has a calibratedoptical power responsivity, the known aperture area allows to determine such quan-tities as illuminance or irradiance which describe optical power divided by area. Anideal aperture would have zero thickness in order to avoid shadowing of light raysentering in other than exactly perpendicular direction to the aperture plane. Reliablearea measurements of apertures with thin edges are especially important to primaryscale realizations, as otherwise it is not possible to get access to many essential radio-metric quantities.
The area of a nominally round aperture can be measured via determination ofits effective diameter. A straightforward method for diameter measurement is todetermine in different directions the largest distance between the edges of the aper-ture. The edges can be observed either by a microscope in an optical coordinate mea-suring machine (CMM) or by a physical contact in a mechanical CMM. The mainadvantage of the non-contact optical CMM method is that it does not damage thethin aperture edge. Furthermore, the measurement setup and alignment can be made
�Optical radiometry is the field of science which studies the measurement of electromagnetic radi-
ation, including visible light. Light is also measured using the techniques of photometry that deal with
brightness as perceived by the human eye.
Address correspondence to Bjorn Hemming, Centre for Metrology and Accreditation (MIKES),
Tekniikantie 1, FIN-02150 Espoo, Finland. E-mail: [email protected]
297
International Journal of Optomechatronics, 1: 297–311, 2007
Copyright # Taylor & Francis Group, LLC
ISSN: 1559-9612 print=1559-9620 online
DOI: 10.1080/15599610701548803

Dow
nloa
ded
By:
[Hem
min
g, B
jörn
] At:
07:0
5 11
Sep
tem
ber 2
007
relatively simple and it is easy to get a large number of diameter values in differentdirections. For mechanical contact measurements, utmost care is needed to protectthe thin aperture edge and to achieve correct alignment of the aperture plane relativeto the probe and probe motion. As a whole the contact measurement, per aperturediameter value, takes considerably longer time than the non-contact measurement.However, the measurement uncertainty of the contact method can be lower than thatof the non-contact method since in the latter case uncertainty is limited by the dif-ficulty in reliable determination of the aperture edge position in the microscopeimage.
Several contact (Martin et al. 1998) and non-contact (Fowler et al. 2000;Fowler et al. 1998; Lassila et al. 1997; Ikonen et al. 1998; Stock and Goebel 2000;Razet and Bastie 2006; Hartmann et al. 2000; Fowler and Litorja 2003) methodshave been used for measurement of aperture areas. Some non-contact methods(Lassila et al. 1997; Ikonen et al. 1998; Stock and Goebel 2000) can measure the areadirectly and are thus not sensitive to the shape of the apertures, but still require longmeasurement time. The reported relative standard measurement uncertainties aretypically 10�4 or less. However, even the best measurements of illuminance respon-sivity (Kohler et al. 2004) and spectral irradiance (Woolliams et al. 2006) haverelative standard uncertainties larger than 10�3. Therefore, in some cases an increasein measurement uncertainty for area is acceptable to improve the speed andefficiency of the aperture area measurements. Such an efficiency improvement isespecially important for a method (Kubarsepp et al. 2000) where more than ten sep-arate detectors (filter radiometers) are used to realize the spectral irradiance scale, aseach of these filter radiometers would need a dedicated 3-mm-diameter aperture withknown area. Another need for straightforward aperture area measurement comesfrom the study of mechanical stability of aperture diameter over time scales ofseveral months after the drilling. The non-contact optical CMM method is a goodcandidate for an efficient aperture area measurement. However, if the aperture areauncertainty starts to approach other uncertainty components in the spectralirradiance uncertainty budget, the need for a reliable uncertainty evaluation ofaperture diameter measurement with the optical CMM is emphasized.
During the last 10 years, coordinate measurement machines fitted with CCDcameras and machine vision software have been developed. These optical CMM’sare nowadays used widely especially in the electronic industry, because of their abil-ity for fast automated and accurate non-contact measurements. Typical claimed
NOMENCLATURE
D diameter
D mean diameter
k coverage factor
i, j, m index variables
n number of measured points
R, r Radius
x, y Cartesian coordinate
de error for measurement of D due to
optical parameters and edge sharpness
dr error for measurement of r due to edge
roundness of aperture
dx repeatability error for measurement of
x-coordinate
dy repeatability error for measurement of
y-coordinate
298 B. HEMMING ET AL.

Dow
nloa
ded
By:
[Hem
min
g, B
jörn
] At:
07:0
5 11
Sep
tem
ber 2
007 accuracies for optical CMM’s range from 0.8 mm to 6 mm. (Lazzari et al. 2004; Kivio
et al. 2004). These accuracies apply for one length measurement only, but with thesemachines complicated measurements, for example flatness, roundness, cylindricity,coaxiality, etc., are often carried out without knowledge of the task specified uncer-tainty. Moreover, the uncertainties written on manufacturers brochures are quiteseldom realistic and therefore the apparent estimated uncertainty of measurementsmay be far too small (Kivio et al. 2004).
Calculation of the measurement uncertainty for a real measurement task with aCMM is considered to be demanding mainly because there is a large number ofuncertainty sources and error components. Also several measurement strategiescan be used for the same task. Finally, the measurement task itself may include com-plex geometries or fitting algorithms (Chan et al. 1996). Additional practical dif-ficulty comes from the object to be measured with optical CMM: depending onthe selected light source and magnification, on the edge detection parameters, andon the edge itself, different results may be the outcome of measurements.
In this work, the use of optical CMM is studied as a candidate for an efficientaperture area measurement method. A detailed uncertainty analysis of optical CMMmeasurements is presented for the first time with uncertainty budgets for diametermeasurements to help for a better understanding of the measurement method.Especially, the measurement geometry and measurement strategy together with theeffects of the quality of the edges are explained. A specific purpose of the measure-ments was to study the stability of diameters of aluminium apertures over a timescale of six months after the drilling. After drilling the diameter might change, forexample due to oxidation or stresses in the material. The measured diameters showedonly minor changes comparable with the uncertainties in the measurements. Thestandard deviation for the measured diameter for one aperture was 35% or less ofthe standard uncertainty of the measurement. Measurements with a high-accuracymechanical CMM were used to confirm the validity of the optical CMM results.The optical method was found to provide a fast way for aperture area measurementsat an uncertainty level which is sufficient for most practical applications in photom-etry and radiometry and satisfies the needs of even the most accurate spectralirradiance measurements.
This article is organized as follows. Section 2 describes the measurement setupand Section 3 the measurement results. To confirm these non-contact measurements,measurements with contacting probe are made and described in Section 4. Beforeany conclusions can be drawn on the stability of the apertures or the suitability ofthe measurement method, an uncertainty budget is needed as described in Section5. In Section 6, conclusions on these two topics are presented.
2. OPTICAL APERTURE MEASUREMENTS
The optical diameter measurements were conducted using Mitutoyo Quickvi-sion Hyper CMM at the Centre for Metrology and Accreditation (MIKES) shownin Figure 1. Quickvision CMM is equipped with crystallized glass scale with the res-olution of 0.02 mm and thermal expansion coefficient of 0.08� 10�6=K. The bestspecified measurement uncertainty in one axis is 0.8 mm (Mitutoyo 2001). As shownin Figure 1, the object to be measured is placed on the motorized Y-table and the
MEASUREMENT OF APERTURE AREAS 299
Dow
nloa
ded
By:
[Hem
min
g, B
jörn
] At:
07:0
5 11
Sep
tem
ber 2
007
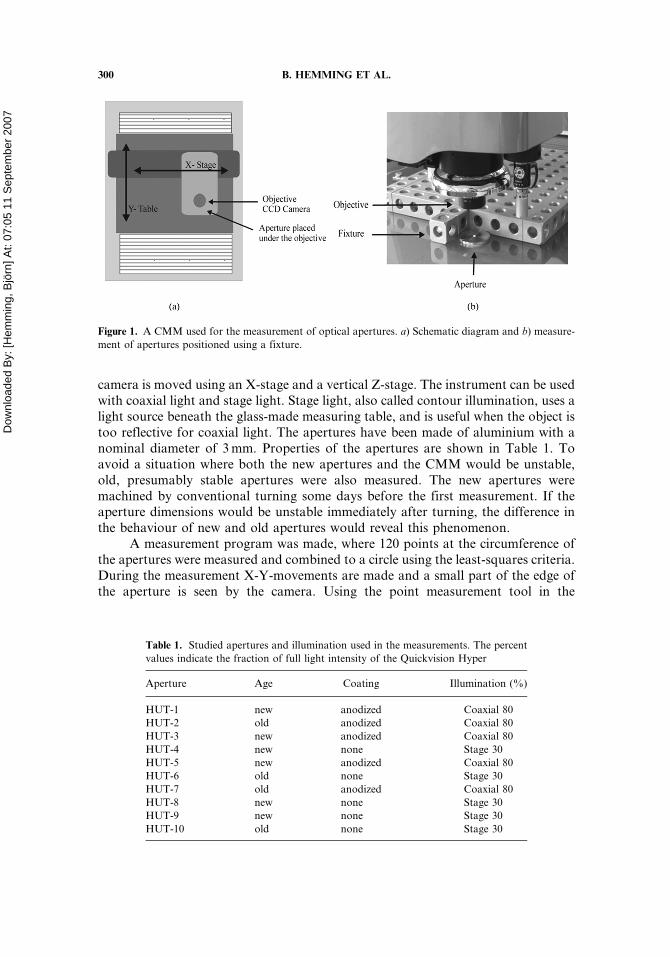
camera is moved using an X-stage and a vertical Z-stage. The instrument can be usedwith coaxial light and stage light. Stage light, also called contour illumination, uses alight source beneath the glass-made measuring table, and is useful when the object istoo reflective for coaxial light. The apertures have been made of aluminium with anominal diameter of 3 mm. Properties of the apertures are shown in Table 1. Toavoid a situation where both the new apertures and the CMM would be unstable,old, presumably stable apertures were also measured. The new apertures weremachined by conventional turning some days before the first measurement. If theaperture dimensions would be unstable immediately after turning, the difference inthe behaviour of new and old apertures would reveal this phenomenon.
A measurement program was made, where 120 points at the circumference ofthe apertures were measured and combined to a circle using the least-squares criteria.During the measurement X-Y-movements are made and a small part of the edge ofthe aperture is seen by the camera. Using the point measurement tool in the
Figure 1. A CMM used for the measurement of optical apertures. a) Schematic diagram and b) measure-
ment of apertures positioned using a fixture.
Table 1. Studied apertures and illumination used in the measurements. The percent
values indicate the fraction of full light intensity of the Quickvision Hyper
Aperture Age Coating Illumination (%)
HUT-1 new anodized Coaxial 80
HUT-2 old anodized Coaxial 80
HUT-3 new anodized Coaxial 80
HUT-4 new none Stage 30
HUT-5 new anodized Coaxial 80
HUT-6 old none Stage 30
HUT-7 old anodized Coaxial 80
HUT-8 new none Stage 30
HUT-9 new none Stage 30
HUT-10 old none Stage 30
300 B. HEMMING ET AL.
Dow
nloa
ded
By:
[Hem
min
g, B
jörn
] At:
07:0
5 11
Sep
tem
ber 2
007
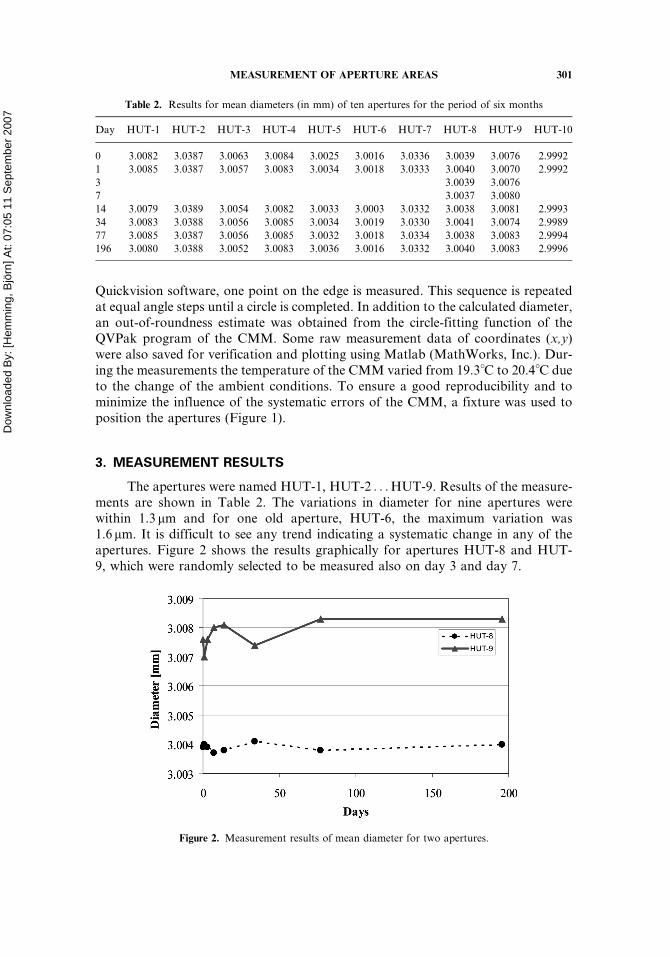
Quickvision software, one point on the edge is measured. This sequence is repeatedat equal angle steps until a circle is completed. In addition to the calculated diameter,an out-of-roundness estimate was obtained from the circle-fitting function of theQVPak program of the CMM. Some raw measurement data of coordinates (x,y)were also saved for verification and plotting using Matlab (MathWorks, Inc.). Dur-ing the measurements the temperature of the CMM varied from 19.3�C to 20.4�C dueto the change of the ambient conditions. To ensure a good reproducibility and tominimize the influence of the systematic errors of the CMM, a fixture was used toposition the apertures (Figure 1).
3. MEASUREMENT RESULTS
The apertures were named HUT-1, HUT-2 . . . HUT-9. Results of the measure-ments are shown in Table 2. The variations in diameter for nine apertures werewithin 1.3 mm and for one old aperture, HUT-6, the maximum variation was1.6 mm. It is difficult to see any trend indicating a systematic change in any of theapertures. Figure 2 shows the results graphically for apertures HUT-8 and HUT-9, which were randomly selected to be measured also on day 3 and day 7.
Table 2. Results for mean diameters (in mm) of ten apertures for the period of six months
Day HUT-1 HUT-2 HUT-3 HUT-4 HUT-5 HUT-6 HUT-7 HUT-8 HUT-9 HUT-10
0 3.0082 3.0387 3.0063 3.0084 3.0025 3.0016 3.0336 3.0039 3.0076 2.9992
1 3.0085 3.0387 3.0057 3.0083 3.0034 3.0018 3.0333 3.0040 3.0070 2.9992
3 3.0039 3.0076
7 3.0037 3.0080
14 3.0079 3.0389 3.0054 3.0082 3.0033 3.0003 3.0332 3.0038 3.0081 2.9993
34 3.0083 3.0388 3.0056 3.0085 3.0034 3.0019 3.0330 3.0041 3.0074 2.9989
77 3.0085 3.0387 3.0056 3.0085 3.0032 3.0018 3.0334 3.0038 3.0083 2.9994
196 3.0080 3.0388 3.0052 3.0083 3.0036 3.0016 3.0332 3.0040 3.0083 2.9996
Figure 2. Measurement results of mean diameter for two apertures.
MEASUREMENT OF APERTURE AREAS 301
Dow
nloa
ded
By:
[Hem
min
g, B
jörn
] At:
07:0
5 11
Sep
tem
ber 2
007
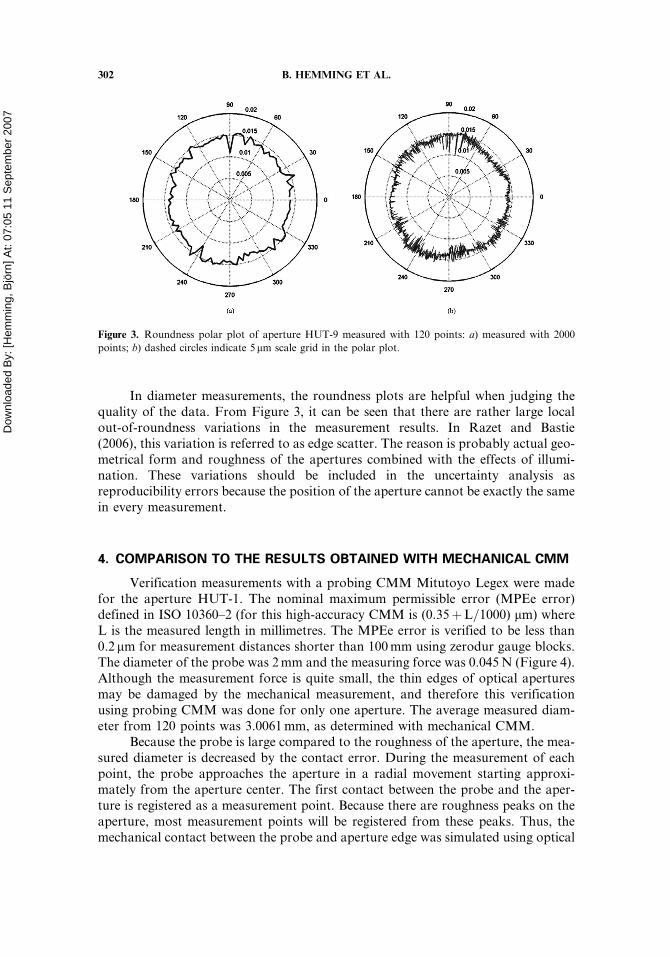
In diameter measurements, the roundness plots are helpful when judging thequality of the data. From Figure 3, it can be seen that there are rather large localout-of-roundness variations in the measurement results. In Razet and Bastie(2006), this variation is referred to as edge scatter. The reason is probably actual geo-metrical form and roughness of the apertures combined with the effects of illumi-nation. These variations should be included in the uncertainty analysis asreproducibility errors because the position of the aperture cannot be exactly the samein every measurement.
4. COMPARISON TO THE RESULTS OBTAINED WITH MECHANICAL CMM
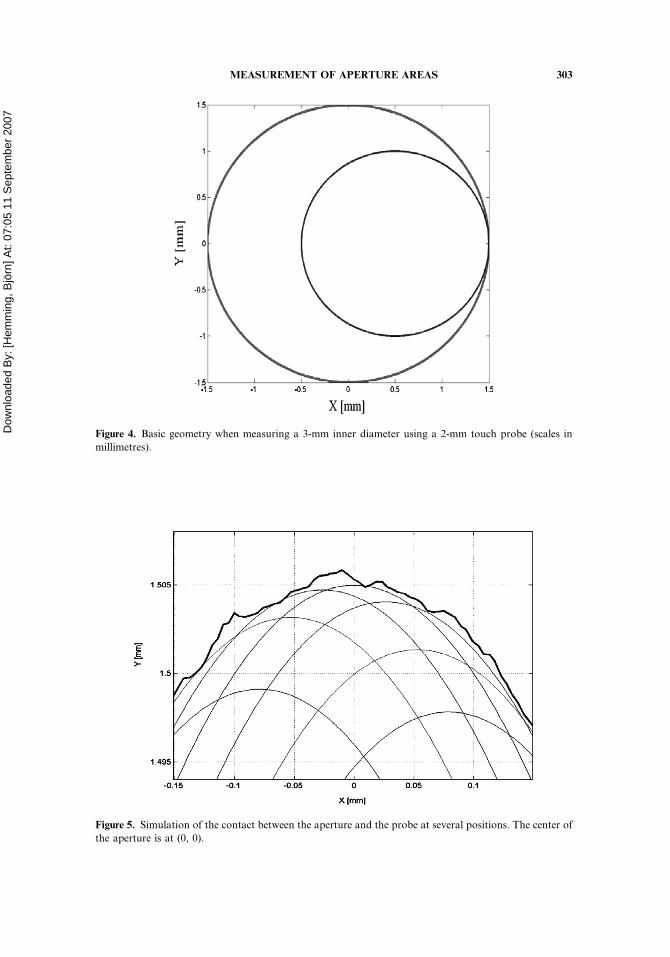
Verification measurements with a probing CMM Mitutoyo Legex were madefor the aperture HUT-1. The nominal maximum permissible error (MPEe error)defined in ISO 10360–2 (for this high-accuracy CMM is (0.35þL=1000) mm) whereL is the measured length in millimetres. The MPEe error is verified to be less than0.2 mm for measurement distances shorter than 100 mm using zerodur gauge blocks.The diameter of the probe was 2 mm and the measuring force was 0.045 N (Figure 4).Although the measurement force is quite small, the thin edges of optical aperturesmay be damaged by the mechanical measurement, and therefore this verificationusing probing CMM was done for only one aperture. The average measured diam-eter from 120 points was 3.0061 mm, as determined with mechanical CMM.
Because the probe is large compared to the roughness of the aperture, the mea-sured diameter is decreased by the contact error. During the measurement of eachpoint, the probe approaches the aperture in a radial movement starting approxi-mately from the aperture center. The first contact between the probe and the aper-ture is registered as a measurement point. Because there are roughness peaks on theaperture, most measurement points will be registered from these peaks. Thus, themechanical contact between the probe and aperture edge was simulated using optical
Figure 3. Roundness polar plot of aperture HUT-9 measured with 120 points: a) measured with 2000
points; b) dashed circles indicate 5 mm scale grid in the polar plot.
302 B. HEMMING ET AL.
Dow
nloa
ded
By:
[Hem
min
g, B
jörn
] At:
07:0
5 11
Sep
tem
ber 2
007
Figure 4. Basic geometry when measuring a 3-mm inner diameter using a 2-mm touch probe (scales in
millimetres).
Figure 5. Simulation of the contact between the aperture and the probe at several positions. The center of
the aperture is at (0, 0).
MEASUREMENT OF APERTURE AREAS 303

Dow
nloa
ded
By:
[Hem
min
g, B
jörn
] At:
07:0
5 11
Sep
tem
ber 2
007 CMM profile data. A Matlab script was written to adjust a radial offset to the
theoretical probe to match roughness peaks in a 2000-point aperture profile(Figure 5). The result of this simulation was an estimate of the contact error of1.1 mm in radius. The surface roughness of the probe was measured with a formand surface roughness measuring instrument. The roughness value Ra (arithmeticalmean roughness) is less than 0.05 mm, and therefore errors due to roughness effectsof the probe are negligible.
In addition, a force correction should be applied to the mechanical CMMresult. The force correction of �0.05 mm (in radius) was calculated from formulasfor elastic compression for the case of the sphere in contact with the internal cylinder(Puttock and Thwaite 1969). The depth of the cylindrical land in the aperture isabout 150 mm. After applying the force correction and the contact error correction,the resulting diameter is 3.0081 mm. The mean value of the measurements, conduc-ted with the optical CMM, was 3.0082 mm (Table 2), so there is good agreementbetween the results.
5. UNCERTAINTY ANALYSIS FOR MEASUREMENT OF MEAN DIAMETER
5.1. Auxiliary Measurement Results
The formal definition of uncertainty of a measurement is ‘‘parameter associa-ted with the result of a measurement, that characterizes the dispersion of the valuesthat could reasonably be attributed to the measurand’’ (GUM 2004). The compi-lation of the uncertainty budget requires additional studies of general stability ofthe instrument and repeatability and reproducibility of the measurements. In thisarticle, especially where the stability of the apertures has been studied, the reproduci-bility of the measurements and the stability of the optical CMM are critical. As pre-viously mentioned, a relative aperture area uncertainty of 10�3 would be sufficientfor most needs in photometry and radiometry. An aperture with a nominal diameterof 3 mm corresponds to a standard uncertainty of 1 mm for the mean diameter. In thefollowing, an uncertainty analysis is made to show that the accuracy of the measure-ments of the mean diameter is sufficient for these needs. Also, to make reliable con-clusions on the stability of the apertures a similar accuracy is needed.
The best measurement capability for Quickvision Hyper optical CMM is0.8 mm (k ¼ 2, k is the coverage factor with which the standard uncertainty is mul-tiplied to get an uncertainty at 95 % confidence level) in one axis for a short dis-tance measurement. There is also an additional length-dependent component ofuncertainty, but it is negligible in our case because the measured dimension issmall. This measurement capability has during recent years been verified by severalcalibrations and verification measurements of glass scales. It is assumed that theuncertainty consists mainly of the uncompensated error of the scale (0.6 mm,k ¼ 2) and of the repeatability error (0.5 mm, k ¼ 2). To ensure the accuracy in cur-rent measurements, additional verification measurements were performed using a50-mm glass scale positioned close to the area where the apertures were measured(Figure 6).
The position of each scale mark on the glass scale is taken as the middlebetween the two edges of a scale line. The reference values for the glass scale were
304 B. HEMMING ET AL.

Dow
nloa
ded
By:
[Hem
min
g, B
jörn
] At:
07:0
5 11
Sep
tem
ber 2
007
measured using the MIKES line-scale interferometer (Lassila et al. 1994). Theuncertainties of the reference values are almost negligible in this case (0.09 mm,k ¼ 2) and by repeating the measurement of this glass scale at the opticalCMM, the error of the CMM scale and repeatability error can be evaluated. Aver-aging a large number of measurements (point by point) shows a systematic contri-bution below �0.6 mm (Figure 7), and from these measurements the standarddeviation for each point was 0.2 mm. The systematic contribution is assumed tocome from the error of the CMM scale. These results are in agreement with theabove mentioned division of the measurement uncertainty into a component of0.6 mm for the CMM scale and 0.5 mm for the CMM repeatability (at coveragefactor k ¼ 2).
Figure 7. Difference between the values measured with MIKES line scale interferometer and Mitutoyo
Quickvision in the direction of the a) x-axis and b) y-axis.
Figure 6. Verification measurements using a reference glass scale in the same position as the aperture.
MEASUREMENT OF APERTURE AREAS 305

Dow
nloa
ded
By:
[Hem
min
g, B
jörn
] At:
07:0
5 11
Sep
tem
ber 2
007 5.2. The Simplified Measurement Model
When estimating measurement uncertainty according to the guidelines pre-sented in GUM (1993), the first task is to write a formula for the measurementmodel. The basic measurement model for a simple two-point diameter (D) measure-ment in the direction of the x-axis is
D ¼ x2 � x1 þ dx1 þ dx2 þ dr1 þ dr2 þ de; ð1Þ
where x1 and x2 are the first and second measured coordinates, dx1 and dx2 are therepeatability errors, dr1 and dr2 are the errors from edges of the measured object(roundness errors), and de is the edge detection error for diameter. The errors dr1
and dr2 are due to roundness errors in the horizontal plane of the aperture, andthe edge detection error de depends on user selected illumination, focus and sharp-ness of the edge. In one measurement, parameter D is calculated only from the esti-mates x1 and x2 but the measurement model contains also contributions from errors.The principle of two-point measurement is shown in Figure 8.
The measurements were actually made of 120 points and the resulting diametercan be interpreted as the mean D of 60 diameter measurements. Therefore, the effectof the repeatability error (dx1 and dx2) and the roundness error, including roughness,(dr1 and dr2) should be decreased by the factor 1=
p60. The position of the found
edge depends on user selected illumination, focus, and sharpness of the edge. Therelated error de is of systematic type and cannot be reduced by averaging and thusthe measurement model of repeated measurements is rewritten as
D ¼ 1
60
X60
m¼1
½x2;m � x1;m þ dx1;m þ dx2;m þ dr1;m þ dr2;m� þ de: ð2Þ
The contribution of the uncertainty component de was studied by changingillumination. It should be noted that this uncertainty component is much morecomplicated in the detection of the aperture edge than, for example, in the detection
Figure 8. a) Two-point measurement of diameter and b) multi-point measurement of diameter.
306 B. HEMMING ET AL.

Dow
nloa
ded
By:
[Hem
min
g, B
jörn
] At:
07:0
5 11
Sep
tem
ber 2
007 of the scale mark distances on the reference glass scale. When using stage light, the
aperture is between the camera and the light source. The aperture appears as darkarea and at the edge there is a transition of illuminance level. When illuminationis increased, the amount of light coming to the CCD camera increases, and finallythe whole image would be saturated to bright signal. Before this happens, it canbe seen that the transition range between dark and bright seems to move away fromthe bright area. This phenomenon increases the diameter of bright holes, anddecreases the width of dark lines on glass scales. However, the distance betweenthe centers of the scale marks remains unaffected when the position of the scalemarks is taken as the center of the dark lines.
One matte aperture (HUT-1) and one bright aperture (HUT-9) were measuredwith a large range of combinations of coaxial and stage light. The standard deviationof obtained diameters was 0.86 mm for the matte aperture and 0.61 mm for the brightaperture. The results for the illumination experiment for the matte aperture are givenin Table 3. It is seen that strong illumination (50% column for stage light) leads toroughly 4 mm larger diameter than with moderate or zero stage light. However, theuser also receives a ‘‘saturation warning’’ so these diameter results are excluded fromthe data when calculating the above mentioned standard deviations. The standarduncertainty related to de is estimated to be 1 mm, from Table 3. The value is con-servative and rounded upwards to include the contribution of effects which cannot be addressed by varying illumination conditions.
Next, the error of roundness type is dealt with. When the diameter measure-ment was immediately repeated, the variation in results was typically only 0.1 mm.However, if the aperture was removed and measured again, with 120 points, in aslightly different position, the change in diameter was typically 0.1 mm–0.5 mm, indi-cating a considerable reproducibility error. The reason is seen in Figure 3; i.e., theedge appears to be rough and uneven. The roundness error was typically with-in�4 mm. The related standard uncertainty, assuming a rectangular distribution, isdr1 ¼ dr2 ¼ (4 mm)=
p3 ¼ 2.31 mm (GUM 1993).
Table 3. Effects of illumination on the diameter of a matte aperture (HUT-1), in
millimetres. The illumination selected for measurements of matte apertures was
80% for coaxial light and 0% for stage light
Stage light illumination magnitude [%]Coaxial light illumination
magnitude [%] 0 20 30 40 50
0 3.0071 3.0074 3.0084 3.0115
10
20 3.0073 3.0075 3.0084 3.0115
30
40
50 3.0064 3.0076 3.0076 3.0087 3.0116
60 3.008
70 3.0081
80 3.0079 3.0079 3.0076 3.0096 3.0121
90 3.008
100 3.008 3.008 3.0084 3.0105 3.0128
MEASUREMENT OF APERTURE AREAS 307
Dow
nloa
ded
By:
[Hem
min
g, B
jörn
] At:
07:0
5 11
Sep
tem
ber 2
007
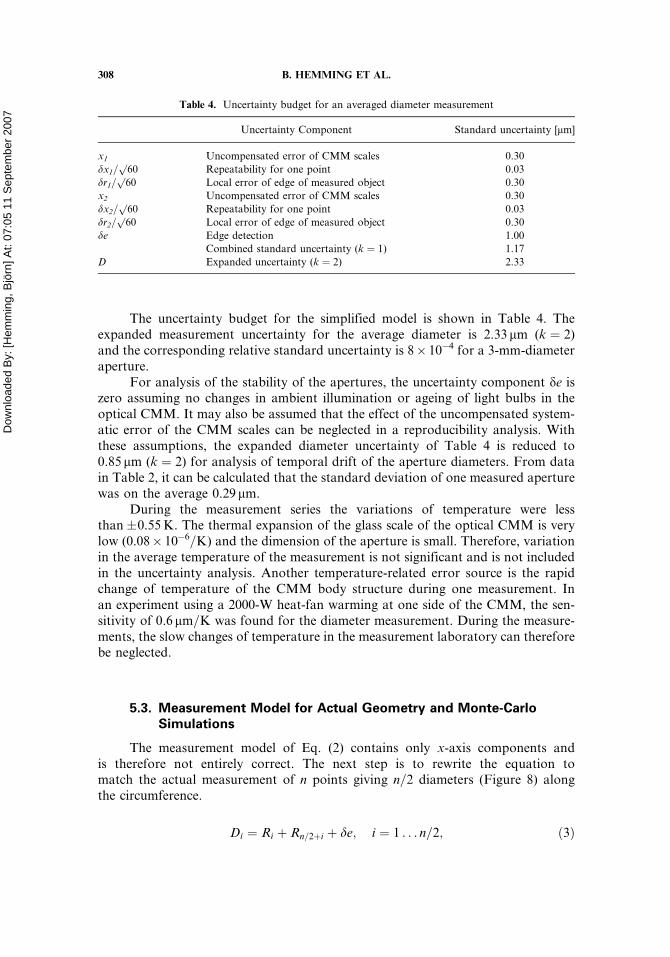
The uncertainty budget for the simplified model is shown in Table 4. Theexpanded measurement uncertainty for the average diameter is 2.33 mm (k ¼ 2)and the corresponding relative standard uncertainty is 8� 10�4 for a 3-mm-diameteraperture.
For analysis of the stability of the apertures, the uncertainty component de iszero assuming no changes in ambient illumination or ageing of light bulbs in theoptical CMM. It may also be assumed that the effect of the uncompensated system-atic error of the CMM scales can be neglected in a reproducibility analysis. Withthese assumptions, the expanded diameter uncertainty of Table 4 is reduced to0.85 mm (k ¼ 2) for analysis of temporal drift of the aperture diameters. From datain Table 2, it can be calculated that the standard deviation of one measured aperturewas on the average 0.29 mm.
During the measurement series the variations of temperature were lessthan �0.55 K. The thermal expansion of the glass scale of the optical CMM is verylow (0.08� 10�6=K) and the dimension of the aperture is small. Therefore, variationin the average temperature of the measurement is not significant and is not includedin the uncertainty analysis. Another temperature-related error source is the rapidchange of temperature of the CMM body structure during one measurement. Inan experiment using a 2000-W heat-fan warming at one side of the CMM, the sen-sitivity of 0.6 mm=K was found for the diameter measurement. During the measure-ments, the slow changes of temperature in the measurement laboratory can thereforebe neglected.
5.3. Measurement Model for Actual Geometry and Monte-CarloSimulations
The measurement model of Eq. (2) contains only x-axis components andis therefore not entirely correct. The next step is to rewrite the equation tomatch the actual measurement of n points giving n=2 diameters (Figure 8) alongthe circumference.
Di ¼ Ri þ Rn=2þi þ de; i ¼ 1 . . . n=2; ð3Þ
Table 4. Uncertainty budget for an averaged diameter measurement
Uncertainty Component Standard uncertainty [mm]
x1 Uncompensated error of CMM scales 0.30
dx1=p
60 Repeatability for one point 0.03
dr1=p
60 Local error of edge of measured object 0.30
x2 Uncompensated error of CMM scales 0.30
dx2=p
60 Repeatability for one point 0.03
dr2=p
60 Local error of edge of measured object 0.30
de Edge detection 1.00
Combined standard uncertainty (k ¼ 1) 1.17
D Expanded uncertainty (k ¼ 2) 2.33
308 B. HEMMING ET AL.

Dow
nloa
ded
By:
[Hem
min
g, B
jörn
] At:
07:0
5 11
Sep
tem
ber 2
007 where
Rj ¼ffiffiffiffiffiffiffiffiffiffiffiffiffiffiffiffiffiffiffiffiffiffiffiffiffiffiffiffiffiffiffiffiffiffiffiffiffiffiffiffiffiffiffiffiffiffiffiffiffiðxj þ dxjÞ2 þ ðyj þ dyjÞ2
qþ drj; j ¼ 1::n ð4Þ
Equation (3) can be interpreted as the sum of 60 pairs of opposite 120 radii giving 60diameters.
The Monte-Carlo method is clearly useful in uncertainty analysis in metrology(Brizzard et al. 2005; Mudronja et al. 2003). Briefly, the idea is to simulate themeasurement model M times using random numbers. According to the law of largenumbers the distribution of the M outputs of the model converge to the actual dis-tribution if the input distributions are reasonably correct. The systematic part ofthe uncompensated error of the CMM is simulated by a sine function with anamplitude of 0.5 mm, and the repeatability of the CMM is simulated by a normaldistribution. The edge detection and local error of the measured object were alsosimulated by normal distributions based on standard uncertainties described inthe previous sections.
The measurement model was implemented in Matlab using random numbersfrom these distributions. The measurement software of the CMM uses least-squarescircle fitting, and least-squares circle fitting was also included in the measurementmodel in Matlab. Finally, the standard deviation and the 95% confidence intervalare calculated from the distribution.
The 95% coverage interval for diameter based on 100,000 simulations from thedistribution of the simulated values is 2.1 mm (Figure 9). This is slightly less than theresult in Table 4 (2.33 mm). A major advantage with the Monte-Carlo approach is thecorrect simulation of the measurement strategy, and now the number of measure-ment points n can be easily changed in the model. Table 5 shows that if the numberof measurement points in the model is changed from 120 to 2 points, the expandeduncertainty from the simulation is 6.7 mm which is close to the value 6.6 mm obtained
Figure 9. Distribution of the simulated diameter measurements using a) 2 points and b) 120 points.
MEASUREMENT OF APERTURE AREAS 309

Dow
nloa
ded
By:
[Hem
min
g, B
jörn
] At:
07:0
5 11
Sep
tem
ber 2
007
for 2-point measurement with the values in Table 4. The reproducibility according tothe simulation with 120 points is 0.8 mm, slightly less than the result of 1.2 mm in theprevious section.
6. CONCLUSION
The optical CMM was found to be a suitable device for the diameter measure-ment of optical apertures. The repeatability of the aperture measurement results isvery good with a typical standard deviation of 0.2 mm for a point and 0.1 mm forthe mean diameter (average from 120 points). The reproducibility, affected byroundness error of the specimen, temperature and ambient light, is much larger,about 1 mm (k ¼ 2) for the diameter obtained as an average of 120 points.
Although some of the measured changes in the aperture diameter are close tothe estimated reproducibility of the measurement, the nature of these variations sug-gests that there has not been any systematic growth or shrink, for example, from oxi-dation or stresses of the apertures. Therefore, it appears that the aperture diametershave been stable during the studied period.
Earlier experiences with the optical CMM and the comparisons with the prob-ing CMM have shown a large operator-dependent factor which probably can betraced to illumination selections. The expanded measurement uncertainty for averagediameter is 2.33 mm (k ¼ 2). However, in this study the measurements with the prob-ing CMM appear to confirm the optical CMM’s result very well. The conclusion isthat if the required relative uncertainty in the aperture area is of the order of 0.1%the optical CMM used in this study is useful for aperture diameter measurements.
REFERENCES
Brizard, M., M. Megharfi, and C. Verdier. 2005. Absolute falling-ball viscometer: Evaluationof measurement uncertainty. Metrologia 42(4):298–303.
Chan, F. M., T. King, and K. Stout. 1996. The influence of sampling strategy on a circularfeature in coordinate measurements. Measurement 19(2):73–81.
Fowler, Joel, R. Saunders, and Albert Parr. 2000. Summary of high-accuracy aperture-areameasurement capabilities at the NIST. Metrologia 37(5):621–623.
Table 5. Measurement uncertainty and reproducibility using Monte-
Carlo simulation
n
Uncertainty at 95%
confidence level, [mm]
Reproducibility at 95%
confidence level [mm]
2 6.7 6.4
4 4.9 4.5
12 3.3 2.6
36 2.5 1.5
60 2.3 1.2
120 2.1 0.8
360 2.0 0.5
310 B. HEMMING ET AL.

Dow
nloa
ded
By:
[Hem
min
g, B
jörn
] At:
07:0
5 11
Sep
tem
ber 2
007
Fowler, Joel, R. Durvasula, and Albert Parr. 1998. High-accuracy aperture-area measurementfacilities at the National Institute of Standards and Technology. Metrologia 35(4):497–500.
Fowler, Joel and Maritoni Litorja. 2003. Geometric area measurements of circular aperturesfor radiometry at NIST 2003. Metrologia 40(1):S9–S12.
Guide to the expression of uncertainty in measurement (GUM). 2004. Supplement 1: Numeri-cal methods for the propagation of distributions using a Monte Carlo Method (ISO),draft.
Hartmann, Juergen, Joachim Fischer, and Joachim Seidel. 2000. A non-contact technique pro-viding improved accuracy in area measurements of radiometric apertures. Metrologia37(5):637–640.
International Organization for Standardization (ISO). 1993. Guide to the expression on uncer-tainty in measurement (GUM); Geneva.
Kivio, Heli, Tero Ristonen, Jaakko Salmi, and Heikki Tikka. 2004. Comparison of opticalCMMs. VDI=VDE-GMA, Proceedings of the 8th International Symposium on measure-ment and quality control in production. 145–156.
Kohler, Rainer, Michael Stock, and C. Garreau. 2004. Final report on the international com-parison of luminous responsivity CCPR-K3.b. Metrologia 41(1A) Tech Suppl.:1–30.
Kubarsepp, Toomas, Petri Karha, Manoocheri Farshid, Nevas Saulius, Ylianttila Lasse, andIkonen Erkki. 2000. Spectral irradiance measurements of tungsten lamps with filter radio-meters in the spectral range 290 nm to 900 nm. Metrologia 37(4):305–312.
Ikonen, Erkki, Pasi Toivanen, and Antti Lassila. 1998. A new optical method for high-accuracy determination of aperture area. Metrologia 35(4):369–372.
Lassila, Antti, Pasi Toivanen, and Erkki Ikonen. 1997. An optical method for direct determi-nation of the radiometric aperture area at high accuracy. Meas Sci Technol 8(9):973–977.
Lassila, Antti, Erkki Ikonen, and Kari Riski. 1994. Interferometer for calibration of graduatedline scales with a moving CCD camera as a line detector. Applied Optics 33(16):3600–3603.
Lazzari, Annarita and Gaetano Iuculano. 2004. Evaluation of the uncertainty of anoptical machine with a vision system for contact-less three-dimensional measurement.Measurement 36(3–4):215–231.
Martin, John, N. Fox, N. Harrison, B. Shipp, and M. Anklin. 1998. Determination and com-parisons of aperture areas using geometric and radiometric techniques. Metrologia35(4):461–464.
Mitutoyo America Corporation. 2001. Hyper quick vision brochure, bulletin no 1510. Paramus,NJ: Mitutoyo America Corporation.
Mudronja, Vedran, Biserka Runje, and Srdan Medic. 2003. Examples of applying MonteCarlo simulations in the field of measurement uncertainties of the standard of length.Proceedings of the XVII IMEKO World Congress, 1130–1134.
Puttock, M. and E. Thwaite. 1969. Elastic Compression of Spheres and Cylinders at Point andLine Contact, National Standards Laboratory Technical Paper No. 25, Division ofAppled Phyics, National Standards Laboratory, Commonwealth Scientific and IndustrialResearch Organization (CSIRO), University Grounds, Chippendale, New South Wales,Australia.
Razet, Annick and Jean Bastie. 2006. Uncertainty evaluation in non-contact aperture areameasurements. Metrologia 43(5):361–366.
Stock, Michael and Roland Goebel. 2000. Practical aspects of aperture-area measurements bysuperposition of Gaussian laser beams. Metrologia 37(5):633–636.
Woolliams, Emma R., Nigel P. Fox, Maurice G. Cox, Peter M. Harris, and Neil J. Harrison.2006. Final report on CCPR K1-a: Spectral irradiance from 250 nm to 2500 nm.Metrologia 43(1A) Tech Suppl.:1–396.
MEASUREMENT OF APERTURE AREAS 311