measurement and real-time cancellation of vibration-induced phase
TRANSCRIPT
Measurement and real-time cancellationof vibration-induced phase noise in a
cavity-stabilized laser
Michael J. Thorpe,* David R. Leibrandt, Tara M. Fortier, andTill Rosenband
National Institute of Standards and Technology, 325 Broadway St., Boulder, CO 80305, USA
Abstract: We demonstrate a method to measure and actively reduce thecoupling of vibrations to the phase noise of a cavity-stabilized laser. Thismethod uses the vibration noise of the laboratory environment rather thanactive drive to perturb the optical cavity. The laser phase noise is measuredvia a beat note with a second unperturbed ultra-stable laser while thevibrations are measured by accelerometers positioned around the cavity. AWiener filter algorithm extracts the frequency and direction dependence ofthe cavity response function. Once the cavity response function is known,real-time noise cancellation can be implemented by use of the accelerometermeasurements to predict and then cancel the laser phase fluctuations. Wepresent real-time noise cancellation that results in a 25 dB reduction of thelaser phase noise power spectral density.
© 2010 Optical Society of America
OCIS codes: (140.3425) Laser stabilization; (140.4780) Optical resonators; (120.7280) Vibra-tion analysis.
References and links1. B. C. Young, F. C. Cruz, W. M. Itano, and J. C. Bergquist, “Visible Lasers with Subhertz Linewidths,” Phys.
Rev. Lett. 82, 3799–3802 (1999).2. R. W. P. Drever, J. L. Hall, F. V. Kowalski, J. Hough, G. M. Ford, A. J. Munley, and H. Ward, “Laser phase and
frequency stabilization using an optical resonator,” Appl. Phys. B 31, 97–105 (1983).3. K. Numata, A. Kemery, and J. Camp, “Thermal-Noise Limit in the Frequency Stabilization of Lasers with Rigid
Cavities,” Phys. Rev. Lett. 93, 250602 (2004).4. M. Notcutt, L. S. Ma, J. Ye, and J. L. Hall, “Simple and compact 1-Hz laser system via an improved mounting
configuration of a reference cavity,” Opt. Lett. 30, 1815–1817 (2005).5. C. W. Chou, D. B. Hume, J. C. J. Koelemeij, D. J. Wineland, and T. Rosenband, “Frequency Comparison of Two
High-Accuracy Al+ Optical Clocks,” Phys. Rev. Lett. 104, 070802 (2010).6. B. Willke, K. Danzmann, M. Frede, P. King, D. Kracht, P. Kwee, O. Puncken, R. L. Savage, B. Schulz, F.
Seifert, C. Veltkamp, S. Wagner, P. Weßels and L. Winkelmann, “Stabilized lasers for advanced gravitationalwave detectors,” Class. Quantum Grav. 25, 114040 (2008).
7. T. Rosenband, D. B. Hume, P. O. Schmidt, C. W. Chou, A. Brusch, L. Lorini, W. H. Oskay, R. E. Drullinger, T.M. Fortier, J. E. Stalnaker, S. A. Diddams, W. C. Swann, N. R. Newbury, W. M. Itano, D. J. Wineland, and J. C.Bergquist, “Frequency Ratio of Al+ and Hg+ Single-Ion Optical Clocks; Metrology at the 17th Decimal Place,”Science 28, 1808–1812 (2008).
8. T. Nazarova, F. Riehle, and U. Sterr, “Vibration-insensitive reference cavity for an ultra-narrow-linewidth laser”Appl. Phys. B 83, 531–536 (2006).
9. J. Millo, S. Dawkins, R. Chicireanu, D. V. Magalhaes, C. Mandache, D. Holleville, M. Lours, S. Bize, P.Lemonde, and G. Santarelli, “Ultra-stable optical cavities: Design and experiments at LNE-SYRTE,” Proc. IEEEFreq. Control Symp.(IEEE, 2008), pp. 110–114.
#129030 - $15.00 USD Received 26 May 2010; revised 21 Jul 2010; accepted 22 Jul 2010; published 18 Aug 2010(C) 2010 OSA 30 August 2010 / Vol. 18, No. 18 / OPTICS EXPRESS 18744

10. S. A. Webster, M. Oxborrow, S. Pugla, J. Millo, and P. Gill, “Thermal-noise-optical cavity,” Phys. Rev. A 77,033847 (2008).
11. A. Hati, C. W. Nelson, D. A. Howe, N. Ashby, J. Taylor, K. M. Hudek, C. Hay, D. Seidel, and D. Eliyahu,“Vibration sensitivity of microwave components,” Proc. 2007 Joint Mtg. IEEE Int. Freq. Control Symp. andEFTF Conf. (IEEE, 2007), pp. 541–546.
12. A. Hati, C. W. Nelson, J. Taylor, N. Ashby, and D. A. Howe, “Cancellation of Vibration-Induced Phase Noise inOptical Fibers,” IEEE Phot. Technol. Lett. 20, 1842–1844 (2008).
13. N. Wiener, “Extrapolation, Interpolation, and Smoothing of Stationary Time Series,” (The MIT Press, 1949).14. J. C. Bergquist, W. M. Itano, and D. J. Wineland, “Laser Stabilization to a Single Ion,” in Frontiers in Laser
Spectroscpoy, proc. International School of Physics “Enrico Fermi”, T. W. Hansch and M. Inguscio eds. (North-Holland, Amsterdam, 2004), pp. 359–376.
15. L. S. Ma, P. Junger, J. Ye, and J. L. Hall, “Delivering the same optical frequency at two places: accurate can-cellation of phase noise introduced by an optical fiber or other time-varying path,” Opt. Lett. 19, 1777–1779(1994).
16. T. M. Fortier, A. Bartels, and S. A. Diddams, “Octave-spanning Ti:sapphire laser with a repetition rate >1 GHzfor optical frequency measurements and comparisons,” Opt. Lett. 31, 1011–1013 (2006).
17. Z. W. Barber, C. W. Hoyt, C. W. Oates, L. Hollberg, A. V. Taichenachev, and V. I. Yudin, “Direct excitation ofthe forbidden clock transition in neutral 174Yb atoms confined to an optical lattice,” Phys. Rev. Lett. 96, 083002(2006).
18. S. Haykin, “The LMS filter algorithm,” in Least-Mean-Square Adaptive Filters, S. Haykin and B. Widrow eds.(Wiley, 2003), pp. xi-xiii.
19. J. Volder, “The CORDIC Trigonometric Computing Technique,” IRE Trans. Electronic Computing EC-8, 330–334 (1959).
20. D. L. Jones, “Discrete-Time, Causal Wiener Filter,” http://cnx.org/content/m11825/latest/.
1. Introduction
Lasers locked to well isolated Fabry-Perot cavities provide the highest short-term fractional-frequency stability [1]. For high-finesse cavities, the large signal-to-noise ratio (SNR) of thePound-Drever-Hall (PDH) stabilization technique [2] allows laser frequencies to track the cav-ity resonance with negligible added noise. In this situation the laser’s frequency stability isdetermined primarily by the length stability of the cavity. This length stability is limited funda-mentally by intrinsic thermomechanical noise [1,3,4], but the thermomechanical noise can eas-ily be exceeded by vibration-induced length changes. Such frequency-stable lasers play a cru-cial role in a wide range of scientific investigations including: optical atomic clocks [5], grav-itational wave detectors [6], and searches for the time variation of fundamental constants [7],but their use is currently confined to quiet laboratory settings.
Since the first demonstration of thermal-noise-limited performance [1, 4], several designshave aimed at further reducing the sensitivity of the cavity reference frequency to externalperturbations [4, 9, 10]. In these designs symmetries are exploited to reduce the sensitivity ofthe spacer length to seismic vibrations. However, residual asymmetries inevitably remain dueto mechanical imperfections, limiting the sensitivity of the most vibration-insensitive cavitiesto about δL/L = 10−10/g [8–10]. While this acceleration sensitivity matches the best radio-frequency crystal oscillators, it is likely too high for use in non-laboratory environments, andfor field applications further reductions in sensitivity are desirable [11, 12].
In this work we discuss the application of Wiener filters [13] to measure the vibration sen-sitivity of a laser stabilization cavity, and to reduce this sensitivity with real-time corrections.This technique yields information about the cavity’s vibration response function, which can beused to improve the mechanical design and minimize the residual vibration sensitivity. Here thenatural vibrations of the laboratory floor act as the stimulus that allows the system’s responsefunction to be extracted. This simplifies the measurement, as no additional vibration drive isneeded, but the low level of ambient vibrations limits the available measurement signal-to-noise ratio. Finally, the cavity response function is used to calculate real-time corrections to thelaser frequency from measured accelerations and demonstrate a vibration-sensitivity reduction
#129030 - $15.00 USD Received 26 May 2010; revised 21 Jul 2010; accepted 22 Jul 2010; published 18 Aug 2010(C) 2010 OSA 30 August 2010 / Vol. 18, No. 18 / OPTICS EXPRESS 18745

1070 nm fiber laser
x
y
z
ultra-stable578 nm laser
SHG
PDH
AOM
Fiber w/ noisecancellation
{
I/Q board
12
34
56
Accel.(1-6)
Frequency comb
ADC
4 MHz beat note
{DDS
I Q
FPGAFPGA
Fig. 1. The setup used to measure the cavity response functions and perform real-time noisecancellation. Six accelerometers (labeled 1-6) are positioned on the table such that (1,3,5)measure accelerations in the vertical (z) direction while (2,4,6) measure accelerations inthe horizontal (x,y) plane. This combination of signals allows the measurement of all sixmotional degrees of freedom. The test light is transmitted to the frequency comb through anoise-cancelled optical fiber [14,15], and the heterodyne beat note (mixed to approximately4 MHz) measured at the frequency comb returns through a coaxial cable.
of 25 dB. The technique may yield higher sensitivity-reduction factors in an environment withstronger ambient vibrations.
2. Measurement setup
A schematic of the measurement setup is shown in Fig. 1. The laser for this experiment is a1070 nm fiber laser that typically serves as the clock laser for probing the 1S0 to 3P0 transitionin 27Al+ [5] (subsequently referred to as the test laser). The test cavity is built from a horizon-tally mounted, low-expansion glass spacer with a free spectral range of 625 MHz and a mirrorreflectivity of R = 0.99999 at 535 nm (corresponding to a finesse of 314,000) [1]. A PDHservo locks the second harmonic of the test laser to the optical cavity. When real-time noisecancellation is enabled, the cavity is ‘corrected’ for vibration-induced phase excursions by anacousto-optic modulator (AOM) that is driven by a rapidly-tunable digital synthesizer. The cav-ity, AOM and PDH optics rest on a steel plate (250 kg) that can be suspended from the ceilingwith rubber bands [1] for passive vibration isolation. However, for many of the measurementspresented here, the plate rests on the laboratory floor, so vibration noise couples directly to theoptical cavity.
The phase of the test laser that tracks the stabilization cavity is measured via a heterodynebeat note with one frequency component of a self-referenced optical frequency comb [16]that is separately stabilized by locking it to an ultra-stable 578 nm laser [17]. The stabilizedfrequency comb serves as a low-noise reference with which the vibration-induced phase excur-sions of the test cavity can be measured through the phase excursions of the heterodyne beatnote. This beat note is first mixed to near 4 MHz, and further mixed to near 0 Hz with a com-mercial demodulator circuit that yields separate in-phase and quadrature (I and Q) componentsof the signal. The I and Q components are sampled by a 14-bit analog-to-digital converter andfurther converted to phase samples with trigonometric functions. This system allows for a directcontinuous measurement of the test laser’s phase. To determine the cavity response functions,
#129030 - $15.00 USD Received 26 May 2010; revised 21 Jul 2010; accepted 22 Jul 2010; published 18 Aug 2010(C) 2010 OSA 30 August 2010 / Vol. 18, No. 18 / OPTICS EXPRESS 18746

10 s to 100 s of acceleration and laser-phase measurements are recorded continuously on a PCwith a sample rate of 1 kHz to 100 kHz. The recorded data is high-pass filtered in software witha 1 Hz corner to remove the DC component and then the optimal Wiener filter is extracted fromthe data.
When the system operates in real-time noise cancellation mode, the acceleration and phasemeasurements are input to a field-programmable gate array (FPGA). The FPGA uses a set ofstored filter coefficients to predict the laser-phase excursions. After each phase prediction iscalculated, the FPGA sends a phase tuning command to a direct digital synthesizer (DDS) toupdate the phase correction for the optical cavity via the AOM. The Wiener filter coefficientscan be uploaded to the FPGA if they are available from previously processed data. Anotherapproach, used for the real-time cancellation presented here, is to estimate the Wiener filtercoefficients in real-time on the FPGA via a Least Mean Squares (LMS) algorithm [18]. Withsix accelerometer channels and 500 filter coefficients per channel, the update period for thesystem is about 1.4 ms. During this interval the following steps occur: eight analog-to-digitalconversions (6 accelerometers plus I and Q signal components), conversion of I and Q samplesto an absolute phase [19], Wiener filter coefficient update, phase prediction update, and finallythe DDS phase update.
3. The Wiener filter and cavity response functions
The Wiener filter algorithm uses time domain correlation functions between the inputs and out-puts of a linear time-invariant system to determine the predictable part of the system responsein the presence of noise. For high SNR input data the algorithm calculates a set of time-domainfilters that correspond to the finite impulse response of the system. We extend the discussion byJones [20] to six accelerometer inputs. The discrete-time system model is
φ [n] =6
∑m=1
N−1
∑k=0
hm,kam[n− k]. (1)
Here, φ is the model’s predicted laser phase, n is the discrete-time variable, hm,k is the kth
filter coefficient for the mth input channel, am[n− k] is the signal from the mth accelerometer attime delay k, and N is the total number of filter coefficients used for each input channel. Theaccelerometer signals am may be considered as the sum of true accelerations a′m and accelerom-eter noise εm. The discrete-time n and continuous-time t are related by the the sample rate f :t = n/ f . The Wiener filter consists of the coefficients hm,k that minimize the difference betweenthe predicted phase φ and the measured phase φ in a least-squares sense. This quantity,
e2 =∞
∑n=−∞
(φ [n]− φ [n])2, (2)
is minimized by solving for the values of hm,k that make e2 stationary, i.e., ∂e2
∂hm,k= 0 for all
values of m and k. This condition may be written as
∞
∑n=−∞
φ [n]ai[n− j] =∞
∑n=−∞
6
∑m=1
N−1
∑k=0
hm,kam[n− k]a j[n− i], (3)
and further rewritten in terms of correlation functions as
Rφ ,ai [ j] =6
∑m=1
N−1
∑k=0
hm,kRai,am [ j− k], (4)
#129030 - $15.00 USD Received 26 May 2010; revised 21 Jul 2010; accepted 22 Jul 2010; published 18 Aug 2010(C) 2010 OSA 30 August 2010 / Vol. 18, No. 18 / OPTICS EXPRESS 18747

where Rx,y[ j] = ∑∞n=−∞ x[n]y[n− j]. The resulting set of 6N equations can be solved for the 6N
filter coefficients hm,k. Typically only one solution exists, which indicates that the calculatedstationary point of e2 is indeed a minimum. These coefficients represent the optimal filter forpredicting the effect of measured accelerations on the laser phase. In the limit of high SNR, hm,k
is the system’s finite impulse response, i.e., the phase response to an impulse on accelerometerm.
For spectral regions where the acceleration measurements have a high SNR, the coefficientshm,k can be used to determine the transfer function in the frequency domain. A discrete LaplaceTransform, commonly referred to as the Z-Transform, converts the filter coefficients into trans-fer functions Hm(ω) such that
φ(ω) =6
∑m=1
Hm(ω)am(ω). (5)
While noise on the phase measurement has the effect of increasing the uncertainty of thetransfer functions such that more averages are required to achieve a desired uncertainty inHm(ω), accelerometer noise acts to change the values of Hm(ω), because terms of type Rεi,εm
enter significantly on the right-hand-side of Eq. (4). The functions Hm(ω) can be interpreted astransfer functions only when the accelerometer SNR is large. When the accelerometer SNR is
0 20 40 60 80 100−10
−5
0
5
Time (s)
Phas
e (r
ad)
8 81 81. 2 81.4 81.6 81.8 2
−2
0
2
0 0.1 0.2 0.3 0.4
−202
a)
100
101
10210−6
10−4
10−2
100
Phas
e n
ois
e (r
ad 2 /H
z)
Frequency (Hz)
10−16
10−14
10−12
10−10
velocity ((m
/s) 2/Hz)
laser phaseWiener predictionerror
xyz
b)
Fig. 2. (a) The time domain performance of the Wiener filter algorithm. The measured laserphase (blue), predicted phase (green) and residual error (black) show that the Wiener filterreduces the RMS phase fluctuations by more than an order of magnitude. The inset on thelower left shows the first 0.5 seconds of the time trace. Here, the error is initially large dueto the lack of accelerometer information for times t < 0 s. By t = 0.2 s there is a sufficienthistory of accelerometer measurements to substantially reduce the phase error. The inseton the lower right shows the Wiener filter suppressing the RMS phase fluctuations of thelaser by more than a factor of 10. (b) The phase noise power spectral density (PSD) ofthe measured phase, predicted phase and residual phase error showing more than 30 dBof noise cancellation at 12 Hz. The dashed traces show the velocity PSD measured by theaccelerometers.
#129030 - $15.00 USD Received 26 May 2010; revised 21 Jul 2010; accepted 22 Jul 2010; published 18 Aug 2010(C) 2010 OSA 30 August 2010 / Vol. 18, No. 18 / OPTICS EXPRESS 18748
5 10 15 20 25 3010
−11
10−10
10−9
10−8
Sens
itivi
ty ((
dL/L
)/g)
Frequency (Hz)
a) HzHyHx
100 101 102
1
100
10
Frequency (Hz)
Mea
sure
d SN
R
b)
ax ay az phase
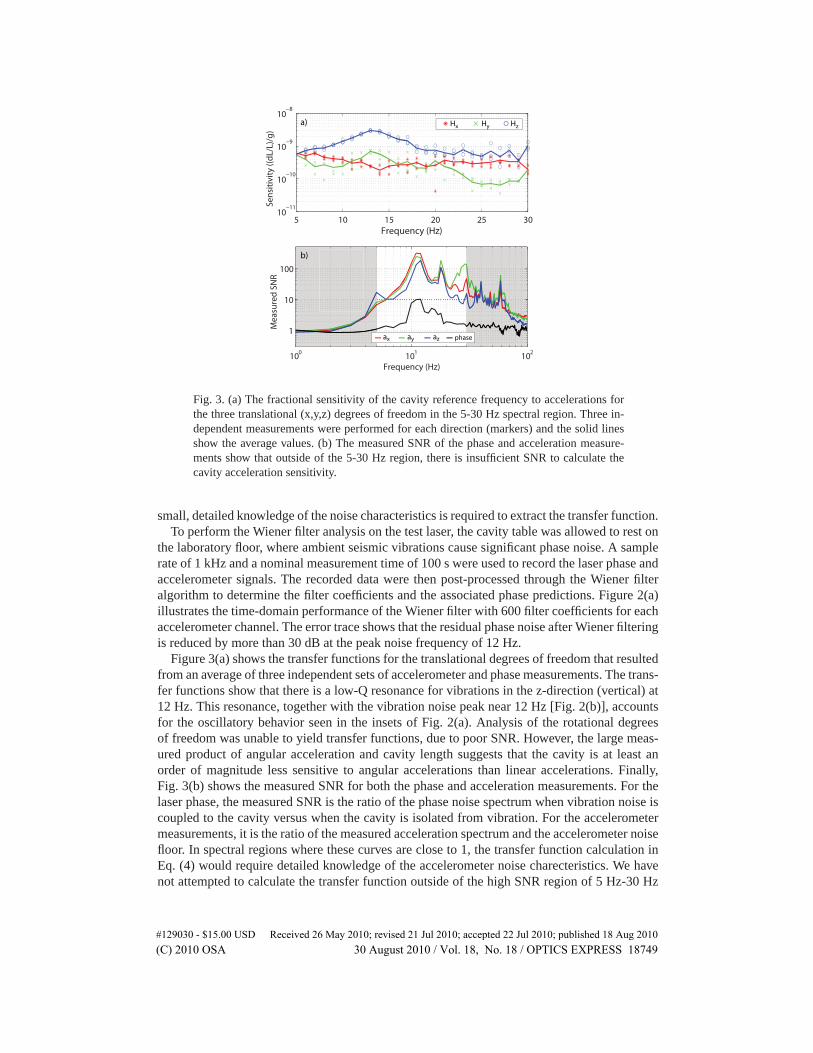
Fig. 3. (a) The fractional sensitivity of the cavity reference frequency to accelerations forthe three translational (x,y,z) degrees of freedom in the 5-30 Hz spectral region. Three in-dependent measurements were performed for each direction (markers) and the solid linesshow the average values. (b) The measured SNR of the phase and acceleration measure-ments show that outside of the 5-30 Hz region, there is insufficient SNR to calculate thecavity acceleration sensitivity.
small, detailed knowledge of the noise characteristics is required to extract the transfer function.To perform the Wiener filter analysis on the test laser, the cavity table was allowed to rest on
the laboratory floor, where ambient seismic vibrations cause significant phase noise. A samplerate of 1 kHz and a nominal measurement time of 100 s were used to record the laser phase andaccelerometer signals. The recorded data were then post-processed through the Wiener filteralgorithm to determine the filter coefficients and the associated phase predictions. Figure 2(a)illustrates the time-domain performance of the Wiener filter with 600 filter coefficients for eachaccelerometer channel. The error trace shows that the residual phase noise after Wiener filteringis reduced by more than 30 dB at the peak noise frequency of 12 Hz.
Figure 3(a) shows the transfer functions for the translational degrees of freedom that resultedfrom an average of three independent sets of accelerometer and phase measurements. The trans-fer functions show that there is a low-Q resonance for vibrations in the z-direction (vertical) at12 Hz. This resonance, together with the vibration noise peak near 12 Hz [Fig. 2(b)], accountsfor the oscillatory behavior seen in the insets of Fig. 2(a). Analysis of the rotational degreesof freedom was unable to yield transfer functions, due to poor SNR. However, the large meas-ured product of angular acceleration and cavity length suggests that the cavity is at least anorder of magnitude less sensitive to angular accelerations than linear accelerations. Finally,Fig. 3(b) shows the measured SNR for both the phase and acceleration measurements. For thelaser phase, the measured SNR is the ratio of the phase noise spectrum when vibration noise iscoupled to the cavity versus when the cavity is isolated from vibration. For the accelerometermeasurements, it is the ratio of the measured acceleration spectrum and the accelerometer noisefloor. In spectral regions where these curves are close to 1, the transfer function calculation inEq. (4) would require detailed knowledge of the accelerometer noise charecteristics. We havenot attempted to calculate the transfer function outside of the high SNR region of 5 Hz-30 Hz
#129030 - $15.00 USD Received 26 May 2010; revised 21 Jul 2010; accepted 22 Jul 2010; published 18 Aug 2010(C) 2010 OSA 30 August 2010 / Vol. 18, No. 18 / OPTICS EXPRESS 18749

shown in Fig. 3(b).
4. The Least Mean Squares filter and real-time noise cancellation
To maintain high phase stability of the laser in noisy environments, the acceleration measure-ments are input into the embedded processor of an FPGA, which uses the filter coefficients topredict and then correct the laser phase in real-time. The recursive least mean squares (LMS)algorithm “learns” the values of the Wiener filter coefficients with much lower computationalcost than the exact solution of Eq. (4) requires [18]. The LMS algorithm for six accelerationinputs and one phase output has much the same form as the Wiener filter algorithm. To derivethe update equation for this filter, one follows the same procedure as for the Wiener filter shownin Eqs. (1) and (2). From this point the LMS algorithm minimizes the squared error betweenthe model and the measured signal by relaxing the requirement that the minimization take placeover all times. Accordingly, the minimization equation takes the form
∂e[n]2
∂hi, j= −2e[n]ai(n− j) = 0, (6)
10 10 1010−5
10−3
10−1
10 1
Phas
e no
ise
(rad
2/H
z)
10−15
10−13
10−11
10 velocity ((m/s) 2/H
z)
with vibration noisevibration isolated
a) −9
0 1 2
10−3
10−2
10−1
100
101
10−16
10−15
10−14
10−13
10−12
τ (s)
df/f
with vibration noisefilter enabledvibration isolated
b)
Frequency (Hz)
Fig. 4. (a) The laser phase PSD for three operating conditions: (1) the cavity table restingon the floor with the filter turned off (blue), (2) the cavity table resting on the floor withthe filter turned on (green), and (3) the cavity table suspended by vibration isolating rubberbands (black). A real-time noise cancellation of 25 dB is achieved at 12 Hz compared to thefree running case, but still several dB more than the vibration isolated case. The direction-averaged velocity PSD shows the effect of the rubber band suspension system in isolatingthe cavity from laboratory vibration noise. (b) The Allan deviation for the test laser in thethree cases shown in (a). Without the LMS filter, the laser frequency instability increasesby more than an order of magnitude at τ = 0.1 s and by a factor of 4 at τ = 1 s comparedto the vibration isolated case (black). When the LMS filter is on, the test laser instability iswithin a factor of 2 compared to the vibration-isolated case for all time-scales. The pointsabove and below each Allan deviation curve show the 90% confidence interval for themeasurement.
#129030 - $15.00 USD Received 26 May 2010; revised 21 Jul 2010; accepted 22 Jul 2010; published 18 Aug 2010(C) 2010 OSA 30 August 2010 / Vol. 18, No. 18 / OPTICS EXPRESS 18750

where e[n] = φ [n]− φ [n]. From Eq. (6), an update equation for the filter coefficients is con-structed:
hn+1i, j = hn
i, j −μ∂e[n]2
∂hi, j= hn
i, j +2μe[n]ai(n− j). (7)
The coefficient μ , referred to as the step size, determines the convergence rate and stabilityof the LMS algorithm. This algorithm performs a gradient search for the set of coefficients hi, j
that minimize the phase prediction error. At each time step the filter coefficients are updatedvia Eq. (7), and the current filter coefficients are used to calculate the next phase prediction φ .This prediction is compared to the measured phase φ to determine e[n] for for the next filtercoefficient update. With the appropriate choice of μ , the set of hi, j quickly converges (∼10 s)to the values obtained using the Wiener filter.
To perform real-time noise cancellation the filter updating is turned off (μ = 0), and the nowstatic set of filter coefficients is used in conjunction with the accelerometer measurements topredict the laser phase excursions. The laser phase is corrected by subtracting the predictedphase excursion via the AOM in Fig. 1. Figure 4 shows the performance of real-time noisecancellation. Unlike the case of post-processed filtering, the real-time filtering shows someresidual phase noise in the 8 Hz-20 Hz spectral region. The residual noise can be attributed toa combination of excess accelerometer noise that was present in the real-time measurementsand the fact that the FPGA update rate had substantial timing jitter. Nevertheless, this initialimplementation of real-time active vibration cancellation reduces the vibration sensitivity by25 dB for the dominant ambient vibrations.
In future investigations it will be useful to carefully filter accelerometer signals and controlthe timing jitter of the FPGA output signals improve the real-time noise cancellation. Also, astudy of the time-invariance of the cavity response will be required to determine how often thefilter coefficients should be updated to maintain optimal noise cancellation.
5. Conclusion
We have measured the acceleration sensitivity of an optical cavity frequency reference witha Wiener filter algorithm that requires only ambient noise as the driving source. Furthermore,we have shown that the accelerometer measurements can be used for real-time cancellation ofvibration-induced noise by up to 25 dB. Together with more robust and environment-insensitivecavity designs, the measurement and cancellation techniques presented here may allow cavitystabilized lasers to act as ultra-stable frequency references for non-laboratory applications.
Acknowledgments
We thank Jim Bergquist, Dave Howe and Scott Diddams for useful discussions and AndrewLudlow, Nathan Lemke and Yanyi Jiang for the use of their stabilized 578 nm laser. M. J.Thorpe and D. R. Leibrandt acknowledge support from the National Research Council. Thiswork is not subject to U.S. copyright.
#129030 - $15.00 USD Received 26 May 2010; revised 21 Jul 2010; accepted 22 Jul 2010; published 18 Aug 2010(C) 2010 OSA 30 August 2010 / Vol. 18, No. 18 / OPTICS EXPRESS 18751