measurement and control of copper additives in ... · measurement and control of copper additives...
TRANSCRIPT

Measurement and Control of Copper Additives in Electroplating Baths by High-Performance Liquid Chromatography Marc A. Plante1, Stewart Fairlie2, Bruce Bailey1, Ian N. Acworth1 1Thermo Fisher Scientific, Chelmsford, MA 2Seagate Technology, Bloomington, MN
Wh
ite Pap
er 71211
Executive SummaryTwo methods are outlined whereby additives used to control the acid-bath electroplating quality of copper are measured. One aliquot of sample is treated to neutralize the acid, which is then analyzed by both methods, providing results on both quantity and quality of one or more additives.
Key WordsAccelerator, Additive, Brightener, Carrier, Charged Aerosol Detector, Copper Plating, Electrochemical Detector, HPLC, Leveler, Suppressor, UHPLC
Current Determination of Additives Damascene, or acid copper plating baths, have been in use since the mid 19th century on decorative items and machinery.1,2 The process generally uses copper sulfate and sulfuric acid in an aqueous medium. The object to be plated is placed into the bath, which is attached to a cathode in a direct current circuit. When power is applied, the copper (II) ions in solution are reduced at the cathode, forming a metallic copper film on the substrate. Recently, copper has been incorporated into the fine wires (down to nanometer widths) in integrated chips, requiring careful control of the plating process.
To improve upon the copper finish, and to enhance the appearance and quality of the electrodeposited film, organic additives are incorporated into plating baths. These organic additives are often proprietary and typically fall into three general categories: suppressor (or carrier), accelerator (or brightener), and leveler. Their exact chemical compositions and levels can vary depending on desired quality characteristics of the final product. The suppressor, typically a polyalkyl glycol, is a wetting agent, which controls how the copper ions approach the substrate surface and provides a uniformly wetted surface for the plating process. The accelerator is a small molecule that draws copper ions to the surface of the substrate, thereby providing a competing control influence on the suppressor. A typical accelerator found in plating bath solutions is sodium bis-(sodium propylsulfo) disulfide (SPS), which has two sulfate groups per molecule in
contrast to the sulfate ions contained in the matrix. The leveler, typically a nitrogen or sulfur containing compound of either high or low molecular weight, is used to create an added level of suppression on the surface substrate protrusions. This allows the accelerator to provide enhanced copper ion draw into cracks and crevices that typically develop in such a process.
With the use of these additives, it is important to measure how much of the additives are present in the bath solution. For decorative finishes, the Hull Cell test is typically used. This provides a qualitative measure as to how the bath solution is performing and whether it is generating the desired plating quality. Standard Hull cells are available, and the information from such tests is used to make adjustments to the additive concentrations in the plating bath, based on the appearance of the film created in the Hull cell, and an expert opinion as to how to change the bath chemistry.

2 In more demanding applications, the amounts of the three additives can be qualitatively determined using the industry standard — cyclic voltammetric stripping (CVS) analysis. This technique monitors the current changes produced on a rotating platinum disk electrode while scanning over a range of applied potentials at a specific rate. Copper is plated and then stripped from the rotating, platinum electrode, and current responses are recorded as a waveform of the sample (or additive combination) being evaluated. The measurement is not selective for a particular additive, rather it is cumulative response of all three. Furthermore, it also has some peculiarities, such as one found by Graham, et al,3 where CVS determinations of sequential additions of suppressor continued to register increases after the additions were stopped, (see Figure 1).3 Thus, the use of CVS for monitoring organic plating bath additives is inaccurate, unreliable and not quantitative.
High-Performance Liquid ChromatographyHigh-performance liquid chromatography (HPLC) is a form of liquid chromatography used to separate analytes in a sample based on their partitioning behavior between the liquid mobile phase and the solid stationary phase contained in the column. Once eluted, analytes can be determined using a variety of detection approaches, typically ultraviolet-visible absorption (UV-Vis), fluores-cence, mass spectrometry (MS), refractive index, evaporative light scattering detection (ELSD), electrochemical detection, or charged aerosol detection.
Although UV-Vis detection is the most common technique used with HPLC, it is not appropriate for determination of analytes used in plating baths as they typically lack chromophores. Rather, universal approaches such as ELSD and a Thermo Scientific™ Dionex™ Corona™ Charged Aerosol Detector are preferred, as the additives are typically non-volatile, for which these detectors are ideal. Considering that two of the additives, the accelerator and leveler, are electrochemically active, another important detector for these additives is the Thermo Scientific™ Dionex™ UltiMate™ 3000 ECD3000RS Electrochemical Detector (ECD), which uses electrochemical oxidation of an analyte for measurement. The ECD is a selective and sensitive detector, and it is important to this analysis: with the charged aerosol detection approach, the accelerator can co-elute with the suppressor degradation products, and the leveler can co-elute with the suppressor. This would prevent their accurate quantitation. As both the accelerator and leveler (typically) are electrochemically active, they can be determined quantitatively using the ECD.
Which Approach Is Best to Use — CVS or HPLC?The use of CVS for the determination of additives is the currently accepted method. The method, however, has many issues and limitations (some of which are already described above): it takes several hours to completely characterize a plating bath, and then only to a qualitative level. Measurement by CVS is a combined effect of all of the electrochemical activities of the additives (and their degradants) and does not measure their quantities directly.
A previously published HPLC method,4 used a 100 mN sulfuric acid mobile phase on a polymeric C18 column, and low-wavelength UV detection. Although this method was functional, it also had some limitations: the sulfuric acid was used to protonate the accelerator in order to increase its retention on the column, but the low pH led to hydrolysis of the polymer-based C18 column, causing a loss of retention over moderate usage. Sensitivity was also relatively low, as the analytes generally have weak or no chromophores.
Figure 1. Plating bath CVS profile of suppressor, with cumulative additions of suppressor under operating conditions.3 Reprinted with permission from Interconnect and Contact Metallization for ULSI, 31, (1999) pp. 143-151 Figure 2. Copyright 1999, The Electrochemical Society.

3The HPLC Solution The complexities of analyses for additives in the Damascene copper plating bath are three-fold: the matrix consists of a highly acidic bath, typically 15% sulfuric acid combined with high concentra-tions of copper sulfate; the organic additives are found in relatively minute concentrations; and the additives typically do not possess a chromophore. To analyze the relatively low concentrations of the additives (especially the accelerator and leveler), large injection volumes may be required to provide an adequate amount of analyte for detection and quantitation. The acidic nature of the sample, however, may damage silica-based HPLC columns. All of these factors have been addressed with the methods outlined below.
In order to overcome the drawbacks of CVS and to improve upon previously published HPLC methods a new advanced HPLC method was developed. The Thermo Scientific Dionex UltiMate 3000 HPLC system is the only HPLC system that can simultaneously operate two different HPLC analyses simultaneously on one platform: with use of a dual-gradient mobile phase pump and a switching valve (a 2-position, 6-port valve), the system can be operated in parallel mode, as illustrated in Figure 2. One pump is used for the HPLC-Charged Aerosol Detection (CAD)analysis of the suppressor (and possibly accelerator), while the second pump is used for the HPLC-ECD analysis of the accelerator (and possibly the leveler). The six-port valve is used to switch the autosampler between the two analytical systems, injecting the same sample onto both columns. A general guide as to the best detector for use for measurement of an additive is shown in Table 1. For the accelerator, charged aerosol and EC detection can both be used, but it is often found that with CAD, peaks related to the suppressor can begin to overlap and interfere with the accelerator peak. Since the suppressor does not respond on ECD at the low applied potentials used to detect the accelerator, the ECD is the preferred detector for measurement of the accelerator.
Figure 2. Typical system schematic for Damascene copper plating bath additive analysis using two, separate analyses, using two gradient elution methods.
Accelerator Suppressor Leveler
Chromophore No No Possible
Primary Detector Electrochemical Charged Aerosol Electrochemical
Secondary Detector Charged Aerosol None UV/Vis
Table 1. Typical detector selection for acid copper plating bath additives.

4 Specific Solution Details Given the flexibility of the system, it can be tailored to meet the various needs of the analytical chemist tasked with analysis of plating bath components. As described above, the typical approach involves two HPLC methods running simultaneously using one sample preparation. Each method runs in a parallel manner, with the autosampler injecting the same sample twice, once for each analysis. Each method runs for about 11 minutes, with a five-minute re-conditioning of the column in preparation for the next analysis.
The chromatographic conditions for the two methods are outlined below. The HPLC-CAD method uses a mobile phase containing diethylamine-acetate (DEA) which is used as a buffer and an ion-pairing agent for the accelerator. The typical accelerator found in plating bath solutions is sodium bis-(sodium propylsulfo) disulfide (SPS), which has two sulfate groups per molecule in contrast to the sulfate ions contained in the matrix. Thus the accelerator is retained on the reversed phase column longer and past the large matrix peak due to ion-pairing action of DEA. On the other hand, the suppressor is retained very well on the reversed phase column and is eluted under high-organic conditions.
Sample and Standard Preparation for AnalysisThe pH for acid copper plating bath samples must be increased from below 2 to between 2 and 4. For this example, an aliquot of 250 µL of N,N-dimethylethanolamine (DMEA) was added to a sample aliquot of 750 µL in an HPLC sample vial. The vial was capped and then shaken to mix. The actual ratio of sample to DMEA for different plating bath compositions is dependent on the amount of acid in the sample, and the final pH needs to be determined (by pH paper or pH meter) after neutralization, and it should be between 2–4.
Calibration standard solutions are prepared in the copper plating bath matrix (i.e., the plating bath solution containing no organic additives). Generally, a calibration will consist of triplicate injections from 50–200% nominal concentrations of all three additives in a single solution. In order to not adversely affect results, standard neutralization must match the sample neutralization as far as ratio of sample to DMEA.
HPLC InstrumentationUltiMate 3000 HPLC or RSLCPump: DGP-3600RS or SD
Autosampler: WPS-3000RS or SD
Column Oven: TCC-3200 Right Valve: 2-position, 6-port
Data Station: Thermo Scientific™ Dionex™ Chromeleon™ Chromatography Data System 7.2 SR1
Analysis of Accelerator and Leveler by HPLC-ECDAll solvent qualities should be of grades that are low in particulates and/or dissolved metals. Organic solvents and buffers should be of LC/MS grade. Water must be freshly-prepared (deionized water (18.2 MΩ∙cm)).
To demonstrate the sensitivity of the method, standard solutions of accelerator, suppressor, and leveler were prepared in copper plating bath matrix, containing 12.5 to 200% nominal concentra-tion (NC), and neutralized as described above. Each standard solution was analyzed in triplicate, and the resulting HPLC-ECD chromatograms are shown in Figures 3 and 4 for the accelerator and leveler, respectively. The ECD cell contains two working electrodes and the leveler was analyzed at electrode one at +650 mV while the accelerator was analyzed at +900 mV, relative to palladium.

5
Instrument Conditions
Mobile Phase 1A Water, 2.5 g/L sodium perchlorate*, 2.5 mL/L 10 % perchloric acid*
Mobile Phase 1B Methanol
Mobile Phase 1C n-Propanol/Water (900:100), 2.5 g/L sodium perchlorate*, 2.5 mL/L 10 % perchloric acid*
Column 1 Thermo Scientific™ Acclaim™ RSLC PA2, 2.2 µm, 3.0 × 100 mm
Sample Temp. 20 °C
Flow Rate 0.9–1.0 mL/min
Column Temp. 40 °C
Injection Volume 50.0 µL
Detector UltiMate 3000 ECD3000RS with 6011RS cell
Cell 1 Potential +650 mV vs. Pd
Cell 2 Potential +900 mV vs. Pd
Filter Constants 0.5 s
Data Rate 10 Hz
* 0.1 v/v-% trifluoroacetic acid can be used in place of the perchlorate modifiers
Figure 3. Overlaid HPLC-ECD (+900 mV) chromatograms of accelerator standards from 12.5–200 % NC, each analysis in triplicate.
Figure 4. Overlaid HPLC-ECD (+650 mV) chromatograms of leveler standards from 12.5–200% NC, each analysis in triplicate.
106
0-5
3.12 4.00 5.00
6.00
7.00
8.00 8.67
1- Accelerator - 5.598
µA
12.5% NC
25% NC
50% NC
100% NC
200% NC
Minutes
60
0-4
1- Leveller - 7.270
µA
12.5% NC
25% NC
50% NC
100% NC
200% NC
Minutes7.107 7.200 7.300 7.400 7.500 7.578

6
Figure 5. Linear regression fit of calibration data for accelerator by HPLC-ECD, from 12.5–200% NC, each concentration analyzed in triplicate.
Figure 6. Linear regression fit of calibration data for leveler by HPLC-ECD, from 12.5–200% NC, each concentration analyzed in triplicate.
Gradient Conditions
Time (min)
Flow (mL/min) %1A %1B %1C
-5.0 1.0 98 2 0
0.0 1.0 98 2 0
3.0 1.0 98 2 0
8.0 0.9 0 10 90
10.0 0.9 0 0 100
10.0 0.9 98 2 0
10.8 0.9 98 2 0
11.0 1.0 98 2 0
Calibration curves were linear, as shown in Figures 5 and 6, with correlation coefficients of 0.999 and 0.997, for the accelerator and leveler, respectively, indicating an acceptable linear fit of the data.
% Nominal
µA*min
0 40 80 120 160 200 240 Amount
0
16
% Nominal
µA*min
0 40 80 120 160 200 240 Amount
0
3

7The replicate injections of each standard provided a measure of instrument precision, measured as percent relative standard deviation (%RSD) of peak area. For both the accelerator and leveler, the %RSD values ranged from 0.2 to 1.4%RSD, respectively.
These standard solutions are the stock, additive solutions added directly to the plating bath matrix, and these standard solutions are essentially the same as the actual plating bath samples as they were at the start of the plating operation. Since the calibration showed acceptable correlation and precision, the method is quantitative for these samples.
Analysis of Accelerator and Suppressor by HPLC-CAD
Instrument Conditions
Mobile Phase 2A 20 mM diethylamine in DI Water, pH 5–6 with acetic acid
Mobile Phase 2B Methanol
Mobile Phase 2C Isopropanol
Column 2 Thermo Scientific™ Accucore™ C18, 2.6 µm, 4.6 × 150 mm
Sample Temp. 20 °C
Flow Rate 0.9–1.0 mL/min
Column Temp. 40 °C
Injection Volume 50.0 µL
Detector Thermo Scientific™ Dionex™ Corona™ Veo™ RS
Filter 3.6 s
Evap. Temp. 50 °C
Data Rate 10 Hz
Gradient Conditions
Time (min) %2A %2B %2C
-5.0 98 2 0
0.0 98 2 0
3.5 98 2 0
4.0 0 100 0
4.3 0 100 0
5.0 0 3 97
6.5 0 3 97
7.5 0 0 100
9.0 0 0 100
10.0 0 0 100
10.0 98 2 0
11.0 98 2 0

8
Figure 7. HPLC-CAD chromatograms of accelerator and suppressor at concentrations ranging from 12.5–200% nominal concentration, each concentration analyzed in triplicate.
Plating bath standard solutions, containing accelerator, suppressor, and leveler at concentrations of 12.5–200% NC in plating bath matrix were analyzed by HPLC-CAD. The resulting chromato-grams of accelerator and suppressor are shown in Figure 7, with each concentration analyzed in triplicate. The resulting calibration curves for the accelerator and suppressor are shown in Figures 8 and 9, each with a linear regression analysis. Detection of the leveler was not possible using HPLC-CAD, due to the low amount of this additive and co-elution with the suppressor.
Figure 8. Linear calibration fit of accelerator by HPLC-CAD, 12.5–200% nominal concentration, each point analyzed in triplicate.
% Nominal
pA*min
0 40 80 120 160 200 240 Amount
0
4
9
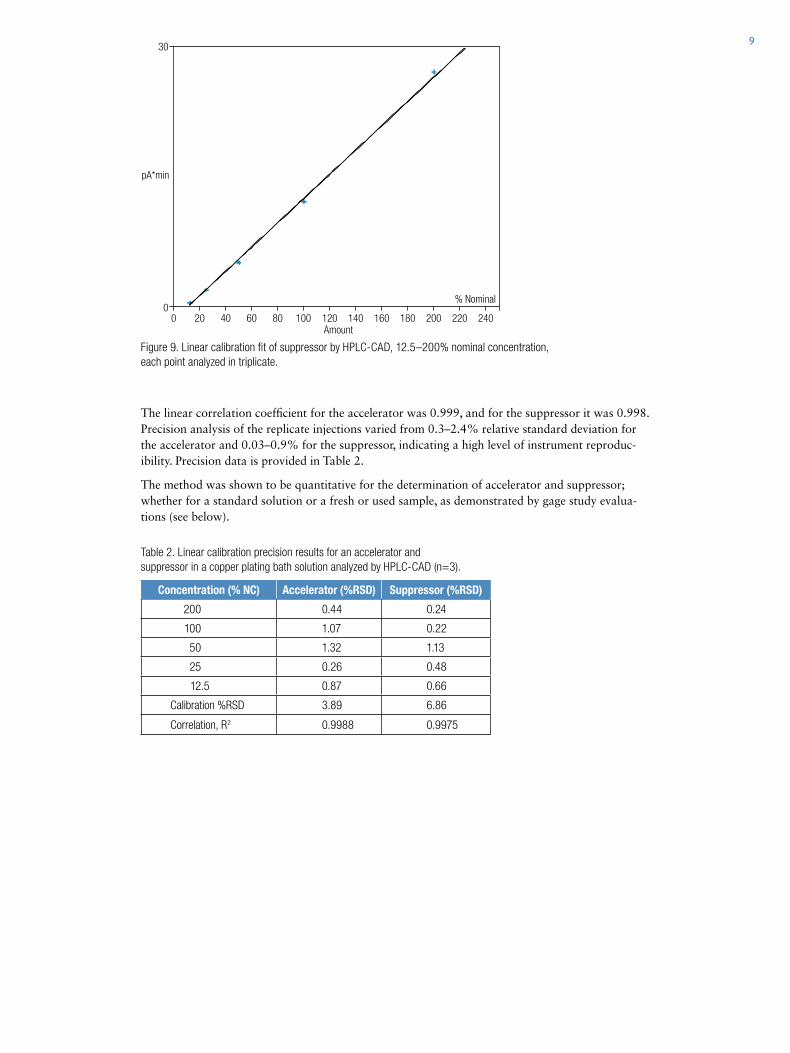
Figure 9. Linear calibration fit of suppressor by HPLC-CAD, 12.5–200% nominal concentration, each point analyzed in triplicate.
The linear correlation coefficient for the accelerator was 0.999, and for the suppressor it was 0.998. Precision analysis of the replicate injections varied from 0.3–2.4% relative standard deviation for the accelerator and 0.03–0.9% for the suppressor, indicating a high level of instrument reproduc-ibility. Precision data is provided in Table 2.
The method was shown to be quantitative for the determination of accelerator and suppressor; whether for a standard solution or a fresh or used sample, as demonstrated by gage study evalua-tions (see below).
Concentration (% NC) Accelerator (%RSD) Suppressor (%RSD)
200 0.44 0.24
100 1.07 0.22
50 1.32 1.13
25 0.26 0.48
12.5 0.87 0.66
Calibration %RSD 3.89 6.86
Correlation, R2 0.9988 0.9975
Table 2. Linear calibration precision results for an accelerator and suppressor in a copper plating bath solution analyzed by HPLC-CAD (n=3).
% Nominal
pA*min
0 40 6020 80 120100 140 160 200180 220 240 Amount
0
30

10 A different set of plating bath samples were obtained during operation, at 0, 10, 12, 20, and 25 Ah/L of usage. The overlaid HPLC-CAD chromatograms (obtained under different chromato-graphic conditions from those outlined here—not shown) are shown in Figure 10, with applied currents of 0, 5, 12, 20, and 25 Ah/L.
Figure 10. HPLC-CAD overlaid chromatograms of copper plating bath over varying levels of operation, showing decreases in accelerator and suppressor additive concentrations.
From these chromatograms, the amount of the original suppressor peak seen at retention times around 7.25 min, decreased as current was applied over time. These same samples were also evaluated using CVS metrology. When the HPLC results for suppressor and accelerator were correlated to the CVS results, linear relationships are obtained, as shown in Figures 11a and 11b, respectively. The relationship between the two sets of data may be linear, but there is a difference in accuracy, with the CVS results tending to be of greater values than the HPLC results. As previously mentioned, CVS is measuring the combined activity of the additives, and their degradents. In the case of the suppressor, the lower molecular weight degradents are contributing to the CVS result for suppressor.
Figure 11a. Comparison of suppressor results as determined by HPLC-CAD and CVS, for a copper plating bath used over various times.
Figure 11b. Comparison of suppressor results as determined by HPLC-CAD and CVS, for a copper plating bath used over various times.
4.5 5.0 5.5 6.0 6.5 7.0 7.5 8.0 8.5 8.88
pA
1- Accelerator - 5.578
2- Suppressor Degradents- 5.922
3- Suppressor - 7.281
Minutes
154
-60
0 Ah/L
5 Ah/L
12 Ah/L
20 Ah/L
25 Ah/L
HPLC
Val
ue (%
Nom
inal
)
y = 3.1225x − 203.59 R² = 0.8612
0
2
40
60
80
100
120
140
0 20 40 60 80 100 120 CVS Value (% Nominal)
Suppressor HPLC vs. CVS Data
HPLC
Val
ue (%
Nom
inal
)
Accelerator HPLC vs. CVS Data
y = 1.6736x − 98.883 R² = 0.9799
0
15
30
45
60
75
90
105
120
135
0 3 0 6 0 9 0 12 0 15 0
CVS Value (% Nominal)

11The reason for this difference in intercept value is due to the different forms of measurement: the HPLC is separating the additive from the rest of the sample and measuring the amount of additive directly. The CVS is measuring the electrochemical activity of the additives and their breakdown products together.
“During Damascene Cu plating, however, the suppressor polymer chains are cleaved to produce lower-MW species that are less effective as suppressors and interfere with the electro-deposition process. These suppressor breakdown contaminants must also be controlled if high quality Damascene deposits are to be consistently obtained.”5
The quantity of these low molecular weight suppressors (“impurities”) that are responsible for interconnect failures are indicators of bath quality, and can be quantified by HPLC.6 Using the same chromatographic data from this analysis (Figure 10), the increases in suppressor degradant concentrations with plating bath operation are shown in the HPLC-CAD chromatogram overlays in Figure 12. The HPLC-CAD method has the unique capability of showing the effect of plating bath operation on the relative amount of these degradants to the amount of the original suppressor as shown in Figure 13.
Figure 12. Overlay of HPLC-CAD chromatograms of a plating bath samples at increasing levels of operation, showing increases in suppressor degradants.
Figure 13. Plot showing increasing amounts of suppressor degradants (mass-%) with plating bath operation.
0
5
10
15
20
25
30
35
0 5 10 15 20 25 30
Supp
ress
or D
egra
datio
n (%
)
Plating Bath Operation (Ah/L)

12 Gage EvaluationA method performance comparison was made using gage studies involving two analytes, accelera-tor and suppressor. Gage results compare the standard variance of an experimental method, or tool, with a tolerance parameter if specified by the analytical requirements. These results are measured as % standard variance/tolerance, or SV/T. An acceptable or capable method was defined as having an SV/T <7. Methods with SV/T values between 10 (inclusive) and less than 30, need to be evaluated as to whether the amount of error related to method results will have a significant impact on process performance. If so, the method should be subsequently improved to increase the capability of the method. Methods with values at or above 30 should be improved.
For both the accelerator and suppressor, analyses were made by both CVS and HPLC with the accelerator measurement from the ECD and the suppressor measurement from the CAD, and the results are presented in Table 3. As can be seen, the HPLC methods were far more capable than the CVS determinations, with less than a quarter of the relative standard variance found by the CVS method. Data obtained using the HPLC methods provide more accurate and precise measurements of plating bath additives over a shorter time period.
AdditiveSV/T
CVS HPLC
Accelerator 44.90 9.69 (ECD)
Suppressor 79.39 18.97 (CAD)
ConclusionsThe HPLC methods for the determination of accelerator, leveler, and suppressor organic additives in acid copper plating baths provide reliable and fast determinations of the levels of these organic additives. Unlike CVS metrology that shows a cumulative signal related to all of the additives and their impurities, actual quantities of additives can be reliably obtained. Attributes such as bath quality, based on suppressor degradation, can also be monitored, which allows for a parameter to be defined for carbon treatment. HPLC methods were shown to provide higher data quality in less time than the current CVS metrology. More than a four-fold improvement in analytical performance was observed when both techniques were compared using gage evaluation techniques. Thus the HPLC method provides a more reliable control of an operating plating bath, less produc-tion costs and improvements in product quality:
• The analytical results reflect the current state of the operating plating bath
• Corrections of additive amounts based on more accurate analytical results, will yield products of higher and more consistent levels of quality
• Operational times will be increased, with less time wasted on correcting additive amount errors and unnecessary carbon treatments
• A measure of plating bath quality can now be determined as a function of suppressor breakdown
Table 3. Gage study results for accelerator and suppressor by CVS and HPLC.

Wh
ite Pap
er 71211
WP71211-EN 0716S
www.thermofisher.com/chromatography©2016 Thermo Fisher Scientific Inc. All rights reserved. SEAGATE is a trademark of Seagate Technologies. All other trademarks are the property of Thermo Fisher Scientific and its subsidiaries. This information is presented as an example of the capabilities of Thermo Fisher Scientific products. It is not intended to encourage use of these products in any manners that might infringe the intellectual property rights of others. Specifications, terms and pricing are subject to change. Not all products are available in all countries. Please consult your local sales representative for details.
Australia +61 3 9757 4300Austria +43 810 282 206Belgium +32 53 73 42 41Brazil +55 11 3731 5140Canada +1 800 530 8447China 800 810 5118 (free call domestic)
400 650 5118
Denmark +45 70 23 62 60Finland +358 9 3291 0200France +33 1 60 92 48 00Germany +49 6103 408 1014India +91 22 6742 9494Italy +39 02 950 591
Japan +81 6 6885 1213Korea +82 2 3420 8600Latin America +1 561 688 8700Netherlands +31 76 579 55 55 New Zealand +64 9 980 6700 Norway +46 8 556 468 00
Singapore +65 6289 1190Sweden +46 8 556 468 00 Switzerland +41 61 716 77 00Taiwan +886 2 8751 6655UK/Ireland +44 1442 233555USA +1 800 532 4752
References1. G. C. Van Tilburg, Plating Surf. Finish., 1984, 71, 78.
2. W. De la Rue, London Edinborough Philos. Mag., 1836, 9, 484.
3. Graham, L.; Ritzdorf, T.; Lindberg, F.“Steady-State Chemical Analysis of Organic Suppressor Additives Used in Copper Plating Baths.” Interconnect and Contact Metallization for ULSI. 1999 (31) p. 143-151 Figure 2.
4. Newton, B.; Kaiser, E. “Analysis And Control Of Copper Plating Bath Additives And By-Products” on http://extras.springer.com/2003/978-0-7354-0152-5/cdr_pdfs/indexed/514_1.pdf (accessed June 2014).
5. Bratin P.; Chalyt, G.; Kogan, A.; Pavlov, M.; Perpichand, M. J.; Tench D. M. “Detection of Suppressor Breakdown Contaminants in Copper Plating Baths” http://www.electrochem.org/dl/ma/203/pdfs/0676.pdf (accessed May 2014).
6. Imai, S.-i.; Kitabata, M. “Prevention of Copper Interconnection Failure in System on Chip Using Virtual Metrology” IEEE Transactions on Semiconductor Manufacturing, 2009 (December), on http://www.researchgate.net/publication/224588067_Prevention_of_Copper Interconnection Failure in System on Chip Using Virtual Metrology (accessed June 2014).