measurement and analysis: what can and does go wrong? · measurement and analysis: what can and...
TRANSCRIPT

Sponsored by the U.S. Department of Defense© 2004 by Carnegie Mellon University
Version Template 2004 Course or Lecture or Module Info. - page 1
Pittsburgh, PA 15213-3890
Measurement and Analysis:What Can and Does Go Wrong?
Maureen Brown Dennis R. Goldenson University of North Carolina Institute Software Engineering Institute
10th International Symposium on Software Metrics
14 September 2004

Report Documentation Page Form ApprovedOMB No. 0704-0188
Public reporting burden for the collection of information is estimated to average 1 hour per response, including the time for reviewing instructions, searching existing data sources, gathering andmaintaining the data needed, and completing and reviewing the collection of information. Send comments regarding this burden estimate or any other aspect of this collection of information,including suggestions for reducing this burden, to Washington Headquarters Services, Directorate for Information Operations and Reports, 1215 Jefferson Davis Highway, Suite 1204, ArlingtonVA 22202-4302. Respondents should be aware that notwithstanding any other provision of law, no person shall be subject to a penalty for failing to comply with a collection of information if itdoes not display a currently valid OMB control number.
1. REPORT DATE 14 SEP 2004 2. REPORT TYPE
3. DATES COVERED 00-00-2004 to 00-00-2004
4. TITLE AND SUBTITLE Measurement and Analysis: What Can and Does Go Wrong?
5a. CONTRACT NUMBER
5b. GRANT NUMBER
5c. PROGRAM ELEMENT NUMBER
6. AUTHOR(S) 5d. PROJECT NUMBER
5e. TASK NUMBER
5f. WORK UNIT NUMBER
7. PERFORMING ORGANIZATION NAME(S) AND ADDRESS(ES) Carnegie Mellon University,Software Engineering Institute,Pittsburgh,PA,15213
8. PERFORMING ORGANIZATIONREPORT NUMBER
9. SPONSORING/MONITORING AGENCY NAME(S) AND ADDRESS(ES) 10. SPONSOR/MONITOR’S ACRONYM(S)
11. SPONSOR/MONITOR’S REPORT NUMBER(S)
12. DISTRIBUTION/AVAILABILITY STATEMENT Approved for public release; distribution unlimited
13. SUPPLEMENTARY NOTES 10th International Software Metrics Symposium, 14-16 Sep 2004, Chicago, IL.
14. ABSTRACT
15. SUBJECT TERMS
16. SECURITY CLASSIFICATION OF: 17. LIMITATION OF ABSTRACT Same as
Report (SAR)
18. NUMBEROF PAGES
66
19a. NAME OFRESPONSIBLE PERSON
a. REPORT unclassified
b. ABSTRACT unclassified
c. THIS PAGE unclassified
Standard Form 298 (Rev. 8-98) Prescribed by ANSI Std Z39-18

© 2004 by Carnegie Mellon University Version 2004 Template Course or Lecture or Module Info. - page 2
Acknowledgements
The authors thank Bob Ferguson, Shannon Schelin, Kenny Smith,Mike Zuccher, and Dave Zubrow for their respective contributions.Capability Maturity Model, Capability Maturity Modeling, CarnegieMellon, CMM, and CMMI are registered in the U.S. Patent andTrademark Office by Carnegie Mellon University. CMMIntegration, SCAMPI, SCAMPI Lead Appraiser, and SEI areservice marks of Carnegie Mellon University.

© 2004 by Carnegie Mellon University Version 2004 Template Course or Lecture or Module Info. - page 3
Why Care?
Measurement very often is done well & adds value• Can inform both management & technical decisions• For both software & software intensive systems
We know this both experientially & evidentiallyYet, too often, measurement…• is poorly integrated into education & practice• remains challenging for all too many organizations

© 2004 by Carnegie Mellon University Version 2004 Template Course or Lecture or Module Info. - page 4
This Study
Analysis of findings from Software CMM® appraisals• 1350 findings• 663 appraisals• Conducted between 1987 and 2002 inclusive.
Appraisal results augmented by survey of CIO’s• State & local governments• Private sector
Analyses suggest several areas for better guidance about the useof measurement & analysis, for:• Managers• Engineers• Appraisers

© 2004 by Carnegie Mellon University Version 2004 Template Course or Lecture or Module Info. - page 5
Today’s TalkRefresher on CMM models and appraisal methodsMeasurement in CMM and CMMIAppraisal findingsThe CIO surveySummary, conclusions & future research

© 2004 by Carnegie Mellon University Version 2004 Template Course or Lecture or Module Info. - page 6
Competent people (and heroics)Level 1Initial
- Requirements Management- Software Project Planning- Software Project Tracking &Oversight- Software Subcontract Management- Software Quality Assurance- Software Configuration Management
Projectmanagementprocesses
Level 2Repeatable
- Organization Process Focus- Organization Process Definition- Training Program- Integrated Software Management- Software Product Engineering- Intergroup Coordination- Peer Review
Engineeringprocesses &organizationalsupport
Level 3Defined
- Quantitative Process Management- Software Quality Management
Product & processquality
Level 4Managed
- Defect Prevention- Technology Change Management- Process Change Management
Continuousprocessimprovement
Level 5Optimizing
Key Process AreasFocusLevel
The SW-CMM Key Process Areas

© 2004 by Carnegie Mellon University Version 2004 Template Course or Lecture or Module Info. - page 7
The CMMI Maturity Levels
Process unpredictable,poorly controlled andreactive
Process characterizedfor projects and isoften reactive
Processcharacterized for theorganization and isproactive
Process measuredand controlled
Focus on processimprovement
Optimizi
ngQuantitativelyManaged
Defined
Initial
Managed
Optimizi
ng
Defined
1
2
3
4
5
© 2000 by Carnegie Mellon University

© 2004 by Carnegie Mellon University Version 2004 Template Course or Lecture or Module Info. - page 8
Organizational Innovation and DeploymentCausal Analysis and Resolution
5 Optimizing
4 Quantitatively Managed
3Defined
2 Managed
ContinuousProcess ImprovementQuantitativeManagement
ProcessStandardization
BasicProjectManagement
Organizational Process PerformanceQuantitative Project Management
Requirements DevelopmentTechnical SolutionProduct IntegrationVerificationValidationOrganizational Process FocusOrganizational Process DefinitionOrganizational Training Integrated Project ManagementRisk ManagementDecision Analysis and ResolutionRequirements ManagementProject PlanningProject Monitoring and ControlSupplier Agreement ManagementMeasurement and AnalysisProcess and Product Quality AssuranceConfiguration Management
QualityProductivity
RiskRework1 Initial
Process AreasLevel Focus
© 2000 by Carnegie Mellon University

© 2004 by Carnegie Mellon University Version 2004 Template Course or Lecture or Module Info. - page 9
CMM Based Process Appraisals
Most widely known for quantitative benchmarks of• Maturity levels• KPA & goal satisfaction profiles
Also usually have textual findings• Meant to provide additional qualitative context & clarification• Presented verbally in formal presentations to sponsors & other
appraisal participantsVerbatim findings typically short enough to fit on overhead slides• Further clarification commonly provided verbally

© 2004 by Carnegie Mellon University Version 2004 Template Course or Lecture or Module Info. - page 10
Today’s TalkRefresher on CMM models and appraisal methodsMeasurement in CMM and CMMIAppraisal findingsThe CIO surveySummary, conclusions & future research

© 2004 by Carnegie Mellon University Version 2004 Template Course or Lecture or Module Info. - page 11
Measurement in SW-CMMExplicit and focused guidance?
• Not a strong point- Well, it was always there … but in the fine print- Well-integrated focus on measurement is noticeably
lackingAn early focus?
• Again, not a strong point• Especially important in a field where measurement isn’t widely
or well understood• Do it right in the first place … or expect rework

© 2004 by Carnegie Mellon University Version 2004 Template Course or Lecture or Module Info. - page 12
Measurement and Analysis in CMMI
Early emphasis introduced at Maturity Level 2• Measurement and Analysis describes good measurement
practice
But it’s not just the new Process Area• Maturing measurement processes at higher levels of
organizational maturity• Maturing measurement capability wherever it’s applied

© 2004 by Carnegie Mellon University Version 2004 Template Course or Lecture or Module Info. - page 13
The Level 2 Process Area
Procedures,Tools
MeasurementRepository
CollectData
Analyze
Data
StoreData
&Result
s
CommunicateResults
EstablishMeasureme
ntObjectives
SpecifyMeasures
SpecifyData
CollectionProcedures
SpecifyAnalysis
Procedures
MeasurementPlan
MeasurementIndicators
ProvideResults
Align MeasurementActivities

© 2004 by Carnegie Mellon University Version 2004 Template Course or Lecture or Module Info. - page 14
Measurement Related Generic Practices
Identify and correct the root causes of defects and other problems inthe process
5.2 Correct common cause ofproblems
Ensure continuous improvement of the process in fulfilling therelevant business objectives of the organization
5.1 Ensure continuousprocess improvement
Stabilize the performance of one or more subprocesses to determinethe ability of the process to achieve the established quantitativequality and process performance objectives
4.2 Stabilize sub-processperformance
Establish and maintain quantitative objectives for the process aboutquality and process performance based on customer needs andbusiness objectives
4.1 Establish quality objectives
Collect work products, measures, measurement results, andimprovement information derived from planning and performing theprocess to support the future use and improvement of theorganization’s processes and process assets
3.2 Collect improvementinformation
Monitor and control the process against the plan for performing theprocess and take appropriate corrective action
2.8 Monitor and control theprocess
FocusPractice

© 2004 by Carnegie Mellon University Version 2004 Template Course or Lecture or Module Info. - page 15
Other Process Areas with HeavyMeasurement Content
Organizational Process Definition
Decision Analysis & Resolution
Organizational Process Performance
Quantitative Process Management
Causal Analysis & Resolution
Organizational Innovation Deployment
Any process area that references Measurement andAnalysis

© 2004 by Carnegie Mellon University Version 2004 Template Course or Lecture or Module Info. - page 16
What Typically Gets Measured?
Heavily influenced by SW-CMMCMM models focus first on project planning & management• Estimation (not always so well done)• Monitoring & controlling schedule & budget
Followed by engineering• Of course, some do focus on defects early …

© 2004 by Carnegie Mellon University Version 2004 Template Course or Lecture or Module Info. - page 17
Measurement in High MaturityOrganizations
By definition…• Attention to organizational issues• Bringing processes under management control• Attention to process models• Causal analysis & proactive piloting
At ML 3• Focus on organizational definitions & a common repository
At ML 4• Improve process adherence
(Especially at) ML 5• Enhance & improve the processes themselves

© 2004 by Carnegie Mellon University Version 2004 Template Course or Lecture or Module Info. - page 18
How Well Do They Do It?
Well, it dependsClasses (if not nuances) of problems persist• Even as organizational maturity increases
E.g., what about enterprise measures?• How do you roll up measures from projects to enterprise
relevance?- Asked by sponsor at a (deservedly) ML 5 organization
• Remains a pertinent, and difficult, issue for us asmeasurement experts today

© 2004 by Carnegie Mellon University Version 2004 Template Course or Lecture or Module Info. - page 19
Today’s TalkRefresher on CMM models and appraisal methodsMeasurement in CMM and CMMIAppraisal findingsThe CIO surveySummary, conclusions & future research

© 2004 by Carnegie Mellon University Version 2004 Template Course or Lecture or Module Info. - page 20
Findings Analyzed1
Analysis limited to SW-CMM appraisal findings• Many more SW-CMM than CMMI appraisals reported at time
of study• Treatment of measurement more explicit in CMMI
Exclusion of early CMMI appraisals• Avoids confounding current results• Allows better subsequent evaluation of effects of changes to
models & appraisals

© 2004 by Carnegie Mellon University Version 2004 Template Course or Lecture or Module Info. - page 21
Findings Analyzed2
Finings from• CMM-Based Appraisals for Internal Process Improvement (CBA IPI)• Software Process Assessments (SPA) replaced by CBA IPI in 1996
Data drawn from Process Appraisal Information System (PAIS)• Contains all appraisal results submitted in confidence to SEI• Part of authorized lead appraiser program
Findings from 2910 CBA IPI and SPA appraisals of SW-CMM• Conducted from 19 February 1987 through 28 June 2003• Total of 36,316 findings recorded as “weaknesses” or “opportunities for
improvement”663 appraisals in the same time period
• With 1350 weaknesses & opportunities for improvement• That include the root word “measure.”

© 2004 by Carnegie Mellon University Version 2004 Template Course or Lecture or Module Info. - page 22
Typical Measurement RelatedFindings
Measurements of the effectiveness and efficiency ofproject management activities are seldom made
Test coverage data is inconsistently measured andrecorded
There is no common understanding, definition andmeasurement of Quality Assurance
Lack of a consistent approach for capturing qualityand productivity measurement data and comparingactuals with forecasts

© 2004 by Carnegie Mellon University Version 2004 Template Course or Lecture or Module Info. - page 23
Classifying the Findings
Initially had 48 categories of measurement related findings, basedon:• Measurement categories from Practical Software and Systems
Measurement (PSM) performance model• & a few additional categories to accommodate findings related
more directly to structure of SW-CMMSome findings are classified into more than one of the 48categories• For a total of 1,549 coded findings

© 2004 by Carnegie Mellon University Version 2004 Template Course or Lecture or Module Info. - page 24
46%
25%
14%
8%
1% 6%Firms Selling Products
In House Development
DOD Contractor
Military
Federal DOD
Federal Non DoD
Sector of Organizations Appraised

© 2004 by Carnegie Mellon University Version 2004 Template Course or Lecture or Module Info. - page 25
Maturity Levels
36%
35%
17%
8%4%
Initial
Repeatable
Defined
Managed
Optimizing

© 2004 by Carnegie Mellon University Version 2004 Template Course or Lecture or Module Info. - page 26
Grouped Measurement Findings
Appraisal findings typically arranged by KPA or other CMM modelcontentNot surprisingly: Largest of four groups addresses management• Difficulties with, or lack of use, of measurement for
management purposes
37%
30%
21%
12%
Management Processes
Measurement Processes
Process Performance
Product

© 2004 by Carnegie Mellon University Version 2004 Template Course or Lecture or Module Info. - page 27
Measurement of Management Processes
0%
5%
10%
15%
20%
25%
Qua
lity A
ssur
ance
Plann
ing &
estim
ation
Sched
ule &
pro
gres
sTra
ining
Config
urat
ion M
anag
emen
t
Oth
er
N = 582 coded findings

© 2004 by Carnegie Mellon University Version 2004 Template Course or Lecture or Module Info. - page 28
Detail: Management
“Other” includes:• Project management without further elaboration (38 instances)• Resources & cost (28)• Policies (14)• Risk (7)• ROI concerns (2)
All six categories closely coupled to structure & content of SW-CMM• First five categories map directly to model KPA structure
With possible exception of two references to measuring ROI,findings in “other” category map KPA’s or institutionalizationcommon features

© 2004 by Carnegie Mellon University Version 2004 Template Course or Lecture or Module Info. - page 29
Measurement Processes Themselves
0%
5%
10%
15%
20%
25%
30%
Inad
equat
e
Miss
ing &
inco
mpl
ete
Inco
nsist
ent u
se
Not u
sed
Oth
er
N = 461 coded findings

© 2004 by Carnegie Mellon University Version 2004 Template Course or Lecture or Module Info. - page 30
Detail: MeasurementMeasurement findings particularly noteworthy• Appraisers tend to focus on model structure & content• Measurement related content in SW-CMM considerably less explicit
& complete than CMMI®
26%: Existing measures inadequate for intended purposes• Findings are terse, but…• Many or most seem to say measurement is poorly aligned with
business & technical needs“Other” category includes:• Improvement of measurement processes (43 instances)• Inter group activities related to measurement (34)• Measurements misunderstood / not understood (12)• Leadership in the organization (3)

© 2004 by Carnegie Mellon University Version 2004 Template Course or Lecture or Module Info. - page 31
Process Performance
0%
10%
20%
30%
40%
50%
60%
70%
Proce
ss p
erfo
rman
ce
Proce
ss e
ffect
ivene
ss/ef
ficien
cyPee
r rev
iew
Other
N = 319 coded findings

© 2004 by Carnegie Mellon University Version 2004 Template Course or Lecture or Module Info. - page 32
Detail: Process Performance1
Findings describe problems with using measurement to understand &improve existing processesWell over half of mention difficulties with measuring process performancein explicit terms
• Particularly noteworthy since measurement of process performance isoften associated only with high maturity practices
19% refer to problems with measurement & analysis of processeffectiveness or efficiency19% refer to peer reviews
• A ML 3 KPA, but• Similar issues raised in lower maturity organizations
- Often re Software Project Tracking and Oversight- Also institutionalization common features, particularly
Measurement and Analysis.

© 2004 by Carnegie Mellon University Version 2004 Template Course or Lecture or Module Info. - page 33
Detail: Process Performance2
“Other” includes:• Process compliance (5 instances)• Tool shortage (4)• Incremental capability (1)• Personnel (1)

© 2004 by Carnegie Mellon University Version 2004 Template Course or Lecture or Module Info. - page 34
Product Quality & Technical Effectiveness
0%
10%
20%
30%
40%
50%
Qua
lity
Functi
onal
corre
ctne
ssPro
duct
size
& st
abilit
y
Othe
r
N = 187 coded findings

© 2004 by Carnegie Mellon University Version 2004 Template Course or Lecture or Module Info. - page 35
Detail: Product Quality & TechnicalEffectiveness
Does this mean that the appraised organizations had littledifficulty measuring these attributes? And/or:• Did they fail to try?• Did the appraisal ignore such issues?
“Other” includes:• Customer satisfaction (4 instances)• Technical effectiveness (4)• Reliability (3)• Security (1)• Supportability (1)• Usability (1)• Technical volatility (1)

© 2004 by Carnegie Mellon University Version 2004 Template Course or Lecture or Module Info. - page 36
Differences by Maturity Level?All four groups remain problematicthroughout
• Including the measurementprocess itself
- Nature of difficulties maydiffer
- But proper enactment &institutionalization remains aproblem for higher maturityorganizations
• Similar pattern for processperformance
- Particularly pertinent atmaturity levels 4 and 5
- But noticeable proportionsalso address similar issues inlower maturity organizations
0%
20%
40%
60%
80%
100%
Initia
l
Repea
table
Define
dMan
aged
& Opt
imizi
ng
Management processes Measurement processes
Process performance Product

© 2004 by Carnegie Mellon University Version 2004 Template Course or Lecture or Module Info. - page 37
Today’s TalkRefresher on CMM models and appraisal methodsMeasurement in CMM and CMMIAppraisal findingsThe CIO surveySummary, conclusions & future research

© 2004 by Carnegie Mellon University Version 2004 Template Course or Lecture or Module Info. - page 38
The CIO survey
Done as part of a UNC doctoral thesis• Includes a short series of questions about difficulties encountered in
implementing software measurement• Administered to 174 public & private sector CIO’s in January 2004
Public sector sample drawn from:• National Association of State Chief Information Officers (NASCIO)• International City/County Management Association (ICMA)• US CIO Council• N = 83• 40% response rate
Random sample of 200 private sector Chief Information Officers• Drawn from the Leadership Library database• N = 95• 51% response rate

© 2004 by Carnegie Mellon University Version 2004 Template Course or Lecture or Module Info. - page 39
CIO Questions
Extent to which organizations rely on measurement to guide theirsystem development and maintenance effortsLevel of difficulty encountered in establishing & using a series ofmeasurement classes required by the Clinger-Cohen ActAnswers characterized on a scale of 1 to 10• Where 10 indicates highest reliance or difficulty respectively

© 2004 by Carnegie Mellon University Version 2004 Template Course or Lecture or Module Info. - page 40
CIO Survey Results
CIO’s differ in reliance on measurement• One fourth have a high degree of reliance on measurement
(scores of 8 through 10 on the10 point scale)• 39% medium reliance (4 through 7)• 36% low reliance (1 through 3)
Difficulty encountered establishing & using measurement,particularly:
• Tracking buy-in• Risk• Customer satisfaction• Organizational readiness• Leadership commitment• Process performance

© 2004 by Carnegie Mellon University Version 2004 Template Course or Lecture or Module Info. - page 41
An Eye Chart: Difficulty UsingMeasurement
0% 20% 40% 60% 80% 100%
Training
CostEstimation
ProductQuality
TechnicalEffectiveness
ConfigurationMannagement
ProjectManagement
ProjectLeveling
QualityAssurance
Return onInvestment
ProcessPerformance
LeadershipCommitment
OrganizationalReadiness
CustomerSatisfaction
Risk
Buy-In
High (8-10) Medium (4-7) Low (1-3)

© 2004 by Carnegie Mellon University Version 2004 Template Course or Lecture or Module Info. - page 42
CIO Comparisons by Sector
Perhaps not surprisingly• Public sector CIO’s reported lower reliance on measurement
than did private sector• p < .01
Public sector CIO’s also reported greater difficulty in establishingmeasures for:• Cost estimation• Quality assurance• Project management• Product quality• Technical effectiveness• p < .01
© 2004 by Carnegie Mellon University Version 2004 Template Course or Lecture or Module Info. - page 43
Today’s TalkRefresher on CMM models and appraisal methodsMeasurement in CMM and CMMIAppraisal findingsThe CIO surveySummary, conclusions & future research

© 2004 by Carnegie Mellon University Version 2004 Template Course or Lecture or Module Info. - page 44
Issues & Interpretation1
Questions asked of CIO differ from findings categories• Many of survey categories refer to product or technology being
developed• As well as or instead of project or organizational processes per
se- e.g., buy-in, organizational readiness, and leadership
commitment- “Project leveling” refers to the existence of technologies
and/or processes shared across projects

© 2004 by Carnegie Mellon University Version 2004 Template Course or Lecture or Module Info. - page 45
Issues & Interpretation2
Areas that give the CIO’s most difficulty not mirrored by appraisalfindings• May mean the two sets of organizations differ in difficulties
faced• But also may be a function of data collection & analysis
methods• Survey asks explicitly about topics not comparably covered by
CMM based process appraisalsDerived survey measures combining responses from similarquestions comparably to appraisal findings may yield more similarresults• E.g., tuples of survey replies about training, cost estimation,
configuration management, project management, or qualityassurance

© 2004 by Carnegie Mellon University Version 2004 Template Course or Lecture or Module Info. - page 46
Measurement Guidance1
Findings results suggest several areas where better guidance isnecessary for:• Appraisers & appraisal teams• Software and systems engineering organizations• Improving work processes, delivered products & services
Large number of findings re inadequacies in measurementprocesses is particularly noteworthy• As are problems with measurement of product characteristics
Relative similarities in appraisal findings across maturity levelssuggest need to improve guidance throughout• For managers, engineers & appraisers• Perhaps particularly re weaknesses in using measurement to
monitor & improve process performance

© 2004 by Carnegie Mellon University Version 2004 Template Course or Lecture or Module Info. - page 47
Measurement Guidance2
CIO survey provides complementary resultsDifficulties reported by the CIO’s differ at first glance fromappraisal findings results• They also highlight the fact that any results are dependent on
method & question contextSurvey found notable difficulty in implementing measurement inall of the areas about which it queried• Including areas similar to the appraisal findings
However, survey also identified problem areas not typicallyemphasized in process appraisals

© 2004 by Carnegie Mellon University Version 2004 Template Course or Lecture or Module Info. - page 48
Future Work1
Could / should include:
Breakdowns of appraisal findings results by:• Patterns within organizations• Model structure• Non model content
Breakdowns by PAIS finding tags• Typically tagged by KPA but also by common feature and
other general issuesRecoding of appraisal findings according to different categories• Perhaps more tightly coupled with the CMMI Measurement
and Analysis process areaTests of inter-coder reliabilityFurther analysis of the CIO survey data.

© 2004 by Carnegie Mellon University Version 2004 Template Course or Lecture or Module Info. - page 49
Future Work2
Also could / should include:
Lexical analyses based on natural language processingAdditional studies of appraiser & practitioner understanding ofmeasurement content of CMMI• Lexical analyses of qualitative survey data from both
practitioners and appraisersAnalyses of CMMI appraisal findings• Including synonyms in addition to “measure”
Analyses of appraisal findings of organizational strengths• Many appear to be boilerplate restatements of model content• Still, there are slightly more findings of strengths than
weaknesses of all kinds, including those related tomeasurement

© 2004 by Carnegie Mellon University Version 2004 Template Course or Lecture or Module Info. - page 50
Other Implications
Appraisal findings• Ought PAIS reporting procedures capture fuller information about
finding content and context?- Any such work should begin as a research activity- With proper expectations & incentives for the appraiser corps
• Additional research could be done on using appraisals findings toguide process improvement
Inadequate measurement processes & product quality are foundrelatively often
• Appraisers often have a good appreciation about what can go wrongin the way organizations handle, or don’t handle, measurement
• Still, the problem may be more widespreadGuidance can come in many forms
• Interpretive documents to augment the CMMI product suite• Future model revisions• Tutorials and courses

© 2004 by Carnegie Mellon University Version 2004 Template Course or Lecture or Module Info. - page 51
Contact InformationDennis R. Goldenson
Software Engineering InstitutePittsburgh, PA 15213-3890
Maureen BrownUniversity of North CarolinaChapel Hill, NC 27599-3330

© 2004 by Carnegie Mellon University Version 2004 Template Course or Lecture or Module Info. - page 52
Back PocketHow can we expedite things?Maturing measurement capabilities
© 2004 by Carnegie Mellon University Version 2004 Template Course or Lecture or Module Info. - page 53
How Can We Do Better?
Measurement and Analysis is at CMMI Maturity Level 2• Put there to get it right from the start• Lots of favorable anecdotes, but…
- Intent not yet well understood by process champions- And we still need better (measurement based) evidence
The bulk of the measurement content is at Maturity Level 3 &above … mostly at levels 4 & 5Why wait?• Causal thinking is (or should be) the essence of statistics 101• The problem is keeping the management commitment in an ad
hoc, reactive environment• But, it can be done…
© 2004 by Carnegie Mellon University Version 2004 Template Course or Lecture or Module Info. - page 54
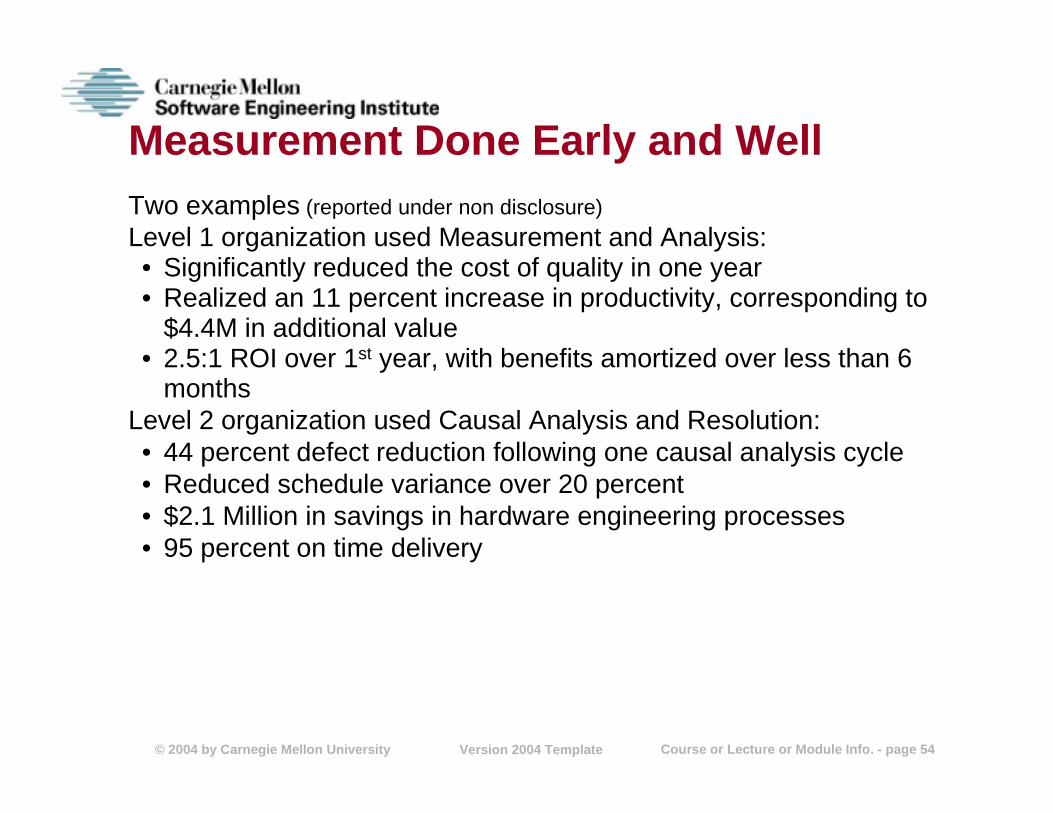
Measurement Done Early and WellTwo examples (reported under non disclosure)
Level 1 organization used Measurement and Analysis:• Significantly reduced the cost of quality in one year• Realized an 11 percent increase in productivity, corresponding to
$4.4M in additional value• 2.5:1 ROI over 1st year, with benefits amortized over less than 6
monthsLevel 2 organization used Causal Analysis and Resolution:• 44 percent defect reduction following one causal analysis cycle• Reduced schedule variance over 20 percent• $2.1 Million in savings in hardware engineering processes• 95 percent on time delivery

© 2004 by Carnegie Mellon University Version 2004 Template Course or Lecture or Module Info. - page 55
Aligning Measurement & InformationNeeds
CMM based measurement always got done• However much was required by appraisers…• But less likely to be used if divorced from the real improvement
effortOrganizations still struggle, even at higher Maturity Levels• Need a marriage of domain, technical & measurement knowledge• Yet, measurement often assigned to new hires with little deep
understanding or background in domain or measurementHow can we do better?• GQ(I)M when the resources & commitment are there• Prototype when they aren’t … or maybe always• May be easier in small settings because of close communications
& working relationships

© 2004 by Carnegie Mellon University Version 2004 Template Course or Lecture or Module Info. - page 56
Performance ModelsCalled out explicitly in CMM and CMMI• Especially at Maturity Levels 4 & 5• But, what do they (usually) mean?
- Often poorly understood- Little more than informal causal thinking
We (the measurement mafia) can do better• In fact, some have done better…• By applying modeling & simulation models to process
improvement- Not common, but it has been & is being done- 10 years ago, as an integral part of one organization’s process
definition, implementation & institutionalization- The organization is gone now, but that’s another (measurement)
story

© 2004 by Carnegie Mellon University Version 2004 Template Course or Lecture or Module Info. - page 57
Modeling & Simulation
Analytic method can be applied in many domains• Estimate when experimentation, trial & error are impractical• By being explicit about variables & relationships, process
definitions, business & technical goals & objectivesUse it to:• Proactively inform decisions to begin, modify or discontinue a
particular improvement or intervention• By comparing alternatives & alternative scenarios
Of course, there’s still a need for measurement…!• To estimate model parameters based on fact• To validate and improve the models

© 2004 by Carnegie Mellon University Version 2004 Template Course or Lecture or Module Info. - page 58
What’s Next? (Or, what do I think should benext…?)Can early attention to measurement really expedite organizationalmaturation?• That’s part of the rationale for Six Sigma too• But it’s not well, or at least widely, understood
- How can we demonstrate the relationship?- What data & research designs do we need?
Cause and effect?• Do the analyses early and well
Pay more attention to performance measures• Including enterprise measures• And including quality attributes beyond defects
(See ISO/IEC Working Group 6, ISO 25000)And don’t ignore (or wait to do) modeling and simulation

© 2004 by Carnegie Mellon University Version 2004 Template Course or Lecture or Module Info. - page 59
Back PocketHow can we expedite things?Maturing measurement capabilities

© 2004 by Carnegie Mellon University Version 2004 Template Course or Lecture or Module Info. - page 60
From Software Engineering Symposium2000Work with Khaled El Emam

© 2004 by Carnegie Mellon University Version 2004 Template Course or Lecture or Module Info. - page 61
The Prescribed Order: Items in PresumptiveMaturity Level 2
• Schedule e.g., actual versus planned completion, cycle time (85%)
• Cost/budget e.g., estimate over-runs, earned value (77%)
• Effort e.g., actual versus planned staffing profiles (73%)
• Field defect reports (68%)
• Product size e.g., in lines of code or function points (60%)
© 2004 by Carnegie Mellon University Version 2004 Template Course or Lecture or Module Info. - page 62
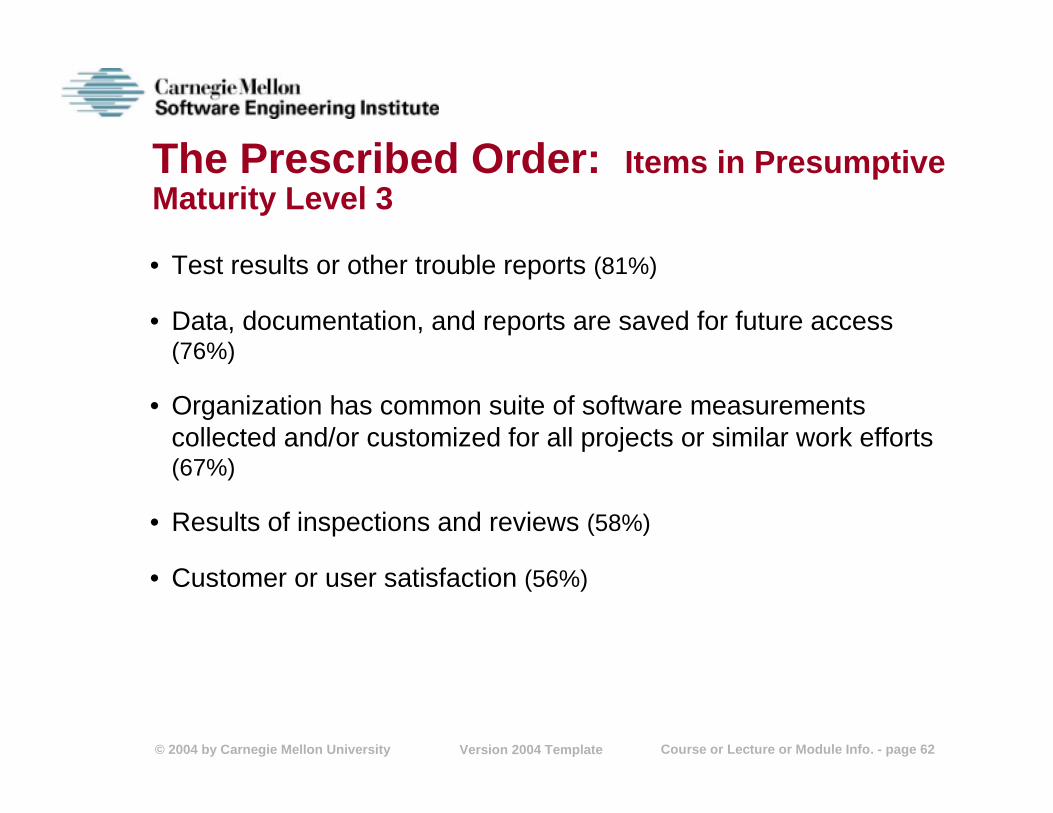
The Prescribed Order: Items in PresumptiveMaturity Level 3
• Test results or other trouble reports (81%)
• Data, documentation, and reports are saved for future access(76%)
• Organization has common suite of software measurementscollected and/or customized for all projects or similar work efforts(67%)
• Results of inspections and reviews (58%)
• Customer or user satisfaction (56%)

© 2004 by Carnegie Mellon University Version 2004 Template Course or Lecture or Module Info. - page 63
The Prescribed Order: Items in PresumptiveMaturity Level 4
• Quality assurance and audit results (54%)• Comparisons regularly made between current project
performance and previously established performance baselinesand goals (44%)
• Requirements stability e.g., number of customer change requests orclarifications (43%)
• “Other” quality measures e.g., maintainability, interoperability, portability,usability, reliability, complexity, reusability, product performance, durability(31%)
• Process stability (31%)• Sophisticated methods of analyses are used on a regular basis
e.g., statistical process control, simulations, latent defect prediction, ormultivariate statistical analysis (14%)
• Statistical analyses are done to understand the reasons forvariations in performance e.g., variations in cycle time, defect removalefficiency, software reliability, or usability as a function of differences incoverage and efficiency of code reviews, product line, application domain,product size, or complexity (14%)

© 2004 by Carnegie Mellon University Version 2004 Template Course or Lecture or Module Info. - page 64
The Prescribed Order: Items in PresumptiveMaturity Level 5
• Experiments and/or pilot studies are done prior to widespreaddeployment of major additions or changes to developmentprocesses and technologies (38%)
• Evaluations are done during and after full-scale deployments ofmajor new or changed development processes and technologies(e.g., in terms of product quality, business value, or return on investment)(27%)
• Changes are made to technologies, business or developmentprocesses as a result of our software measurement efforts (20%)

© 2004 by Carnegie Mellon University Version 2004 Template Course or Lecture or Module Info. - page 65
ExceptionsExceptions• Level 5
- Experiments and/or pilot studies (38%)• Level 4
- Sophisticated analyses (14%)- Statistical analyses of variations (14%)
• Level 3- Test results or other trouble reports (81%)- Data, documentation, and reports saved (76%)
• Level 2- Product size (60%)
May be due to• Measurement error in this study• Differences among organizational contexts• Subtleties in “natural” order
© 2004 by Carnegie Mellon University Version 2004 Template Course or Lecture or Module Info. - page 66
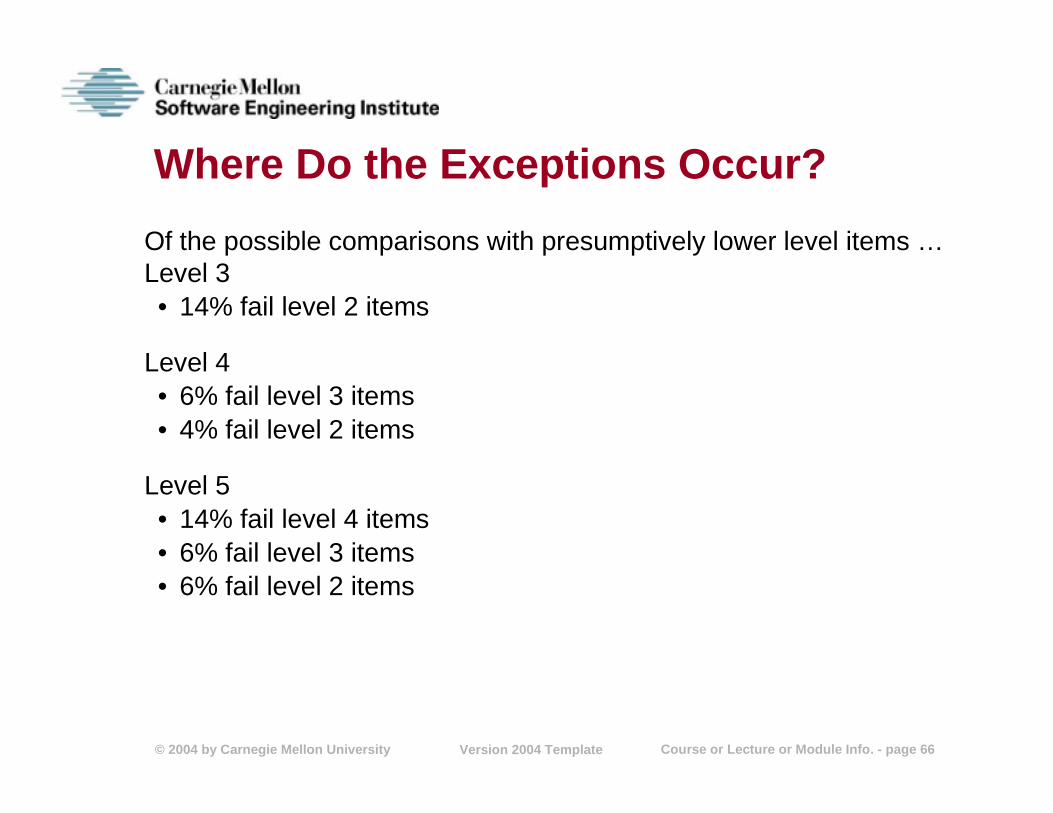
Where Do the Exceptions Occur?
Of the possible comparisons with presumptively lower level items …Level 3• 14% fail level 2 items
Level 4• 6% fail level 3 items• 4% fail level 2 items
Level 5• 14% fail level 4 items• 6% fail level 3 items• 6% fail level 2 items