measured changes in c-band radar reflectivity of … technical paper 3671 measured changes in c-band...
TRANSCRIPT
NASA Technical Paper 3671
Measured Changes in C-Band RadarReflectivity of Clear Air Caused byAircraft Wake Vortices
Anne I. Mackenzie
Langley Research Center • Hampton, Virginia
National Aeronautics and Space AdministrationLangley Research Center • Hampton, Virginia 23681-2199
November 1997
https://ntrs.nasa.gov/search.jsp?R=19980000408 2018-07-13T03:44:43+00:00Z

The use of trademarks or names of manufacturers in this report is for
accurate reporting and does not constitute an official endorsement,
either expressed or implied, of such products or manufacturers by the
National Aeronautics and Space Administration.
Available electronically at the following URL address: http://techreports.larc.nasa.gov/ltrs/ltrs.html
Printed copies available from the following:
NASA Center for AeroSpace Information
800 Elkfidge Landing Road
Linthicum Heights, MD 21090-2934
(301) 621-0390
National Technical Information Service (NTIS)
5285 Port Royal Road
Springfield, VA 22161-2171
(703) 487-4650

Contents
Symbols ............................................................................... v
Abstract ............................................................................... 1
1. Introduction .......................................................................... 1
2. Background .......................................................................... 2
3. Experimental Setup .................................................................... 3
3.1. Radar 5 .......................................................................... 3
3.2. C-130 Airplane .................................................................... 3
3.3. Scanning Strategies and Flight Patterns ................................................. 3
3.4. Weather and Local Geography ........................................................ 5
4. Signal Level Calculations ............................................................... 5
4.1. Recording Lag Correction ........................................................... 5
4.2. AGC to SNR Interpolation ........................................................... 5
4.3. Calibrated Sphere Track and Noise Calculation ........................................... 5
5. Clutter-Only Recordings ................................................................ 7
6. Vortex Data Analysis Method ............................................................ 8
6.1. Selection of Passes ................................................................. 8
6.2. Database and Programming Languages ................................................. 9
6.3. Criteria for Recognizing Wake Vortices ................................................ 9
6.4. Clutter Subtraction ................................................................ 10
6.5. Volume Reflectivity ............................................................... 10
7. Vortex Data Analysis Results ........................................................... 10
7.1. Data Plot Description .............................................................. 10
7.2. Screening for Airplane Detection ..................................................... 11
7.3. Evidence of Vortex Detection ....................................................... 11
7.4. Clutter Limitations to Vortex Detection ................................................ 12
8. Concluding Remarks and Recommendations ............................................... 12
Appendix A--Signal Level Plots and Track Plots ............................................. 13
Appendix B--Meteorological Data ........................................................ 59
Appendix C--Variability of Clutter Power at Various Time Lags ................................. 60
References ............................................................................ 74
!11

Symbols
B2
C n
C
D
G
k
L
lmN
n
Pt
P
R
S
T
r,t
V
IJ
£
0
G
x
radar receiver bandwidth
refractive index structure constant
speed of light
antenna diameter
antenna gain
Boltzmann' s constant
loss
Kolmogorov microscale
noise power
refractive index
peak transmitted power
pressure
range
signal power
temperature
system equivalent noise temperature
number of sample standard deviations away from mean, used in statistical calculations
where sample population is small enough that true standard deviation is unknown
range cell volume
kinematic viscosity
angular width of radar target
turbulent eddy dissipation rate
volume radar reflectivity
antenna two-sided 3-dB beamwidth
radar wavelength
radar cross section
range gate length


Abstract
Wake vortices from a Lockheed C-130 airplane were observed at the NASA
Wallops Flight Facility with a ground-based, monostatic C-band radar and anantenna-mounted boresight video camera. The airplane wake was viewed from a
distance of approximately 1 km, and radar scanning was adjusted to cross a pair ofmarker smoke trails generated by the C-130. For each airplane pass, changes in
radar reflectivity were calculated by subtracting the signal magnitudes during an ini-
tial clutter scan from the signal magnitudes during vortex-plus-clutter scans. The
results showed both increases and decreases in reflectivity on and near the smoke
trails in a characteristic sinusoidal pattern of heightened reflectivity in the center
and lessened reflectivity at the sides. Reflectivity changes in either direction varied
from -131 to -102 dBm-1; the vortex-plus-clutter to noise ratio varied from 20
to 41 dB. The radar recordings lasted 2.5 rain each; evidence of wake vortices was
found for up to 2 min after the passage of the airplane. Ground and aircraft clutter
were eliminated as possible sources of the disturbance by noting the occurrence of
vortex signatures at different positions relative to the ground and the airplane. This
work supports the feasibility of vortex detection by radar, and it is recommended that
future radar vortex detection be done with Doppler systems. (This paper was written
in January 1997.)
1. Introduction
From January through May 1995, the SensorsResearch Branch of Langley Research Center testedX-band and C-band radars to determine the characteris-
tics of ground-based wake vortex detection at those fre-
quencies. The Radar Wake Vortex Experiment is part ofthe NASA Reduced Spacing OperationlTerminal Area
Productivity (RSO/TAP) program, which seeks to
improve aircraft throughput at busy airports while main-
taining current safety standards. At present, aircraft,
when landing or taking off, are spaced at standard dis-
tances according to their relative sizes and weights to
prevent the upset or disturbance that can occur when one
aircraft flies through the wake vortices produced byanother. Radar is a sensor that can determine the pres-
ence, location, and longevity of vortices. With informa-
tion provided by such a sensor, air traffic controllers
could space aircraft according to the detected hazardrather than using standard separations which might be
longer than necessary.
In an effort to find the best frequency for all-weatherwake vortex detection, initial tests were conducted at
Wallops Island with a permanently installed C-band
radar in conjunction with an experimental X-band radar
connected to the inner portion of the nearby Wallops
ultrahigh-frequency (UHF) antenna. Because it had
already been well established that X-band radars could
detect rain by Rayleigh scattering, the Wallops tests were
performed in clear weather to test for detection of air tur-bulence by Bragg scattering.l The X-band radar system,
the principal one under test, was slaved to the C-band
radar antenna; therefore, data were acquired by both sys-
tems simultaneously. Both radars scanned across the
wake of a Lockheed C-130 airplane for about 2 min after
the passage of the airplane. The C-130 had been fitted
with smoke pods to give a visual indication of the posi-tion of the wake vortices. Although not designed for the
purpose of vortex detection, the C-band radar provided
auxiliary information that, it was hoped, would assist invalidation of the X-band detection of Bragg-scattered
signals from the aircraft-generated vortices.
Analysis of the C-band data, which consisted of sig-
nal magnitudes at one range gate selected for each pass,
showed an identifiable signature that lasted for up to
2 min after passage of the airplane. Particularly evident
during azimuth scans across the wake, the vortex-plus-
clutter signal magnitude consistently varied from the
clutter magnitude in a roughly sinusoidai pattern in the
immediate vicinity of the wake. Assuming that the
changes in magnitude were caused by vortex backscatter-
ing, one sees the vortex effect as an increase or decreasein reflectivity between - 131 and - 102 dBm-l, more typ-
ically between -120 and -110 dBm -1. The following
report is organized into sections on previous related work
at C-band frequencies, the experimental setup, radar cali-
brations, clutter tests, and the C-band analysis. Interest-
ing signal returns and simultaneous airplane tracks
relative to the radar, weather data, and plots of clutter-
variability data are provided in the appendices.
lln Rayleigh scattering, targets, such as raindrops, have well-defined boundaries and are much smaller than the electromagnetic
waves reflected from them. In Bragg scattering, a distributed target,such as turbulent air, reflects electromagnetic waves at half-waveintervals that sum coherently to produce a stronger signal than thereflections from other parts of the target.

2. Background
Since the 1930's, radar meteorologists have studied
clear-air turbulence as a natural, meteorological phenom-
enon (ref. 1). In recent years, some of the theory devel-
oped for meteorology has been applied to the study of
aircraft wake vortices. For example, Tatarski (ref. 2)
related the radar volume reflectivity of turbulent air to
the structure constant and the radar wavelength with the
equation
8 2- -1/3rI(K ) = 0.3 Cnk (1)
where
rl
C 2n
= volume radar reflectivity
= structure constant, a measure of variabilityof refractive index field within inertial
subrange
9_ = radar wavelength, _./2 being included in
inertial subrange
According to Kolmogorov's theory (ref. 3), for2
incompressible, locally isotropic fluids having a suffi-
ciently high Reynolds number, there exists an inertial
subrange of turbulent eddy sizes, defined as those sizesof eddies that break down into smaller eddies with no
loss of kinetic energy. The low end of the inertial sub-range, called the Kolmogorov microscale, is predicted as
Im = (2)
where
Im = Koimogorov microscale
v = kinematic viscosity
E = eddy dissipation rate
Equation (1) has been applied to the estimation of
radar reflectivity of aircraft-induced turbulence. Aircraft-2
wake-vortex-induced C n depends on such aircraft fac-tors as weight, velocity, and wingspan, as well as on such
meteorological factors as temperature (7), pressure (P),
partial pressure of water vapor, and prevailing winds.
Proctor (ref. 5) has adapted his two-dimensional terminal
area simulation system (TASS) to model wake vortices
over time, given initial aircraft and atmospheric condi-
tions. Currently this work is being expanded into a three-
dimensional model. Among the TASS outputs are T, P,
and E. Marshall and Scales (ref. 6) are using the TASS
outputs for various airplanes in varying weather condi-
tions together with Ottersten's theory (ref. 7) and equa-2
tion (1) to predict C n and 11. These estimates will be
2Turbulent airflow on scales of less than 2 km and close to the
ground can be considered incompressible (ref. 4).
2
improved as assumptions are validated with experimental
tests and the vortex atmospheric and radar models arerefined.
The two-dimensional TASS model 3 predicted that a
C-130 in a standard atmosphere with no crosswind
should produce a pair of vortices whose total spatial
extent is 80 m in width by 60 m in height 30 sec after
passage of the airplane. The core radius, that distancefrom one vortex center to the location of highest tangen-
tial velocity for that vortex, was calculated to be 5 m
(ref. 6). Marshall's current work (ref. 6) predicts that the
proper scales of turbulence and, therefore, sufficient
reflectivity should exist at C-band frequencies to allowwake vortex detection.
In the summer of 1990, W. H. Gilson of the
Massachusetts Institute of Technology Lincoln Labora-
tory conducted a series of clear-air wake vortex radar
tests (ref. 8) at Kwajalein Atoll in the Marshall Islands.
The experiment employed seven different radars, one of
which was the ALCOR C-band Doppler radar. ALCOR
transmitted 10-gsec pulses at 3-MW peak power, using a0.3 ° antenna beam. Viewing the wake of a Lockheed
C-5A cargo airplane at a look angle varying between 45 °
and 90 ° from the longitudinal wake axis, ALCOR suc-
cessfully detected and tracked the wake at ranges up to
17 km. From the ALCOR data, the calculated r' of thewake was -125 dBm -1 at 30 km (260 sec) bei::,',d the
C-5A and 1524 m (5000 ft) altitude. The 11 value
decreased 10 dB at 3048 m (10000 ft) altitude and
another 10 dB at 6401 m (21000 ft) altitude.
In early 1991, J. D. Nespor et al. (ref. 9) conductedfurther C-band, clear-air, wake vortex radar tests for
General Electric Company at White Sands Missile
Range, using the Multiple Object Tracking Radar
(MOTR). MOTR is a phased array, pulsed Doppler radar
that, during the tests, transmitted 1-gsec pulses at 1-MW
peak power in a 1° antenna beam. Nespor reported
detecting the wake from a Ling-Temco-Vought A-7
small attack jet, looking along the longitudinal wake axis
behind the airplane at a range of 2.7 km. Nespor calcu-
lated vortex Cn2 values ranging from -135.4 to -116.6
dB. According to equation (1), this calculation would
produce xI values in the range from -135.3 to -116.6dBm -1.
In view of these past experiments, it seemed reason-
able to expect that the Wallops R5 C-band radar woulddetect a C-130 wake at l-km range, using a 0.4 ° antenna
3TASS initialized its wake vortex calculations based on classic
elliptical theory (ref. 5). No provisions were made for aircraft flaps.Some of the initializing assumptions were that initial circulation =340 m2/sec, vortex core radius = 2 m, vortex height = 180 m, andvortex separation = 24 m.
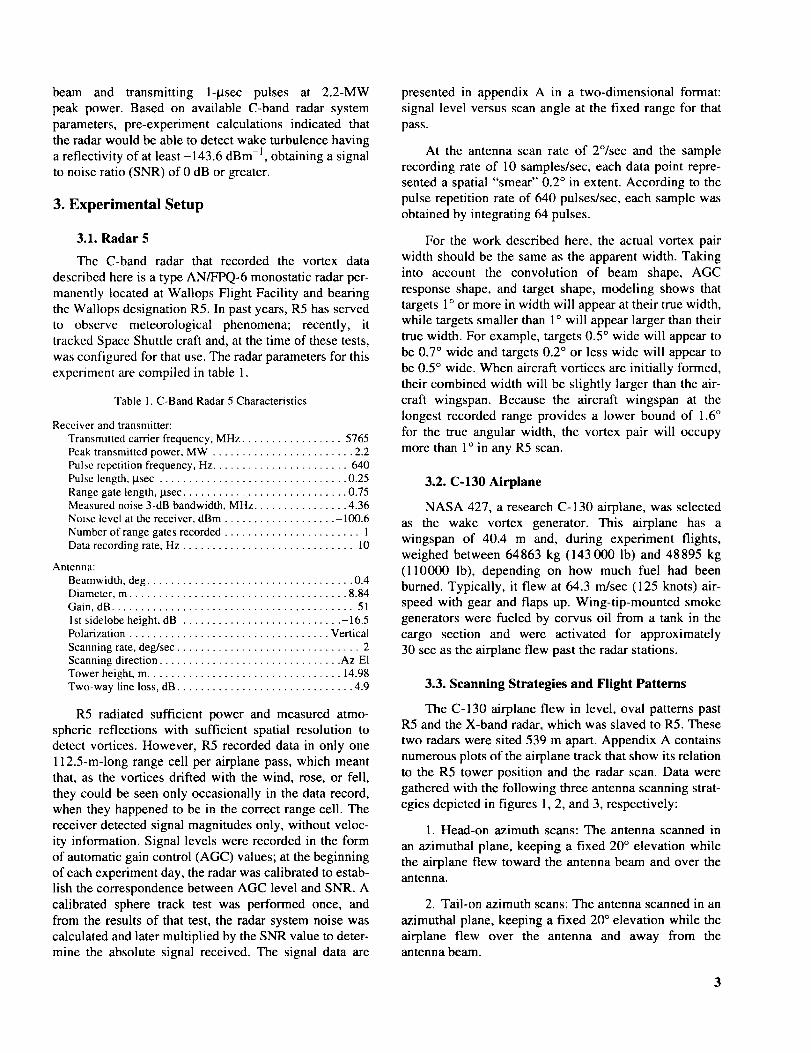
beam and transmittingl-ktsecpulsesat 2.2-MWpeakpower.Basedon available C-band radar system
parameters, pre-experiment calculations indicated that
the radar would be able to detect wake turbulence having
a reflectivity of at least -143.6 dBm -1, obtaining a signal
to noise ratio (SNR) of 0 dB or greater.
3. Experimental Setup
3.1. Radar 5
The C-band radar that recorded the vortex data
described here is a type AN/FPQ-6 monostatic radar per-
manently located at Wallops Flight Facility and bearing
the Wallops designation R5. In past years, R5 has served
to observe meteorological phenomena; recently, it
tracked Spacc Shuttle craft and, at the time of these tests,
was configured for that use. The radar parameters for this
expcriment are compiled in table 1.
Table 1. C-Band Radar 5 Characteristics
Receiver and transmitter:Transmitted carrier frequency, MHz ................. 5765Peak transmitted power, MW ........................ 2.2Pulsc repetition frequency, Hz....................... 640Pulse length, ktsec ................................ 0.25Range gate length, lasec ............................ 0.75Measured noise 3-dB bandwidth, MHz ................ 4.36Noise level at the receiver, dBm ................... -100.6Number of range gates recorded ....................... 1Data recording rate, Hz ............................. 10
Antenna:
Beamwidth, deg ................................... 0.4Diameter, m ..................................... 8.84Gain, dB ......................................... 511st sidelobe height, dB ........................... - 16.5Polarization .................................. VerticalScanning rate, deg/sec ............................... 2Scanning direction ............................... Az-EITower height, m ................................. 14.98Two-way line loss, dB .............................. 4.9
R5 radiated sufficient power and measured atmo-
spheric reflections with sufficient spatial resolution todetect vortices. However, R5 recorded data in only one
112.5-m-long range cell per airplane pass, which meant
that, as the vortices drifted with the wind, rose, or fell,
they could be seen only occasionally in the data record,
when they happened to be in the correct range cell. The
receiver detected signal magnitudes only, without veloc-
ity information. Signal levels were recorded in the form
of automatic gain control (AGC) values; at the beginning
of each experiment day, the radar was calibrated to estab-
lish the correspondence between AGC level and SNR. A
calibrated sphere track test was performed once, and
from the results of that test, the radar system noise was
calculated and later multiplied by the SNR value to deter-
mine the absolute signal received. The signal data are
presented in appendix A in a two-dimensional format:
signal level versus scan angle at the fixed range for that
pass.
At the antenna scan rate of 2°/sec and the sample
recording rate of 10 samples/sec, each data point repre-
sented a spatial "smear" 0.2 ° in extent. According to the
pulse repetition rate of 640 pulses/sec, each sample was
obtained by integrating 64 pulses.
For the work described here, the actual vortex pair
width should be the same as the apparent width. Taking
into account the convolution of beam shape, AGC
response shape, and target shape, modeling shows that
targets I ° or more in width will appear at their true width,
while targets smaller than 1° will appear larger than their
true width. For example, targets 0.5 ° wide will appear to
be 0.7 ° wide and targets 0.2 ° or less wide will appear to
be 0.5 ° wide. When aircraft vortices are initially formed,
their combined width will be slightly larger than the air-craft wingspan. Because the aircraft wingspan at the
longest recorded range provides a lower bound of 1.6 °
for the true angular width, the vortex pair will occupy
more than 1° in any R5 scan.
3.2. C-130 Airplane
NASA 427, a research C-130 airplane, was selected
as the wake vortex generator. This airplane has a
wingspan of 40.4 m and, during experiment flights,
weighed between 64863 kg (143 000 Ib) and 48895 kg
(110000 lb), depending on how much fuel had been
burned. Typically, it flew at 64.3 m/sec (125 knots) air-
speed with gear and flaps up. Wing-tip-mounted smokegenerators were fueled by corvus oil from a tank in the
cargo section and were activated for approximately
30 sec as the airplane flew past the radar stations.
3.3. Scanning Strategies and Flight Patterns
The C-130 airplane flew in level, oval patterns pastR5 and the X-band radar, which was slaved to R5. These
two radars were sited 539 m apart. Appendix A contains
numerous plots of the airplane track that show its relation
to the R5 tower position and the radar scan. Data were
gathered with the following three antenna scanning strat-
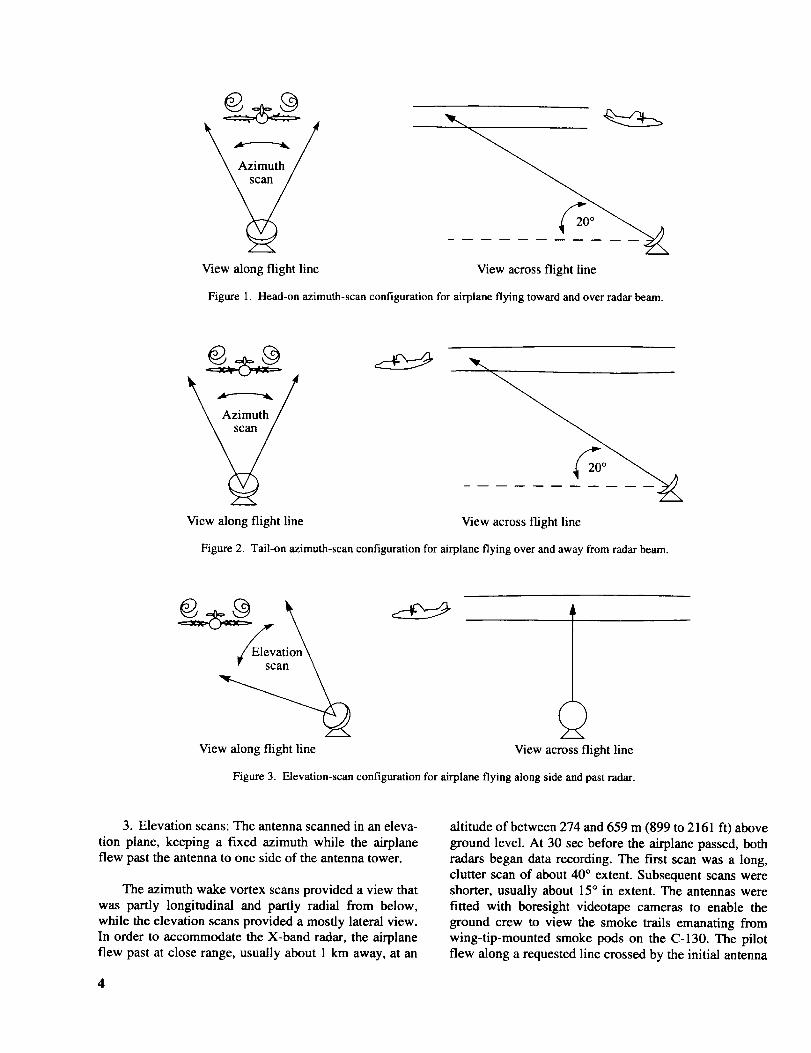
egies depicted in figures 1, 2, and 3, respectively:
1. Head-on azimuth scans: The antenna scanned in
an azimuthal plane, keeping a fixed 20 ° elevation while
the airplane flew toward the antenna beam and over theantenna.
2. Tail-on azimuth scans: The antenna scanned in an
azimuthal plane, keeping a fixed 20 ° elevation while the
airplane flew over the antenna and away from theantenna beam.
View along flight line View across flight line
Figure 1. Head-on azimuth-scan configuration for airplane flying toward and over radar beam.
View along flight line View across flight line
Figure 2. Tail-on azimuth-scan configuration for airplane flying over and away from radar beam.
__Elev_Ele_ ation \
View along flight line View across flight line
Figure 3. Elevation-scan configuration for airplane flying along side and past radar.
3. Elevation scans: The antenna scanned in an eleva-
tion plane, keeping a fixed azimuth while the airplaneflew past the antenna to one side of the antenna tower.
The azimuth wake vortex scans provided a view that
was partly longitudinal and partly radial from below,
while the elevation scans provided a mostly lateral view.In order to accommodate the X-band radar, the airplane
flew past at close range, usually about 1 km away, at an
altitude of between 274 and 659 m (899 to 2161 ft) above
ground level. At 30 sec before the airplane passed, both
radars began data recording. The first scan was a long,
clutter scan of about 40 ° extent. Subsequent scans wereshorter, usually about 15° in extent. The antennas were
fitted with boresight videotape cameras to enable the
ground crew to view the smoke trails emanating from
wing-tip-mounted smoke pods on the C-130. The pilotflew along a requested line crossed by the initial antenna

scan;the R5 antennaoperatoradjustedthe scanningthroughouttheradarrecordingto continuecrossingthesmoketrailsastheydriftedacrossthesky.Datarecord-ingcontinueduntil2minaftertheairplanehadpassed.
At thesametimeastheweatherradarswererecord-ingthevortices,aC-bandtrackingradarwasrecordingthepositionof theairplane.UsuallythetrackingradarwasRI0,whichwaslocatedbetweenR5andtheX-bandradar.Theproximityof thetrackingradarto theflightlineresultedintheoccasionaltemporarylossoftheradarfix on theairplaneasit flewoverR10.OnoccasionswhenthemoredistanttrackingradarR18wasemployed,thetrackswereuninterrupted.
3.4. Weather and Local Geography
The vortex data presented here were recordedbetween January 5 and January 11, 1995. On these days,
the sky was blue and sunny, and light winds prevailed.Meteorological data, including temperature, pressure,
water vapor mixing ratio, and wind speed, were collected
every 2 hr. Those data recorded at the times closest to the
vortex radar data are presented in appendix B for an alti-
tude (400 m above ground level) that is representative of
the airplane passes.
The terrain of the Wallops Flight Facility, which
borders on the Atlantic Ocean, is fiat and very marshy. A
map of the area surrounding the radar test site is shown
in figure 4. C-band R5 is situated in a row of radars
which includes tracking Radar 10 and the X-band
radar that operated in conjunction with R5 during the
experiment. This group of radars is about 6 mi south ofthe airfield and tracking Radar 18 (not pictured in the fig-
ure). Within 1 km of the R5 tower, there are grassy
fields, numerous clumps of trees, a body of open waterbetween the mainland and the island, and occasional
metal towers and buildings housing other radar stations.Even in the absence of rain or wake vortices, substantial
variations (up to 18 dBm) were seen over time in thecombined radar reflections from the ground and atmo-
sphere when looking at the same point in space. There
were also signal variations of up to 30 dBm over angular
space from the varying ground clutter at different azi-muths and elevations.
4. Signal Level Calculations
4.1. Recording Lag Correction
Initial studies indicated that there was a consistent
lag between position and signal level recordings made by
R5 when the antenna was scanning. Comparison of the
apparent positions of a strong fixed target as the antenna
scanned upward and downward past it during elevation
scanning at the 2°/sec scan rate led to the deduction that
the recorded position was 0.5 ° "ahead" of the correct
position for the target. This error also occurred during
clockwise and counterclockwise azimuth scanning and
was corrected for by adding or subtracting 0.5 °, as appro-
priate, to the angular position at all recorded data points.
4.2. AGC to SNR Interpolation
Because the direct output of the recording systemwas AGC values, it was necessary to collect calibration
data to establish the relationship between AGC level andSNR. At least once on each experiment day, usually at
the beginning, the radar was calibrated with a series of
test signals from a nearby tower; the signal ranged in
5-dB steps from 0 to 65 dB above the radar noise levelobserved at the receiver. Thirty seconds worth of AGC
data were averaged at each SNR level. In postrecording
processing, SNR levels were determined for everyrecorded AGC data point by linear interpolation between
the appropriate SNR values. In general, most radarreturns lay within the calibrated region of the SNR scale.
The recorded signal level was observed to exceed the
scale only when the airplane was close to the radar and
the recorded range gate was centered at 814 m, one of the
closer recorded ranges.
4.3. Calibrated Sphere Track and NoiseCalculation
On May 1, 1995, a calibrated sphere track test was
performed to provide data for calculating the radar sys-
tem noise seen by the receiver. During the test, R5 wasconfigured in the same way it had been during the wake
vortex recordings. The receiver bandwidth was set at the
nominal value 4.8 MHz, for which the previously mea-sured noise bandwidth had been 4.36 MHz. A metallic
sphere with a radar cross section (RCS) of 0.0182 m 2
(6-in. diameter) was attached to a balloon and released
from the ground. As the balloon and sphere ascended, R5
tracked the sphere until it was 50 km away, recording
AGC level versus range. From these data, SNR versus
range was calculated. At each of three ranges,13.167 km, 26.335 km, and 45.720 kin, noise power was
calculated according to the radar equation
S Pt G2_'2_(3)
N 3 4(4/z) R L2_wayN
5

True North
WallopsIsland
Meteorological tower
Boresight tower
CausewayC-band radar 5
Camera station
Tracking radar 10
Camera station
Spandar radarSTIR antenna
30-see line
Water
Marsh _
Meters
0 1000 2000
I l 1 I I3000 4000
I I I I
Figure 4. Map of experiment site at Wallops Flight Facility, Wallops Island, Virginia. C-band Radar 5 is situated in a row of radars which
include tracking Radar 10 and the X-band radar that operated in conjunction with R5 during the experiment. This group of radars is about6 miles south of the airfield and tracking Radar 18 (not pictured). During azimuth-scan passes, the C-130 flew directly over the radars;during elevation-scan passes, the aircraft flew past the radars as pictured.
6
where
S/N = interpolated SNR
Pt = peak transmitted power
G = antenna gain
_. = radar wavelength
c = RCS
R = range
L2_way = 2-way line losses + atmosphericlosses = 4.9 dB + R - 0.015 dB/krn
The average of the three resulting noise values was
-100.58 dBm. Using B = 4.36 MHz in the equation
N = kTsB (4)
where k = Boltzmann's constant, 1.38 x 10 -23 J/K, one
obtains the resulting noise temperature 1454 K, which is
equivalent to a noise figure of 7.8 dB.
All experimental SNR values were multiplied by the
noise power to obtain the plotted power values seen atthe receiver.
5. Clutter-Only Recordings
Because the nonvortex returns varied so much over
time, it was infeasible to do clutter subtraction with a sin-
gle clutter map; instead, a clutter scan would be neededfor each pass. As used here, the term "clutter" includes
atmospheric and ground returns. It was decided thatsome statistical data on clutter collected in the absence of
aircraft would help in deciding which disturbances in thevortex data sets were the result of vortices. A data collec-
tion time was selected when the weather was clear and
the mean weather conditions were fairly constant. By the
time a clutter-only recording could be done using R5 on
such a day, it was November 28, 1995, 6 months after
the experiment. Several data sets were obtained withdifferent antenna scans, including the following whoseresults are discussed herein:
100 azimuth scans from 10 ° to 50 °, at 20 ° elevation
and 1369-m range
100 elevation scans from 20 ° to 50 °, at 141 ° azimuth
and 1409-m range
The other radar parameters were set, as before, accordingto table 1.
Because the vortex data would be considered on the
basis of signal level differences relative to one initialclutter scan per pass, the clutter itself was characterized
by finding the nonvortex signal level variations over time
at many antenna positions. The clutter signal levels were
calculated in mW and interpolated, together with their
detection times, at regular 0.25 ° intervals. At each angu-
lar position so determined, available pairs of dBm signal
powers and their corresponding detection times were
subtracted to produce sets of signal power difference val-
ues for various time intervals ranging from 2 sec to
8 min. For each set of between 46 and 98 signal power
difference samples representing a given time lag, the
average and standard deviation of all the signal powerdifferences were determined in dBm. A smoothed, abbre-
viated, wire mesh representation of the results is shown
in figures 5 and 6, including lag times up to 3 min, a time
period slightly longer than the flight passes. Tables C2
and C3 in appendix C contain the unsmoothed numerical
results together with the number of samples in each set
used to find the sample standard deviations.
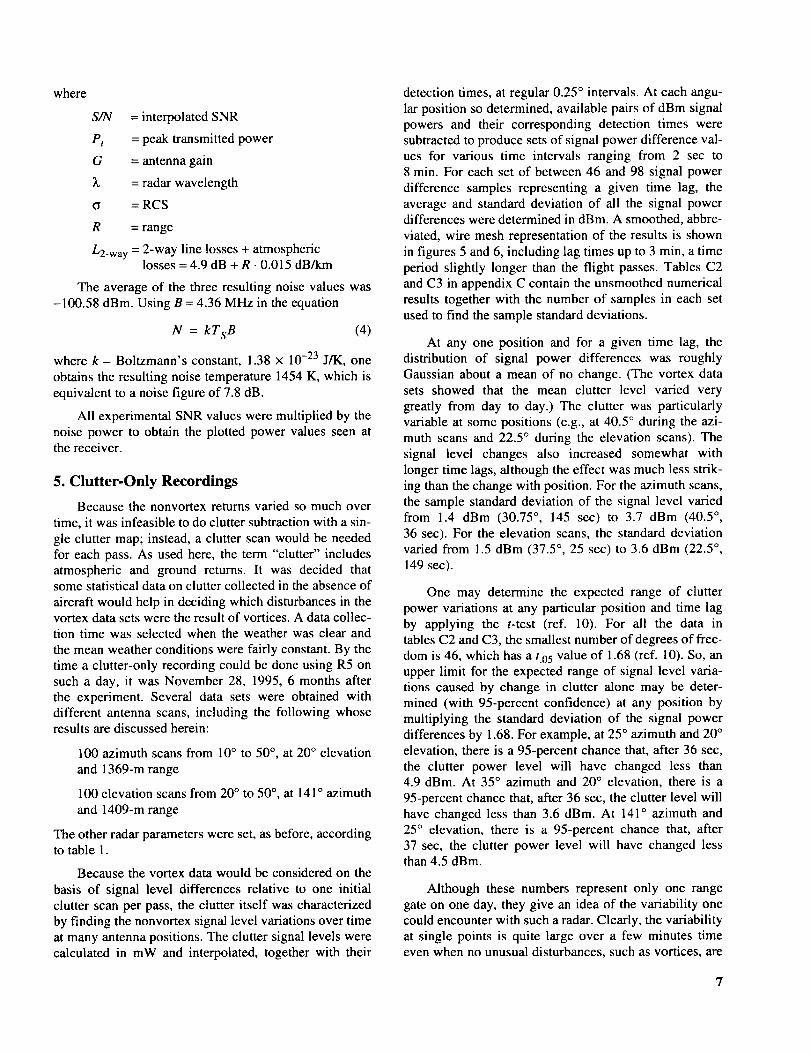
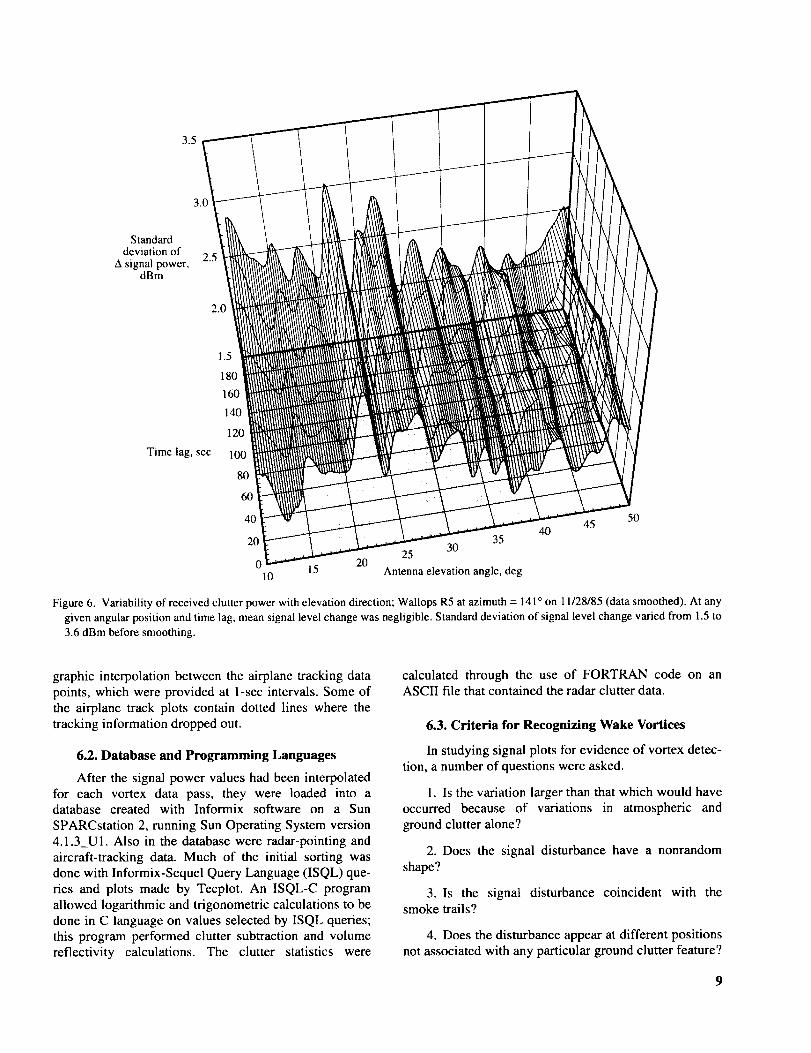
At any one position and for a given time lag, the
distribution of signal power differences was roughly
Gaussian about a mean of no change. (The vortex data
sets showed that the mean clutter level varied very
greatly from day to day.) The clutter was particularly
variable at some positions (e.g., at 40.5 ° during the azi-
muth scans and 22.5 ° during the elevation scans). The
signal level changes also increased somewhat with
longer time lags, although the effect was much less strik-
ing than the change with position. For the azimuth scans,
the sample standard deviation of the signal level variedfrom 1.4 dBm (30.75 ° , 145 sec) to 3.7 dBm (40.5 °,
36 sec). For the elevation scans, the standard deviation
varied from 1.5 dBm (37.5 °, 25 sec) to 3.6 dBm (22.5 °,
149 sec).
One may determine the expected range of clutter
power variations at any particular position and time lag
by applying the t-test (ref. 10). For all the data in
tables C2 and C3, the smallest number of degrees of free-
dom is 46, which has a t.05 value of 1.68 (ref. 10). So, an
upper limit for the expected range of signal level varia-tions caused by change in clutter alone may be deter-
mined (with 95-percent confidence) at any position by
multiplying the standard deviation of the signal power
differences by 1.68. For example, at 25 ° azimuth and 20 °
elevation, there is a 95-percent chance that, after 36 sec,
the clutter power level will have changed less than4.9 dBm. At 35 ° azimuth and 20 ° elevation, there is a
95-percent chance that, after 36 sec, the clutter level will
have changed less than 3.6 dBm. At 141 ° azimuth and25 ° elevation, there is a 95-percent chance that, after
37 sec, the clutter power level will have changed lessthan 4.5 dBm.
Although these numbers represent only one range
gate on one day, they give an idea of the variability onecould encounter with such a radar. Clearly, the variability
at single points is quite large over a few minutes timeeven when no unusual disturbances, such as vortices, are
7

Standarddeviation of 2.5
A signal power,dBm
1.5
180
160
140
120
Time lag, sec 100
80
6O
40
20 3530
250 15 20
10 Antenna azimuth angle, deg
4045 50
Figure 5. Variability of received clutter power with azimuth direction; Wallops R5 elevation = 20 ° on 11/28/95 (data smoothed). At anygiven angular position and time lag, mean signal level change was negligible. Standard deviation of signal level change varied from 1.4 to3.7 dBm before smoothing.
encountered. As it turned out, the signal level changes
caused by vortices were often of the same order of mag-
nitude as the changes from unknown causes. For this rea-
son, it was decided to search for vortex patterns extended
over space, rather than for fluctuations at individual
points.
6. Vortex Data Analysis Method
6.1. Selection of Passes
Out of the 209 airplane passes for which azimuth-
scan or elevation-scan R5 recordings were available,
13 azimuth-scan passes and 10 elevation-scan passeswere chosen for detailed analysis for possible wake vor-
tex detection. Staring-mode passes were ignored because
vortex detection would be enabled by the signal level
contrasts seen spatially, as well as temporally, in
8
scanning mode. Where concurrent airplane tracking datawere available, flight paths of the C-130 were examined
in conjunction with the R5 scans to select passes where
the recorded volume was initially within about 50 m of
the airplane wake, in any direction. The passes were
further screened for proper functioning of the airplane
wing-tip smokers and availability of videotapes that
showed the smoke trails. Finally, it was desired, for eachpass, to have an initial clutter scan recorded at the same
positions as the vortex data of interest. Data from the 23
passes that met these criteria are shown in appendix A.
Appendix A contains one plot per pass of the air-
plane track and the radar range cell track across the
ground. At the top of the corresponding radar data plots
is additional information, such as radar range, airplane
altitude, and the time when the airplane flew over the
range cell track. This intersection was determined by
Standarddeviationof 2.5
A signal power,dBm
1.5
180
160
140
120
Time lag, sec 100
80
60
4G
3520 30
250 15 20
10 Antenna elevation angle, deg
4045 50
Figure 6. Variability of received clutter power with elevation direction; Wallops R5 at azimuth = 141° on 11/28/85 (data smoothed). At anygiven angular position and time lag, mean signal level change was negligible. Standard deviation of signal level change varied from 1.5 to3.6 dBm before smoothing.
graphic interpolation between the airplane tracking data
points, which were provided at l-sec intervals. Some of
the airplane track plots contain dotted lines where the
tracking information dropped out.
6.2. Database and Programming Languages
After the signal power values had been interpolatedfor each vortex data pass, they were loaded into adatabase created with Informix software on a Sun
SPARCstation 2, running Sun Operating System version
4.1.3_U1. Also in the database were radar-pointing and
aircraft-tracking data. Much of the initial sorting was
done with Informix-Sequel Query Language (ISQL) que-
ries and plots made by Tccplot. An ISQL-C program
allowed logarithmic and trigonometric calculations to be
done in C language on values selected by ISQL queries;
this program performed clutter subtraction and volume
reflectivity calculations. The clutter statistics were
calculated through the use of FORTRAN code on anASCII file that contained the radar clutter data.
6.3. Criteria for Recognizing Wake Vortices
In studying signal plots for evidence of vortex detec-
tion, a number of questions were asked.
1. Is the variation larger than that which would haveoccurred because of variations in atmospheric and
ground clutter alone?
2. Does the signal disturbance have a nonrandom
shape?
3. Is the signal disturbance coincident with thesmoke trails?
4. Does the disturbance appear at different positions
not associated with any particular ground clutter feature?
9

5. Doesthesignaldisturbance appear at different
times not tied to any particular position of the airplane?
6. Is the indicated physical size of the vortexreasonable?
7. Is the implied volume reflectivity of the vortex in
keeping with previous observations?
In the end, the answers to these questions were "not
necessarily" to the first question and "yes" to the others.
Because the clutter variability was so large and it was notknown in advance what a vortex would look like, the
vortex search was carried out visually by inspection of
signal level plots and videotapes of the smoke trails. Pos-
sible sideiobe detection of the airplane was a major con-
cern, so plots of the position of the airplane have been
included in this report with notations to show where the
airplane was at times of interest in the radar recordings.
6.4. Clutter Subtraction
In each vortex data pass, one antenna scan was des-
ignated as the clutter scan. This clutter scan was recorded
less than a minute before the passage of the airplane and
included those positions of interest during the rest of the
pass. In order to detect changes possibly caused by wake
vortices, the received signal levels in succeeding scans
were compared to the signal levels at the same positionsin the clutter scan. Both increases and decreases in signal
level were noted in the vicinity of the vortices.
6.5. Volume Reflectivity
Where deviations in signal level from the clutter
level were found, the change in reflectivity was calcu-lated as
[AS] (4_) 3R4L2-wayAq = (5)
PtG2_, 2V
where
Aq = change in volume reflectivity, RCS/volume 4
AS = change in received signal power
V = range cell volume
For R in the near field (less than 1266 m), the range
cell volume was calculated as that of a cylinder of diame-
ter equal to the antenna, so that
ltD2c'_ 3V - - 6905 m (6)
8
41n this report, rI is expressed in units of dB m-I . Another com-mon form of the unit is dB s m/rn 3.
10
where
D = antenna diameter
c = speed of light
x = range gate length
For R in the far field (greater than or equal to
1266 m), the volume was calculated as that of a conicsection, so that
_0 2 3 3
V = --_-(gfa r - gnear ) (7)
where
0 = 3-dB beamwidth (radians)
Rfa r = range at far edge of range cell
Rnear = range at near edge of range cell
During the majority of R5 vortex recordings, thevalue of V was the near-field value, 6905 m3; for the
entire experiment, the maximum value of V was8885 m 3. For the purpose of reflectivity calculation, it
was assumed that the vortices would fill one range cell.
For any one calculation, it was not known how much of
the radar range cell would be filled by the wake vortices;
however, it was expected that early in each pass record-
ing the range cell would be partly filled, while later in
that recording the range cell would be completely filled.
Therefore, Arl may at times be underestimated. The value
A11 has been calculated from the magnitude of the signal
change so that it is always a positive number ofm -1 and
can be expressed logarithmically. Because Ar I is lessthan 1 m -1, it is always a negative number of dBm -1.
However, one may deduce from the signal plots whetherthe reflectivity has increased or decreased, according to
whether the vortex-plus-clutter scan lies above or belowthe clutter scan.
7. Vortex Data Analysis Results
7.1. Data Plot Description
The vortex data analysis results are presented in
appendix A in the form of signal level plots and tracking
data plots. The plots are presented in order of airplane
pass numbers, which were assigned chronologically
throughout the testing.
For each pass included in this report, two or moreantenna scans of interest have been selected. Because
absolute signal power has been plotted, SNR may be
calculated at any point by adding 100.58 dB to the dBm
signal power value. Where the boresight videotape indi-
cated that the radar beam was crossing the smoke trails,
portions of the vortex-plus-clutter scans on or between
the two smoke trails of the airplane are represented as
solidcircles.In a fewcases,thesmokepositionis notmarkedbecausetherewasnovideotapeavailableshow-ingwhentheantennaboresightcrossedthesmoketrails.Placesofinterestareidentifiedwithanarrowpointingtoaparticulardatapoint;thetimeof day(hours,minutes,seconds)andchangein reflectivityaregivenforthatdatapoint.
In thetrackingdataplots,theaxesaremarkedindegreesof latitudeandlongitudeasif theywererectan-gularcoordinates,withthescalingdonesothatdegreesof latitudearethecorrect"length"relativeto degreeslongitudeforthatlocationin thecenterofthe"map."Thedirectionof flightof theairplanearoundits loop,indi-catedby an arrow,wascounterclockwiseexceptforpasses52,54,56,and64.Thetimesof interestmarkedonthesignallevelplotsarealsomarkedalongtheair-planetracks.Thedistancebetweenany twopointsinkilometersmaybeestimatedbyconvertingeach0.01oofthe distancemarkedoff alongthe latitudeaxis to1.11km.
7.2. Screening for Airplane Detection
It seemed quite possible that the airplane might inter-
fere with vortex detection by creating an extra unpredict-
able sidelobe target in the clutter scan or in the vortex-
plus-clutter scans. With this problem in mind, 10 head-on
and 10 tail-on clutter scans were compared to see if they
displayed substantially different features. Passes 99,
100, 103, and 104 were head-on passes recorded atR = 1364 m. Passes 106, 107, 108, 109, 117, and 118
were head-on passes recorded at R = 1111 m. Passes 51,
52, 54, 122, and 123 were tail-on passes recorded at R =1366 m. Passes 56, 60, 61, 64, and 127 were tail-on
passes recorded at R = 1110 m. Comparison of head-onand tail-on clutter scans recorded on the same day at the
same range revealed no obvious distinction in the fea-
tures. Therefore, it appeared that proximity of the air-
plane was not affecting the clutter scans. Because there
were very few days when good head-on and tail-on clut-
ter scans were both available for comparison, it was not
possible to establish a firm conclusion. It appeared thatthe date was much more important than the direction of
flight in determining the clutter signal levels. At the same
range, clutter recordings made on different days varied as
much as 18 dB in amplitude but showed similar features
(i.e., peaks at the same pointing angles). Of course, there
was a very noticeable difference both in the signal level
and in the general shape of clutter scans recorded at dif-
ferent ranges on the same day.
7.3. Evidence of Vortex Detection
The most convincing evidence of vortex detection
lay in passes where a signal disturbance could be seen
coincident with the smoke in several succeeding scans.
Such passes were 52, 54, 99, 100, 103, 104, 107, 108,117, 122, 123, 132, 137, and 141, which included both
azimuth-scan and elevation-scan passes. In the azimuth-
scan passes, the coincidence of the vortex signature withthe smoke trails as they drifted across the scan during the
pass indicated that the signal disturbance was not the
effect of ground clutter. At places of interest, the signal
disturbance represented a target of spatial extent consid-
erably more than the 0.5 ° resolution, the disturbance usu-
ally being between 100 and 150 m wide. This size is
consistent with the TASS-modeled vortex pair width of
80 m at 30 sec, assuming further expansion of the vorti-
ces after 30 sec. One may estimate the width of any fea-
ture in the scans as 2R tan(a/2), where ct is the angularextent of the feature.
The single-range-cell recording allowed a curved
strip image 112.5 m in depth, rather than a plan view pic-ture, to be created. Even if this strip passed through a
vortex, it did not show what was happening on all sides
of the vortex. Another difficulty was that, during the
recording, the vortices, as indicated by smoke trails, were
twisting around in the sky and could not be expected toform a neat radar image at all times. However, visual
inspection of many data plots often revealed a character-
istic sinusoidal pattern of the vortex-plus-clutter scan
about the clutter scan in the vicinity of the smoke trails.
Good examples of this shape may be seen in azimuth
scans, such as pass 56, scan 8; pass 100, scan 12;
pass 107, scans 5 and 22; pass 117, scan 19; pass 122,
scan 11; and pass 123, scan 4. Longer scans sometimes
showed a volume of increased reflectivity bounded by
two volumes of decreased reflectivity. In volumes of
increased reflectivity, the vortex-plus-clutter to noise
ratio was typically between 20 and 41 dB, while the vor-tex to clutter ratio was between 0.1 and 7.9 dB.
In these scans, the smoke trail was sometimes in the
portion of the scan where there was an increase in reflec-
tivity and sometimes in the portion showing a decrease in
reflectivity. The changes in reflectivity in either directionvaried from -131 to -102 dBm -|. The smoke trails fre-
quently remained quite close together, the distance
across both trails spanning as little as 40 or 50 m, which
is about the same as the expected initial distance acrossboth vortices from a C-130. This could mean either that
the vortices did not expand but did influence the reflec-
tivity of the air mass surrounding them or, more likely,that the vortex system expanded outside the smoke trails.
In the absence of a more complete spatial representation
or velocity information, it is not possible to say which
parts of the vortex system produced elevations in reflec-
tivity. In any case, it is safe to say that the smoke alone
did not change the reflectivity of the air.
11
Thetimelagsbetweenthepassageof theairplaneandtheexamplesofvortexdetectionshowninthisreportvaryfrom10.4to 120.1sec.Becausesignaldisturbanceswereseencoincidentwiththesmokeandirrespectiveofthepositionof theairplane,it isunlikelythatthedistur-banceswereinstancesof airplanedetection.
7.4. Clutter Limitations to Vortex Detection
In addition to signal level fluctuations in the vicinity
of the smoke trails, there were often equally large signalchanges in other regions of the scan. Sometimes, as in
pass 52, a nonrandom signal disturbance was noted, but
the vortex-plus-clutter scan power level never increasedabove the clutter scan power level. This clutter level fluc-tuation would make it difficult to write an automated
detection algorithm on the basis of signal magnitudes
alone, unless the clutter could be substantially reduced.
Currently, no evidence of vortex detection has been
found in the X-band data sets recorded at Wallops
concurrently with the R5 data. This result is thought to be
caused by the high sidelobe clutter power recorded bythat system.
8. Concluding Remarks and Recommendations
This study confirms the work of previous researchers
who reported that wake vortices could be detected with
C-band radars in clear air. Although the measured
vortex-induced changes in received signal level were
often similar to the expected clutter variation at individ-
ual points, the experimental data are convincing evidence
of wake detection because the signal level changed in anonrandom pattern at the locations of the smoke trails.
The wake was detected numerous times at a variety ofpositions relative to the airplane and radar, the calculated
size and increased reflectivity of the wake lying within
the ranges expected from previous experiments and
modeling.
To reiterate the essential characteristics of the radar,
R5 transmitted 2.2 MW and integrated over 64 pulses,recording noise at -100.58 dBm and vortex-plus-clutter
signals at 20 to 41 dB above the noise level. The results
of the research reported herein indicate that, by reducing
the receiver noise level and increasing the number of
pulses integrated, it should be possible to detect vortices
at the same range (1364 m) using much less power. For
example, the theoretical Swerling Case 1 target requires
a signal to noise ratio (SNR) of 7.2 dB for a probability
of detection of 0.9 and probability of false alarm of 10 -4
when 64 pulses are integrated. If 256 pulses are inte-
grated, the required SNR decreases to 3.8 dB, an
improvement of 3.4 dB. By reducing the receiver noise
by 8 dB and increasing the integration improvement fac-
tor by 3.4 dB, it should be possible to reduce the trans-
mitted power 27.6 dB to 3.8 kW and still obtain a SNR of3.8 dB.
Portions of the structure of the vortex system were
revealed by the limited recording of one range cell. It
appeared that there was a central volume of heightened
atmospheric reflectivity, with volumes of lessened atmo-
spheric reflectivity on each side. At present, it is not
known why some parts of the vortices in this experiment
showed decreased reflectivity. Although the vortex-plus-
clutter signals were visible above the clutter signals, it
would be of great value to reduce the proportion of
ground clutter level in the received signal by antenna
modification or pointing. This would make the patternsmore predictable, heighten the contrast between vortex
and nonvortex information, and improve the probabilityof vortex detection at low elevations. Detection of vorti-
ces by magnitude information alone required pattern rec-
ognition and a clutter map recorded as soon as possible
before the vortex recording.
For future work toward Reduced Spacing Operation/
Terminal Area Activity (RSO/TAP) program goals,
Doppler processing is undoubtedly necessary to sort out
clutter targets with confidence, to identify various parts
of the vortex system, and to quantify the hazard to
airplanes in terms derived from wind velocities. Spatial
resolution will have to be improved over the R5 systemso that the sample volumes are smaller than individual
vortices, on the order of 5 m in diameter. Keeping theprevious numerical example, the needed improvement in
resolution would be 13 dB, which could be achieved by
pulse compression and would require increasing the
transmitted power once again. Ultimately, a three-
dimensional target representation will be needed to
locate and track vortices from origin through decay; this
information must be obtained by scanning in both azi-
muth and elevation and by recording data from a range ofdistances.
NASA Langley Research CenterHampton, VA 23681-2199July 16, 1997
12
Appendix A
Signal Level Plots and Track Plots
This appendix presents the vortex data analysis results in the form of signal level plots and tracking data plots,
ordered according to pass numbers. Note that, above each signal level plot, text labels give additional R5 pointing infor-
mation and the time and airplane position when the airplane crossed the R5 recorded range cell track. All angles are
given relative to R5; times are given in coordinated universal time (UTC) code; altitude is given above ground level
(AGL).
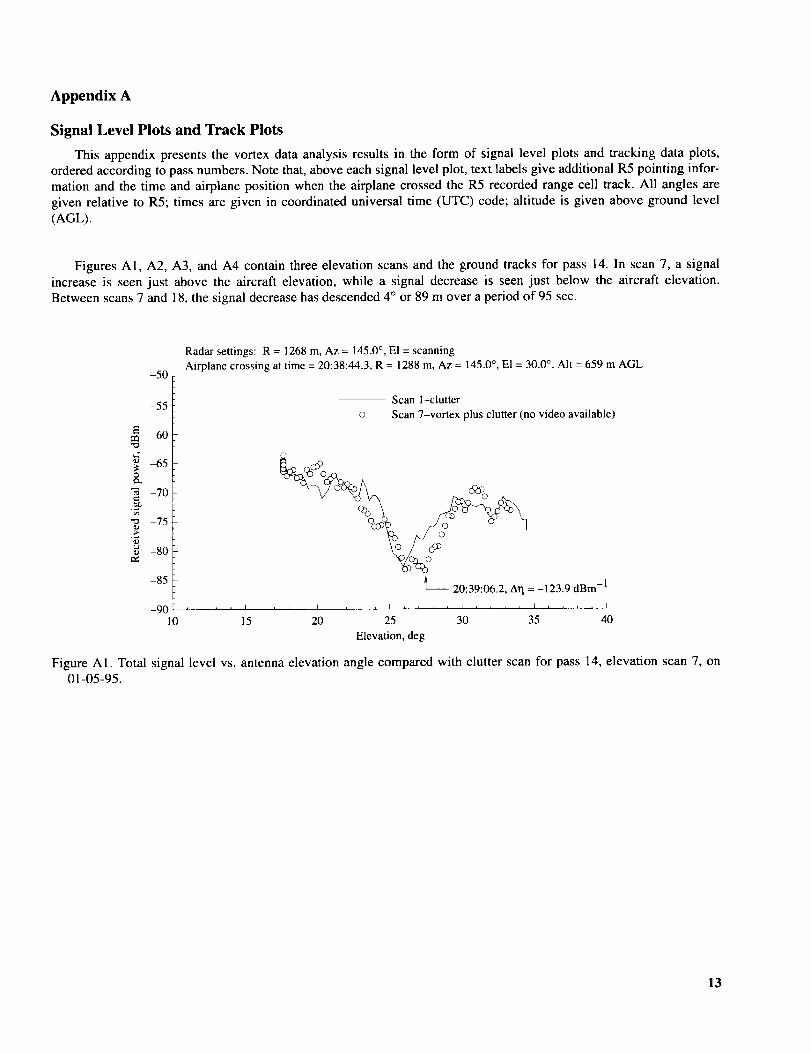
Figures A1, A2, A3, and A4 contain three elevation scans and the ground tracks for pass 14. In scan 7, a signal
increase is seen just above the aircraft elevation, while a signal decrease is seen just below the aircraft elevation.
Between scans 7 and 18, the signal decrease has descended 4 ° or 89 m over a period of 95 sec.
-5o
Radar settings: R = 1268 m, Az = 145.0 °, El = scanning
Airplane crossing at time = 20:38:44.3, R = 1288 m, Az = 145.0 °, El = 30.0 °, Alt -- 659 m AGL
E
_D,v
-55
_50
_55
-70
-75
-80
-85
-9010
©
Scan l--clutter
Scan 7-vortex plus clutter (no video available)
I I
15 20
_-- 20:39:06.2, Arl = -123.9 dBm -1
, h _ L [ I I I
25 30 35 40
Elevation, deg
Figure A1. Total signal level vs. antenna elevation angle compared with clutter scan for pass t4, elevation scan 7, on
01-05-95.
13

E
e-
-50
-55
-60
-65
-70
-75
-80
-85
-9010
Radar settings: R = 1268 m, Az = 145.0 °, El = scanning
Airplane crossing at time = 20:38:44.3, R = 1288 m, Az = 145.0 °, El = 30.0 °, Alt = 659 m AGL
-- Scan 1--clutter
Scan 14-vortex plus clutter (no video available)
I A t i i i _ I i i
15 25
Elevation, deg
L 20:40:08.1, Arl = -123.1 dBm -1
20 30 35 40
Figure A2. As for figure A1, except for elevation scan 14.
E
oe_
"d
-50
-55
--60
-65
-70
-75
-80
-85
-9010
Radar settings: R = 1268 m, Az = 145.0 °, El = scanning
Airplane crossing at time = 20:38:44.3, R = 1288 m, Az = 145.0 °, E1 = 30.0 °, Alt = 659 m AGL
-- Scan 1-clutter
Scan 18-vortex plus clutter (no video available)
A
20:40:41.5, A'q = -115.8 dBm -1 _ °5_
I i _ i i t i _ L J I i _ i i I _ i i i I i i J _ I
15 20 25 30 35 40
Elevation, deg
Figure A3. As for figure A1, except for elevation scan 18.
14
-75.46
-75.48
,_ -75.50
g -75.52,.d
-75.54
-75.5637.94
North
20:40:08.0 _ Airplane track
c_ R5 range cell tracko R5 radar
U-...<°
v
37.92 37.90 37.88 37.86 37.84 37.82 37.80
Latitude, deg
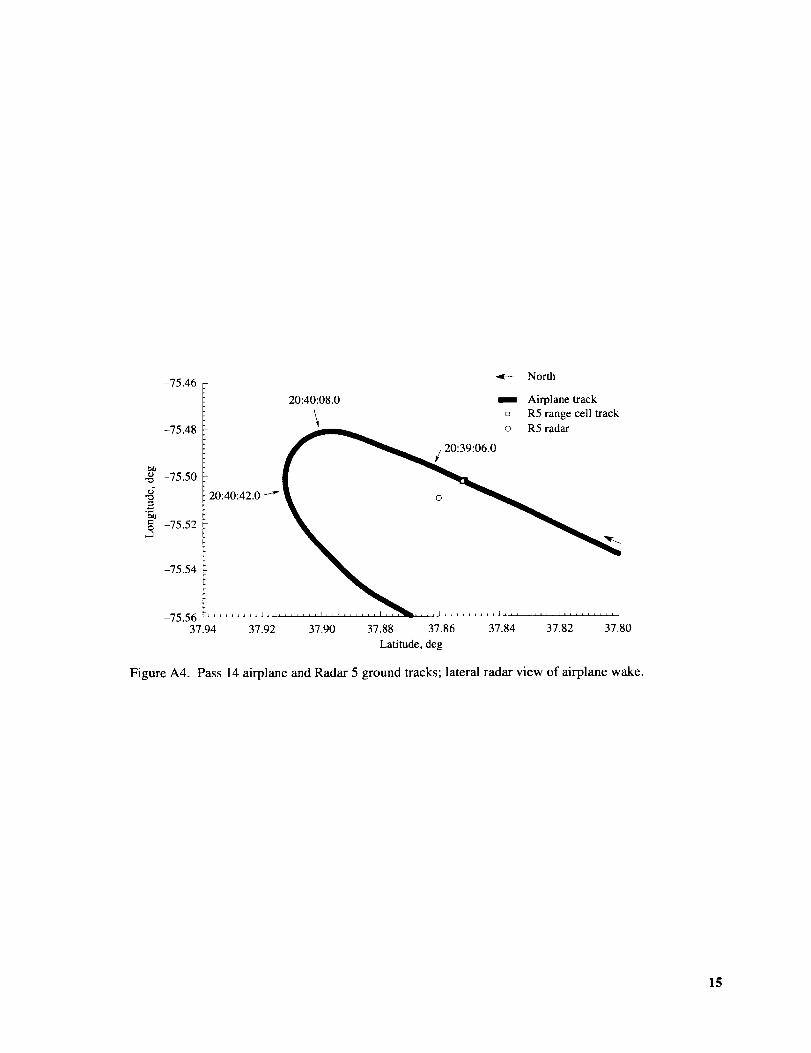
Figure A4. Pass 14 airplane and Radar 5 ground tracks; lateral radar view of airplane wake.
15
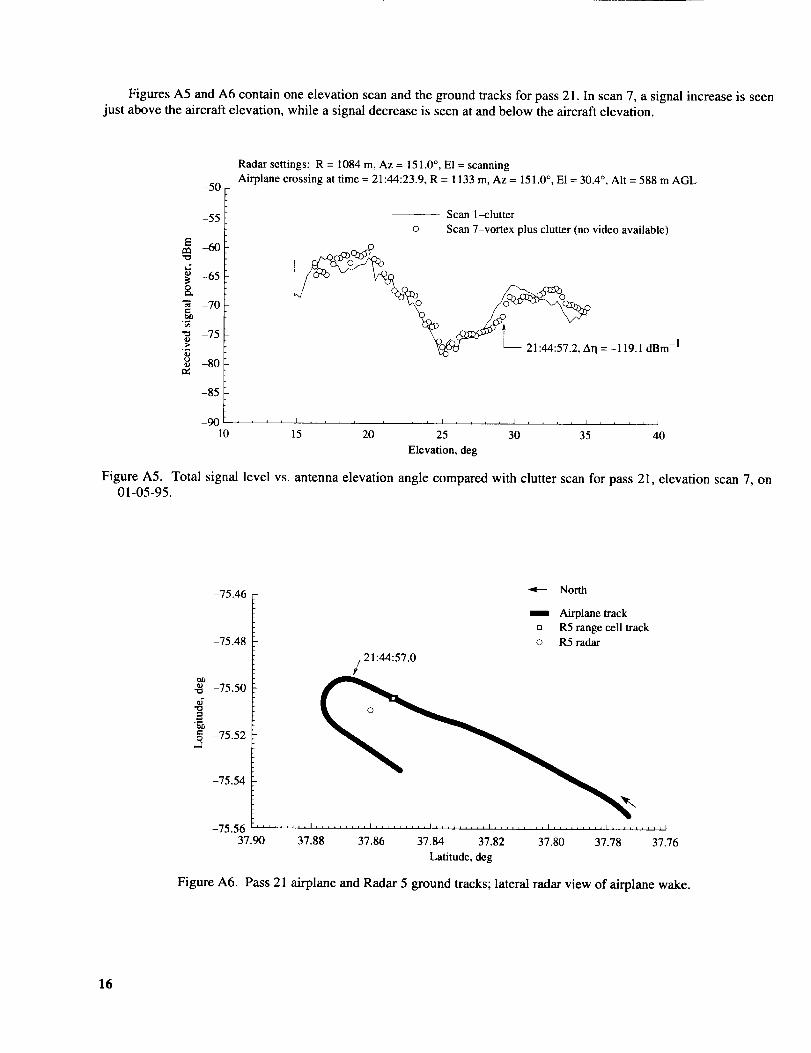
Figures A5 and A6 contain one elevation scan and the ground tracks for pass 21. In scan 7, a signal increase is seen
just above the aircraft elevation, while a signal decrease is seen at and below the aircraft elevation.
-50
Radar settings: R = 1084 m, Az = 151.0 °, E1 = scanning
Airplane crossing at time = 21:44:23.9, R = 1133 m, Az = 151.0 °, E1 = 30.4 °, AIt = 588 m AGL
E
i..7
&
¢-
8r_
-55
-60
-65
-70
-75
-80
-85
-9010
Scan 1-clutter
o Scan 7-vortex plus clutter (no video available)
°___ "_ _:_Zq = -119.1 dBm -1
I I I I I , J , J I
15 20 25 30 35 40
Elevation, deg
Figure A5. Total signal level vs. antenna elevation angle compared with clutter scan for pass 21, elevation scan 7, on
01-05-95.
-75.46
-75.48
._ -75.50
2
_ -75.52
-75.54
-75.56
Figure A6.
/ 21:44:57.0
North
Airplane track
[] R5 range cell track
o R5 radar
,,, ...... l,,,x,,,*,l, ........ I,,,*,,,*,I ......... I,,***,,,,I ......... I
37.90 37.88 37.86 37.84 37.82 37.80 37.78 37.76
Latitude, deg
Pass 21 airplane and Radar 5 ground tracks; lateral radar view of airplane wake.
16

Figures A7, A8, and A9 contain two azimuth scans and the ground tracks for pass 52. During this pass, the signal
level was generally higher during the clutter scan than during any of the succeeding scans, implying possible contamina-
tion by the aircraft. Nevertheless, some local variation is visible around the smoke trails in scans 10 and 14; the contrast
between high and low points is more marked than in the clutter scan.
O
"5
e_
-5O
-55-60
_55
-70
-75
-80
-85
_90 J i i
15
Radar settings: R = 1366 m, Az = scanning, El = 20.0°Airplane crossing at time = 19:48:37.1, R = 1359 m, Az = 33.0 °, El = 19.4°, Alt = 467 m AGL
-- Scan 1-clutter
o Scan 10-vortex plus clutter. Scan 10-vortex plus clutter with smoke
.... - 108.0 dBm-
i I J i i , _ , , k i I i i , i I L L i i i I
20 25 30 35 40 45
Azimuth, deg
Figure A7. Total signal level vs. antenna azimuth angle compared with clutter scan for pass 52, azimuth scan 10, on01-09-95.
E
e_
"5
-50
-55
-60
-65
-70
-75
-80
-85
-9015
Radar settings: R = 1366 m, Az = scanning, El = 20.0 °
Airplane crossing at time = 19:48:37.1, R = 1359 m, Az = 33.0 °, El = 19.4 °, AIt = 467 m AGL
-- Scan l-clutter
Scan 14-vortex plus clutterScan 14-vortex plus clutter with smoke
_°_ _ 19:49:32.4, Arl = -107.9 dBm -1
20 25 30 35 40 45
Azimuth, deg
\
Figure A8. As for figure A7, except for azimuth scan 14.
17

-75.5637.92
19:49:32.0
19:49:22.0
Airplane track
D R5 range cell tracko R5 radar
37.90 37.88 37.86 37.84 37.82 37.80 37.78
Latitude, deg
Figure A9. Pass 52 airplane and Radar 5 ground tracks; tail-on radar view of airplane wake.
18

Figures AI0, A11, A12, and A13 contain three azimuth scans and the ground tracks for pass 54. In scans 8, 12,
and 14, a signal increase is seen at the location of the smoke trails. The signal increase is most obvious in scan 12, 63 sec
after the aircraft crosses the radar track.
Figure A 10.
01-09-95.
B
Oe-,
_0
-50
-55
-60
-65
-70
-75
-80
-85
-9010
Radar settings: R = 1366 m, Az = scanning, El = 20.0 °
Airplane crossing at time = 19:59:58.3, R = 1364 m, Az = 31.5 °, El = 19.6 °, Alt = 473 m AGL
20:00:45.4, Arl = -114.3 dBm -1
\
Scan l-clutter
o Scan 8-vortex plus clutter
• Scan 8-vortex plus clutter with smoke
15 20 25
Azimuth, deg
30 35
I
40
Total signal level vs. antenna azimuth angle compared with clutter scan for pass 54, azimuth scan 8, on
E
8.
_D
-5O
-55
-60
-65
-70
-75
-80
-85
-90I0
Radar settings: R = 1366 m, Az = scanning, El = 20.0 °
Airplane crossing at time = 19:59:58.3, R = 1364 m, Az = 31.5 °, El = 19.6 °, Alt = 473 m AGL
ooo i+1.Scan 1--clutter
o Scan 12-vortex plus clutter
• Scan 12-vortex plus clutter with smoke
15 20 25 30 35 40
Azimuth, deg
Figure A11. As for figure A10, except for azimuth scan 12.
19

E
Oe_
erO1)
.,>
-50
-55
-60
-65
-70
-75
-80
-85
-90 ,10
Radar settings: R = 1366 m, Az = scanning, El = 20.0 °
Airplane crossing at time = 19:59:58.3, R = 1364 m, Az = 31.5 °, E1 = 19.6 °, Alt = 473 m AGL
20:01:11.1, Arl = -115.3 dBm -1 -7
©
©
i i i
-- Scan l-clutter
Scan 14-vortex plus clutter
Scan 14-vortex plus clutter with smoke
15 20 25
Azimuth, deg
, I i , , i I , i , , I
30 35 40
Figure A12. As for figure A10, except for azimuth scan 14.
-75.46
-75.48
-75.50
_5
_= -75.52,.d
-75.54
20:01 : 11.0
20:01:02.0
J20:00:45.0
-75.56 ........ _ ......... E37.92 37.90 37.88
North
m Airplane track
[] R5 range cell track
o R5 radar
37.86 37.84 37.82 37.80 37.78
Latitude, deg
Figure A13. Pass 54 airplane and Radar 5 ground tracks; tail-on radar view of airplane wake.
2O

Figures A14 and A15 contain one azimuth scan and the ground tracks for pass 56. In scan 8, a signal increase and a
signal decrease are seen side by side at the location of the smoke trails.
Figure A14.01-09-95.
-50
Radar settings: R = 1111 m, Az = scanning, El = 20.0 °
Airplane crossing at time = 20:11:18.5, R = 1167 m, Az = 33.0 °, El = 18.1% Alt = 373 m AGL
-55
-65e_
-70 •ed)
"_ -75 dBm-120:12:07.0, Arl = - 114.6>
8 -80,'_ -- Scan l-clutter
c> Scan 8-vortex plus clutter-85• Scan 8-vortex plus clutter with smoke
-90 _ i i i J )
10 15 20 25 30 35 40
Azimuth, deg
Total signal level vs. antenna azimuth angle compared with clutter scan for pass 56, azimuth scan 8, on
-75.44
-75.46
-_ -75.48
2
-75.50,...1
-75.52
-75.54
37.92
North
Airplane trackR5 range cell track
o R5 radar
/20:1 : .
, t n i h i L h J _ n i I i J t i , , I .... h , , , _ I I , t , a I I _ I ] t ..... k L i I , , i a i i , h t I ...... _ , , I
37.90 37.88 37.86 37.84 37.82 37.80 37.78
Latitude, deg
Figure A15. Pass 56 airplane and Radar 5 ground tracks; tail-on radar view of airplane wake.
21
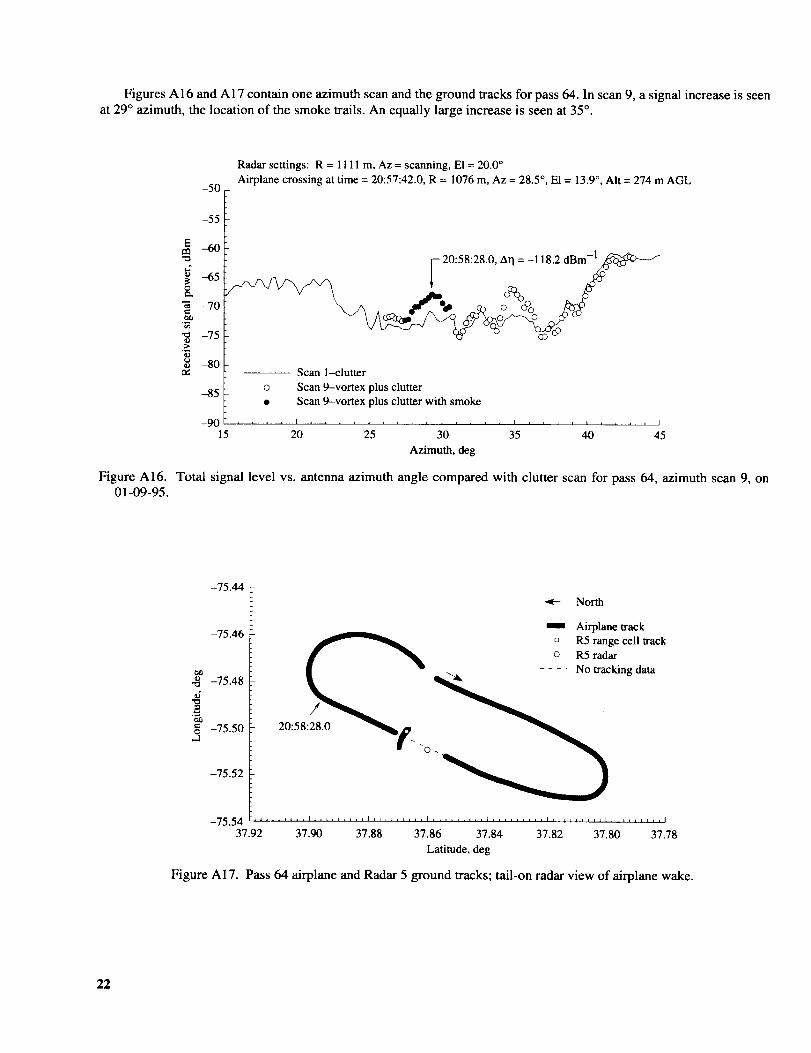
Figures A16 and A17 contain one azimuth scan and the ground tracks for pass 64. In scan 9, a signal increase is seen
at 29 ° azimuth, the location of the smoke trails. An equally large increase is seen at 35 ° .
Figure A 16.
01-09-95.
-50
Radar settings: R = 1111 m, Az = scanning, El = 20.0 °
Airplane crossing at time = 20:57:42.0, R = 1076 m, Az = 28.5 °, E1 = 13.9 °, AIt = 274 m AGL
Er_
O
ot_
O
-55
-60
-65
-70
-75
-80
-85
-9015
20:58:28.0, Arl = -118.2 dBm-_
-- Scan 1-clutter
o Scan 9-vortex plus clutter
• Scan 9-vortex plus clutter with smoke
20 25 30 35
Azimuth, deg
, I I
40 45
Total signal level vs. antenna azimuth angle compared with clutter scan for pass 64, azimuth scan 9, on
-75.44
-75.46
._ -75.48
_5
2
-75.50,.d
-75.52
-75.5437.92
North
Airplane track
D R5 range cell track
o R5 radar
- - - No tracking data
20:58:28.0
37.90 37.88 37.86 37.84 37.82 37.80 37.78
Latitude, deg
Figure A17. Pass 64 airplane and Radar 5 ground tracks; tail-on radar view of airplane wake.
22

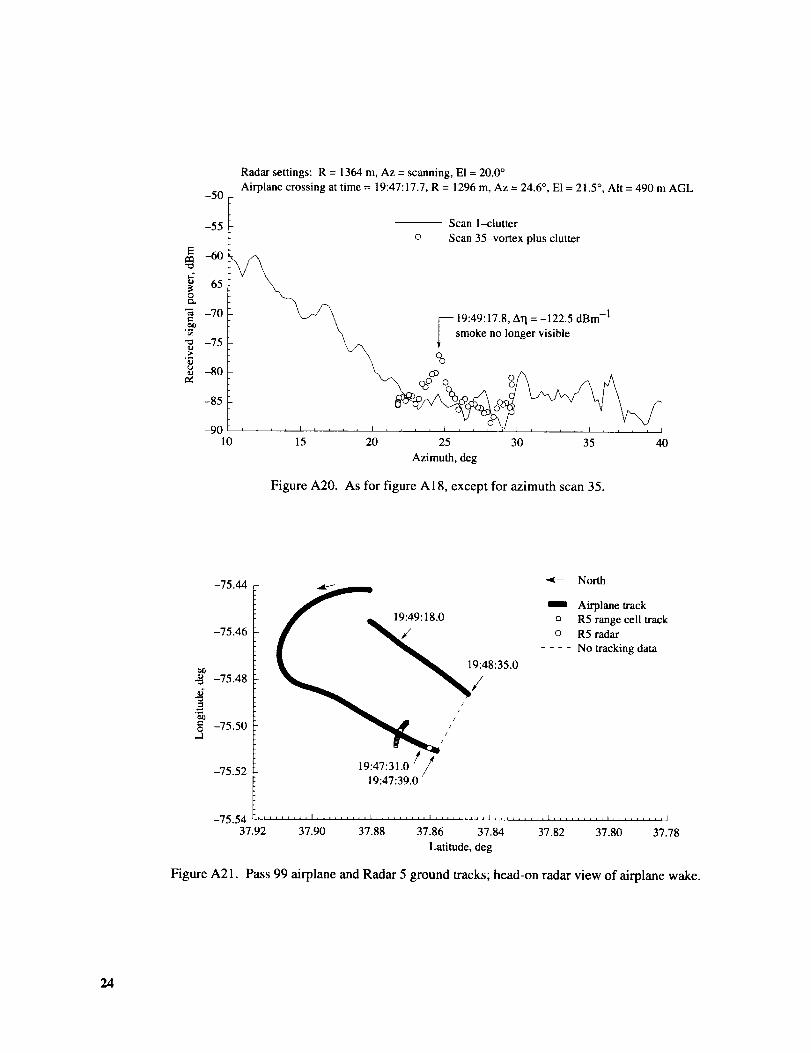
Figures A 18, A I 9, A20, and A21 contain three azimuth scans and the ground tracks for pass 99. In scans 4 and 1O, a
signal increase is seen at the location of the smoke trails. In scan 35, 120 sec after the aircraft crosses the radar track, the
signal increase is still present but the smoke has dissipated.
Figure A18.01-10-95.
-50
Radar settings: R = 1364 m, Az = scanning, El = 20.0°Airplane crossing at time = 19:47:17.7, R = 1296 m, Az = 24.6°, El = 21.5°, Alt = 490 m AGL
Ee_
.>.
r¢
-55
4i0
_5
-70
-75
-80
-85
-9010
i i i
O
Scan l-clutter
Scan 4-vortex plus clutterScan 4-vortex plus clutter with smoke
19'47'31 4 ArI --125 1 dBm-
, I , J _ , I , L L _ I
15 20 25 30 35 40
Azimuth, deg
Total signal level vs. antenna azimuth angle compared with clutter scan for pass 99, azimuth scan 4, on
E
Oe_
'7,
-50
-55
_0
4i5
-70
-75
-80
-85
-9010
Radar settings: R = 1364 m, Az = scanning, El = 20.0 °Airplane crossing at time = 19:47:17.7, R = 1296 m, Az = 24.6 °, El = 21.5°, Alt = 490 m AGL
Scan 1--clutter
o Scan lO-vortex plus clutter• Scan 10-vortex plus clutter with smoke
dBm -1
I I , , , , I _ _ Y I _ , L 1 , , , J I
15 20 25 30 35 40
Azimuth, deg
Figure A19. As for figure A18, except for azimuth scan 10.
23
E
I..7
O
e-
r_
-50
-55
-60
-65
-70
-75
-80
-85
-9010
Radar settings: R = 1364 m, Az = scanning, El = 20.0 °
Airplane crossing at time = 19:47:17.7, R = 1296 m, Az = 24.6 °, El = 21.5 °, Alt = 490 m AGL
Scan l-clutter
Scan 35-vortex plus clutter
_ 19:49:17.8, Arl = -122.5 dBm -1_ smoke no longer visible
@ o o
i i _ i I i n L n I i a i _ h _ n i , n J i
15 20 25 30 35 40
Azimuth, deg
Figure A20. As for figure A18, except for azimuth scan 35.
-75.44
-75.46
._ -75.48
,.-i
g -75.50,..]
-75.52
-75.5437.92
19:49:18.0
1_48:35.0
i
t1
it
19:47:31.0///19:47:39.0
North
ni Airplane track
o R5 range cell track
o R5 radar
.... No tracking data
37.90 37.88 37.86 37.84 37.82 37.80 37.78
Latitude, deg
Figure A21. Pass 99 airplane and Radar 5 ground tracks; head-on radar view of airplane wake.
24

FiguresA22,A23,andA24containtwoazimuthscansandthegroundtracksforpass100.In scans6 and12,asignaldecreaseisseenatthelocationofthesmoke,whileasignalincreaseisseen4° or 95 m clockwise.
Figure A22.
01-10-95.
-5O
Radar settings: R = 1364 m, Az = scanning, El = 20.0 °
Airplane crossing at time = 19:51:55.8, R = 1365 m, Az = 30.1% El = 19.8 °, Alt = 478 m AGL
"o
o
tm
r¢
-55
-60
-65
-70
-75
-80
-85
-905
©
r,_Ll,,,,I
10 15
Scan l-clutter
Scan 6-vortex plus clutter
Scan 6-vortex plus clutter with smoke
19:52:16.2, Arl = -121.9 dBm -1
20 25 30 35
Azimuth, deg
Total signal level vs. antenna azimuth angle compared with clutter scan for pass 100, azimuth scan 6, on
E
oe.,
ta_
e¢
-50
-55
-60
-65
-70
-75
-80
-85
-905
Radar settings: R = 1364 m, Az = scanning, El = 20.0 °
Airplane crossing at time = 19:5l:55.8, R = 1365 m, Az = 30.1 °, El = 19.8 °, Alt = 478 m AGL
<3
i i i , I i , i , I , ,
10 15
Scan 1-clutter
Scan 12-vortex plus clutter
Scan 12-vortex plus clutter with smoke
19:52:36.5, Arl = -120.7 dBm -1 --_
20 25 30 35
Azimuth, deg
Figure A23. As for figure A22, except for azimuth scan 12.
25

-75.44
-75.46
._ -75.48
= -75.50O
,.d
-75.52
-75.5437.94
North
1 Airplane track
o R5 range cell track
o R5 radar
.... No tracking data
19:53:10.0
37.92 37.90 37.88 37.86 37.84 37.82 37.80
Latitude, deg
Figure A24. Pass 100 airplane and Radar 5 ground tracks; head-on radar view of airplane wake.
26
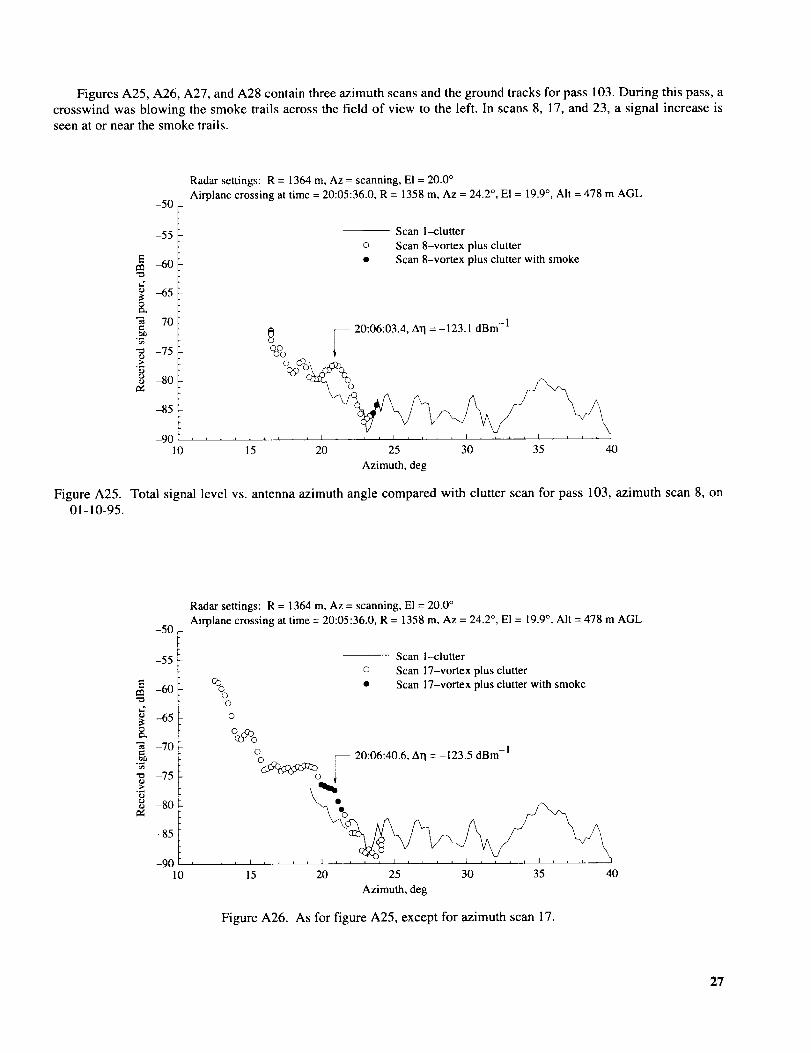
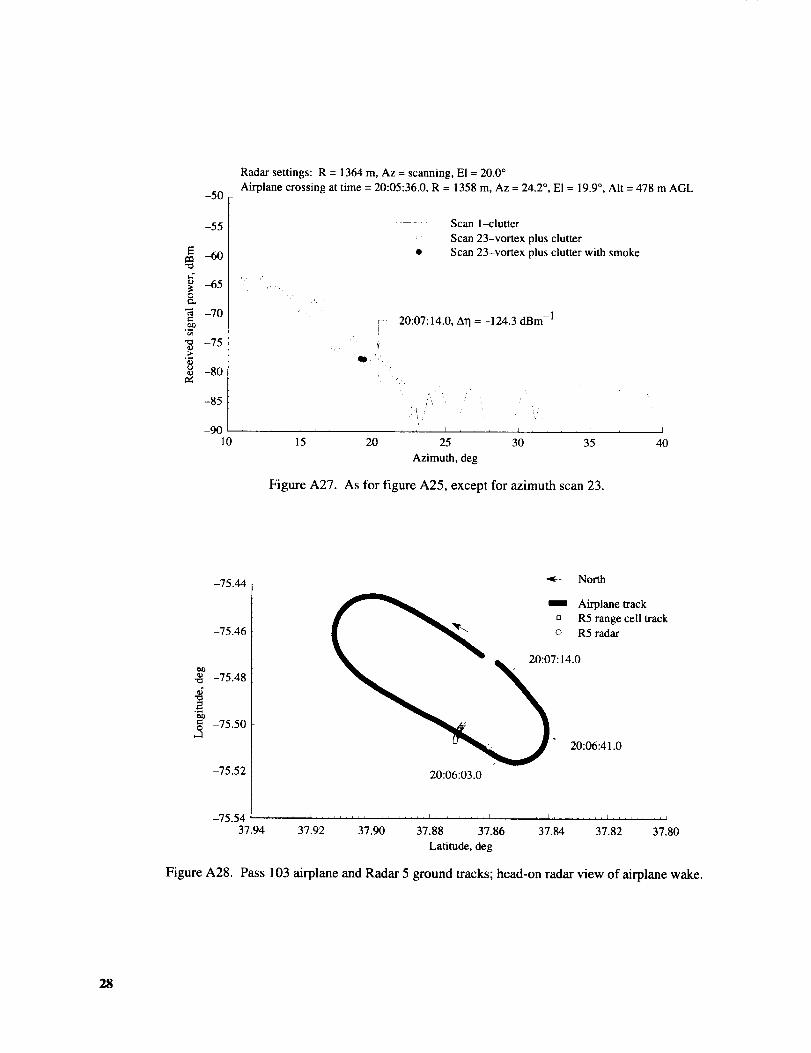
Figures A25, A26, A27, and A28 contain three azimuth scans and the ground tracks for pass 103. During this pass, a
crosswind was blowing the smoke trails across the field of view to the left. In scans 8, 17, and 23, a signal increase is
seen at or near the smoke trails.
Figure A25.
01-10-95.
-50
Radar settings: R = 1364 m, Az = scanning, El = 20.0 °
Airplane crossing at time = 20:05:36.0, R = 1358 m, Az = 24.2 °, El = 19.9 °, Alt = 478 m AGL
E
t.."
Ot_
t-
"7,
¢)
-55
-60
-65
-70
-75
-80
-85
-9010
, 1
15
-- Scan l-clutter
Scan 8-vortex plus clutter
Scan 8-vortex plus clutter with smoke
[-- 20:06:03.4, ArI = -123.1 dBm -1
%
L i L I
20 25 30 35 40
Azimuth, deg
Total signal level vs. antenna azimuth angle compared with clutter scan for pass 103, azimuth scan 8, on
E
e-,t;to
._>
-50
-55
-60
-65
-70
-75
-80
-85
-9010
Radar settings: R = 1364 m, Az = scanning, El = 20.0 °
Airplane crossing at time = 20:05:36.0, R = 1358 m, Az = 24.2 °, E1 = 19.9 °, AIt = 478 m AGL
%0
0
0
°@o
L L L
-- Scan 1-clutter
Scan 17-vortex plus clutter
Scan 17-vortex plus clutter with smoke
O
oe:!5_Sn_ ° _- 20:06:40.6, Arl = -123.5 dBm -I
I ,
15 20 25 30 35 40
Azimuth, deg
Figure A26. As for figure A25, except for azimuth scan 17.
27
O
QJ
a_
-50
-55
-60
-65
-70
-75
-80
-85
-90lO
Radar settings: R = 1364 m, Az = scanning, El = 20.0 °
Airplane crossing at time = 20:05:36.0, R = 1358 m, Az = 24.2 °, El = 19.9 °, Alt = 478 m AGL
Scan l-clutter
Scan 23-vortex plus clutter
Scan 23-vortex plus clutter with smoke
r 20:07:14.0, Ar I =-124.3 dBm -1!
y
I I
15 20 25 30 35
Azimuth, deg
Figure A27. As for figure A25, except for azimuth scan 23.
i
40
-75.44
-75.46
._ -75.48_5
.2
-75.5o
-75.52
-75.5437.94
Figure A28.
North
1 Airplane track
C _ 7114._ _ _adgarecell track
_ 20.06.41.0
20:06:03.0
37.92
,,, ii,l,l,l,,,i,I ill ii ,i,I I ,,I,l,ll ,iJI
37.90 37.88 37.86 37.84 37.82 37.80
Latitude, deg
Pass 103 airplane and Radar 5 ground tracks; head-on radar view of airplane wake.
28
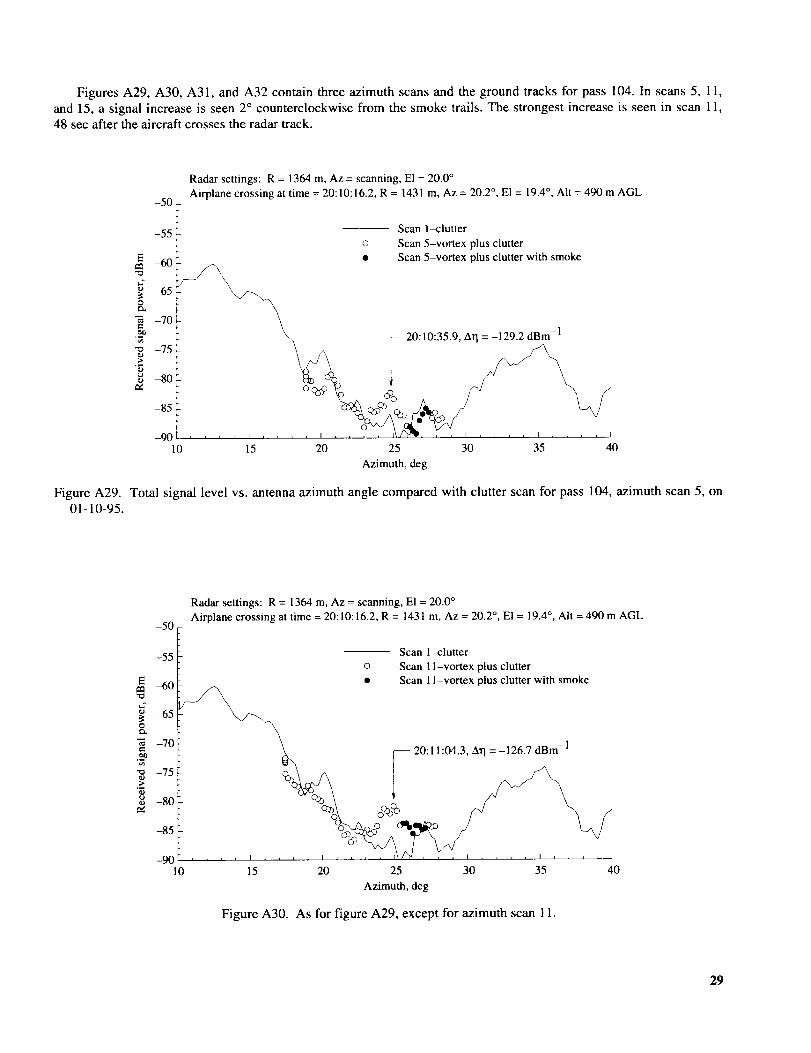
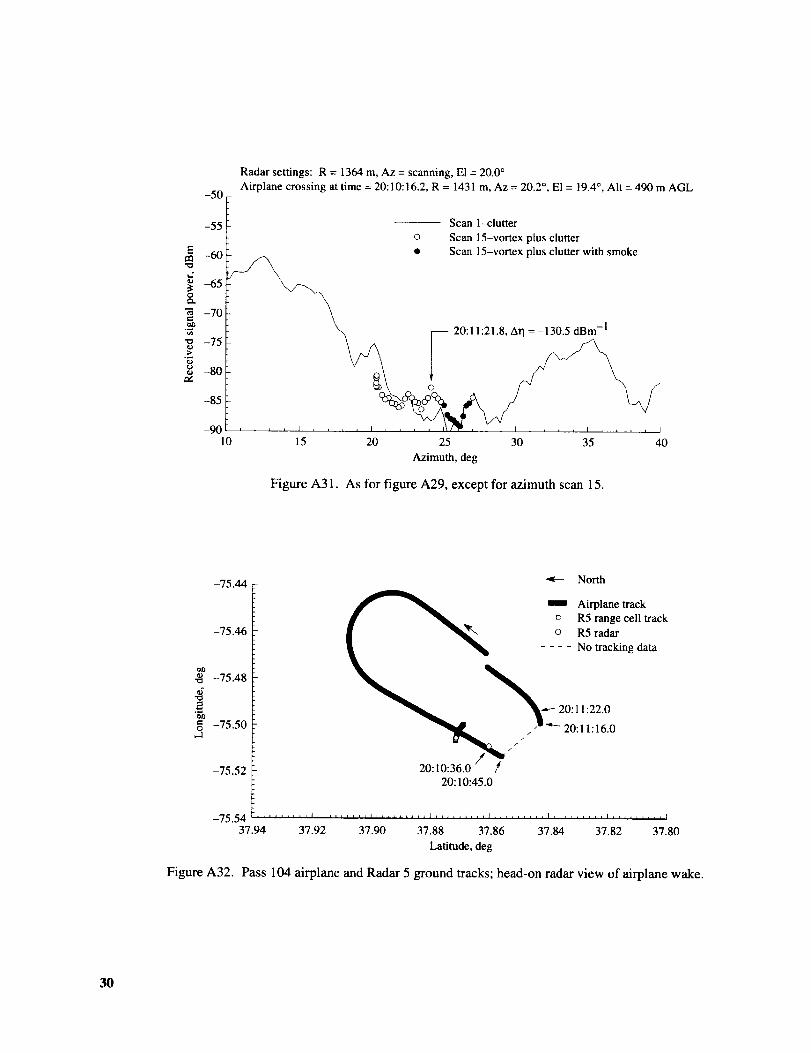
FiguresA29,A30,A31,andA32containthreeazimuthscansandthegroundtracksfor pass104.In scans5, 11,and15,asignalincreaseisseen2° counterclockwisefromthesmoketrails.Thestrongestincreaseisseenin scan11,48secaftertheaircraftcrossestheradartrack.
FigureA29.01-10-95.
E
-50
-55
-60
-65
-70
Radarsettings:R=1364m,Az=scanning,El=20.0°Airplane crossing at time = 20:10:16.2, R = 1431 m, Az = 20.2 °, El = 19.4 °, Alt = 490 m AGL
Scan l-clutter
Scan 5-vortex plus clutter
Scan 5-vortex plus clutter with smoke
-75
-80
-85
-9010
, I
15
__Q:Dc_@_, I 20:10:35.9, AI]= -129.2 dBm -1
, ,
20 25 30 35 40
Azimuth, deg
Total signal level vs. antenna azimuth angle compared with clutter scan for pass 104, azimuth scan 5, on
'x3
Oe_
-50
Radar settings: R = 1364 m, Az = scanning, E1 = 20.0 °
Airplane crossing at time = 20:10:16.2, R = 1431 m, Az = 20.2 °, El = 19.4 °, Alt = 490 m AGL
-55
_50
_55
-70
-75
-80
-85
-9010
Scan l-clutter
o Scan 1I-vortex plus clutter
• Scan 1I-vortex plus clutter with smoke
[----- 20:! 1:04.3, Arl = -126.7 dBm-
1
0%%1 _ ,/
15 20 25 30 35 40
Azimuth, deg
Figure A30. As for figure A29, except for azimuth scan 1 1.
29
E
02
Qe_
e-
"5
o
o_
-50
Radar settings: R = 1364 m, Az = scanning, E1 = 20.0 °
Airplane crossing at time = 20:10:16.2, R = 1431 m, Az = 20.2 °, El = 19.4 °, Alt = 490 m AGL
-55
-60
_55
-70
-75
-80
-85
-9010
Scan 1-clutter
o Scan 15-vortex plus clutter
• Scan 15-vortex plus clutter with smoke
_- 20:11:21.8, An = -130.5 dBm -1
15 20 25 30 35 40
Azimuth, deg
Figure A31. As for figure A29, except for azimuth scan 15.
-75.44
-75.46
-75.48_5
.2o= -75.50
-75.52
North
m Airplane track
[] R5 range cell track
o R5 radar
.... No tracking data
____20:11:22.0
,- 20:11:16.0///
20:10:36.0 fl
20:10:45.0
-75.54 ......... i ......... t ......... J ......... j ......... i ......... i ......... i37.94 37.92 37.90 37.88 37.86 37.84 37.82 37.80
Latitude, deg
Figure A32. Pass 104 airplane and Radar 5 ground tracks; head-on radar view of airplane wake.
30

FiguresA33, A34, A35, and A36 contain three azimuth scans and the ground tracks for pass 106. Following the
smoke trails from right to left, one sees a signal increase in scan 5, a decrease in scan 12, and an increase and a decrease
in scan 22.
Figure A33.
01-10-95.
-50
Radar settings: R = 1111 m, Az = scanning, El = 20.0 °
Airplane crossing at time = 20:19:45.25, R = 1110 m, Az = 26.4 °, El = 20.1 °, AIt = 396 m AGL
E
Oe_
t-
o_e¢
-55
-60
-65
-70
-75
-80
-85
--90
10
_ 20:20:09.0, Ar 1 = -120.0 dBm -1
-- Scan l-clutter
o Scan 5-vortex plus clutter
• Scan 5-vortex plus clutter with smoke
15 20 25 30 35 40
Azimuth, deg
Total signal level vs. antenna azimuth angle compared with clutter scan for pass 106, azimuth scan 5, on
_0
"5
-50
Radar settings: R = 1111 m, Az = scanning, E1 = 20.0 °
Airplane crossing at time = 20:19:45.25, R = 1110 m, Az = 26.4 °, El = 20.1 °, Alt = 396 m AGL
-55
-60
-65
-70
-75
-80
-85
-9010
-- Scan 1-clutter
Scan 12-vortex plus clutter
Scan 12-vortex plus clutter with smoke
°Qql_© o
--- 20:20:38.1, All = -121.3 dBm -1
, , _ , I , J I i I J
15 20 25 30 35 40
Azimuth, deg
Figure A34. As for figure A33, except for azimuth scan 12.
31

Et_
O
e-
r,,
-50
Radar settings: R = 1111 m, Az = scanning, El = 20.0 °Airplane crossing at time = 20:19:45.25, R = 1110 m, Az = 26.4 °, El = 20.1 °, Alt = 396 m AGL
-55 -- 20:21:19.6, Arl = -114.1 dBm -1
-65t @-70
-75
-80-- Scan l-clutter
o Scan 22-vortex plus clutter-85• Scan 22-vortex plus clutter with smoke
--90 , , , , I , , , _ I , _ , , [ , , , , I _ , , , I , , , , I
10 15 20 25 30 35 40
Azimuth, deg
Figure A35. As for figure A33, except for azimuth scan 22.
-75.42
-75.44
x_ -75.46G
g -75.48
-75.50
North
-75.5237.92
Airplane track
tJ R5 range cell track
o R5 radar
.... No tracking data
_ 20:21:20.0
''' _ 20:20:45.0/
20:20:05.0 _,1, , , ,, , ,I ....... I,l,,,,tL,,,I, ,,,, ,,,,I ........ 11 L,,, , ,t ,,I ,, , ...... I
37.90 37.88 37.86 37.84 37.82 37.80 37.78
Latitude, deg
Figure A36. Pass 106 airplane and Radar 5 ground tracks; head-on radar view of airplane wake.
32

Figures A37, A38, A39, and A40 contain three azimuth scans and the ground tracks for pass 107. In scan 5, a signal
decrease is seen at the location of the smoke trails, immediately adjacent to a signal increase. In scan 8, a signal decrease
is seen at the smoke trails. In scan 22, a signal increase is seen at the smoke trails, immediately adjacent to a signal
decrease. The videotape showed that, by this time, the shape of the smoke trail leftmost in the field of view had changed
from a straight line to a corkscrew pattern.
-50
Radar settings: R = 1111 m, Az = scanning, E1 = 20.0 °
Airplane crossing at time = 20:24:39.5, R = 1053 m, Az = 20.6 °, El = 23.2 °, Alt = 427 m AGL
-55 -- 20:25:08.0, A_q = -I 10.9 dBm -1
E_ _0
e_
-_ -70
"_ -75
_ -80,¢ -- Scan 1-clutter
o Scan 5-vortex plus clutter-85
• Scan 5-vortex plus clutter with smoke
-90 I _ _ , , I I , h , , I , , , , I _ , , , I
5 10 15 20 25 30 35
Azimuth, deg
Figurc A37. Total signal level vs. antenna azimuth angle compared with clutter scan for pass 107, azimuth scan 5, on
01-10-95.
E
"O
-50
-55
-60
-65
-70
-75
-80
-85
-90
Radar settings: R = 1111 m, Az = scanning, El = 20.0 °
Airplane crossing at time = 20:24:39.5, R = 1053 m, Az = 20.6 °, El = 23.2 °, AIt = 427 m AGL
-- Scan 1-clutter
o Scan 8-vortex plus clutter/_ • Scan 8-vortex plus clutter with smoke
. . . , ---- .
I I , , , _ I I 1 , , L ,
10 15 20 25 30
Azimuth, deg
Figure A38. As for figure A37, except for azimuth scan 8.
I
35
33

Oe_
e¢
-50
-55
-60
-65
-70
-75
-80
-85
-905
Radar settings: R = 1111 m, Az = scanning, El = 20.0 °
Airplane crossing at time = 20:24:39.5, R = 1053 m, Az = 20.6 °, E1 = 23.2 °, Alt = 427 m AGL
8 _-- 20:26:19.6, Arl =-112.3 dBm -1
-- Scan l-clutter
o Scan 22-vortex plus clutter
• Scan 22-vortex plus clutter with smoke
10 15 20 25 30 35
Azimuth, deg
Figure A39. As for figure A37, except for azimuth scan 22.
-75.42
-75.44
-75.46
-75.48
-75.50
-75.52
20:26:20.0
20:25:09.0
North
20:25:21.0
Airplane track
o R5 range cell track
o R5 radar
-75.54 ........ ' ......... ' ......... _ ......... ' ......... ' ......... ' ......... '37.92 37.90 37.88 37.86 37.84 37.82 37.80 37.78
Lafitude, deg
Figure A40. Pass 107airplaneandRadar5ground _acks; head-on radar viewofairplanewake.
34

Figures A41, A42, and A43 contain two azimuth scans and the ground tracks for pass 108. In scan 7, a signal
increase is seen 4 ° clockwise or 78 m from the smoke trails. In scan 14, a signal increase is seen at the smoke trails with
a signal decrease on either side.
Figure A41.
01-10-95.
-50
Radar settings: R = 1111 m, Az = scanning, E1 = 20.0 °
Airplane crossing at time = 20:29:19.5, R = 1109 m, Az = 21.3 °, El = 20.7 °, Alt = 407 m AGL
-55
E _ F- 20:29:52.5, Aq = -112.4 dBm -1-60i
_._ -65 _ °__o_
-80-- Scan l-clutter
o Scan 7-vortex plus clutter-85• Scan 7-vortex plus clutter with smoke
-90 L , J , i , , _ , i i , _ , _ i _ , , _ l i5 10 15 20 25 30 35
Azimuth, deg
Total signal level vs. antenna azimuth angle compared with clutter scan for pass 108, azimuth scan 7, on
E
..o
oe_
e-ex0"5
0)
--50
--55
--60
--65
--70
--75
-80
-85
--90 '5
Radar settings: R = 1111 m, Az = scanning, El = 20.0 °
Airplane crossing at time = 20:29:19.5, R = 1109 m, Az = 21.3 °, El -- 20.7 °, Alt = 407 m AGL
_ 20:30:37.0, Arl = -118.8 dBm -1
Scan l-clutter
o Scan 14-vortex plus clutter
• Scan 14-vortex plus clutter with smoke
10 15 20 25 30 35
Azimuth, deg
Figure A42. As for figure A41, except for azimuth scan 14.
35

-75.44
-75.46
North
i Airplane track
o R5 range cell track
o R5 radar
.... No tracking data
-75.48,; 20:30:37.0
2
-75.50,.d
// /20:30:12.0
-75.52 /4
20:29:44.0
-75.54 ........ i ......... t ......... _......... i ......... i ......... i ......... i
37.92 37.90 37.88 37.86 37.84 37.82 37.80 37.78
Latitude, deg
Figure A43. Pass 108 airplane and Radar 5 ground tracks; head-on radar view of airplane wake.
36
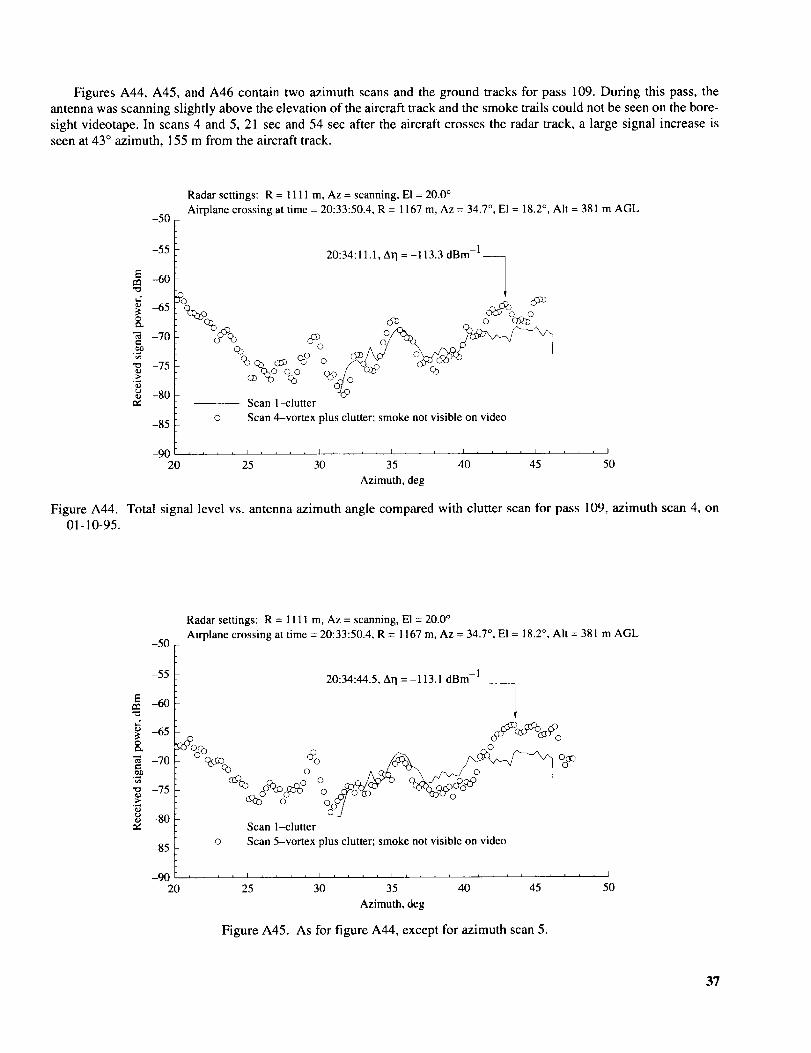
Figures A44, A45, and A46 contain two azimuth scans and the ground tracks for pass 109. During this pass, the
antenna was scanning slightly above the elevation of the aircraft track and the smoke trails could not be seen on the bore-
sight videotape. In scans 4 and 5, 21 sec and 54 sec after the aircraft crosses the radar track, a large signal increase is
seen at 43 ° azimuth, 155 m from the aircraft track.
Figure A44.
01-10-95.
-50
Radar settings: R = 1111 m, Az = scanning, El = 20.0 °
Airplane crossing at time = 20:33:50.4, R = 1167 m, Az = 34.7 °, El = 18.2 °, Alt = 381 m AGL
E
e_
e-
-55
-60
-65
-70
-75
-80
-85
--90
20
20:34:11.1, A'q = -113.3 dBm -1 --
,
-- Scan l-clutter
o Scan 4-vortex plus clutter; smoke not visible on video
J i _ I I _ , , L I I I I
25 30 35 40 45 50
Azimuth, deg
Total signal level vs. antenna azimuth angle compared with clutter scan for pass 109, azimuth scan 4, on
Ee_
e_
-50
-55
-60
-65
-70
-75
-80
-85
-9020
Radar settings: R = 1111 m, Az = scanning, El = 20.0 °
Airplane crossing at time = 20:33:50.4, R = 1167 m, Az = 34.7 °, El -- 18.2 °, Alt = 381 m AGL
20:34:44.5, Arl = -113.1 dBm -1
-1S Jo
_°°o%" _ _ _ca° _--.A
°°
-- Scan l-clutter
o Scan 5-vortex plus clutter; smoke not visible on video
I J k i L I I i I L
25 30 35 40 45
Azimuth, deg
Figure A45. As for figure A44, except for azimuth scan 5.
50
37
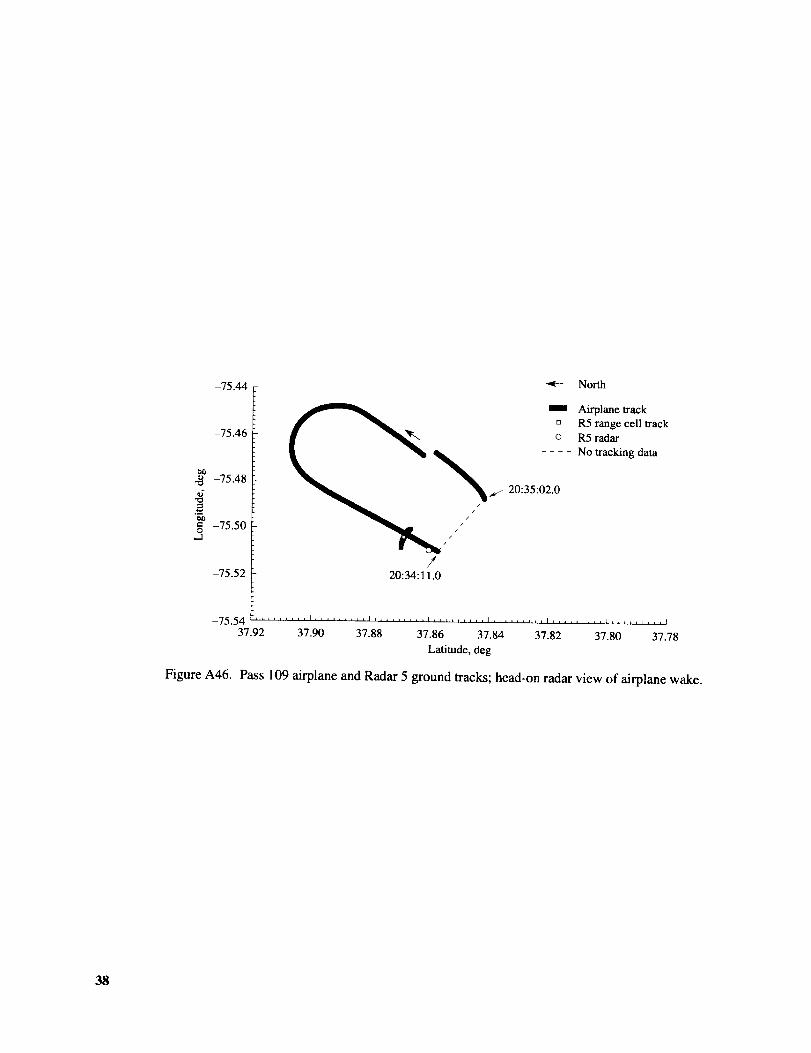
-75.44
-75.46
_gj
._ -75.48
_0
_= -75.50,..1
_-- North
Airplane track
D R5 range cell track
o R5 radar
.... No tracking data
20:35:02.0
//
//
//
/
!-75.52 20:34:11.0
-75.54 ........ i ......... i ......... i ......... j ......... i ......... j .........
37.92 37.90 37.88 37.86 37.84 37.82 37.80 37.78
Latitude, deg
Figure A46. Pass 109 airplane and Radar 5 ground tracks; head-on radar view of airplane wake.
38

Figures A47, A48, A49, and A50 contain three azimuth scans and the ground tracks for pass 117. In scans 11, 18,
and 19, a signal increase is seen accompanied by a signal decrease on either side. The signal disturbance follows the
smoke trails as they drift from right to left.
Figure A47.
01-11-95.
-50
Radar settings: R = 1111 m, Az = scanning, El = 20.0 °
Airplane crossing at time = 16:52:54.3, R = 1107 m, Az = 39.8 °, E1 = 19.6 °, Alt = 386 m AGL
Ee_
e_
e-,
"5
ev
-55
-60
-65
-70
-75
-80
-85
-905
F 16:53:39'7, Aq =-1212 dBm-I
t
©
i J i
-- Scan l-clutter
Scan 1l-vortex plus clutter
Scan 1l-vortex plus clutter with smoke
10 15 20 25 30
Azimuth, deg
35
Total signal level vs. antenna azimuth angle compared with clutter scan for pass 117, azimuth scan 11, on
E
e.
"5
-5O
-55
-60
-65
-70
-75
-80
-85
-905
Radar settings: R = 1111 m, Az = scanning, El = 20.0 °
Airplane crossing at time = 16:52:54.3, R = 1107 m, Az = 39.8 °, El = 19.6 °, Alt = 386 m AGL
1654: :105. ,A'q=-1166dBm.
-- Scan 1-clutter
o Scan 18-vortex plus clutter
• Scan 18-vortex plus clutter with smoke
, , L _ I _ _ h _ L . _ _ _ I _ I I
10 15 20 25 30
Azimuth, deg
Figure A48. As for figure A47, except for azimuth scan 18.
I
35
39

E"O
OIZk
_m
"3
Radar settings: R = 1 ! 11 m, Az = scanning, E1 = 20.0 °
Airplane crossing at time = 16:52:54.3, R = 1107 m, Az = 39.8 °, El = 19.6 °, Alt = 386 m AGL-50
_55__o_ _- 16:54:13.3, A'q = -107.1 dBm -1
F _
-70
-80-- Scan 1-clutter
o Scan 19-vortex plus clutter-85• Scan 19-vortex plus clutter with smoke
--90 , , _ , I _ _ _ _ I , , , _ 1 _ J _ , I , , _ _ I , _ _ _ I
5 10 15 20 25 30 35
Azimuth, deg
Figure A49. As for figure A47, except for azimuth scan 19.
-75.46
-75.44
-75.46
,i
._ -75.48
O
-75.50
_ North
mm Airplane track
t_ R5 range cell track
o R5 radar
16:54:13.016:54:11.0
-75.52 1
16:53:40.0
-75.54 ........ i ......... i ......... i ......... J ......... L ......... i ......... i37.94 37.92 37.90 37.88 37.86 37.84 37.82 37.80
Latitude, deg
Figure A50. Pass 117 airplane and Radar 5 ground tracks; head-on radar view of airplane wake.
40
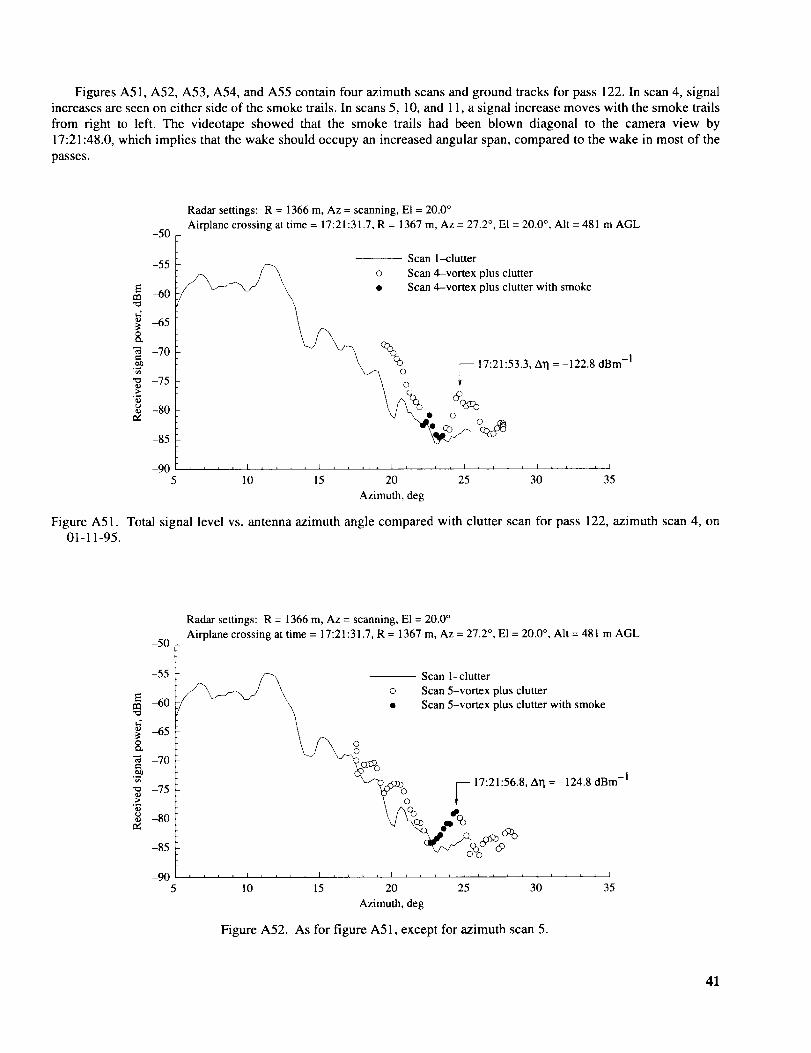
Figures A51, A52, A53, A54, and A55 contain four azimuth scans and ground tracks for pass 122. In scan 4, signal
increases are seen on either side of the smoke trails. In scans 5, 10, and 11, a signal increase moves with the smoke trails
from right to left. The videotape showed that the smoke trails had been blown diagonal to the camera view by
17:21:48.0, which implies that the wake should occupy an increased angular span, compared to the wake in most of the
passes.
-50
Radar settings: R = 1366 m, Az = scanning, El = 20.0 °Airplane crossing at time = 17:21:31.7, R = 1367 m, Az = 27.2 °, El = 20.0 °, AIt = 481 m AGL
E
55-60 •
-65
-70
-75 ___ _ _ 17:21:53.3, A'q
-80 _C_e Z_
-90 , , , , I , , , , _ I , , , , I , _ , , I
10 15 20 25 30
Azimuth, deg
-- Scan l-clutter
Scan 4-vortex plus clutterScan 4-vortex plus clutter with smoke
= -122.8 dBm -1
ILkLI
35
Figure A51. Total signal level vs. antenna azimuth angle compared with clutter scan for pass 122, azimuth scan 4, on01-11-95.
E
O
'7,
cO
-50
-55
-60
--65
-70
-75
-80
-85
-90
Radar settings: R = 1366 m, Az = scanning, El = 20.0°Airplane crossing at time = 17:21:31.7, R = 1367 m, Az = 27.2 °, El = 20.0°, Alt = 481 m AGL
Scan l--clutter\ o Scan 5-vortex plus clutter
• Scan 5-vortex plus clutter with smoke
_ 17:21:56.8, At1 = -124.8 dBm -1
10 15 20 25 30 35
Azimuth, deg
Figure A52. As for figure A51, except for azimuth scan 5.
41
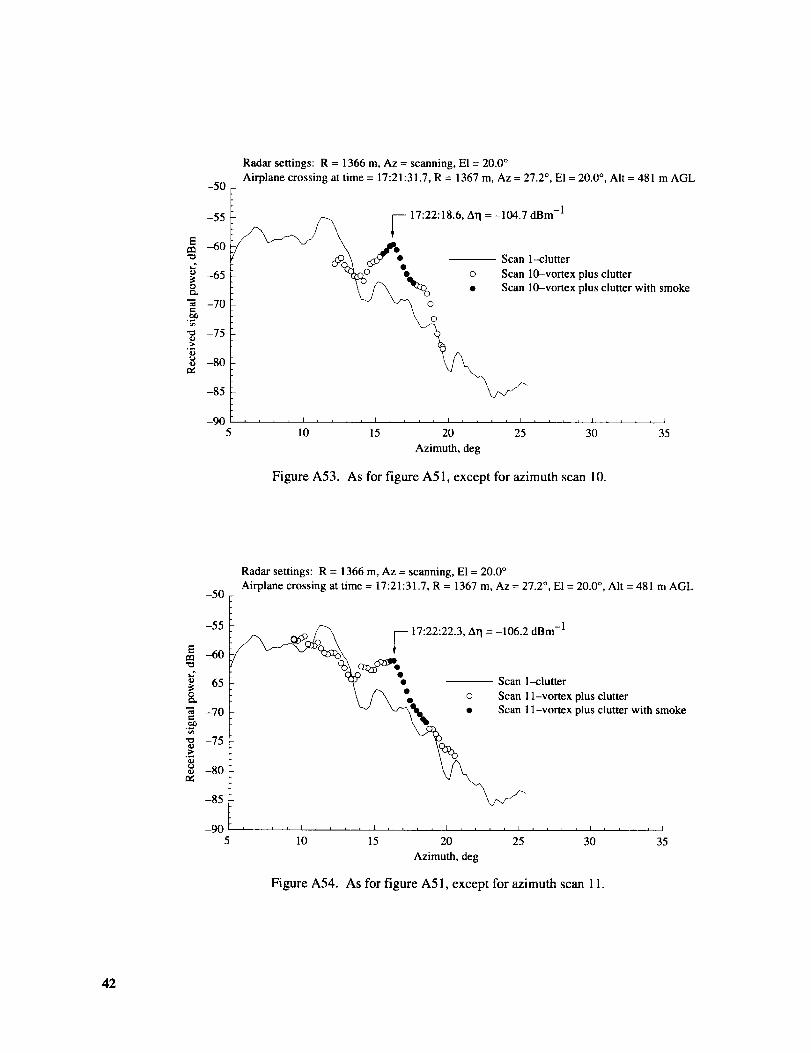
E
t2
oIzL
.>,
-50
-55
-60
-65
-70
-75
-80
-85
-905
Radar settings: R = 1366 m, Az = scanning, El = 20.0 °
Airplane crossing at time = 17:21:31.7, R = 1367 m, Az = 27.2 °, El = 20.0 °, Alt = 481 m AGL
17:22:18.6, Ar I = -104.7 dBm -1
/__//_ J O_-O' .... Scan l-clutter
_6 _ o Scan 10-vortex plus clutter
10-vortex plus clutter with smoke
, , _ L I , , J _ 1 1 I I t
10 15 20 25 30 35
Azimuth, deg
Figure A53. As for figure A51, except for azimuth scan 10.
Et_
¢xO
-50
-55
-60
-65
-70
-75
-80
-85
-90
Radar settings: R = 1366 m, Az = scanning, El = 20.0 °
Airplane crossing at time = 17:21:31.7, R = 1367 m, Az = 27.2 °, El = 20.0 °, Alt = 481 m AGL
cz_6:_gl_-- 17:22:22.3, Ar 1 = -106.2 dBm -1
x_r • ---- Scan l-clutter
\ /r_ _ o Scan I 1-vortex plus clutter
_5_Q_/ Scan I 1-vortex plus clutter with smoke
J , _ , I _ * _ , I , , _ _ I _ _ , _ I , _ , _ I , , _ L I
10 15 20 25 30 35
Azimuth, deg
Figure A54. As for figure A51, except for azimuth scan 11.
42
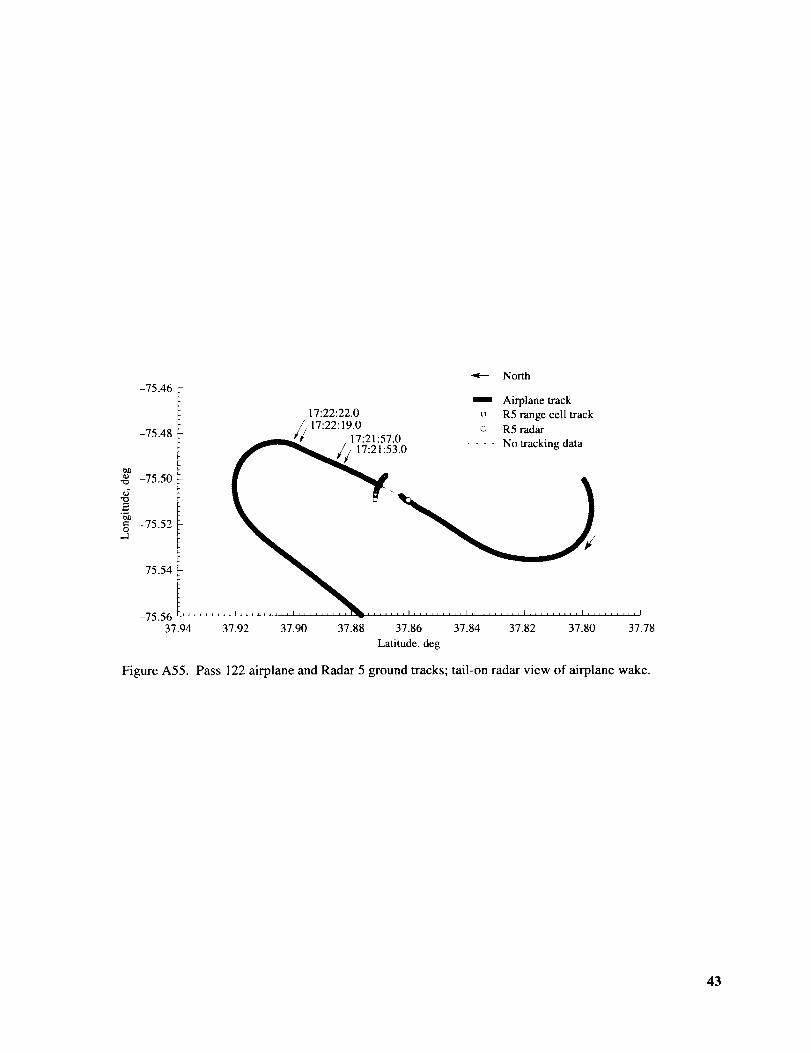
-75.46
-75.48
._ -75.50
_o" -75.52O
,.d
-75.54
North
Airplane track
17:22:22.0 n R5 range cell track
_ 17"22"190 © R5radar_/ " " i7"21"570 Notrackin data
5_.0 .... g
........... I I I I I I I I J I I I I I 1 I I _ I I I I I ......... _ ......... _ ......... I-75.5637.94 37.92 37.90 37.88 37.86 37.84 37.82 37.80 37.78
Latitude, deg
Figure A55. Pass 122 airplane and Radar 5 ground tracks; tail-on radar view of airplane wake.
43

Figures A56, A57, A58, and A59 contain three azimuth scans and the ground tracks for pass 123. In scan 4, a signal
increase is seen coincident with the smoke trails, immediately adjacent to a signal decrease. In scan 7, a signal increase
is seen between two signal decreases. In scan 123, a signal decrease is seen coincident with the smoke trails, adjacent to
a signal increase. Over a 48 sec period, the signal disturbance moves with the smoke from right to left.
Figure A56.01-11-95.
-50
Radar settings: R = 1366 m, Az = scanning, El = 20.0 °Airplane crossing at time = 17:27:31.7, R = 1364 m, Az = 30.0 °, El = 19.7°, Alt = 475 m AGL
E
e.
_J
t_
-55
--60
-65
-70
-75
-80
-85
-90
/___ • ii:_ i--CvvlU_t:texxrp:u: :llU:t_e_with smoke
rI =-124.6 dBm-l_
10 15 20 25 30 35
Azimuth, deg
Total signal level vs. antenna azimuth angle compared with clutter scan for pass 123, azimuth scan 4, on
E
@e_
-50
-55
450
455
-70
-75
-80
-85
-905
Radar settings: R = 1366 m, Az = scanning, E1 = 20.0 °Airplane crossing at time = 17:27:31.7, R = 1364 m, Az = 30.0 °, E1 = 19.7°, Alt = 475 m AGL
,--. _ Scan 1--clutter/ v _ o Scan 7-vortex plus clutter
/ V _can 7-vortex plus clutter with smoke
17:27:53.7, AT]= -124.8 dBm -1
i i i _ J i i i i I _ i i I I i i I L I i I i J I J _ _ _ r
10 15 20 25 30 35
Azimuth, deg
Figure A57. As for figure A56, except for azimuth scan 7.
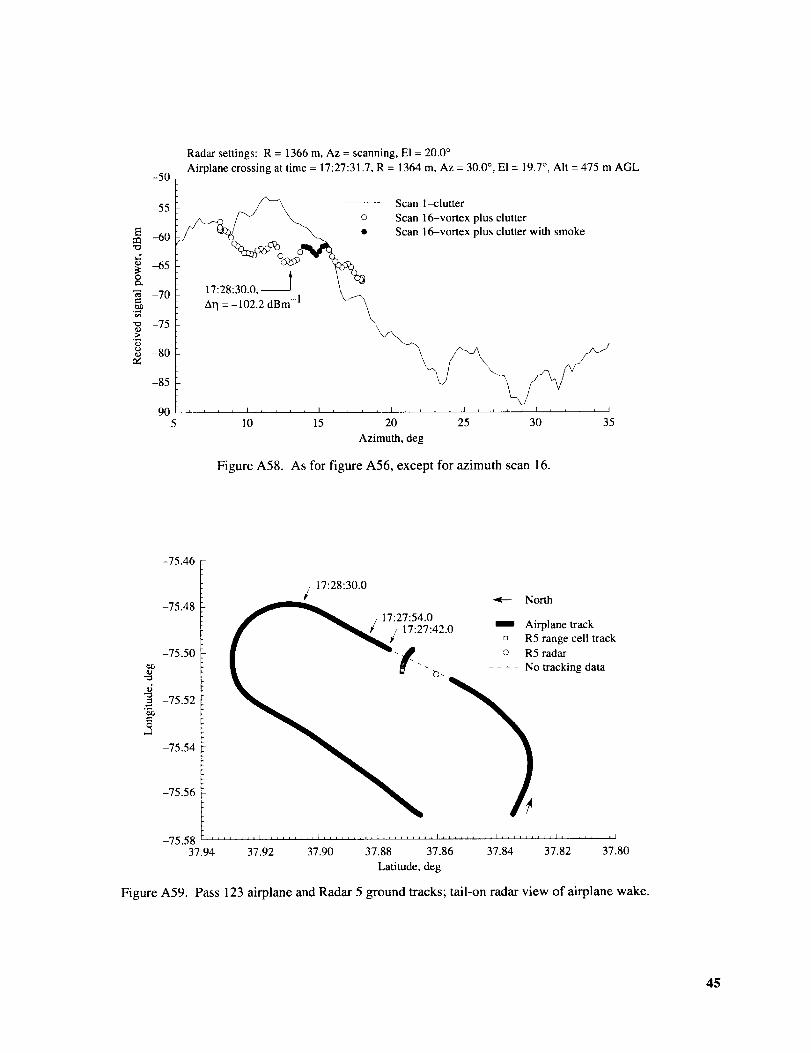
Oe_
-50
-55
-60
-65
-70
-75
-80
-85
-90
Radar settings: R = 1366 m, Az = scanning, E1 = 20.0 °
Airplane crossing at time = 17:27:31.7, R = 1364 m, Az = 30.0 °, El = 19.7 °, Alt= 475 m AGL
17:28:30.0, _J \
ArI = -102.2 dBm-l_
L i _ J I i J J _ I i i i I I
10 15 20
Scan l-clutter
Scan 16-vortex plus clutter
Scan 16-vortex plus clutter with smoke
25 30 35
Azimuth, deg
Figure A58. As for figure A56, except for azimuth scan 16.
-75.46
O,.d
-75.48
-75.50
-75.52
-75.54
-75.56
-75.5837.94
_/ 17:28:30.0
17:27:54.0
_/ 17:27:42.0
_ North
Airplane track
o R5 range cell track
o R5 radar
.... No tracking data
37.92 37.90 37.88 37.86 37.84 37.82 37.80
Latitude, deg
Figure A59. Pass 123 airplane and Radar 5 ground tracks; tail-on radar view of airplane wake.
45

FiguresA60,A61,andA62containtwoazimuthscansandthegroundtracksforpass127.In scans8and9,signaldisturbancesareseeninvariouspartsof thescan.Thedisturbancesnotclosetothesmoketrailsareequalinmagnitudetothoseatthelocationof thesmoketrails.
FigureA60.01-11-95.
-50Radarsettings:R=1109m,Az=scanning,El=20.0°Airplanecrossingattime=17:51:25.7,R=1170m,Az=35.7°, El = 17.7 °, Alt = 370 m AGL
-55
Ea_ -60
_2*_ -65o
-70e-,
-75
-80
-85
_ 17:52:04.6, Arl = -115.2 dBm -1
o Scan 8-vortex plus clutter
• Scan 8-vortex plus clutter with smoke
, _ I , _ _ , I h _ J A I , , , j I I _ , , _ I
10 15 20 25 30 35
Azimuth, deg
Total signal level vs. antenna azimuth angle compared with clutter scan for pass 127, azimuth scan 8, on
E
e_
e-
0_.,>
_D
-50
-55
-60
-65
-70
-75
-80
-85
-905
Radar settings: R = 1109 m, Az = scanning, El = 20.0 °
Airplane crossing at time = 17:51:25.7, R = 1170 m, Az = 35.7 °, El = 17.7 °, Alt = 370 m AGL
Scan 1-clutter
o Scan 9-vortex plus clutter
• Scan 9-vortex plus clutter with smoke
52:10 -
J _ I L , , , I t , _ , L , _ , , I , _ , , I
10 15 20 25 30
Azimuth, deg
Figure A61. As for figure A60, except for azimuth scan 9.
, I
35
46

-75.48
-75.50
-75.52
2
= -75.54O,-2
-75.56
-75.5837.94
17:52:11.0
_/ t7:52:05.0
North
1 Airplane track
o R5 range cell track
o R5 radar
.... No tracking data
\\
\
\
37.92 37.90 37.88 37.86 37.84 37.82 37.80
Latitude, deg
Figure A62. Pass 127 airplane and Radar 5 ground tracks; tail-on radar view of airplane wake.
47
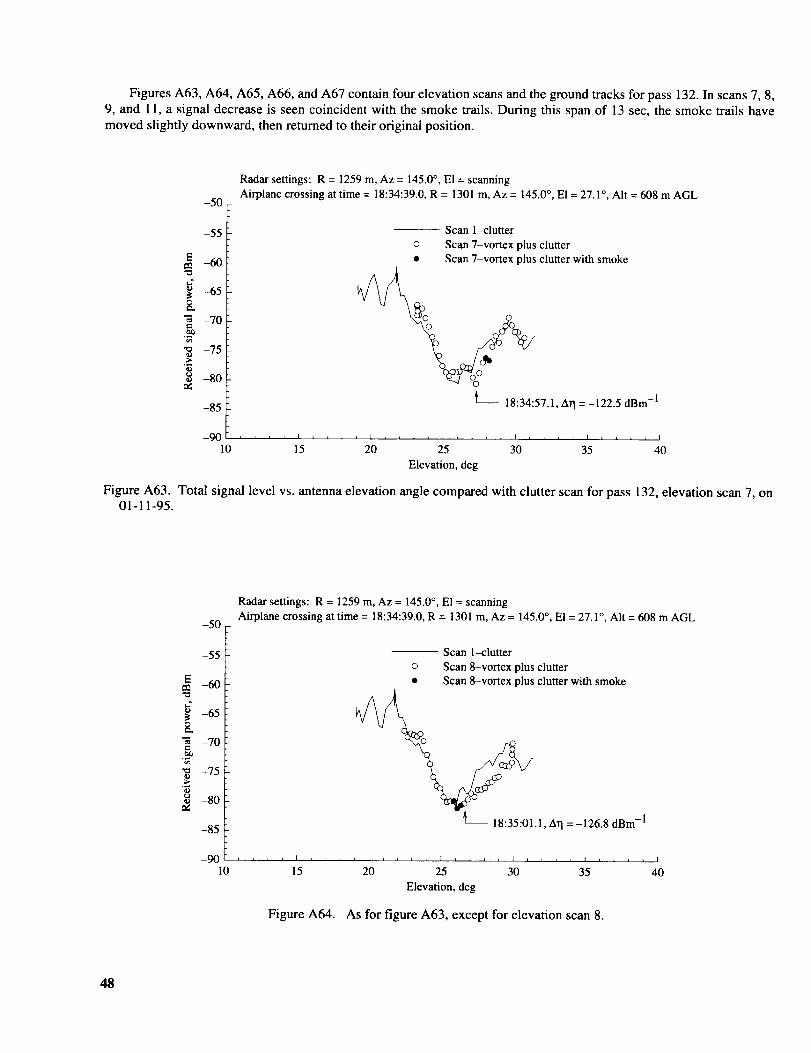
Figures A63, A64, A65, A66, and A67 contain four elevation scans and the ground tracks for pass 132. In scans 7, 8,
9, and 11, a signal decrease is seen coincident with the smoke trails. During this span of 13 sec, the smoke trails have
moved slightly downward, then returned to their original position.
-50
Radar settings: R = 1259 m, Az = 145.0 °, E1 = scanning
Airplane crossing at time = 18:34:39.0, R = 1301 m, Az = 145.0 °, El = 27.1 °, Alt = 608 m AGL
-55
Em -60
0_ -65
-70or)
"_ -75
-80
-85
-- Scan 1-clutter
o Scan 7-vortex plus clutter
• Scan 7-vortex plus clutter with smoke
_-- 18:34:57.1, ATI = -122.5 dBm -1
--90 _ i L i I i _ i _ _ i i i i 1 i L , _ I _ L _ i I L i _ J I
10 15 20 25 30 35 40
Elevation, deg
Figure A63. Total signal level vs. antenna elevation angle compared with clutter scan for pass 132, elevation scan 7, on
01-11-95.
E
_0
e_
-50
-55
-60
-65
-70
-75
-80
-85
-90lO
Radar settings: R = 1259 m, Az = 145.0 °, El = scanning
Airplane crossing at time = 18:34:39.0, R = 1301 m, Az = 145.0 °, El = 27.1 °, Alt = 608 m AGL
-- Scan 1-clutter
o Scan 8-vortex plus clutter
• Scan 8-vortex plus clutter with smoke
_1 _ AT1= -126.8 dBm -1
i r i
15 20 25 30 35
Elevation, deg
i I
40
Figure A64. As for figure A63, except for elevation scan 8.
48
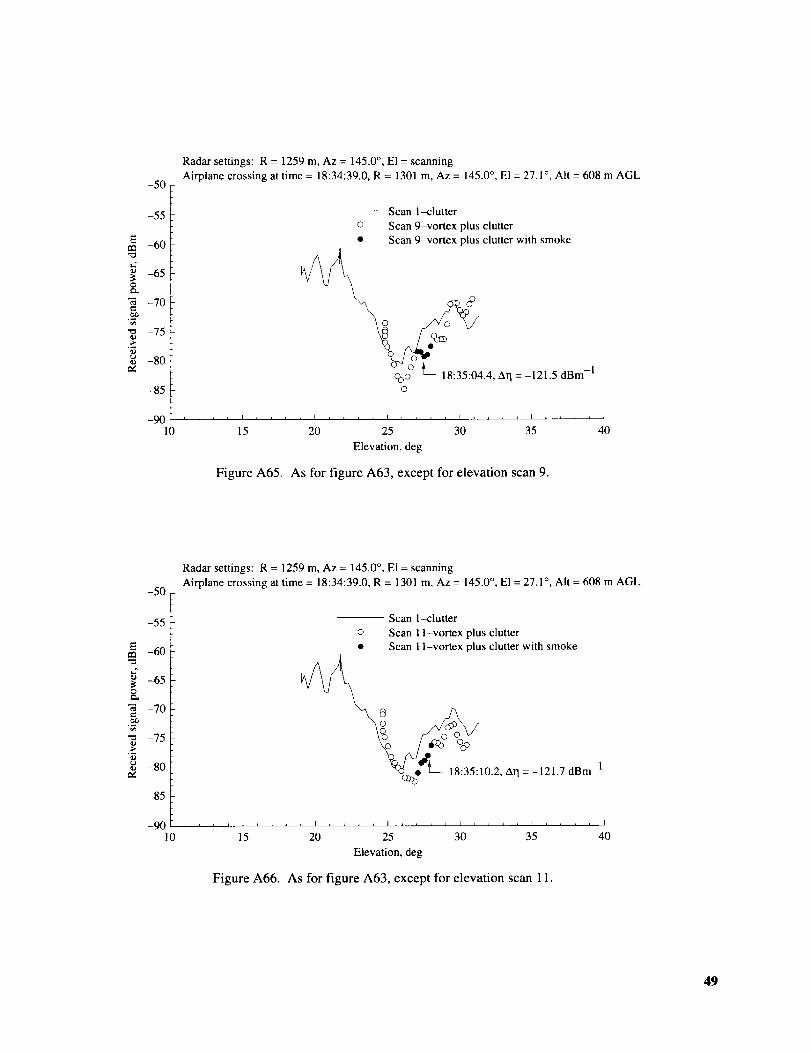
Eea"O
O
-50
-55
-60
-65
-70
-75
-80
-85
-9010
Radar settings: R = 1259 m, Az = 145.0% El = scanning
Airplane crossing at time = 18:34:39.0, R = 1301 m, Az = 145.0 °, El = 27.1 °, Alt = 608 m AGL
-- Scan 1-clutter
o Scan 9-vortex plus clutter
• Scan 9-vortex plus clutter with smoke
o%o 18:35:04.4, Arl = -121.5 dBm -1
O
i _ L I , J , , I J h i _ I I I
15 20 25 30 35
Elevation, deg
Figure A65. As for figure A63, except for elevation scan 9.
J
4O
E
8.
,v
-5O
-55
-60
-65
-70
-75
-80
-85
-9010
Radar settings: R = 1259 m, Az = 145.0 °, El = scanning
Airplane crossing at time = 18:34:39.0, R = 1301 m, Az = 145.0 °, El = 27.1 °, Alt = 608 m AGL
-- Scan l--clutter
o Scan 1 l-vortex plus clutter
• Scan 11-vortex plus clutter with smoke
ee'_---- 18:35:10.2, Arl = -121.7 dBm -1
, i I i I I I I
15 20 25 30 35
Elevation, deg
Figure A66. As for figure A63, except for elevation scan 11.
I
40
49
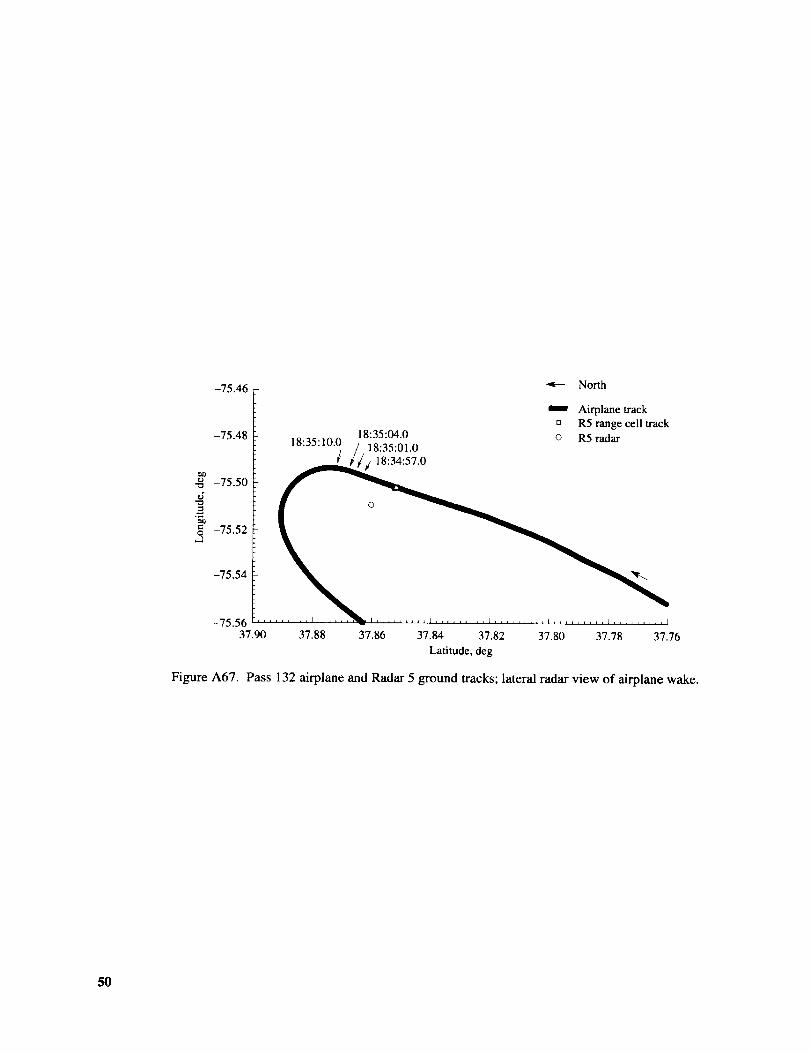
-75.5637.90
18:35:04.018:35:10.0 18:35:01.0
¢_/ 18:34:57.0
North
Airplane track
[] R5 range cell track
o R5 radar
37.88 37.86 37.84 37.82 37.80 37.78 37.76
Latitude, deg
Figure A67. Pass 132 airplane and Radar 5 ground tracks; lateral radar view of airplane wake.
5O

Figures A68, A69, and A70 contain two elevation scans and the ground tracks for pass 137. In scans 7 and 1 1, a
signal increase is seen at the elevation of the smoke trails.
-50
Radar settings: R = 1089 m, Az = 151.0 °, El = scanning
Airplane crossing at time = 19:10:40.6, R = 1031 m, Az = 151.0 °, El = 31.8 °, AIt = 559 m AGL
Ee_
@e_
e¢
-55
-60
-65
-70
-75
-80
-85
-9010
o
i i i
-- Scan l-clutter
Scan 7-vortex plus clutter
Scan 7-vortex plus clutter with smoke
, J _ J _ , L , , , , f _ J , L I L , ,
15 20 25 30
Elevation, deg
, 1 I
35 40
Figure A68. Total signal level vs. antenna elevation angle compared with clutter scan for pass 137, elevation scan 7, on
01-1 1-95.
Ee_
Oe_
e-,
e_
-50
-55
-60
-65
-70
-75
-80
-85
-9010
Radar settings: R = 1089 m, Az = 151.0 °, E1 = scanning
Airplane crossing at time = 19:10:40.6, R = 1031 m, Az = 151.0 °, El = 31.8 °, Air = 559 m AGL
-- Scan 1-clutter
o Scan 11-vortex plus clutter
• Scan 1 l-vortex plus clutter with smoke
i _ _ I i i i i I i i i L I i i i J ] I i i i J J d _ h
15 20 25 30 35
Elevation, deg
Figure A69. As for figure A68, except for elevation scan 11.
I
40
51
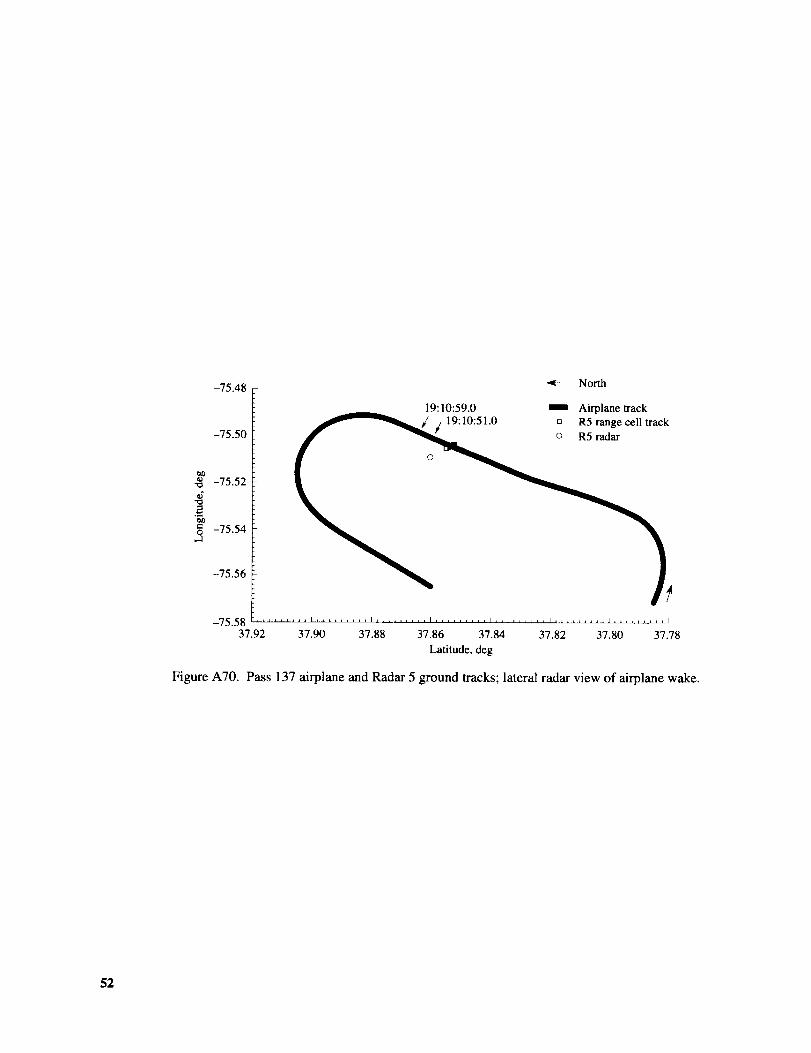
-75.48
-75.50
ot_
._ -75.52
_ -75.54
-75.56
-75.5837.92
North
19:10:59.0 1 Airplane a'ack
i 19:10:51.0 D R5 range cell tracko R5 radar
37.90 37.88 37.86 37.84 37.82 37.80 37.78
Latitude, deg
Figure A70. Pass 137 airplane and Radar 5 ground tracks; lateral radar view of airplane wake.
52

Figures A71, A72, A73, A74, and A75 contain four elevation scans and the ground tracks for pass 141. In scans 7, 8,
9, and 14, a signal level increase is seen at the elevation of the smoke trails.
-50
Radar settings: R = 1089 m, Az = 151.0 °, El = scanning
Airplane crossing at time = 19:37:47.3, R = 1095 m, Az = 151.0°, El = 25.6 °, Alt = 489 m AGL
E
rg
"7,
-55
-60
-65
-70
-75
-80
-85
-9010
©
i i i
_- 19:38:01.0, Arl = -115.8 dBm -1
0 ©
-- Scan l--clutter
Scan 7-vortex plus clutterScan 7-vortex plus clutter with smoke
15 20 25
Elevation, deg
_,1 I I
30 35 40
Figure A71. Total signal level vs. antenna elevation angle compared with clutter scan for pass 141, elevation scan 7, on01-1 1-95.
E
r;O
"3
-50
-55
-60
-65
-70
-75
-80
-85
-9010
Radar settings: R = 1089 m, Az = 151.0 °, E1 = scanningAirplane crossing at time = 19:37:47.3, R = 1095 m, Az = 151.0°, E1 = 25.6 °, Alt= 489 m AGL
_ 19:38:03.7, Ar I = -117.7 dBm -1
-- Scan l-clutter
o Scan 8-vortex plus clutter• Scan 8-vortex plus clutter with smoke
15 20 25 30 35
Elevation, deg
Figure A72. As for figure A71, except for elevation scan 8.
, 4
40
53

-50
-55
Em -60
-65
&-70
"_ -75.._
-80
Radar settings: R = 1089 m, Az = 151.0 °, El = scanning
Airplane crossing at time = 19:37:47.3, R = 1095 m, Az = 151.0 °, El = 25.6 °, Alt = 489 m AGL
19:38:16.8, Arl = -117.0 dBm -1
-- Scan l-clutter
-85 o Scan 14-vortex plus clutter
• Scan 14-vortex plus clutter with smoke
--90 L , _ , I , , , _ I _ _ _ , I _ _ _ _ I , _ _ _ I _ _ _ , I
10 15 20 25 30 35 40
Elevation, deg
Figure A73. As for figure A71, except for elevation scan 14.
-50
Radar settings: R = 1089 m, Az = 151.0 °, E1 = scanning
Airplane crossing at time = 19:37:47.3, R = 1095 m, Az = 151.0 °, El = 25.6 °, Alt = 489 m AGL
-55
Et_ -60
-65O
-70
"_ -75
-80
-- 19:38:24.8, AB = -117.4 dBm -1
O O
-- Scan l-clutter
-85 o Scan 18-vortex plus clutter
• Scan 18-vortex plus clutter with smoke
--90 , , , , I , , , , I , , i , I , _ , , 1 , , _ _ 1 , _ , , I
10 !5 20 25 30 35 40
Elevation, deg
Figure A74. As for figure A71, except for elevation scan 18.
54

"O
e*O
,.d
-75.46
-75.48
-75.50
-75.52
-75.54
-75.56
Figure A75.
North
Airplane track
R5 range cell track
19:38:17.0 o R5 radar19:38:25.0. : : .
i _ iii i i i I i i , I
37.92 37.90 37.88 37.86 37.84 37.82 37.80 37.78
Latitude, deg
Pass 141 airplane and Radar 5 ground tracks; lateral radar view of airplane wake.
55

Figures A76, A77, and A78 contain two elevation scans and the ground tracks for pass 143. In scan 12, a signal
increase is seen coincident with the smoke trails. By scan 27, the smoke had dissipated too much to locate precisely.
Examining scan 27 around 28 °, the elevation of the smoke trails in scan 12, one sees a signal decrease directly above
that point and a signal decrease directly below. This pass was flown using 50 percent flaps, which caused the smoke
trails to be visibly larger initially than the smoke trails with no flaps; the trails also dissipated faster.
-50
Radar settings: R = 1089 m, Az = 151.0 °, El = scanning
Airplane crossing at time = 19:51:49.2 R = 1133 m, Az = 151.0 °, El = 25.7 °, Alt = 507 m AGL
E
t_
e-
"7,
"3
e¢
-55
-60
--65
-70
-75
-80
-85
-9010
O
F 19:52:16.5, All =-116.3 dBm -1
-- Scan l-clutter
Scan 12-vortex plus clutter
Scan 12-vortex plus clutter with smoke
15 20 25 30 35
Elevation, deg
I
40
Figure A76. Total signal level vs. antenna elevation angle compared with clutter scan for pass 143, elevation scan 12, on
01-11-95.
E
"-d
"3
r_
-50
-55
-60
-65
-70
-75
-80
-85
-9010
Radar settings: R = 1089 m, Az = 151.0 °, El = scanning
Airplane crossing at time = 19:51:49.2 R = 1133 m, Az = 151.0 °, El = 25.7 °, AIt = 507 m AGL
©
___ _-- 19:52:54.6, Ar I = -114.5 dBm -1
_ (smoke no longer distinct)
©
Scan 1-clutter
Scan 27-vortex plus clutter
_ J _ I , _ J L I , , L _ I J i L _ I _ _ , _ I _ _ , _ I
15 20 25 30 35 40
Elevation, deg
Figure A77. As for figure A76, except for elevation scan 27.
56
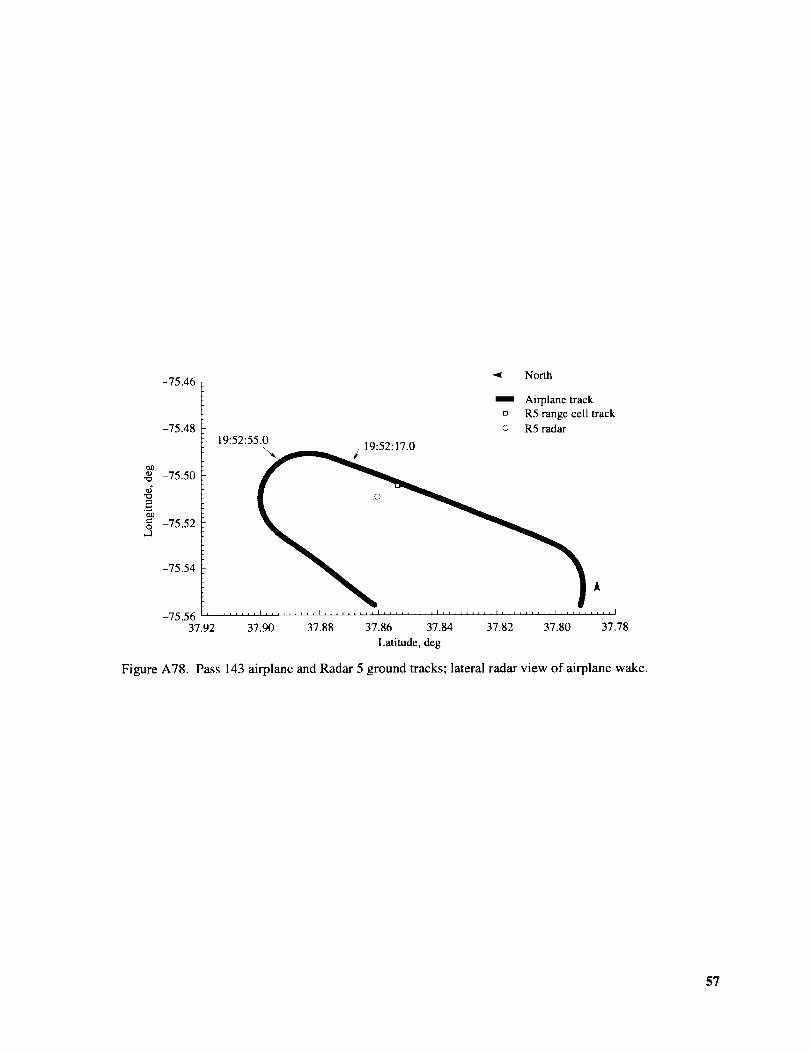
-75.46
-75.48
tao
._ -75.50
g -75.52,.d
-75.54
North
Airplane track
[] R5 range cell track
© R5 radar19:52:55.0
: : .
-75.56 h ......... J I ......... i _ I ......... I37.92 37.90 37.88 37.86 37.84 37.82 37.80 37.78
Latitude, deg
Figure A78. Pass 143 airplane and Radar 5 ground tracks; lateral radar view of airplane wake.
$7

Figures A79 and A80 contain one elevation scan and the ground tracks for pass 149. In scan 5, a signal increase is
seen just above the smoke trails. The clutter scan does not quite reach to the position of the smoke trails.
Figure A79.
01-11-95.
-50
-55 1
Radar settings: R = 1436 m, Az = 141.0 °, El = scanning
Airplane crossing at time = 20:36:45.2, R = 1401 m, Az = 141.0 °, E1 = 14.5 °, Ait = 403 m AGL
ra -60
-65O
-70
"5"_ -75.,>0)
-80
-85
-9010
i L
<3
L
-- 20:36:54.6, Ar I = -113.1 dBm -1
Scan l-clutter \ /Scan 5-vortex plus clutter "-,---x.J
Scan 5-vortex plus clutter with smoke
15 20 25 30 35
Elevation, deg
i , I
40
Total signal level vs. antenna elevation angle compared with clutter scan for pass 149, elevation scan 5, on
-75.46
-75.48
-75.50
.__ol)
_ -75.52
-75.54
-75.5637.90
North
_- Airplane u'ackD R5 range cell track
k o R5 radar
i lilllll _lll _nll_ll k_ll Lllll llL_a ILI II Ill] I Llal _
37.88 37.86 37.84 37.82 37.80 37.78 37.76
Latitude, deg
Figure A80. Pass 149 airplane and Radar 5 ground tracks; lateral radar view of airplane wake.
58
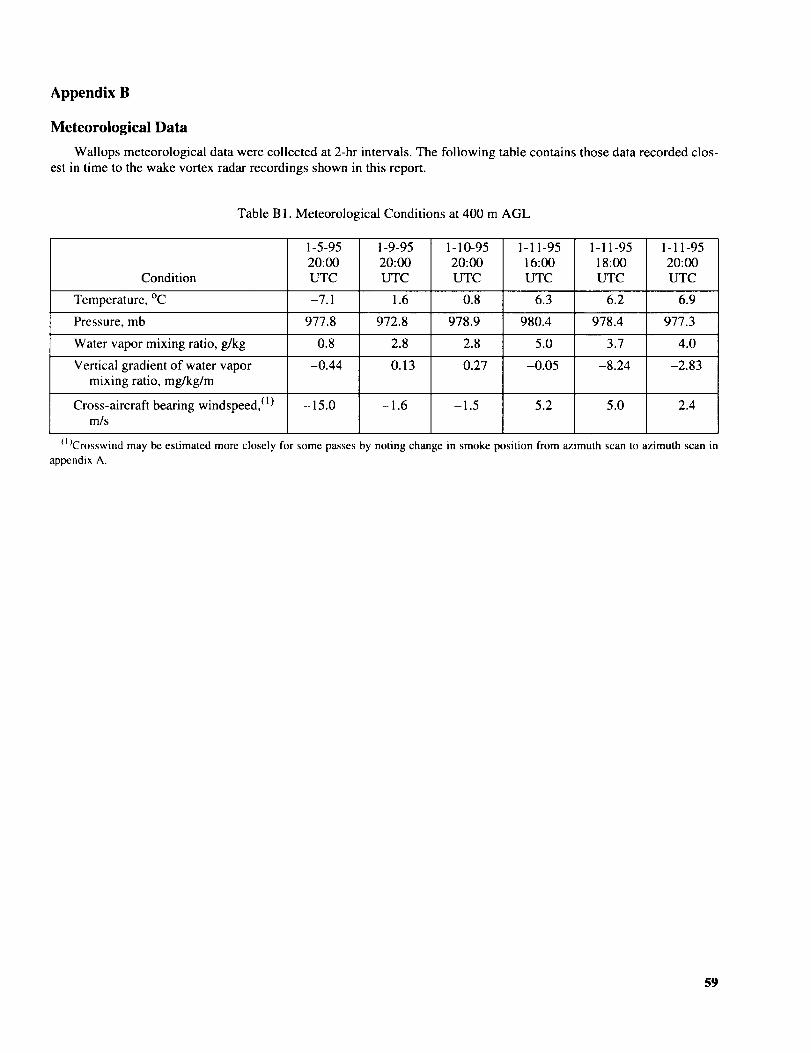
Appendix B
Meteorological Data
Wallops meteorological data were collected at 2-hr intervals. The following table contains those data recorded clos-
est in time to the wake vortex radar recordings shown in this report.
Table B 1. Meteorological Conditions at 400 m AGL
Condition
Temperature, °C
Pressure, mb
Water vapor mixing ratio, g/kg
Vertical gradient of water vapormixing ratio, mg/kg/m
Cross-aircraft beating windspeed, (1)m/s
1-5-95
20:00UTC
-7.1
977.8
0.8
-0.44
-15.0
1-9-95
20:00UTC
1.6
972.8
2.8
0.13
-1.6
1-10-95
20:00UTC
0.8
978.9
2.8
0.27
-1.5
1-11-95
16:00UTC
6.3
980.4
5.0
-0.05
5.2
1-11-95
18:00UTC
6.2
978.4
3.7
-8.24
5.0
1-11-95
20:00UTC
6.9
977.3
4.0
-2.83
2.4
(l JCrosswind may be estimated more closely for some passes by noting change in smoke position from azimuth scan to azimuth scan inappendix A.
59

Appendix C
Variability of Clutter Powerat Various Time Lags
Thisappendixpresentstheunsmoothedvaluesusedto createfigures5 and 6 in the text. Note that azimuth is the
interpolated antenna position in degrees, SD power is the standard deviation of the change in received power after thegiven time lag in dBm, time refers to the time lag given in seconds, and N denotes the number of samples.
Table C2. Unsmoothed Data for Figure 5, Azimuth Scans at 20 ° Elevation
SD
Azimuth power Time
10.750010.750010.7500
10.750010.7500
10.750011.0000
11.000011.0000
11.000011.000011.0000
11.2500I 1.2500
11.250011.250011.2500
11.250011.5000
11.500011.500011.5000
11.500011.5000
11.750011.7500
11.750011.7500
I 1.750011.750012.0000
12.000012.0000
12.000012.0000
12.000012.250012.2500
12.250012.2500
12.250012.2500
12.5000
1.865162.04956
1.992102.08377
2.191362.428652.09604
2.217902.01227
2.006222.251412.28617
2.338212.38351
2.430082.11737
2.350722.421062.29717
2.109022.15305
2.111392.093812.14627
2.11190
2.143091.938402.14580
1.962442.04499
2.498372.545772.53014
2.575672.50777
2.346072.68786
2.641232.567342.64848
2.735082.57608
2.61319
N
1.75279 49 12.5000
36.2105 98 12.500072.4204 96 12.5000108.645 94 12.5000
144.878 92 12.5000181.121 90 12.7500
1.96620 49 12.750036.2104 98 12.7500
72.4202 96 12.7500108.645 94 12.7500
144.878 92 12.7500181.121 90 13.00002.17793 49 13.000036.2104 98 13.0000
72.4202 96 13.0000
108.645 94 13.0000144.878 92 13.0000181.121 90 13.2500
2.39070 49 13.250036.2104 98 13.2500
72.4202 96 13.2500108.645 94 13.2500144.878 92 13.2500
181.121 90 13.50002.60196 49 13.5000
36.2105 98 13.500072.4203 96 13.5000108.645 94 13.5000
144.878 92 13.5000181.121 90 13.7500
2.81354 49 13.750036.2104 98 13.7500
72.4203 96 13.7500108.645 94 13.7500
144.878 92 13.7500181.121 90 14.00003.02431 49 14.0000
36.2104 98 14.000072.4202 96 14.0000
108.645 94 14.0000144.878 92 14.0000
181.121 90 14.25003.23453 49 14.2500
SD
Azimuth power Time
2.27141
2.294272.33967
2.401252.20463
2.227542.020641.95228
1.983842.07850
2.114701.972591.91869
2.100052.07644
2.191862.108901.92246
1.932792.05842
2.150232.26410
1.902991.90492
2.174992.040021.90837
2.281301.99290
2.144902.12263
2.091522.09159
2.112291.969202.24227
2.119062.06138
2.032372.078351.95188
2.27116
2.20321
N
36.2104 98 14.250072.4202 96 14.2500108.645 94 14.2500
144.878 92 14.2500181.121 90 14.5000
3.44523 49 14.500036.2104 98 14.5000
72.4202 96 14.5000108.645 94 14.5000144.878 92 14.5000
181.121 90 14.75003.65553 49 14.7500
36.2105 98 14.750072.4203 96 14.7500
108.645 94 14.7500144.878 92 14.7500181.121 90 15.0000
3.86567 49 15.000036.2105 98 15.0000
72.4204 96 15.0000108.645 94 15.0000144.878 92 15.0000
181.121 90 15.2500
4.07518 49 15.250036.2104 98 15.2500
72.4202 96 15.2500108.645 94 15.2500144.878 92 15.2500
181.121 90 15.50004.28508 49 15.500036.2103 98 15.5000
72.4202 96 15.5000108.645 94 15.5000
144.878 92 15.5000181.121 90 15.7500
4.49522 49 15.750036.2103 98 15.7500
72.4202 96 15.7500108.645 94 15.7500144.878 92 15.7500
181.121 90 16.00004.70416 49 16.0000
36.2105 98 16.0000
SD
Azimuth power Time
2.32172
2.166272.1 64662.13369
2.162392.02886
2.202611.91414
2.093062.083512.38763
2.339282.53594
2.359142.441 I0
2.575102.374662.18045
2.187222.250012.29479
2.309622.23267
1.95569
1.980442.268552.16308
2.231902.32088
2.046362.066392.42046
2.086692.09342
2.492862.21316
2.139512.42093
2.206312.264842.28421
2.196362.16279
N
72.4204 96
108.645 94144.878 92
181.121 904.91406 49
36.2104 9872.4202 96108.645 94
144.878 92181.121 90
5.12317 4936.2104 98
72.4202 96108.645 94
144.878 92181.121 905.33251 4936.2103 98
72.4202 96
108.645 94144.878 92181.121 90
5.54098 4936.2105 98
72.4204 96108.645 94
144.878 92181.121 905.75096 49
36.2104 9872.4202 96108.645 94
144.878 92
181.121 905.95982 49
36.2103 9872.4202 96108.645 94
144.878 92181.121 906.16773 49
36.2104 98
72.4202 96
60
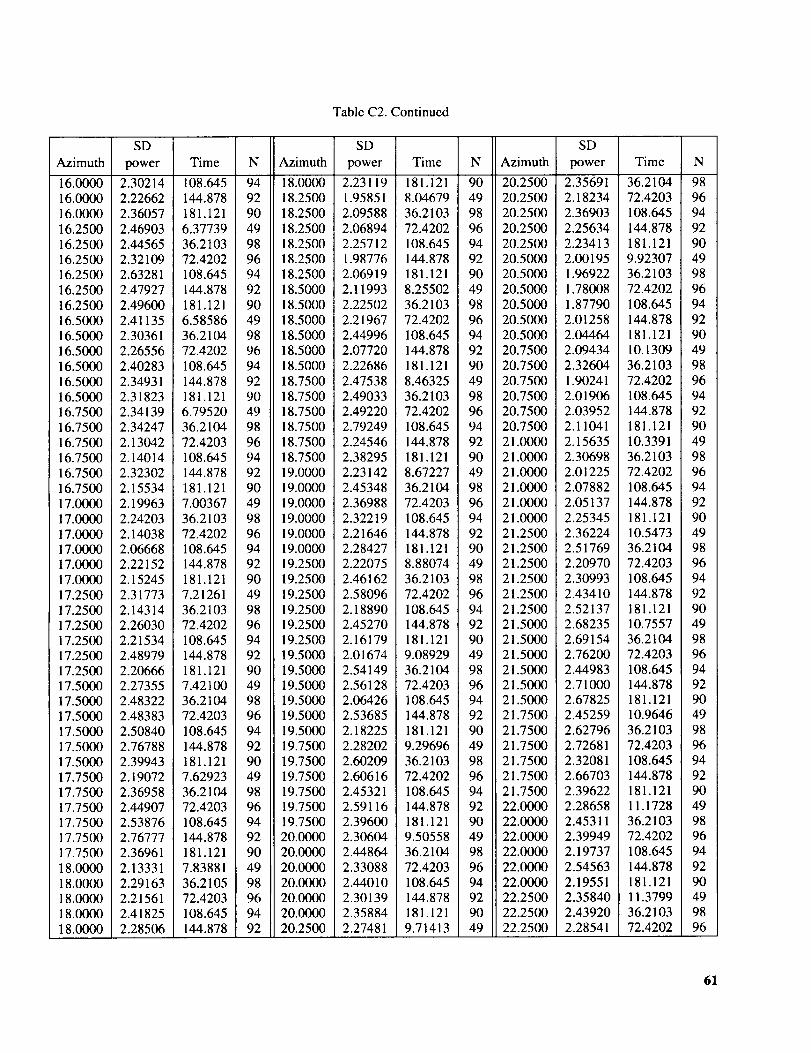
Table C2. Continued
SD
Azimuth power Time
16.0000
16.000016.0000
16.250016.2500
16.250016.2500
16.250016.2500
16.500016.500016.5000
16.5000
16.500016.500016.7500
16.7500
16.750016.750016.7500
16.750017.0000
17.000017.000017.0000
17.000017.0000
17.2500
17.250017.250017.2500
17.250017.250017.5000
17.500017.500017.5000
17.5000
17.500017.750017.7500
17.750017.750017.7500
17.750018.0000
18.000018.0000
18.000018.0000
2.30214
2.226622.36057
2.469032.44565
2.321092.63281
2.479272.49600
2.411352.303612.26556
2.402832.34931
2.318232.34139
2.342472.13042
2.140142.32302
2.155342.19963
2.242032.140382.06668
2.221522.15245
2.317732.14314
2.260302.215342.48979
2.206662.273552.48322
2.483832.50840
2.767882.39943
2.190722.36958
2.449072.538762.76777
2.369612.13331
2.291632.21561
2.418252.28506
108.645144.878
181.t216.37739
36.210372.4202
108.645144.878
181.1216.58586
36.210472.4202
108.645144.878
181.1216.79520
36.210472.4203
108.645144.878181.121
7.00367
36.210372.4202108.645144.878
181.121
7.2126136.2103
72.4202108.645144.878
181.1217.4210036.2104
72.4203108.645
144.878181.121
7.6292336.210472.4203
108.645144.878181.121
7.83881
36.210572.4203108.645
144.878
N
9492
9049
9896
9492
9049
9896
9492
9049
989694
9290
4998
969492
90
499896
9492
90499896
94
929049
9896
949290
4998
9694
92
SD
Azimuth power Time
18.000018.2500
18.250018.2500
18.250018.2500
18.250018.5000
18.500018.5000
18.500018.5000
18.500018.750018.7500
18.750018.7500
18.750018.7500
19.000019.0000
19.000019.0000
19.000019.000019.2500
19.2500
19.250019.250019.2500
19.250019.500019.5000
19.500019.500019.5000
19.5000
19.750019.750019.7500
19.750019.750019.7500
20.000020.0000
20.000020.0000
20.000020.0000
20.2500
2.231191.95851
2.095882.06894
2.257121.98776
2.069192.11993
2.225022.21967
2.449962.077202.22686
2.475382.49033
2.492202.79249
2.245462.38295
2.231422.45348
2.369882.32219
2.216462.284272.22075
2.461622.58096
2.188902.45270
2.161792.016742.54149
2.561282.064262.53685
2.182252.28202
2.602092.60616
2.453212.591162.39600
2.306042.44864
2.330882.44010
2.301392.358842.27481
181.1218.04679
36.210372.4202
108.645144.878
181.1218.25502
36.210372.4202108.645
144.878181.121
8.4632536.2103
72.4202108.645
144.878181.121
8.6722736.2104
72.4203108.645
144.878181.1218.88074
36.210372.4202
108.645144.878181.121
9.0892936.2104
72.4203108.645144.878
181.1219.29696
36.210372.4202
108.645144.878181.121
9.5055836.210472.4203
108.645144.878
181.1219.71413
N
9049
9896
9492
9049
989694
9290
4998
9694
9290
4998
969492
9049
9896
9492
904998
969492
9049
9896
94929049
9896
9492
9049
SD
Azimuth power Time
20.250020.2500
20.250020.2500
20.250020.500020.5000
20.5000
20.500020.500020.5000
20.750020.7500
20.750020.7500
20.750020.7500
21.000021.0000
21.000021.000021.0000
21.000021.2500
21.250021.2500
21.250021.2500
21.250021.500021.5000
21.500021.500021.5000
21.500021.7500
21.750021.7500
21.750021.750021.7500
22.000022.000022.0000
22.000022.0000
22.000022.2500
22.250022.2500
2.356912.182342.36903
2.25634
2.234132.001951.96922
1.780081.87790
2.012582.04464
2.094342.32604
1.902412.01906
2.039522.11041
2.156352.306982.01225
2.078822.05137
2.253452.362242.51769
2.20970
2.3O9932.43410
2.521372.682352.691542.76200
2.449832.710002.67825
2.45259
2.627962.726812.32081
2.667032.39622
2.286582.453112.39949
2.197372.54563
2.195512.35840
2.439202.28541
36.2104
72.4203108.645
144.878
181.1219.9230736.2103
72.4202108.645
144.878181.12110.1309
36.210372.4202
108.645144.878
181.12110.3391
36.210372.4202
108.645144.878
181.12110.547336.2104
72.4203108.645
144.878181.121
10.755736.210472.4203
108.645144.878181.121
10.964636.2103
72.4203108.645
144.878181.12111.1728
36.210372.4202108.645
144.878
181.12111.379936.2103
72.4202
N
98
9694
9290
4998
9694
929049
9896
9492
9049
9896
9492
904998
9694
929049
9896
949290
4998
969492
9049
989694
92
904998
96
61

SDAzimuth power Time22.250022.250022.250022.500022.500022.500022.500022.500022.500022.750022.750022.750022.750022.750022.750023.000023.000023.000023.000023.000023.000023.250023.250023.250023.250023.250023.250023.500023.500023.500023.500023.500023.500023.750023.750023.750023.750023.750023.750024.000024.000024.000024.000024.000024.000024.250024.250024.250024.250024.2500
2.177202.459062.221492.368932.547822.420532.123472.544502.268302.193622.614832.434292.349622.539502.357492.329602.708572.685302.514632.565792.548882.356622.403872.443012.161762.327692.481182.443692.501412.617252.172502.415492.659272.245212.446392.612252.122132.332372.660002.096912.412412.515101.977762.249892.558882.149162.410142.460292.062582.22470
108.645144.878181.12111.589136.210372.4202108.645144.878181.12111.797436.210472.4204108.645144.878181.12112.006936.210372.4202108.645144.878181.12112.214436.210372.4202108.645144.878181.12112.421336.210372.4202108.645144.878181.12112.630736.210372.4203108.645144.878181.12112.839336.210572.4204108.645144.878181.12113.048736.210472.4203108.645144.878
TableC2.Continued
N94929O4998969492904998969492904998969492904998969492904998969492904998969492904998969492904998969492
SDAzimuth power Time24.250024.500024.500024.500024.500024.500024.500024.750024.750024.750024.750024.750024.750025.000025.000025.000025.000025.000025.000025.250025.250025.250025.250025.250025.250025.500025.500025.500025.500025.500025.500025.750025.750025.750025.750025.750025.750026.000026.000026.000026.000026.000026.000026.250026.250026.250026.250026.250026.250026.5000
2.427361.934332.507192.547122.089762.241052.292612.156632.712252.678432.344772.478392.486542.495032.923172.887672.679662.562982.688092.340832.673702.652732.775892.562912.677152.198182.588912.590032.764762.571362.504672.263142.816322.671672.764202.534612.721862.524533.080862.646132.794772.590572.741422.869043.091722.911523.333142.939552.773002.66045
181.12113.256136.210272.4202108.645144.878181.12113.464136.210372.4203108.645144.878181.12113.672836.210472.4202108.645144.878181.12113.881536.210372.4203108.645144.878181.12114.090536.210372.4203108.645144.878181.12114.298036.210372.4202108.645144.878181.12114.506636.210472.4203108.645144.878181.12114.715136.210472.4204108.645144.878181.12114.9235
N9049989694929049989694929049989694929049989694929049989694929049989694929049989694929049989694929049
SDAzimuth power Time26.500026.500026.500026.500026.500026.750026.750026.750026.750026.750026.750027.000027.000027.000027.000027.000027.000027.250027.250027.250027.250027.250027.250027.500027.500027.500027.500027.500027.500027.750027.750027.750027.750027.750027.750028.000028.000028.000028.000028.000028.000028.250028.250028.250028.250028.250028.250028.500028.500028.5000
2.815622.826353.006142.692452.932952.381222.688902.548342.886942.923622.706781.946582.243582.264692.540052.536612.199212.169992.166112.149912.492132.312402.008262.252782.120202.095792.391712.254192.344142.163812.253442.052262.331212.159822.180281.987262.218062.180752.430722.098192.438222.334702.552792.739862.738762.389702.923022.517652.728862.78159
36.210372.4202108.645144.878181.12115.131936.210372.4203108.645144.878181.12115.339836.210372.4202108.645144.878181.12115.548536.210372.4203108.645144.878181.12115.756836.210472.4204108.645144.878181.12115.966036.210472.4204108.645144.878181.12116.175136.210372.4204108.645144.878181.12116.382736.210372.4202108.645144.878181.12116.591736.210472.4204
N9896949290499896949290499896949290499896949290499896949290499896949290499896949290499896949290499896
62
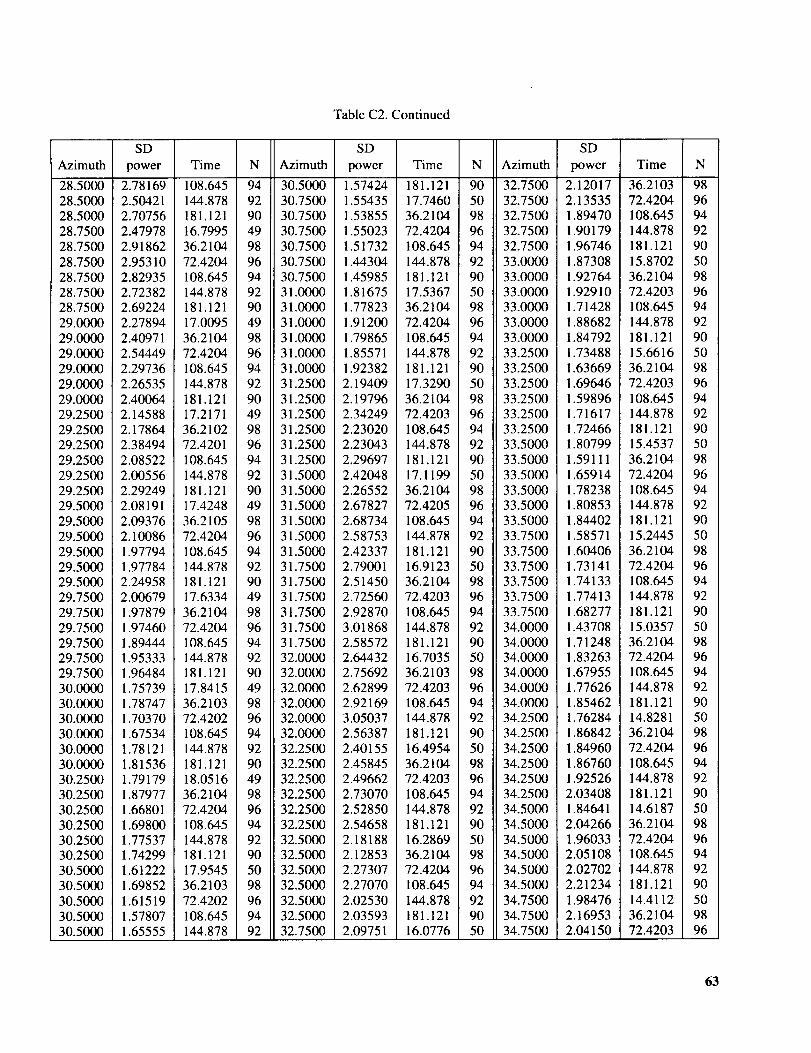
SDAzimuth power Time28.500028.500028.500028.750028.750028.750028.750028.750028.750029.000029.000029.000029.000029.000029.000029.250029.250029.250029.250029.250029.250029.500029.500029.500029.500029.500029.500029.750029.750029.750029.750029.750029.750030.000030.000030.000030.000030.000030.000030.250030.250030.250030.250030.250030.250030.500030.500030.500030.500030.5000
2.781692.504212.707562.479782.918622.953102.829352.723822.692242.278942.409712.544492.297362.265352.400642.145882.178642.384942.085222.005562.292492.081912.093762.100861.977941.977842.249582.006791.978791.974601.894441.953331.964841.757391.787471.703701.675341.781211.815361.791791.879771.668011.698001.775371.742991.612221.698521.615191.578071.65555
108.645144.878181.12116.799536.210472.4204108.645144.878181.12117.009536.210472.4204108.645144.878181.12117.217136.210272.4201108.645144.878181.12117.424836.210572.4204108.645144.878181.12117.633436.210472.4204108.645144.878181.12117.841536.210372.4202108.645144.878181.12118.051636.210472.4204108.645144.878181.12117.954536.210372.4202108.645144.878
N9492904998969492904998969492904998969492904998969492904998969492904998969492904998969492905098969492
TableC2.Continued
SDAzimuth power Time30.500030.750030.750030.750030.750030.750030.750031.000031.000031.000031.000031.000031.000031.250031.250031.250031.250031.250031.250031.500031.500031.500031.500031.500031.500031.750031.750031.750031.750031.750031.750032.000032.000032.000032.000032.000032.000032.250032.250032.250032.250032.250032.250032.500032.500032.500032.500032.500032.500032.7500
1.574241.554351.538551.550231.517321.443041.459851.816751.778231.912001.798651.855711.923822.194092.197962.342492.230202.230432.296972.420482.265522.678272.687342.587532.423372.790012.514502.725602.928703.018682.585722.644322.756922.628992.921693.050372.563872.401552.458452.496622.730702.528502.546582.181882.128532.273072.270702.025302.035932.09751
181.12117.746036.210472.4204108.645144.878181.12117.536736.210472.4204108.645144.878181.12117.329036.210472.4203108.645144.878181.12117.119936.210472.4205108.645144.878181.12116.912336.210472.4203108.645144.878181.12116.703536.210372.4203108.645144.878181.12116.495436.210472.4203108.645144.878181.12116.286936.210472.4204108.645144.878181.12116.0776
N905098969492905O989694929050989694929050989694929050989694929050989694929050989694929050989694929050
SDAzimuth power Time32.750032.750032.750032.750032.750033.000033.000033.000033.000033.000033.000033.250033.250033.250033.250033.250033.250033.500033.500033.500033.500033.500033.500033.750033.750033.750033.750033.750033.750034.000034.000034.000034.000034.000034.000034.250034.250034.250034.250034.250034.250034.500034.500034.500034.500034.500034.500034.750034.750034.7500
2.120172.135351.894701.901791.967461.873081.927641.929101.714281.886821.847921.734881.636691.696461.598961.716171.724661.807991.591111.659141.782381.808531.844021.585711.604061.731411.741331.774131.682771.437081.712481.832631.679551.776261.854621.762841.868421.849601.867601.925262.034081.846412.042661.960332.051082.027022.212341.984762.169532.04150
36.210372.4204108.645144.878181.12115.870236.210472.4203108.645144.878181.12115.661636.210472.4203108.645144.878181.12115.453736.210472.4204108.645144.878181.12115.244536.210472.4204108.645144.878181.12115.035736.210472.4204108.645144.878181.12114.828136.210472.4204108.645144.878181.12114.618736.210472.4204108.645144.878181.12114.411236.210472.4203
N989694929O5O989694929O5O98969492905O9896949290509896949290509896949290509896949290509896949290509896
63

TableC2.Continued
SDAzimuth power Time34.750034.750034.750035.000035.000035.000035.000035.000035.000035.250035.250035.250035.250035.250035.250035.500035.500035.500035.500035.500035.500035.750035.750035.750035.750035.750035.750036.000036.0(036.000036.000036.000036.000036.250036.250036.250036.250036.250036.250036.500036.500036.500036.500036.500036.500036.750036.750036.750036.750036.7500
2.192652.156942.294982.128742.152652.131702.323602.210612.323092.229312.603002.548492.732082.363962.408642.514402.827652.636652.871082.625832.635342.544462.804662.634782.879032.858202.876282.296452.656312.734392.617693.084722.895012.634652.719542.836682.677472.881032.859752.749042.835852.766092.877732.945462.748402.426832.533082.560562.553882.43414
108.645144.878181.12114.202636.210372.4203108.645144.878181.12113.993636.210472.4204108.645144.878181.12113.786236.210472.4203108.645144.878181.12113.578036.210372.4203108.645144.878181.12113.369236.210372.4203108.645144.878181.12113.160536.210472.4204108.645144.878181.12112.953236.210372.4203108.645144.878181.12112.744636.210372.4202108.645144.878
N94929O5O98969492905O98969492905098969492905098969492905098969492905098969492905098969492905098969492
SDAzimuth power Time36.750037.000037.000037.000037.000037.000037.000037.250037.250037.250037.250037.250037.250037.500037.500037.500037.500037.500037.500037.750037.750037.750037.750037.750037.750038.000038.000038.000038.000038.000038.000038.250038.250038.250038.250038.250038.250038.500038.500038.500038.500038.500038.500038.750038.750038.750038.750038.750038.750039.0000
2.612362.154562.514552.518342.512002.520252.575162.509242.605352.445482.701102.827692.704132.524632.574342.392902.687492.817512.577922.275462.390842.360632.346742.665352.331862.202872.257172.339712.198042.524932.147452.322342.342472.403062.404142.424622.159642.016042.249612.204732.250272.100632.145712.243442.466062.318272.307002.290382.428372.70879
181.12112.535936.210472.4204108.645144.878181.12112.328436.210372.4203108.645144.878181.12112.118636.210472.4204108.645144.878181.12111.911436.210372.4203108.645144.878181.12111.702536.210472.4203108.645144.878181.12111.493936.210472.4203108.645144.878181.12111.285936.210472.4204108.645144.878181.12111.077336.210372.4204108.645144.878181.12110.8684
N905O989694929050989694929050989694929050989694929050989694929050989694929050989694929050989694929050
SDAzimuth power Time39.000039.000039.000039.000039.000039.250039.250039.250039.250039.250039.250039.500039.500039.500039.500039.500039.500039.750039.750039.750039.750039.750039.750040.000040.000040.000040.000040.000040.000040.250040.250040.250040.250040.250040.250040.500040.500040.500040.500040.500040.500040.750040.750040.750040.750040.750040.750041.000041.000041.0000
2.470232.738762.538802.693472.653282.498962.549142.494812.635712.595762.776322.680722.837512.719052.943212.765383.082592.485792.880772.854343.000772.869503.053002.596552.876812.707062.962282.788383.053213.419553.584353.058403.577923.336583.366943.302353.711733.178913.343043.228183.340053.441613.472642.997203.197963.044473.137843.256373.013012.87563
36.210472.4204108.645144.878181.12110.660936.210472.4203108.645144.878181.12125.761236.210372.4204108.645144.878181.12110.242936.210372.4204108.645144.878181.12110.035036.210372.4203108.645144.878181.1219.8262536.210472.4204108.645144.878181.1219.6181236.210372.4203108.645144.878181.1219.4087536.210372.4202108.645144.878181.1219.2003136.210472.4204
N
98
9694
9290
509896
9492
9049
9896
949290
5098
9694
9290
509896
9492
905098
96
949290
5098
969492
9050
98
969492
905098
96
64

SD
Azimuth power Time
41.0000
41.000041.0000
41.250041.2500
41.250041.2500
41.250041.2500
41.500041.500041.5000
41.5000
41.500041.500041.7500
41.750041.7500
41.750041.7500
41.750042.0000
42.000042.000042.0000
42.000042.0000
42.250042.2500
42.250042.2500
42.250042.250042.5000
42.500042.5000
42.500042.5000
42.500042.750042.7500
42.750042.750042.7500
42.750043.0000
43.000043.0000
43.000043.0000
2.77996
3.113273.11469
3.133193.38934
3.258122.93710
3.531313.31535
3.232393.257623.21970
3.12211
3.344783.334862.88262
3.076252.83180
3.033643.05406
3.021642.41600
2.761292.518102.61954
2.800112.79156
2.726612.42469
2.574782.62849
2.469902.660582.64288
2.636432.42356
2.508092.647682.71414
2.392522.82037
2.295882.560492.67069
2.574002.51329
2.810362.38392
2.666912.52507
108.645
144.878181.121
8.9916436.2104
72.4204108.645
144.878181.121
8.7829736.210472.4204
108.645
144.878181.1218.57477
36.210472.4204
108.645144.878
181.1218.36625
36.210372.4203108.645
144.877181.121
8.1565636.2104
72.4204108.645
144.878181.1217.94859
36.210472.4204108.645
144.878
181.1217.7403136.2104
72.4203108.645144.878
181.1217.53086
36.210372.4203
108.645144.878
Table C2. Continued
N
94
9290
5O98
9694
929O
509896
94
92905O
9896
9492
905O
989694
929O
5O
989694
92905O
989694
929O
5O98
969492
9O50
9896
9492
SD
Azimuth power Time
43.0000
43.250043.2500
43.250043.2500
43.250043.2500
43.500043.5000
43.500043.5000
43.500043.5000
43.750043.750043.7500
43.7500
43.750043.750044.0000
44.000044.0000
44.000044.000044.0000
44.250044.2500
44.2500
44.250044.250044.2500
44.500044.500044.5000
44.500044.5000
44.500044.7500
44.750044.750044.7500
44.750044.750045.0000
45.000045.0000
45.000045.0000
45.000045.2500
2.58887
2.412532.32940
2.522812.41275
2.116842.31436
2.390442.15895
2.362612.33989
2.331142.40060
2.115312.298092.41371
2.42139
2.552702.434652.41365
2.752522.78381
2.735433.078322.84249
2.538332.84194
2.79412
2.672673.065852.90050
2.635332.980382.83930
2.613392.867542.90864
2.65179
2.821542.789262.57978
3.018832.861832.30119
2.461142.41526
2.360132.81441
2.485662.00555
181.121
7.3220336.2103
72.4203108.645
144.878181.121
7.1144536.2104
72.4204108.645144.878
181.121
6.9053136.210472.4203
108.645144.878
181.1216.69688
36.210372.4203
108.645144.878181.121
6.4878136.2104
72.4204108.645
144.878181.1216.27906
36.210372.4203108.645
144.878181.121
6.0696936.2104
72.4204108.645144.878
181.1215.86078
36.210472.4204108.645
144.878
181.1215.65234
N
90
509896
94
9290
509896
9492
9050
9896
9492
9050
989694
9290
5098
9694
929050
989694
9290
5098
969492
905098
9694
9290
50
SD
Azimuth power Time
45.2500
45.250045.250045.2500
45.2500
45.500045.500045.5000
45.500045.5000
45.500045.7500
45.750045.7500
45.750045.7500
45.750046.0000
46.000046.000046.0000
46.000046.0000
46.250046.250046.2500
46.2500
46.250046.2500
46.500046.500046.500046.5000
46.500046.5000
46.750046.7500
46.750046.7500
46.750046.750047.0000
47.000047.000047.0000
47.000047.0000
47.250047.2500
47.2500
2.12263
2.268262.337122.48383
2.20208
1.884462.025192.21742
2.181952.30025
2.139591.78210
2.290272.28566
2.118672.37928
2.345251.78813
2.453752.27303
2.240052.684772.48650
1.967692.694172.46670
2.59593
2.695002.70540
1.859962.449412.152582.55554
2.308112.55700
2.311442.59643
2.597572.736742.42758
2.927442.47547
2.701412.633412.89840
2.581922.99951
2.508342.56408
2.44458
36.2103
72.4203108.645144.877
181.121
5.4430536.210472.4204
108.645144.878
181.1215.23336
36.210372.4203
108.645144.878
181.1215.02422
36.210372.4203108.645
144.878181.121
4.8149236.210472.4204
108.645
144.878181.1214.60609
36.210472.4203108.645
144.877181.1214.39531
36.2103
72.4204108.645144.878
181.1214.1861736.2103
72.4203108.645
144.878181.121
3.9756336.2104
72.4204
N
98
969492
90
509896
9492
9050
9896
9492
9050
989694
9290
509896
94
929050
989694
929050
98
969492
905098
9694
9290
5098
96
65
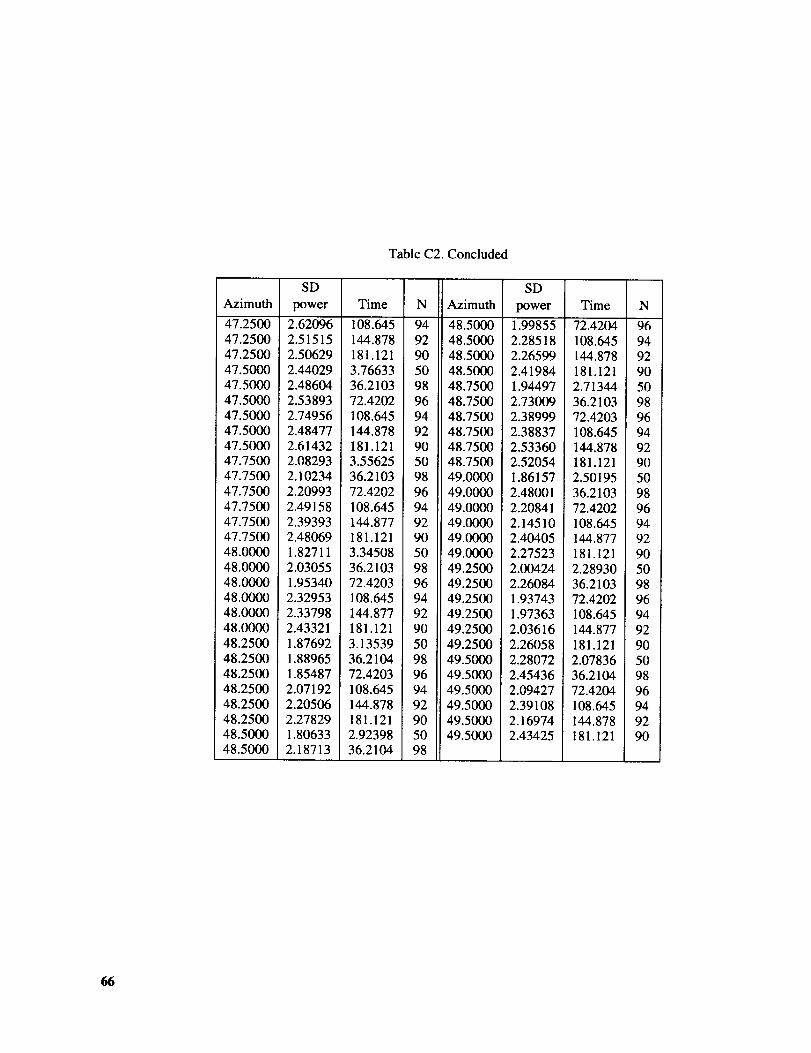
TableC2.Concluded
SDAzimuth power Time47.250047.250047.250047.500047.500047.500047.500047.500047.500047.750047.750047.750047.750047.750047.750048.000048.000048.000048.000048.000048.000048.250048.250048.250048.250048.250048.250048.500048.5000
2.620962.515152.506292.440292.486042.538932.749562.484772.614322.082932.102342.209932.491582.393932.480691.827112.030551.953402.329532.337982.433211.876921.889651.854872.071922.205062.278291.806332.18713
108.645144.878181.1213.7663336.210372.4202108.645144.878181.1213.5562536.210372.4202108.645144.877181.1213.3450836.210372.4203108.645144.877181.1213.1353936.210472.4203108.645144.878181.1212.9239836.2104
N94 48.500092 48.500090 48.500050 48.500098 48.750096 48.750094 48.750092 48.750090 48.750050 48.750098 49.000096 49.000094 49.000092 49.000090 49.000050 49.000098 49.250096 49.250094 49.250092 49.250090 49.250050 49.250098 49.500096 49.500094 49.500092 49.500090 49.500050 49.500098
SDAzimuth power Time
1.99855
2.285182.26599
2.419841.94497
2.730092.389992.38837
2.533602.520541.86157
2.480012.20841
2.145102.40405
2.275232.00424
2.260841.937431.97363
2.036162.26058
2.280722.45436
2.094272.39108
2.169742.43425
72.4204
108.645144.878
181.1212.71344
36.210372.4203
108.645144.878181.121
2.5019536.2103
72.4202108.645
144.877181.1212.28930
36.210372.4202
108.645144.877181.121
2.0783636.2104
72.4204108.645
144.878181.121
N
96
9492
90
5O9896
949290
5O98
9694
9290
5O9896
9492
905098
96
949290
66

SDElevation power11.0000 2.3238111.0000 2.5828811.0000 2.7019511.0000 2.8081711.0000 2.8922811.0000 2.7297711.2500 2.2098911.2500 2.4267711.2500 2.6964211.2500 2.7795111.2500 2.8282211.2500 2.9349111.5000 2.7637011.5000 2.6681811.5000 2.9920611.5000 3.0283411.5000 3.0694611.5000 3.1761911.7500 2.3710111.7500 2.4033011.7500 2.8653411.7500 2.8777711.7500 3,0653911.7500 3.0564212.0000 2.2387712.0000 2.2741212.0000 2.5474312.0000 2.6466212.0000 2.5747412.0000 2.6387712.2500 2.2822612.2500 2.3883212.2500 2.6089912.2500 2.5160512.2500 2.7426812.2500 2.5612912.5000 1.8262112.5000 2.3322912.5000 2.4951712.5000 2.4201112.5000 2.6266112.5000 2.4760812.7500 1.5947312.7500 2.3318012.7500 2.6049812.7500 2.4408912.7500 2.5066312.7500 2.5938213.0000 1.7598913.0000 2.20894
TableC3.UnsmoothedDataforFigure6,ElevationScansat 141°Azimuth
Time N2.12925 46 13.000037.2756 92 13.000074.5643 90 13.0000111.867 88 13.0000149.177 86 13.2500186.478 84 13.25002.34868 46 13.250037.2756 92 13.250074.5642 90 13.2500111.867 88 13.2500149.177 86 13.5000186.478 84 13.50002.56726 46 13.500037.2756 92 13.500074.5644 90 13.5000111.867 88 13.5000149.177 86 13.7500186.478 84 13.75002.78550 46 13.750037.2757 92 t3.750074.5646 90 13.7500111.867 88 13.7500149.177 86 14.0000186.478 84 14.00003.00391 46 14.000037.2757 92 14.000074.5644 90 14.0000111.867 88 14.0000149.177 86 14.2500186.478 84 14.25003.22266 46 14.250037.2756 92 14.250074.5643 90 14.2500111.867 88 14.2500149.177 86 14.5000186.478 84 14.50003.44005 46 14.500037.2756 92 14.500074.5644 90 14.5000111.867 88 14.5000149.177 86 14.7500186.478 84 14.75003.65744 46 14.750037.2756 92 14.750074.5643 90 14.7500111.867 88 14.7500149.177 86 15.0000186.478 84 15.00003.87534 46 15.000037.2757 92 15.0000
SDElevation power Time
2.654552.372142.315252.595382.005812.226332.479872.193032.281092.651202.032022.070592.373922.171672.291922.442811.809452.054982.199192.235982.264232.543952.160682.051032.262102.110322.203552.549092.001042.154112.376682.167682.131292.467142.061802.177942.458192.295352.183852.388021.669342.298722.143762.249352.155512.239792.211962.643232.671032.59592
N74.5643 90 15.0000111.867 88 15.0000149.177 86 15.2500186.477 84 15.25004.09256 46 15.250037.2757 92 15.250074.5644 90 15.2500111.867 88 15.2500149.177 86 15.5000186.478 84 15.50004.30825 46 15.500037.2756 92 15.500074.5643 90 15.5000111.867 88 15.5000149.177 86 15.7500186.477 84 15.75004.52480 46 15.750037.2756 92 15.750074.5643 90 15.7500111.867 88 15.7500149.177 86 16.0000186.477 84 16.00004.74168 46 16.000037.2757 92 16.000074.5645 90 16.0000111.867 88 16.0000149.177 86 16.2500186.478 84 16.25004.95890 46 16.250037.2758 92 16.250074.5645 90 16.2500111.867 88 16.2500149.177 86 16.5000186.478 84 16.50005.17527 46 16.500037.2757 92 16.500074.5645 90 16.5000111.867 88 16.5000149.177 86 16.7500186.478 84 16.75005.39062 46 16.750037.2756 92 16.750074.5642 90 16.7500111.866 88 16.7500149.177 86 17.0000186.477 84 17.00005.60785 46 17.000037.2756 92 17.000074.5644 90 17.0000111.867 88 17.0000
SDElevation power Time
2.509562.707112.316992.536012.701042.808182.729922.833652.527492.789952.770342.768112.736092.857932.526682.601132.455472.514732.567822.712602.496082.217682.311842,369492.621412.449452.408011.997752.042342.099312.363272.359392.386832.270872.187532.277762.275392.464542.492912.504482.278162.361592.470692.261622.273412.349022.310002.207462.268972.17592
149.177186.4775.8220137.275874.5645111.867149.177186.4786.0399137.275774.5643111.867149.177186.4776.2559437.275674.5642111.866149.177186.4776.4707937.275774.5644111.867149.177186.4786.6866537.275874.5646111.867149.177186.4786.9023437.275774.5644111.867149.177186.4777.1190637.275774.5645111.867149.177186.4787.3340737.275674.5643111.867149.177186.477
N8684469290888684469290888684469290888684469290888684469290888684469290888684469290888684469290888684
67
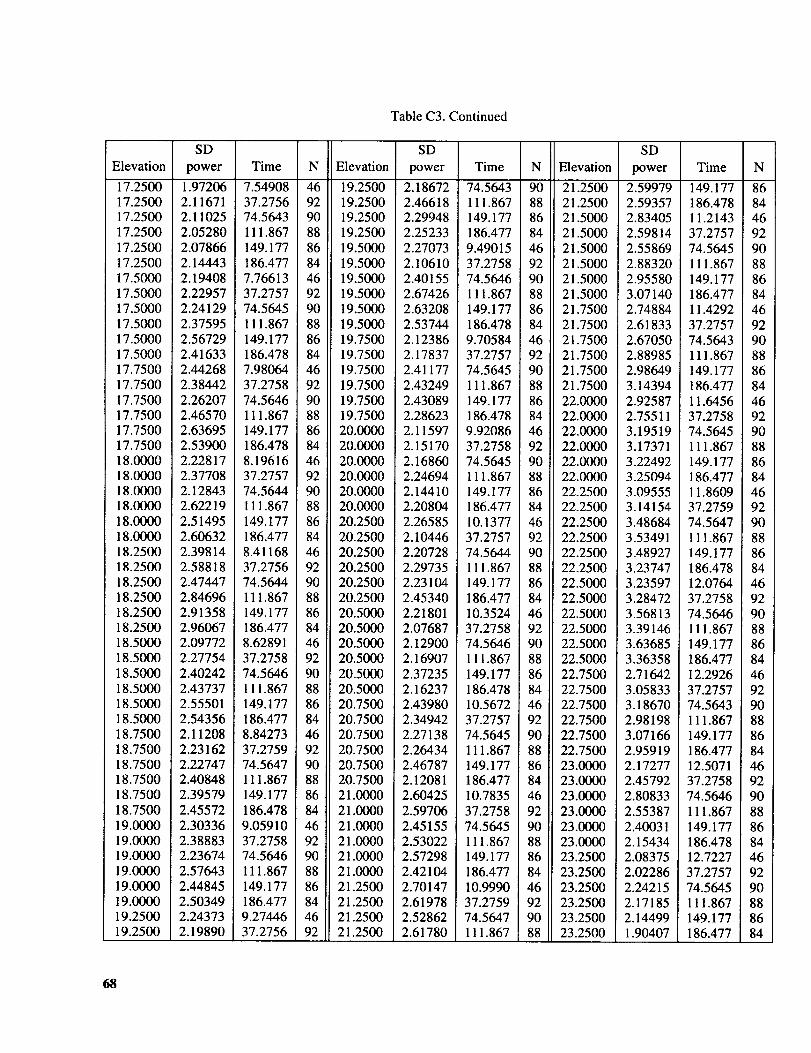
TableC3.Continued
SDElevation power Time17.250017.250017.250017.250017.250017.250017.500017.500017.500017.500017.500017.500017.750017.750017.750017.750017.750017.750018.000018.000018.000018.000018.000018.000018.250018.250018.250018.250018.250018.250018.500018.500018.500018.500018.500018.500018.750018.750018.750018.750018.750018.750019.000019.000019.000019.000019.000019.000019.250019.2500
1.972062.116712.110252.052802.078662.144432.194082.229572.241292.375952.567292.416332.442682.384422.262072.465702.636952.539002.228172.377082.128432.622192.514952.606322.398142.588182.474472.846962.913582.960672.097722.277542.402422.437372.555012.543562.112082.231622.227472.408482.395792.455722.303362.388832.236742.576432.448452.503492.243732.19890
7.5490837.275674.5643111.867149.177186.4777.7661337.275774.5645111.867149.177186.4787.9806437.275874.5646111.867149.177186.4788.1961637.275774.5644111.867149.177186.4778.4116837.275674.5644111.867149.177186.4778.6289137.275874.5646111.867149.177186.4778.8427337.275974.5647111.867149.177186.4789.0591037.275874.5646111.867149.177186.4779.2744637.2756
N4692908886844692908886844692908886844692908886844692908886844692908886844692908886844692908886844692
SD!Elevation power Time
19.250019.250019.250019.250019.500019.500019.500019.500019.500019.500019.750019.750019.750019.750019.750019.750020.000020.000020.000020.000020.000020.000020.250020.250020.250020.250020.250020.250020.500020.500020.500020.500020.500020.500020.750020.750020.750020.750020.750020.750021.000021.000021.000021.000021.000021.000021.250021.250021.250021.2500
2.186722.466182.299482.252332.270732.106102.401552.674262.632082.537442.123862.178372.411772.432492.430892.286232.115972.151702.168602.246942.144102.208042.265852.104462.207282.297352.231042.453402.218012.076872.129002.169072.372352.162372.439802.349422.271382.264342.467872.120812.604252.597062.451552.530222.572982.421042.701472.619782.528622.61780
74.5643111.867149.177186.4779.4901537.275874.5646111.867149.177186.4789.7058437.275774.5645111.867149.177186.4789.9208637.275874.5645111.867149.177186.47710.137737.275774.5644111.867149.177186.47710.352437.275874.5646111.867149.177186.47810.567237.275774.5645111.867149.177186.47710.783537.275874.5645111.867149.177186.47710.999037.275974.5647111.867
N9088868446929088868446929088868446929088868446929088868446929088868446929088868446929088868446929088
SDElevation power Time21.250021.250021.500021.500021.500021.500021.500021.500021.750021.750021.750021.750021.750021.750022.000022.000022.000022.000022.000022.000022.250022.250022.250022.250022.250022.250022.500022.500022.500022.500022.500022.500022.750022.750022.750022.750022.750022.750023.000023.000023.000023.000023.000023.000023.250023.250023.250023.250023.250023.2500
2.599792.593572.834052.598142.558692.883202.955803.071402.748842.618332.670502.889852.986493.143942.925872.755113.195193.173713.224923.250943.095553.141543.486843.534913.489273.237473.235973.284723.568133.391463.636853.363582.716423.058333.186702.981983.071662.959192.172772.457922.808332.553872.400312.154342.083752.022862.242152.171852.144991.90407
149.177186.47811.214337.275774.5645111.867149.177186.47711.429237.275774.5643111.867149.177186.47711.645637.275874.5645111.867149.177186.47711.860937.275974.5647111.867149.177186.47812.076437.275874.5646111.867149.177186.47712.292637.275774.5643111.867149.177186.47712.507137.275874.5646111.867149.177186.47812.722737.275774.5645111.867149.177186.477
N8684469290888684469290888684469290888684469290888684469290888684469290888684469290888684469290888684
68

TableC3.Continued
SDElevation power Time23.500023.500023.500023.500023.500023.5O0023.750023.750023.750023.750023.750023.750024.000024.000024.000024.000024.000024.000024.250024.250024.250024.250024.250024.250024.500024.500024.500024.500024.500024.500024.750024.750024.750024.750024.750024.750025.000025.000025.000025.000025.000025.000025.250025.250025.250025.250025.250025.250025.500025.5000
1.830141.914211.858311.934111.894812.021111.898481.933952.068771.943461.983012.092482.090021.975222.039791.908332.060472.053092.328262.062682.306232.215402.192222.200142.167052.091522.383002.493892.268352.326392.397902.396002.890532.822262.788692.613762.689912.651872.950232.992803.231612.906552.501272.567462.709222.598373.171742.959312.561102.54068
12.937537.275974.5646111.867149.177186.47713.153537.275874.5645111.867149.177186.47813.368037.275774.5645111.867149.177186.47713.583937.275774.5645111.867149.177186.47713.799837.275874.5646111.867149.177186.47814.015137.275874.5646111.867149.177186.47814.229637.275774.5645111.867149.177186.47714.445737.275874.5645111.867149.177186.47714.661337.2757
N4692908886844692908886844692908886844692908886844692908886844692908886844692908886844692908886844692
SDElevation power Time25.500025.500025.500025.500025.750025.750025.750025.750025.750025.750026.000026.000026.000026.000026.000026.000026.250026.250026.250026.250026.250026.250026.500026.500026.500026.500026.500026.500026.750026.750026.750026.750026.750026.750027.000027.000027.000027.000027.000027.000027.250027.250027.250027.250027.250027.250027.500027.500027.500027.5000
2.562552.518513.000532.728232.273062.241652.146562.301552.522762.307432.449332.146322.236502.372502.412312.357292.422782.308412.735722.656162.682072.795532.617292.727582.761652.700092.694213.045772.425502.626832.684722.692672.571092.865962.477672.613252.973032.833252.911113.081732.713592.392992.884142.816023.014222.966092.701332.456282.816562.72799
74.5643111.867149.177186.47714.876237.275874.5646111.867149.177186.47815.091937.275874.5645111.867149.177186.47715.307237.275874.5644111.867149.177186.47715.522637.275774.5644111.867149.177186.47715.738337.275874.5645111.867149.177186.47715.953537.275974.5646111.867149.177186.47816.169037.275874.5645111.867149.177186.47716.384237.275874.5646111.867
N9088868446929088868446929088868446929088868446929088868446929088868446929088868446929088868446929088
SDElevation power Time27.500027.500027.750027.750027.750027.750027.750027.750028.000028.000027.500028.000028.000028.000028.000028.250028.250028.250028.250028.250028.250028.500028.500028.500028.500028.500028.500028.750028.750028.750028.750028.750028.750029.000029.000029.000029.000029.000029.000029.250029.250029.250029.250029.250029.250029.500029.500029.500029.500029.5000
2.764913.003882.489362.396982.520842.513752.588992.941952.637922.544712.764912.521192.448802.508192.801802.483722.737172.458172.474132.233222.689722.276422.317832.227752.269712.121762.494862.126382.095112.074272.119512.023792.333491.751091.715801.916071.746541.696571.994171.961521.880291.904671.738851.919391.836552.186352.195991.848931.852821.96238
149.177186.47816.599237.275874.5645111.867149.177186.47716.815637.2757149.17774.5645111.867149.177186.47717.030637.275874.5647111.867149.177186.47817.246837.275874.5646111.867149.177186.47717.462037.275874.5645111.867149.177186.47717.677337.275774.5643111.867149.177186.47717.893037.275874.5646111.867149.178186.47818.108037.275974.5646111.867149.177
N8684469290888684469286908886844692908886844692908886844692908886844692908886844692908886844692908886
69

TableC3.Continued
SDElevation power Time29.500029.750029.750029.750029.750029.750029.750030.000030.000030.000030.000030.000030.000030.250030.250030.250030.250030.250030.250030.500030.500030.500030.500030.500030.750030.750030.750030.750030.750030.750031.000031.000031.000031.000031.000031.000031.250031.250031.250031.250031.250031.250031.500031.500031.500031.500031.500031.500031.750031.7500
1.927292.320002.452762.177741.958412.334902.202361.998792.060692.136752.044092.153092.029192.128042.135652.324382.285312.195592.167362.348132.478052.416682.359142.370032.467612.412682.452382.595862.512282.623842.361662.389072.272262.561052.341902.686652.150181.929132.098222.175782.085712.401312.206372.043402.254072.081192.222702.380232.442712.28150
186.47718.323437.275874.5645111.867149.177186.47718.539437.275874.5645111.867149.177186.47818.522137.275874.5645111.867149.177186.47737.275874.5647111.867149.177186.47718.092437.275974.5646111.867149.177186.47717.876337.275874.5646111.867149.177186.47717.660937.275874.5646111.867149.177186.47717.444637.275774.5644111.867149.177186.47717.231137.2758
N8446929088868446929088868447929088868492908886844792908886844792908886844792908886844792908886844792
SDElevation power Time31.750031.750031.750031.750032.000032.000032.000032.000032.000032.000032.250032.250032.250032.250032.250032.250032.500032.500032.500032.500032.500032.500032.750032.750032.750032.750032.750032.750033.000033.000033.000033.000033.000033.000033.250033.250033.250033.250033.250033.250033.500033.500033.500033.500033.500033.500033.750033.750033.750033.7500
2.501722.471302.507372.703652.696182.331182.496592.706512.751992.730432.340062.095922.191392.216472.255562.195892.003491.863972.098182.165292.064931.931391.782512.099572.270292.102952.153352.144281.575852.066022.235952.091092.047921.958181.833802.149712.295412.169612.123292.138942.016012.440622.444052.361702.347992.440031.954722.391772.365402.22059
74.5647111.867149.177186.47717.014037.275974.5648111.867149.177186.47716.798737.275874.5645111.867149.177186.47716.583637.275874.5645111.867149.177186.47716.367537.275774.5645111.867149.177186.47716.153337.275974.5648111.867149.177186.47715.936837.275974.5646111.867149.177186.47715.721737.275874.5646111.867149.177186.47715.506237.275874.5646111.867
N9088868447929088868447929088868447929088868447929088868447929088868447929088868447929088868447929088
SDElevation power Time33.750033.750034.000034.000034.000034.000034.000034.000034.250034.250034.250034.250034.250034.250034.500034.500034.500034.500034.500034.500034.750034.750034.750034.750034.750034.750035.000035.000035.000035.000035.000035.000035.250035.250035.250035.250035.250035.250035.500035.500035.500035.500035.500035.500035.750035.750035.750035.750035.750035.7500
2.478392.401812.124902.392532.225792.116912.404072.222942.336712.248262.231582.253402.423042.285822.420732.370802.597042.508742.433572.691202.169642.390652.586752.454842.605092.584661.934902.063802.177732.271622.350682.239851.653981.912641.962752.095232.032742.083861.698522.147382.101542.312772.185292.298441.863872.172782.284302.403692.395802.29662
149.177186.47715.291137.275774.5645111.867149.177186.47715.075037.275974.5647111.867149.177186.47714.861237.275974.5646111.867149.177186.47714.645437.275874.5645111.867149.177186.47714.428537.275874.5645111.867149.177186.47714.214937.275974.5647111.867149.177186.47713.998537.276074.5648111.867149.177186.47713.782237.276074.5647111.867149.177186.477
N8684479290888684479290888684479290888684479290888684479290888684479290888684479290888684479290888684
7O

TableC3.Continued
SDElevation power36.000036.000036.000036.000036.000036.000036.250036.250036.250036.250036.250036.250036.500036.500036.500036.500036.500036.500036.750036.750036.750036.750036.750036.750037.000037.000037.000037.000037.O00037.000037.250037.250037.250037.250037.250037.250037.500037.500037.500037.500037.500037.500037.750037.750037.750037.750037.750037.750038.000038.0000
2.071222.197932.342152.452242.538732.227282.205681.959192.035852.122922.284582.063392.339312.229262.139482.182812.373822.315191.909932.121732.192812.194302.403662.362141.660871.836462.088041.987862.192142.094871.545831.726581.764551.750701.874821.984341.473221.666631.781921.627401.786681.909741.716272.018162.053871.788301.846802.058611.810792.01393
Time N Elevation13.5680 47 38.000037.2758 92 38.000074.5646 90 38.0000111.867 88 38.0000149.177 86 38.2500186.477 84 38.250013.3529 47 38.250037.2758 92 38.250074.5646 90 38.2500111.867 88 38.2500149.177 86 38.5000186.477 84 38.500013.1378 47 38.500037.2760 92 38.500074.5648 90 38.5000111.867 88 38.5000149.177 86 38.7500186.477 84 38.750012.9242 47 38.750037.2760 92 38.750074.5648 90 38.7500111.867 88 38.7500149.177 86 39.0000186.477 84 39.000012.7071 47 39.000037.2758 92 39.000074.5645 90 39.0000111.867 88 39.0000149.177 86 39.2500186.477 84 39.250012.4912 47 39.250037.2758 92 39.250074.5646 90 39.2500111.867 88 39.2500149.177 86 39.5000186.477 84 39.500012.2758 47 39.500037.2758 92 39.500074.5646 90 39.5000111.867 88 39.5000149.177 86 39.7500186.477 84 39.750012.0600 47 39.750037.2759 92 39.750074.5648 90 39.7500111.867 88 39.7500149.177 86 40.0000186.477 84 40.000011.8447 47 40.000037.2760 92 40.0000
SDpower1.867541.960271.936492.032081.859771.920381.939192.073292.098242.222401.754761.785822.043601.851932.038982.284282.005311.994102.188682.105352.197902.269321.852642.140222.166822.180892.318122.325951.993712.317692.301892.419322.519682.599532.013822.426152.343282.333422.526942.585421.919152.168912.103682.021912.089002.131541.741782.172151.872512.05009
Time N Elevation74.5648 90 40.0000111.867 88 40.0000149.177 86 40.2500186.477 84 40.250011.6288 47 40.250037.2759 92 40.250074.5646 90 40.2500111.867 88 40.2500149.177 86 40.5000186.477 84 40.500011.4132 47 40.500037.2758 92 40.500074.5646 90 40.5000111.867 88 40.5000149.177 86 40.7500186.477 84 40.750011.1990 47 40.750037.2759 92 40.750074.5648 90 40.7500111.867 88 40.7500149.177 86 41.0000186.477 84 41.000010.9832 47 41.000037.2760 92 41.000074.5647 90 41.0000111.867 88 41.0000149.177 86 41.2500186.477 84 41.250010.7676 47 41.250037.2760 92 41.250074.5647 90 41.2500111.867 88 41.2500149.177 86 41.5000186.477 84 41.500010.5505 47 41.500037.2759 92 41.500074.5647 90 41.5000111.867 88 41.5000149.177 86 41.7500186.477 84 41.750010.3371 47 41.750037.2760 92 41.750074.5647 90 41.7500111.867 88 41.7500149.177 86 42.0000186.477 84 42.000010.1201 47 42.000037.2760 92 42.000074.5648 90 42.0000111.867 88 42.0000
SDpower
2.022012.055381.815102.175782.009562.183932.232662.105011.876432.277922.337602.516882.550632.221152.404582.643562.479622.716192.736822.265642.272622.407812.383652.544222.580412.169512.178592.100692.080582.109332.211391.905682.033191.854631.842421.925062.107801.873372.271221.997632.118192.033272.091412.043252.244312.015882.219762.054332.057592.37996
Time N149.177 86186.477 849.90459 4737.2761 9274.5648 90111.867 88149.177 86186.477 849.68833 4737.2760 9274.5647 90111.867 88149.177 86186.477 849.47141 4737.2759 9274.5646 90111.867 88149.177 86186.477 849.25698 4737.2760 9274.5647 90111.867 88149.177 86186.477 849.04338 4737.2761 9274.5649 90111.867 88149.177 86186.477 848.82497 4737.2761 9274.5647 90111.867 88149.177 86186.477 848.61004 4737.2761 9274.5647 90111.867 88149.177 86186.477 848.39528 4737.2760 9274.5648 90111.867 88149.177 86186.477 84
71

TableC3.Continued
SDElevation power42.250042.250042.250042.250042.250042.250042.500042.500042.500042.500042.500042.500042.750042.750042.750042.750042.750042.750043.000043.000043.000043.000043.000043.000043.250043.250043.250043.250043.250043.250043.500043.500043.500043.500043.500043.500043.750043.750043.750043.750043.750043.750044.000044.000044.000044.000044.000044.000044.250044.2500
2.238342.076152.311572.251512.184062.504562.403712.238992.480562.222062.070612.336752.102202.034562.188461.919431.976792.061981.646731.944352.170391.912682.009962.142812.016511.991072.227912.097822.216682.194192.069171.842651.947292.017722.103172.157511.841001.858262.044701.943061.856522.108241.741961.847501.968191.733281.693092.016491.776722.05313
Time N Elevation8.17869 47 44.250037.2761 92 44.250074.5648 90 44.2500111.867 88 44.2500149.177 86 44.5000186.478 84 44.50007.96443 47 44.500037.2762 92 44.500074.5648 90 44.5000111.867 88 44.5000149.177 86 44.7500186.477 84 44.75007.74701 47 44.750037.2761 92 44.750074.5648 90 44.7500111.867 88 44.7500149.177 86 45.0000186.477 84 45.00007.53208 47 45.000037.2759 92 45.000074.5645 90 45.0000111.867 88 45.0000149.177 86 45.2500186.477 84 45.25007.31732 47 45.250037.2760 92 45.250074.5646 90 45.2500111.867 88 45.2500149.177 86 45.5000186.477 84 45.50007.10040 47 45.500037.2760 92 45.500074.5648 90 45.5000111.867 88 45.5000149.177 86 45.7500186.478 84 45.75006.88514 47 45.750037.2762 92 45.750074.5649 90 45.7500111.867 88 45.7500149.178 86 46.0000186.478 84 46.00006.66872 47 46.000037.2760 92 46.000074.5647 90 46.0000111.867 88 46.0000149.177 86 46.2500186.477 84 46.25006.45329 47 46.250037.2759 92 46.2500
SDpower1.964972.188201.958012.228811.978232.290252.187912.517542.177722.263271.944132.149542.062062.312942.158042.255762.101272.233752.097562.151142.022512.289422.105402.090562.061041.981111.995902.127842.065542.051912.263381.980311.713052.178862.128632.202272.497592.090732.009522.261712.125342.451432.587292.332492.358132.353912.021022.052082.478682.26085
Time N Elev_ion74.5646 90 46.2500111.867 88 46.2500149.177 86 46.5000186.477 84 46.50006.23770 47 46.500037.2760 92 46.500074.5646 90 46.5000111.867 88 46.5000149.177 86 46.7500186.477 84 46.75006.02194 47 46.750037.2760 92 46.750074.5648 90 46.7500111.867 88 46.7500149.177 86 47.0000186.477 84 47.00005.80552 47 47.000037.2761 92 47.000074.5648 90 47.0000111.867 88 47.0000149.177 86 47.2500186.477 84 47.25005.58910 47 47.250037.2761 92 47.250074.5647 90 47.2500111.867 88 47.2500149.177 86 47.5000186.477 84 47.50005.37367 47 47.500037.2760 92 47.500074.5647 90 47.5000111.867 88 47.5000149.177 86 47.7500186.477 84 47.75005.15708 47 47.750037.2760 92 47.750074.5646 90 47.7500111.867 88 47.7500149.177 86 48.0000186.477 84 48.00004.93999 47 48.000037.2761 92 48.000074.5648 90 48.0000111.867 88 48.0000149.177 86 48.2500186.477 84 48.25004.72424 47 48.250037.2761 92 48.250074.5647 90 48.2500111.867 88 48.2500
SDpower
2.258602.343071.677661.769231.817271.889661.813332.093822.053851.976082.010302.108721.896862.146362.758512.385652.296722.555372.289662.692692.738142.492532.378792.608452.356232.570892.245052.266042.431102.529402.473092.298982.307922.375592.518752.571002.596022.464382.192212.551312.663692.588802.615262.455052.396082.518622.825992.486042.588292.55372
Time N149.177 86186.477 844.50681 4737.2760 9274.5648 90111.867 88149.177 86186.477 844.29023 4737.2760 9274.5646 90111.867 88149.177 86186.477 844.07447 4737.2760 9274.5648 90111.867 88149.177 86186.477 843.85688 4737.2761 9274.5648 90111.867 88149.177 86186.477 843.63863 4737.2760 9274.5647 90111.867 88149.177 86186.477 843.42221 4737.2760 9274.5647 90111.867 88149.177 86186.477 843.20296 4737.2760 9274.5646 90111.867 88149.177 86186.477 842.98637 4737.2760 9274.5647 90111.867 88149.177 86186.477 84
72

TableC3.Concluded
SDElevation power Time48.500048.500048.500048.500048.500048.500048.750048.750048.750048.750048.750048.750049.000049.000049.000049.000049.000049.000049.250049.250049.250049.250049.250049.2500
2.303792.411352.734182.467752.326842.723342.513152.430932.507992.498982.390042.855372.187392.182512.351002.293882.173712.470912.064272.286802.432492.189692.266812.53466
2.7676237.276174.5647111.867149.177186.4772.5482037.276074.5646111.867149.177186.4772.3296237.276174.5647111.867149.177186.4772.1097137.275974.5645111.867149.177186.477
N479290888684479290888684479290888684479290888684
73
References
1. Hardy, Kenneth R.; and Gage, Kenneth S.: The History
of Radar Studies of the Clear Atmosphere. Radar in
Meteorology--Battan Memorial and 40th Anniversary Radar
Meteorology Conference, David Atlas, ed., AMS, 1990,
pp. 130-142.
2. Tatarski, V. 1. (R. A. Silverman, transl.): Wave Propagation in
a Turbulent Medium. McGraw-Hill Book Co., Inc., 1961.
3. Sauvageot, Henri: Radar Meteorology. Artech House, 1991.
4. Spiegel, E. A.; and Veronis, G.: On the Boussinesq Approxi-
mation for a Compressible Fluid. £ Astrophys., vol. 131, 1960,
pp. 442--447.
5. Proctor, Fred H.: Numerical Simulation of Wake Vortices
Measured During the Idaho Falls and Memphis Field
Programs. A1AA-96-2496, Jan. 1996.
6. Marshall, Robert E.; and Scales, Wayne: Wake Vortex Radar
Reflectivity. RTI/4500/041-03S, Research Triangle Inst. (RTI),Mar. 1996.
7. Ottersten, H.: Radar Backscattering From the TUrbulent Clear
Atmosphere. Radio Sci., vol. 4, pp. 1251-1255.
8. Gilson, W. H.: Radar Measurements of Aircraft Wakes. Proj.
Rep. AAW-I 1, Lincoln Lab., F19628-90-C-0002, U.S. Air
Force, Sept. 1992.
9. Nespor, Jerald D.; Hudson, B.; Stegall, R. L.; and Freedman,
Jerome E.: Doppler Radar Detection of Vortex Hazard
Indicators. Airborne Windshear Detection and Warning
Systems--Fifth and Final Combined Manufacturers' and
Technologists' Conference, Part 2, Victor E. Delnore,
compiler, NASA CP-10139, DOT/FAA/RD-94-14°PT-2, July
1994, pp. 651-688.
10. Wonnacott, Ronald J.; and Wonnacott, Thomas H.: Introduc-
tory Statistics. John Wiley & Sons, 1985.
74

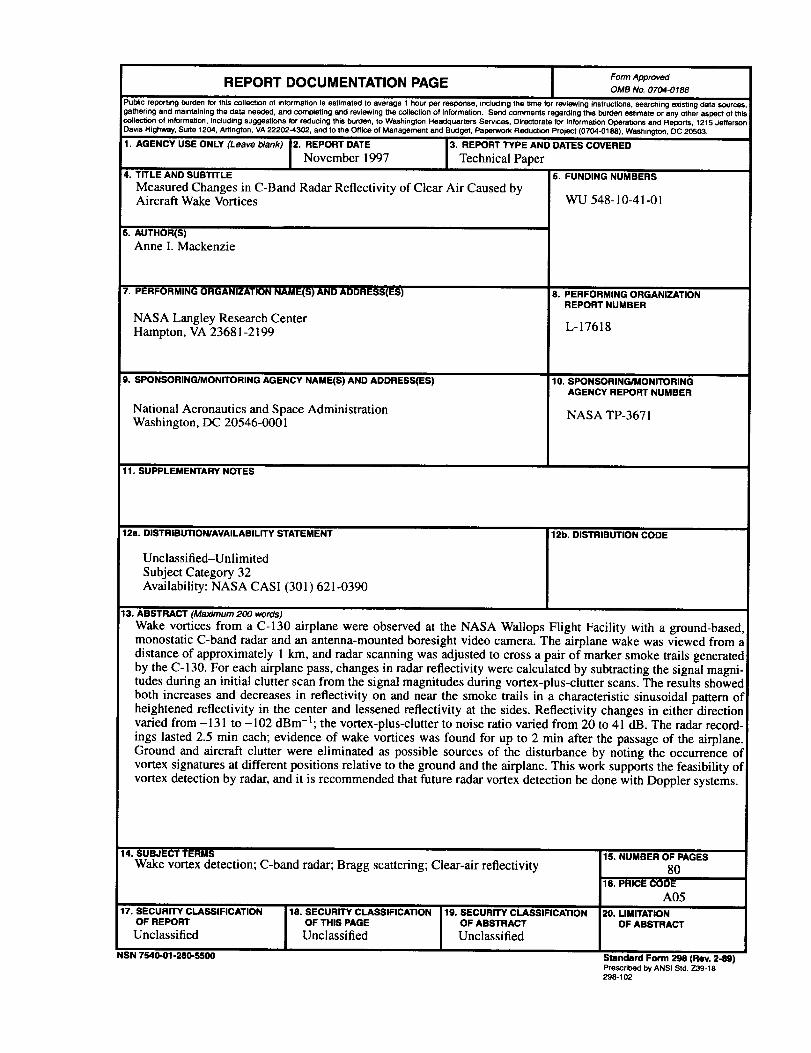
REPORT DOCUMENTATION PAGE Fo_o,o,_OMB No. 0704-0188
Public reporting burclen fo_ this collection of information is estimated to average 1 hour per response, including the time for reviewing instructions, searching existing data sources,gathering and maintaining the data needed, end complating and reviewing the collection of information. Send comments regarding this burden estimate or any other aspect of thiscollection of information, including suggestions for reducing this burden, to Washington Headquarters Serveas, Directorate for Information Operations end Reports, 1215 JeffersonDavis Highway, Suite 1204, Arlington, VA 22202-4302, and to the Office of Management and Budget, Paperwork Reduction Project (0704-0188), Washington, DC 20503.
1. AGENCY USE ONLY (Leave blank) 2. REPORT DATE 3. REPORT TYPE AND DATES COVERED
November 1997 Technical Paper4. TITLE AND SUBTITLE 5. FUNDING NUMBERS
Measured Changes in C-Band Radar Reflectivity of Clear Air Caused byAircraft Wake Vortices WU 548-10-4 I-01
6. AUTHOR(S)Anne I. Mackenzie
7. PERFORMINGORGANIZATION NAME(S) AND ADDRESS(ES)
NASA Langley Research Center
Hampton, VA 23681-2199
9. SPONSORING/MONITORING AGENCY NAME(S) AND ADDRESS(ES)
National Aeronautics and Space AdministrationWashington, DC 20546-0001
11. SUPPLEMENTARY NOTES
8. PERFORMING ORGANIZATIONREPORT NUMBER
L-17618
10. SPONSORING/MONITORING
AGENCY REPORT NUMBER
NASA TP-3671
12a. DIaTI=IIBUTION/AVAILABILITY STATEMENT
Unclassified-Unlimited
Subject Category 32Availability: NASA CASI (301) 621-0390
12b. DISTRIBUTION CODE
13. AB._THACT (Maximum 200 words)
Wake vortices from a C-130 airplane were observed at the NASA Wallops Flight Facility with a ground-basedmonostatic C-band radar and an antenna-mounted boresight video camera. The airplane wake was viewed from adistance of approximately I km, and radar scanning was adjusted to cross a pair of marker smoke trails generatedby the C-130. For each airplane pass, changes in radar reflectivity were calculated by subtracting the signal magni-tudes during an initial clutter scan from the signal magnitudes during vortex-plus-clutter scans. The results showedboth increases and decreases in reflectivity on and near the smoke trails in a characteristic sinusoidal pattern ofheightened refiectivity in the center and lessened reflectivity at the sides. Reflectivity changes in either directionvaried from -131 to -102 dBm-l; the vortex-plus-clutter to noise ratio varied from 20 to 41 dB. The radar record-
ings lasted 2.5 min each; evidence of wake vortices was found for up to 2 min after the passage of the airplane.Ground and aircraft clutter were eliminated as possible sources of the disturbance by noting the occurrence ofvortex signatures at different positions relative to the ground and the airplane. This work supports the feasibility ofvortex detection by radar, and it is recommended that future radar vortex detection be done with Doppler systems.
14. SUBJECT TERMSWake vortex detection; C-band radar; Bragg scattering; Clear-air reflectivity
17. SECURITY CLASSIFICATION
OF REPORT
Unclassified
NSN 7540-01-280-5500
18. SECURITY CLASSIFICATION
OF THIS PAGE
Unclassified
19. SECURITY CLASSIFICATIONOF ABSTRACT
Unclassified
15. NUMBER OF PAGES
8016. PRICE CODE
A05
20. LIMITATION
OF ABSTRACT
Standard Form 298 (Roy. 2-89)Prescribed by ANSi Std. 7_39-18298-102