measure evaluation - international household survey network
TRANSCRIPT

MEASURE Evaluation is funded by the U.S. Agency for International Development (USAID) through Cooperative Agreement No. GHA-A-00-08-00003-00 and is implemented by the Carolina Population Center at the University of North Carolina in partnership with Futures Group International, John Snow, Inc., ICF Macro, Management Sciences for Health, and Tulane University.
Carolina Population CenterUniversity of North Carolina at Chapel Hill
206 W. Franklin StreetChapel Hill, NC 27516Phone: 919-966-7482
Fax: [email protected]
www.cpc.unc.edu/measure
A Comparative Analysis of Select Health Facility Survey Methods Applied in Low
and Middle Income Countries
Anbrasi Edward, Toru Matsubiyashi, Bolaji Fapohunda, Stan Becker
July 2009
WP-09-111
Printed on recycled paper
MEASURE EvaluationWorking Paper Series
This working paper series is made possible by support from the U.S. Agency for International Development (USAID) through Cooperative Agreement No. GHA-A-00-08-00003-00. The opinions expressed are those of the authors, and do not necessarily reflect the views of USAID or the U.S. government.
The working papers in this series are produced by MEASURE Evaluation in order to speed the dissemination of information from research studies. Most working papers currently are under review or are awaiting journal publication at a later date. Reprints of published papers are substituted for preliminary versions as they become available.
This and previous working papers are available, free of charge, from the MEASURE Evaluation Web site, http://www.cpc.unc.edu/measure.

A Comparative Analysis of Select Health Facility Survey Methods Applied in Low and Middle Income Countries
Paper Prepared for the Measure Evaluation Project
Anbrasi Edward; Toru Matsubiyashi; Bolaji Fapohunda; Stan Becker
________________________________________________________________________________________________________________________________________________________________________________________________________________________CCoommppaarriissoonn ooff HHFFAA MMeetthhooddss PPaaggee 22 ooff 4477
Acknowledgements
The assignment was commissioned by the Measure Evaluation project, John Snow Inc, as part of the ongoing activities of the International Health Facility Assessment Network. Dr. Bolaji Fapohunda, senior technical advisor, Measure Evaluation provided oversight to the developmental process, facilitated the key informant interviews in Uganda, and assisted with the drafting of the paper. We are grateful to Prof. Kaijuka, commissioner of health services, Uganda, for his assistance in coordinating the efforts and to the key informants for participating in the survey. We would also like to thank Dr. Bill Weiss for his review of the Lot Quality Assurance Sampling and Rapid Survey Methods and Prof. Richard Morrow for his insights and review of the document.
Toru Matsubiyashi performed the comparative assessments and Savita Subramaniyam provided assistance in the tabulation and editing of the report. Prof. Stan Becker contributed toward the sampling procedures and the discussion of sampling procedures and means for ascertaining the validity of the various health facility assessment (HFA) approaches in the field. Drs. Nancy Fronzak and Stephanie Mullen reviewed the content and the technical approach of the paper. Mr. Ruilin Ren of Macro International helped shape the overall approach to the comparative analysis and provided comments for improving the discussions on research design and sampling. Ms. Yoko Suzuki and Ms. Angela Ratkowski assisted with editing and assuring coherence. MEASURE Evaluation and Johns Hopkins University are grateful for these contributions. The paper was written by Anbrasi Edward with contributions from the team.
Recommended citation:
Edward A, Matsubiyashi T, Fapohunda B, Becker S. A comparative analysis of select health facility survey methods applied in low and middle income countries [working paper WP-09-11]. Chapel Hill, NC: MEASURE Evaluation, 2009.

________________________________________________________________________________________________________________________________________________________________________________________________________________________CCoommppaarriissoonn ooff HHFFAA MMeetthhooddss PPaaggee 33 ooff 4477
Table of Contents
ACKNOWLEDGEMENTS................................................................................................................................................... 2
ACRONYMS .......................................................................................................................................................................... 6
INTRODUCTION.................................................................................................................................................................. 8
OVERVIEW OF HEALTH FACILITY PERFORMANCE MEASURES............................................................................................ 8
PURPOSE OF HFA PERFORMANCE METHODS.................................................................................................................. 10
DOMAINS OF HEALTH FACILITY PERFORMANCE METHODS .............................................................................................. 11
COMMONLY EMPLOYED DATA COLLECTION METHODS .................................................................................................... 12
RATIONALE FOR REEXAMINING CURRENT HFA METHODS .............................................................................................. 13
METHODS ........................................................................................................................................................................... 14
RESULTS OF THE COMPARATIVE ANALYSIS OF SELECT HFA METHODS ................................................... 14
COMPARISON OF SELECT HFA METHODS........................................................................................................................ 14
A. Sampling Methods and Design.................................................................................................................................. 14
B. Measurement Domains.............................................................................................................................................. 17
C. Management and Financing of Health Facility Surveys........................................................................................... 18
RESULTS OF KEY INFORMANT INTERVIEWS ON UTILITY OF SELECT HFA METHODS ...................................................... 20
UTILITY AND LIMITATIONS OF CURRENT HEALTH FACILITY SURVEY METHODS FOR MANAGEMENT DECISION-MAKING........................................................................................................................... 21
CONCLUSIONS AND RECOMMENDATIONS ............................................................................................................. 25
APPENDICES ...................................................................................................................................................................... 27
APPENDIX A: OVERVIEW OF NATIONAL HFA METHODS................................................................................................... 27
APPENDIX B: DETAILS OF SAMPLING R-HFA SAMPLING PROCEDURES.......................................................................... 30
APPENDIX C: SUMMARY PROFILE OF KEY HFA METHODS .............................................................................................. 32
A. Service Provision Assessment ................................................................................................................................... 32
B. Service Availability Mapping .................................................................................................................................... 34
C. Facility Audit of Service Quality............................................................................................................................... 36
________________________________________________________________________________________________________________________________________________________________________________________________________________________CCoommppaarriissoonn ooff HHFFAA MMeetthhooddss PPaaggee 44 ooff 4477
D. Quick Investigation of Quality .................................................................................................................................. 37
E. Balanced Score Card ................................................................................................................................................ 39
F. IMCI-MCE Health Facility Survey ........................................................................................................................... 40
G. Health Facility Census ............................................................................................................................................. 42
H. Rapid HFA................................................................................................................................................................ 43
REFERENCES..................................................................................................................................................................... 46
________________________________________________________________________________________________________________________________________________________________________________________________________________________CCoommppaarriissoonn ooff HHFFAA MMeetthhooddss PPaaggee 55 ooff 4477
List of Tables
Table 1: Description of Sampling Methods ........................................................................................................... 15
Table 2: Comparison of Health Facility Survey Performance Indicators .............................................................. 17
Table 3: Management and Financing of Health Facility Surveys.......................................................................... 19
Table 4: Perspectives of Key Informant Interviews on HFA Methods................................................................... 20

________________________________________________________________________________________________________________________________________________________________________________________________________________________CCoommppaarriissoonn ooff HHFFAA MMeetthhooddss PPaaggee 66 ooff 4477
Acronyms
ANC antenatal care ARI acquired respiratory illness BASICS Basic Support for Institutionalizing Child Survival BSC Balanced Score Card CAH Department of Child and Adolescent Health Development, World Health Organization CIDA Canadian International Development Agency CS-PRO Census and Survey Processing CHW community health worker DALYs disability adjusted life years DHS Demographic Health Survey EPI Expanded Program for Immunization FASQ Facility Audit Service of Quality FP family planning GPS global positioning system HF health facility HFA health facility assessment HFC health facility census HIV/AIDS human immunodeficiency virus/acquired immunodeficiency syndrome HMIS health management information system ICDDRB International Center for Diarrheal Disease Research, Bangladesh IFLS Indonesian Family Life Survey IHFAN International Health Facility Assessment Network IMCI Integrated Management of Childhood Illnesses IMCI-MCE Integrated Management of Childhood Illnesses-Multi-Country Evaluation JICA Japanese International Cooperation Agency LQAS Lot Quality Assurance Sampling LSMS Living Standards Measurement Study MNCH maternal, neonatal, and child health MOH ministry of health NGO nongovernmental organization PDA personal digital assistant PETS public expenditure tracking survey PSU population-based survey cluster QIQ Quick Investigation of Quality QSDSs Quantitative Service Delivery Surveys QuALYs Quality Adjusted Life Years RH reproductive health R-HFA Rapid Health Facility Assessment SA situational analysis SAM Service Availability Mapping SPA Service Provision Assessment STI/HIV sexually transmitted infections/human immunodeficiency virus TB tuberculosis Uganda DISH Uganda Delivery of Improved Services for Health Survey USAID U.S. Agency of International Development VCT voluntary counseling and testing WHO World Health Organization

________________________________________________________________________________________________________________________________________________________________________________________________________________________CCoommppaarriissoonn ooff HHFFAA MMeetthhooddss PPaaggee 77 ooff 4477

________________________________________________________________________________________________________________________________________________________________________________________________________________________CCoommppaarriissoonn ooff HHFFAA MMeetthhooddss PPaaggee 88 ooff 4477
Introduction
Overview of Health Facility Performance Measures
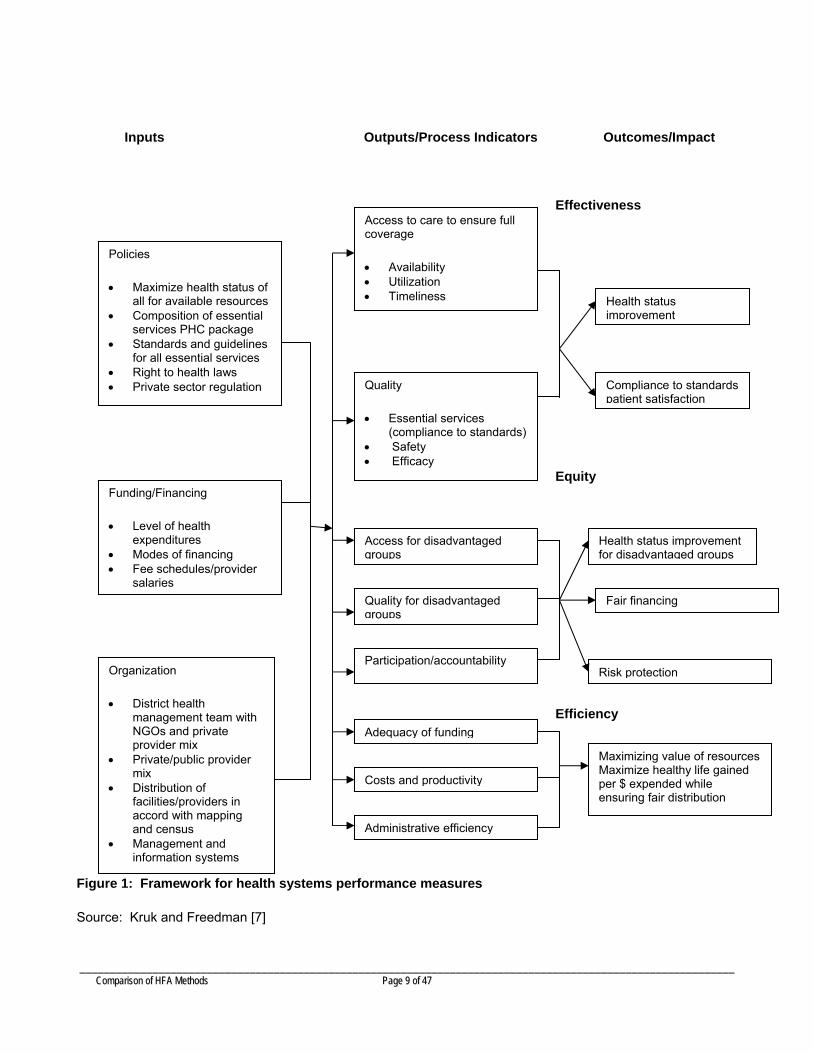
There has been a growing interest by national health systems and the donor community in strengthening the capacity of health systems in developing countries to ensure equitable and efficient delivery of health services. The Millennium Development Goals have further accelerated the efforts of organizations to undertake numerous measures to assess and improve health system performance [1]. Although the major efforts primarily focus on ensuring impact on health outcomes, the motivation, methods, and types of clinical and managerial services assessed vary considerably. Donor initiated efforts to perform national level assessments are often large scale operations requiring enormous resource investments. Surveys conducted at the district or provincial level are primarily designed as routine performance assessments for consumption of internal users of the health system. The Lancet series on health statistics highlights some critical issues in the complexities, interpretation, and insufficiency of current measures and how their utility can be enhanced [2-5]. Lindelow and Wagstaff examined various health facility (HF) survey approaches providing an overview for the motivation of these methods; types of data collected; and their application for planning, monitoring, budgeting, and research [6]. Some methods determine how health facility characteristics influence health care seeking behavior and outcomes while others specifically address the efficiency, costs and quality of the health system or compare service delivery strategies. Other surveys that link household data with HF characteristics, such as a Demographic Health Survey (DHS) and Service Provision Assessment (SPA), provide a more comprehensive overview on effectiveness of health system performance. Health facility performance is also influenced by several external factors including financing, support systems, regulation, oversight, and the geopolitical conditions in which the facility functions. Private, for-profit health service entities have a different value system and operational environments than the public sector. The mechanisms for management and financial oversight differ considerably and are executed with varying rigor. The organizational environment and behavior influence health outcomes considerably but these aspects are seldom included in the assessment framework to make appropriate inferences on effectiveness. The metrics of measurement must be appropriate for the local context and provide valid and reliable measures [7]. A number of global initiatives have emerged to develop standard performance measures for country comparisons and development of national health information systems. A myriad of assessment methodologies and instruments have been designed and implemented to measure and improve health capacity to provide pre-determined quality services. There has been considerable debate on the empirical evidence of these assessments [8,9]. A few of these are comprehensive approaches encompassing most service delivery or disease management processes, mapping the infrastructure, inputs and health professional capital investments and managerial efficiency at the hospital or public HF level and attempt to measure key performance indicators from each domain of the health system performance framework, as illustrated Figure 1, adapted from Kruk and Freedman [7]. Others have focused exclusively on specific service delivery components, such as family planning (FP), human immunodeficiency virus/acquired immunodeficiency syndrome (HIV/AIDS) prevention and management, and immunization, and are linked to national disease control strategies or donor specific initiatives [10]. However, over the years, integrated approaches evolved for comprehensive assessment of priority primary health services. Some of the commonly used methods are those from the World Health Organization (WHO) HF survey for Integrated Management of Childhood Illnesses (IMCI), which evolved from the sick child assessment procedures developed by Basic Support for Institutionalizing Child Survival (BASICS); the quality of care indicator for FP, which was later developed into the Quick Investigation of Quality (QIQ) survey, the Safe Motherhood Needs Assessments; and the sexually transmitted infections/human immunodeficiency virus (STI/HIV) assessments integrated into the SPA tool.
________________________________________________________________________________________________________________________________________________________________________________________________________________________CCoommppaarriissoonn ooff HHFFAA MMeetthhooddss PPaaggee 99 ooff 4477
Inputs Outputs/Process Indicators Outcomes/Impact
Effectiveness
Equity
Efficiency
Figure 1: Framework for health systems performance measures
Source: Kruk and Freedman [7]
Policies
• Maximize health status of all for available resources
• Composition of essential services PHC package
• Standards and guidelines for all essential services
• Right to health laws • Private sector regulation
Funding/Financing
• Level of health expenditures
• Modes of financing • Fee schedules/provider
salaries
Organization
• District health management team with NGOs and private provider mix
• Private/public provider mix
• Distribution of facilities/providers in accord with mapping and census
• Management and information systems
Access to care to ensure full coverage
• Availability • Utilization • Timeliness
Quality
• Essential services (compliance to standards)
• Safety • Efficacy
Access for disadvantaged groups
Quality for disadvantaged groups
Participation/accountability
Adequacy of funding
Costs and productivity
Administrative efficiency
Health status improvement
Compliance to standards patient satisfaction
Health status improvement for disadvantaged groups
Fair financing
Risk protection
Maximizing value of resources Maximize healthy life gained per $ expended while ensuring fair distribution
________________________________________________________________________________________________________________________________________________________________________________________________________________________CCoommppaarriissoonn ooff HHFFAA MMeetthhooddss PPaaggee 1100 ooff 4477
Some health facility assessment (HFA) methods focus on the aspects of cost and efficiency required to produce quality outputs of care. Others focus on provider issues that impact outcomes of care. These include investments in recruitment, training, deployment, support, performance incentives, and other human resource issues to address performance deficiencies. The measurement of health services is also an intrinsic motivation for providers to improve their performance. Some performance methods like the Balanced Score Card (BSC) provide an empirical framework of factors both internal and external that impact quality of care and health outcomes. Surveys have also been carried out to examine interactions between providers and between the government and providers, particularly in the governance of decentralized systems [11]. A public expenditure tracking survey (PETS), which examines the resource flow of financing, support and supplies, and supervision, provides insights into the asymmetries evidenced in the performance of HFs.
To inform executive decision-making, WHO in the past decade has undertaken major efforts to institute or improve systems for acquiring health information from countries to determine the effectiveness, quality, and management of health services. These efforts include district team problem solving, district health profiles, human resource capacity building for management, and materials development. In 2006, WHO hosted a meeting with agencies engaged in measuring health system/health facility performance to develop a comprehensive framework of rapid performance indicators that measured infrastructure adequacy, infection control, types and quality of services offered, human resource density and competencies, availability of equipment and drugs, guidelines, and laboratory facilities. This tool, known as the Service Availability Mapping (SAM), has been implemented in several countries. Few HFA methods include community perceptions of quality of care or measure community engagement. Community scorecards are becoming popular among some donors to elicit information on health system responsiveness, which include a comprehensive set of indicators on dignity, autonomy, confidentiality, prompt attention, quality of basic amenities, access to social support networks during care, and choice of care provider [12]. Save the Children designed an innovative methodology, called Partnership Defined Quality, for communities and health systems to examine and collectively address performance deficiencies [13]. Community score cards were also developed in Ghana as part of the poverty reduction strategy efforts [14]. Some surveys, such as a DHS, attempt to obtain information on the quality of services provided by the nearest HF, in an effort to link service utilization, quality of care, and health outcomes.
Purpose of HFA Performance Methods
Performance measures inform managers about the quality of service provided. At the health system level, they drive health care resources where deficiencies have been identified [15]. The design of performance measures is determined by several factors: the purpose of the method; the entity whose quality is being measured; the type of measure, which may include both process and outcomes; and the users of the measure. The audience and entity are critical as one type of measure in a particular system may not be appropriate for application in another due to varying organizational environments and missions. Health systems vary in context and delivery and, therefore, HFs must be appropriately sampled to be representative and the results generalizable to the health system universe. Sampling of the clients and providers must also be performed with sufficient rigor to represent utilization and quality of care received. Outcome measures allow interpretations of the effect of interventions on a particular entity or population. They may or may not have comparison groups, may have several measures before or after the intervention to determine effectiveness, or compare services provided by different delivery systems. Most surveys are advocated by donors for specific disease or service oriented interventions on a specific beneficiary population [16]. Although the validity of these measures is tested and ensured, it seldom addresses the confounding factors, which may alter the effect of these interventions. Dimensions of quality measured also vary and not all include organizational performance indicators to determine coverage, access, utilization, inputs of infrastructure, human resource and management, support functions, equipment and drug availability and management, type and quality of services provided, client education and community outreach, and overall effectiveness, efficiency and equity.
________________________________________________________________________________________________________________________________________________________________________________________________________________________CCoommppaarriissoonn ooff HHFFAA MMeetthhooddss PPaaggee 1111 ooff 4477
The level of detail and sophistication that is reported on both process and outcome measures in clinical services and management functions depends on the intended audience. The dissemination and packaging of the results of these measures vary for patients and family, community structures, providers and supervisors/managers of an individual HF, a management team in the district or other audiences at the policy level in the national and sub-national level, donor entity, and the global network of disease-specific interest groups whose interest may be limited to the performance of specific disease control programs. The link between population based outcome measures assessed at the household or community level and the specific health entity is essential to determine the effectiveness of investments in the local health system.
Application of results from HF surveys include the following: Policy planners and decision-makers require appropriate data to determine future resource allocations
and consider alternative strategies, which may require shifts in policy. Data derived from the assessments provide information on resource adequacy and help ascertain
minimum standards based on patient load and population covered. In addition to determining total resource requirements for the entire package of primary health care
services, these measures also allow for costing of specific services within the health sector. Repeat surveys provide an indication of changes in health outcomes of populations and the
effectiveness of resource expended in the health sector. Deficiencies in inputs and process of care can be addressed appropriately through quality improvement initiatives. However the design of these improvement initiatives must allow for empirical measurements to ensure the effectiveness of strategies proposed/implemented.
Accountability of resources expended can be promoted through survey methods which can track public expenditure and quantify service delivery.
Performance-based contracts rely on these measures to provide incentives and bonuses and help make decisions on the ongoing role of the contracted agency.
The survey findings offer research opportunities to determine the critical determinants of health system performance including quality of care.
When linked with household surveys, the HFA data provide valuable insights into the health care-seeking behaviors of communities and help determine the factors that lead to increased utilization of proximal HFs.
Costing, capitation, and technical and allocative efficiency can be more carefully examined if data are available through repeat surveys.
Domains of Health Facility Performance Methods
Lindelow and Wagstaff demonstrate the relative advantages of selected HF methods, and their observations on the utility of these surveys are briefly summarized in this section [6]. Types of data collection methods also vary, just as the motivation and measures differ for various surveys. This may integrate patient observations of provider care that includes physical examination, clinical assessment, and treatment, including counseling, interviews with providers and patients, and obtaining information on facility preparedness to provide care. Indicators are developed based on the commonly applied systems approach developed by Donabedian to assess the adequacy of inputs, processes, outputs, and outcomes [17].
Inputs or Structure: The availability and quantity of inputs which may include human capital, provider competencies, infrastructure, supplies of drugs and equipment, availability of clinical and managerial guidelines, and the integration of the health management information system (HMIS), impact the performance of health services. These inputs are often described as the structure that encompasses the dimensions of resources and tools. Most performance measures examine the availability of such capital inputs as physical infrastructure, transport, basic functional equipment, water, power supply, latrines, etc., but the adequacy of these inputs remain under-explored. Depending on the type of facility, equipment requirements differ. Tertiary care or referral facilities will need to be equipped with functional laboratories and X-ray facilities, in addition to the standard equipment of refrigerators, thermometers, stethoscopes, blood pressure monitors, etc.

________________________________________________________________________________________________________________________________________________________________________________________________________________________CCoommppaarriissoonn ooff HHFFAA MMeetthhooddss PPaaggee 1122 ooff 4477
Variable or recurrent inputs include personnel (professional and support staff), and drugs and related supplies. Assessments are often made on type of providers, including knowledge, training received, compensation, benefits, etc. Financing aspects may also be included in the input measures which may relate to budget allocations for the individual HF or district, patient contributions or fee for services and revolving funds generated through the sale of commodities like bed nets or FP supplies. Assessments rarely include examination of income and expenses to determine the cost incurred for service provision and operations. Activity-based costing has been used in some settings [18, 19] but has not yet been integrated at the national level. However the acquisition and analysis of costing information can become extremely complex and is therefore seldom integrated in routine assessments. The data for input indicators is usually collected either through review of records, interviews or direct observations.
Processes of Care: These are performed for select primary health interventions. The care process poses additional problems in interpretation as there is considerable variability within and between providers, case mix, day of assessment, type of HF, type of service, presence of priority vertical program interventions, supervision, adequacy of inputs, etc. Clinical or technical quality of care refers to the adherence to specific tasks illustrated in evidence based or standard guidelines, which the health provider follows to perform the physical exam, diagnosis and treatment. The health provider and patient or caretaker interaction which includes the quality of counseling provided, feedback from the patient, and patient’s perception of care have considerable variability depending on the patient’s expectations, past experience, available amenities, etc and therefore have to be appropriately interpreted.
Outputs: These include service utilization, coverage, and capacity for care. Organizational cultures and practice also bias the relevance of these measures. Providers sometimes have a tendency to over- report or under-report incidence or utilization due to performance incentives especially in well-endowed vertical programs, distorting resource allocation. However vertical disease control programs have also been shown to strengthen health system capacity. Output indices are sometimes aggregate measures of indicators, which may be weighted more for key performance indicators.
Health outcomes: These measures include mortality and population measures of healthy life years, disability-adjusted life years (DALYs), and quality-adjusted life years (QuALYs), and may also include costs and equity.
In theory, the adequacy of inputs or structure must logically lead to better processes and care and ultimately better outcomes. However, they are often not clearly linked. Other factors impact health outcome measures and therefore interpretations on quality of care and outcomes must be carefully examined. It is also essential to give greater weight appropriately to performance indicators that have a more profound effect on quality of care. More empirical evidence is needed to interpret the findings of the process measurements on outcomes of care.
Commonly Employed Data Collection Methods
Methods of acquiring the data vary from routine health information systems collected at the national or sub-national level with a key set of performance indicators to rigorous surveys/censuses undertaken by external agencies either for accreditation purposes or to fulfill donor requirements. A more comprehensive package of indicators may be used to study impact or effectiveness. These are performed as before/after surveys or periodic national assessments every year or every three-to-five years. The most common methods include clinical observations of patient examinations, diagnoses, treatment, and counseling; interviews with providers; exit interviews with patients; and facility and record reviews. Clinical vignettes, which are hypothetical scenarios presented to providers to obtain information on how they would treat the case, are sometimes employed as an alternative to clinical observations. This has several advantages, as it eliminates the need for skilled enumerators to perform provider observations and eliminates the classic Hawthorne effect. However, it only provides a measure of competency, not actual performance, which may differ based on the contextual factors. The mystery client approach has also been applied in assessing quality of care in some primary health facilities [20].
________________________________________________________________________________________________________________________________________________________________________________________________________________________CCoommppaarriissoonn ooff HHFFAA MMeetthhooddss PPaaggee 1133 ooff 4477
Structured provider interviews must be followed with formative assessments using focus group discussions and key informant interviews with the provider to probe the cause of deficient performance behaviors and to engage frontline providers in innovative problem-solving mechanisms. Quantitative surveys on inputs and performance followed up with qualitative assessments with frontline providers in a consultative capacity can help identify reasons for deficient behavior and examine feasible solutions to correct deficiencies. The triangulation of various methods can offer a validation of information obtained and also provide additional insights into these performance gaps which can enable the initiation of performance improvement strategies.
In addition to the selection bias of interviewing users of the heath system, information obtained during exit surveys with patients conducted at the HF may have courtesy bias as patients may provide socially acceptable responses for fear of losing the existing service. This is often reported as a strong bias in interpreting perceived quality and satisfaction of care. Parallel assessments must be performed in the community to determine the perspectives of non-users of the system.
Rationale for Reexamining Current HFA Methods
MEASURE Evaluation is a major participate in measuring health system performance, primarily through its participation in the International Health Facility Assessment Network (IHFAN). IHFAN is a team of experts that promotes the availability, quality, and use of HFA methods and improves upon their design and implementation. This involves cataloging the existing tools and methods, technical assistance for implementation, and promotion of data use. IHFAN has undertaken several strategies to strengthen the various components of HFA procedures through improved communication, coordination, resource sharing, and dissemination. It has also made efforts to examine the validity of the instruments, procedures for data collection, management and utilization, and advocacy to appropriate donor and policy stakeholders.
Although population-based surveys have been successfully developed for field implementation, field managers with minimal training in sampling methods require simpler user-friendly mechanisms for conducting sample surveys to measure performance. To facilitate this process, IHFAN developed user-friendly manuals for application in the field. Profiles of Health Facility Assessment Methods and The Signature Domain and Geographic Coordinates: A Standardized Approach for Uniquely Identifying a Health Facility [21, 22] are widely used in planning surveys and have also been integrated for evaluating programs financed by the U.S. President’s Fund for AIDS Relief.
A comparative analysis of the commonly employed HF methods conducted in first-level health facilities offering outpatient basic primary health services is planned. The primary audience for this report includes health managers at the district level and donor and contracting agencies engaged in capacity building of district health systems and performance improvement for the sample surveys, and policy-makers and supporting agencies at the national level for the census surveys. Objectives are the following:
• Examine current national health facility survey methods and determine the comparative advantages and limitations of each method.
• Compare the sampling design in specific approaches, venturing implications for programs that might want to conduct HFAs.
• Determine the management utility of selected approaches through formative research with key informants representing policy-makers and HFA implementers in the field.

________________________________________________________________________________________________________________________________________________________________________________________________________________________CCoommppaarriissoonn ooff HHFFAA MMeetthhooddss PPaaggee 1144 ooff 4477
Methods
IHFAN’s health facility profiles document [21] provides a succinct overview of commonly applied methods in developing countries. This paper further examines the sampling methods and provides a comparison of the various approaches in an attempt to identify the distinctive features of each method.
Performance measures, which are often needed to comply with donor requirements, take considerable resources to implement. Capacity building for reporting and dissemination may be needed, for example. The managerial challenges in implementing these methods, and the implications of deploying already scarce health personnel to conduct these evaluations, also pose a major dilemma in undertaking these assessments, particularly due to the opportunity costs. A majority of health systems in developing countries have severe limitations in the technical expertise and research capacity needed to perform independent assessments. Most are heavily reliant on donor support and engage other institutions and academia to undertake these surveys. Hence, it is important to examine the perspectives of the implementers to determine the management utility and plans for future sustainability. A key informant interview guide was developed for interviews with policy planners, implementing agencies, and health providers to examine their perspectives on the management utility of selected approaches. Key informants were interviewed, including policy planners, project directors, systems supervisors/coordinators, and enumerators, and the findings are presented later in this paper. A comparison of the approach to health facility assessment in the specific methods appears next.
Based on the results of the review and key informant interviews, this paper discusses the comparative advantage and limitation of HF surveys and their management utility.
Results of the Comparative Analysis of Select HFA Methods
Comparison of Select HFA Methods
A. Sampling Methods and Design
In this section, we have summarized the observations of Turner, Angeles, Tsui, et al.[23] in their sampling manual for facility surveys, and have provided additional insights on the sampling procedures. Table 1 describes some of the sampling procedures employed for each method.
Sampling Frame
The sampling frame and design for a HFA depends on the purpose of the HFA. Of the eight methods we reviewed, QIQ and Integrated Management of Childhood Illnesses-Multi-Country Evaluation (IMCI-MCE) are specifically meant for certain types of facilities offering FP and IMCI services. SAM and health facility census (HFC) tools involve data collection from all facilities so sampling is irrelevant at the stage of selection, though it will still be required at the patient and provider level.
Developing a sampling frame for a facility can be challenging. Lists of public facilities from a ministry of health (MOH) are often incomplete, and lists of private facilities are often unavailable. Also, measures for determining the number of staff members and clients within a facility are often unavailable or incomplete. To ensure a more complete list of facilities, the following methods can be employed prior to the survey:
Update an already existing list of facilities through a dependent listing operation. Conduct an independent listing exercise for facilities. Compile a list of facilities but restrict it to a sector (such as large facilities) and use it combination with a
geographic area sample.

________________________________________________________________________________________________________________________________________________________________________________________________________________________CCoommppaarriissoonn ooff HHFFAA MMeetthhooddss PPaaggee 1155 ooff 4477
Table 1: Description of Sampling Methods*
HFA Method Sampling Methods and Description SPA IMCI-MCE BSC QIQ Rapid HFA
A. Sampling Design Frequency of assessment
3-5y Before /After Annual 1-2y 3-5 y
Sample size HF 400 NA 600 NA NA Patient observations
4000 NA 5000 NA NA
Provider interviews 1000 NA 1500 NA NA Sampling unit HF HF HF HF//districts HF/districts Sampling frame National list of
HF List of HF in selected districts or regions
Representative sampling strategy for both at facility level and client/provider level
list of all facilities that provide FP services by type and geographic location
HF providing health services of interest
Sampling design Probability Probability Probability Probability (HF) Non probability for patients and
providers
Probability within districts of interest
* Census methods are not included in this table. NA = not applicable.
Sampling Unit
The primary sampling unit is the facility within a given district or stratum (e.g., type of facility). Further sampling stages of clients, staff, and records are performed by some HFA methods to obtain an unbiased sample. Appropriate guidelines have to be provided in the manuals for eligibility and inclusion and exclusion criteria for selection of staff and patients before field implementation. Staff and clients should be sampled on a census basis when the facility has a few staff and clients. When the client load is high, probability sampling should be employed to obtain an unbiased estimate.
Inadequacies were evident in some sampling methods for selecting providers or clients. Only one of the HFA methodologies provides guidelines on how records should be sampled for facility audits; others have inadequate information on this aspect. Clinic records (e.g., client records to determine if appropriate treatments were given) need to be assembled for the time frame chosen to study, stratified by type as appropriate (e.g., child or adult, respiratory, diarrhea or other illnesses), counted, and then sampled with an appropriate size so a specified precision can be determined. Or if one wants to detect change over time, then the sample size is based on the magnitude of that change to detect.
Sample Size
Sample size considerations differ for stand-alone surveys versus linked surveys. For stand-alone surveys, samples sizes can be calculated according to pre-specified precision requirements. This is different for facility surveys that are linked with population surveys since the number of facilities in the sampling frame will depend on their availability in a population-based survey cluster or PSU (or the PSU and its surrounding PSUs or geographic area, if the geographic area is broadened beyond the PSU itself). If managers need to detect change over time in one indicator or a set of indicators, then the magnitude of the change, along with acceptable type I and type II errors, will determine the necessary sample size. Sample size can be calculated independently for facilities and for clients, staff, and records. Since clients, staff, and records are sampled within facilities, the
________________________________________________________________________________________________________________________________________________________________________________________________________________________CCoommppaarriissoonn ooff HHFFAA MMeetthhooddss PPaaggee 1166 ooff 4477
number to sample at a given facility will therefore depend on the number of facilities and the required overall sample size of clients and staff.
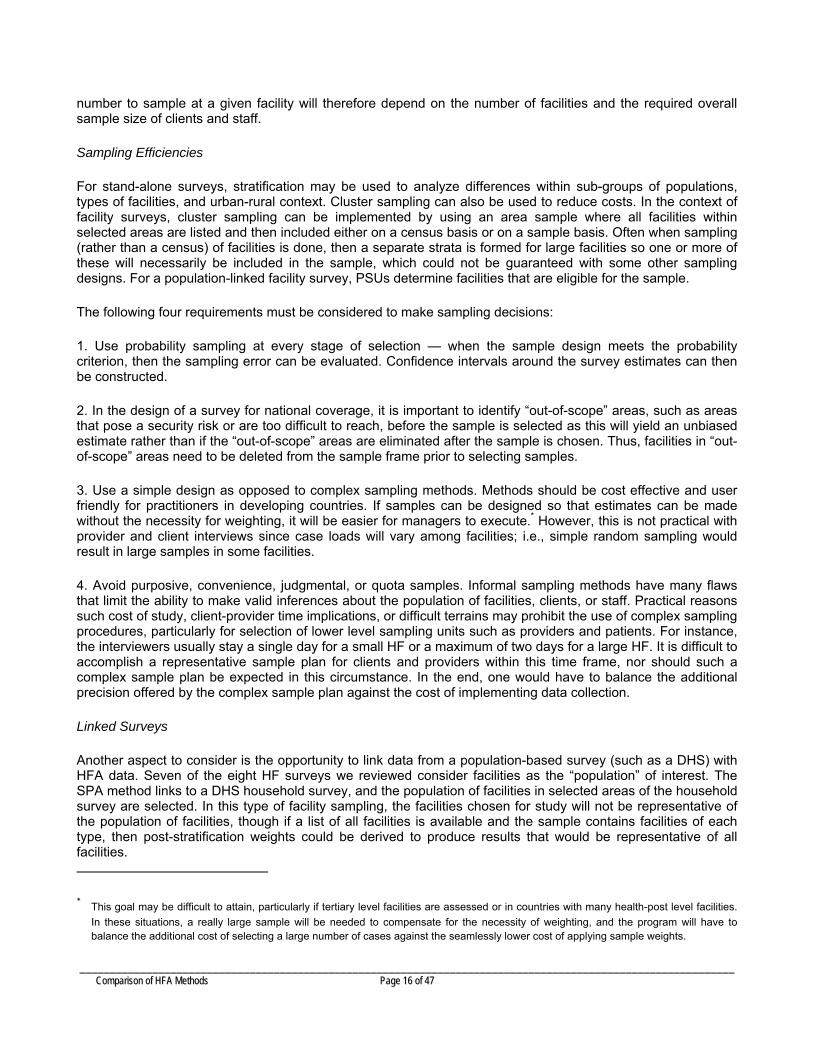
Sampling Efficiencies
For stand-alone surveys, stratification may be used to analyze differences within sub-groups of populations, types of facilities, and urban-rural context. Cluster sampling can also be used to reduce costs. In the context of facility surveys, cluster sampling can be implemented by using an area sample where all facilities within selected areas are listed and then included either on a census basis or on a sample basis. Often when sampling (rather than a census) of facilities is done, then a separate strata is formed for large facilities so one or more of these will necessarily be included in the sample, which could not be guaranteed with some other sampling designs. For a population-linked facility survey, PSUs determine facilities that are eligible for the sample.
The following four requirements must be considered to make sampling decisions:
1. Use probability sampling at every stage of selection — when the sample design meets the probability criterion, then the sampling error can be evaluated. Confidence intervals around the survey estimates can then be constructed.
2. In the design of a survey for national coverage, it is important to identify “out-of-scope” areas, such as areas that pose a security risk or are too difficult to reach, before the sample is selected as this will yield an unbiased estimate rather than if the “out-of-scope” areas are eliminated after the sample is chosen. Thus, facilities in “out-of-scope” areas need to be deleted from the sample frame prior to selecting samples.
3. Use a simple design as opposed to complex sampling methods. Methods should be cost effective and user friendly for practitioners in developing countries. If samples can be designed so that estimates can be made without the necessity for weighting, it will be easier for managers to execute.* However, this is not practical with provider and client interviews since case loads will vary among facilities; i.e., simple random sampling would result in large samples in some facilities.
4. Avoid purposive, convenience, judgmental, or quota samples. Informal sampling methods have many flaws that limit the ability to make valid inferences about the population of facilities, clients, or staff. Practical reasons such cost of study, client-provider time implications, or difficult terrains may prohibit the use of complex sampling procedures, particularly for selection of lower level sampling units such as providers and patients. For instance, the interviewers usually stay a single day for a small HF or a maximum of two days for a large HF. It is difficult to accomplish a representative sample plan for clients and providers within this time frame, nor should such a complex sample plan be expected in this circumstance. In the end, one would have to balance the additional precision offered by the complex sample plan against the cost of implementing data collection.
Linked Surveys
Another aspect to consider is the opportunity to link data from a population-based survey (such as a DHS) with HFA data. Seven of the eight HF surveys we reviewed consider facilities as the “population” of interest. The SPA method links to a DHS household survey, and the population of facilities in selected areas of the household survey are selected. In this type of facility sampling, the facilities chosen for study will not be representative of the population of facilities, though if a list of all facilities is available and the sample contains facilities of each type, then post-stratification weights could be derived to produce results that would be representative of all facilities.
* This goal may be difficult to attain, particularly if tertiary level facilities are assessed or in countries with many health-post level facilities. In these situations, a really large sample will be needed to compensate for the necessity of weighting, and the program will have to balance the additional cost of selecting a large number of cases against the seamlessly lower cost of applying sample weights.
________________________________________________________________________________________________________________________________________________________________________________________________________________________CCoommppaarriissoonn ooff HHFFAA MMeetthhooddss PPaaggee 1177 ooff 4477
Facility survey data may be linked together with household survey data to evaluate both short-term and long-term outcomes. Changes at the population level may be analyzed by attempting to establish a causal relationship between interventions and observed changes in outcomes in the sample, particularly if an intervention has been randomized. Or if the study is only observational, one can establish associations through multi-variate statistical methods.
The facility and population data may be linked at the district level (but ecological correlation will be a problem in establishing causation) or at the level of the sample area. HFA level data that are not linked to population level data is used mainly for monitoring purposes.
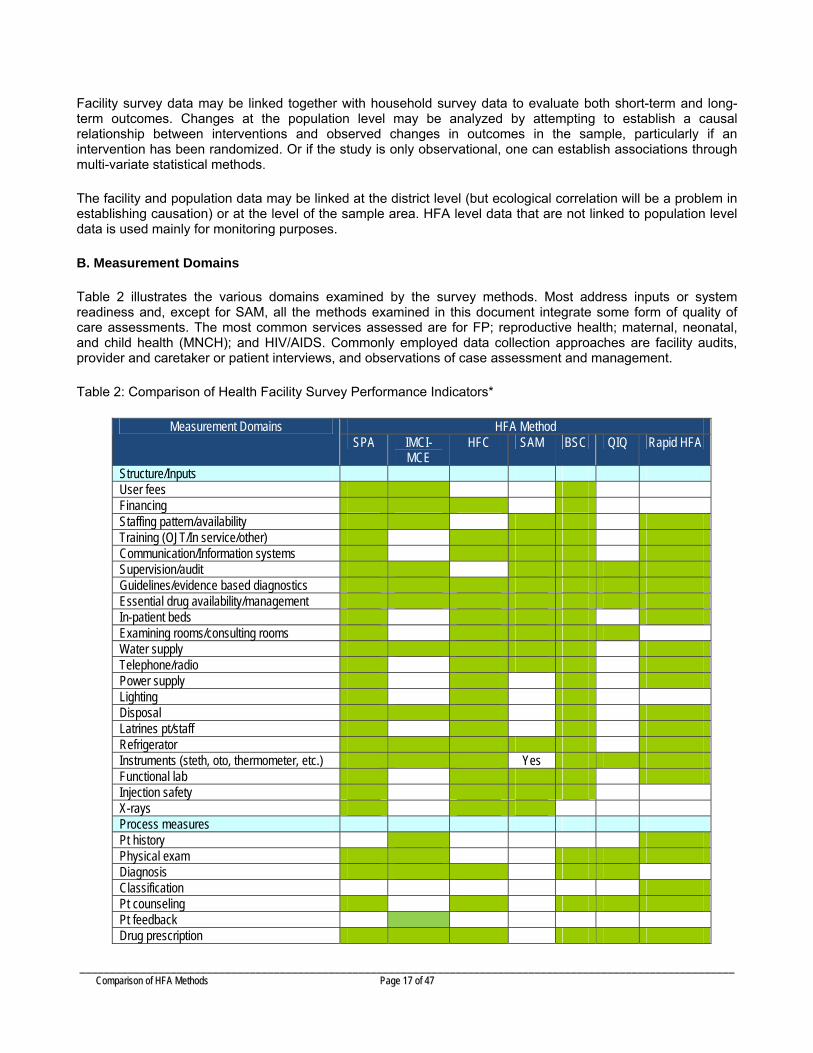
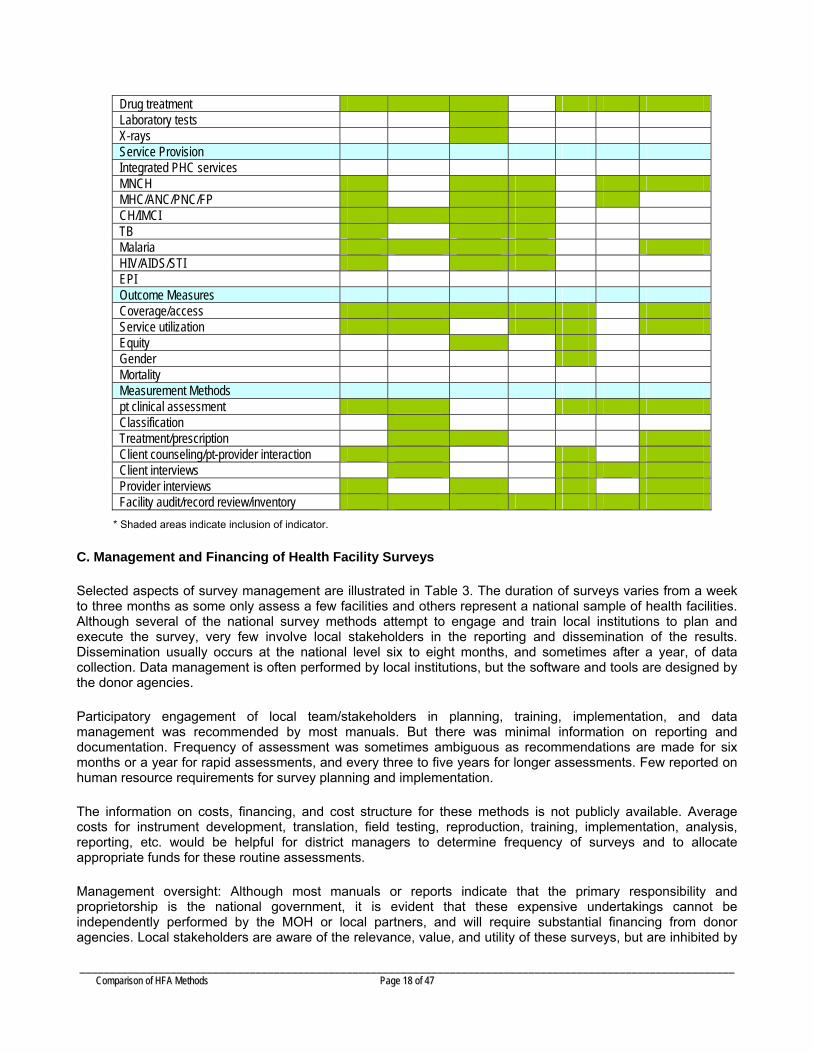
B. Measurement Domains
Table 2 illustrates the various domains examined by the survey methods. Most address inputs or system readiness and, except for SAM, all the methods examined in this document integrate some form of quality of care assessments. The most common services assessed are for FP; reproductive health; maternal, neonatal, and child health (MNCH); and HIV/AIDS. Commonly employed data collection approaches are facility audits, provider and caretaker or patient interviews, and observations of case assessment and management.
Table 2: Comparison of Health Facility Survey Performance Indicators*
HFA Method Measurement Domains SPA IMCI-
MCE HFC SAM BSC QIQ Rapid HFA
Structure/Inputs User fees Financing Staffing pattern/availability Training (OJT/In service/other) Communication/Information systems Supervision/audit Guidelines/evidence based diagnostics Essential drug availability/management In-patient beds Examining rooms/consulting rooms Water supply Telephone/radio Power supply Lighting Disposal Latrines pt/staff Refrigerator Instruments (steth, oto, thermometer, etc.) Yes Functional lab Injection safety X-rays Process measures Pt history Physical exam Diagnosis Classification Pt counseling Pt feedback Drug prescription
________________________________________________________________________________________________________________________________________________________________________________________________________________________CCoommppaarriissoonn ooff HHFFAA MMeetthhooddss PPaaggee 1188 ooff 4477
Drug treatment Laboratory tests X-rays Service Provision Integrated PHC services MNCH MHC/ANC/PNC/FP CH/IMCI TB Malaria HIV/AIDS/STI EPI Outcome Measures Coverage/access Service utilization Equity Gender Mortality Measurement Methods pt clinical assessment Classification Treatment/prescription Client counseling/pt-provider interaction Client interviews Provider interviews Facility audit/record review/inventory
* Shaded areas indicate inclusion of indicator.
C. Management and Financing of Health Facility Surveys
Selected aspects of survey management are illustrated in Table 3. The duration of surveys varies from a week to three months as some only assess a few facilities and others represent a national sample of health facilities. Although several of the national survey methods attempt to engage and train local institutions to plan and execute the survey, very few involve local stakeholders in the reporting and dissemination of the results. Dissemination usually occurs at the national level six to eight months, and sometimes after a year, of data collection. Data management is often performed by local institutions, but the software and tools are designed by the donor agencies.
Participatory engagement of local team/stakeholders in planning, training, implementation, and data management was recommended by most manuals. But there was minimal information on reporting and documentation. Frequency of assessment was sometimes ambiguous as recommendations are made for six months or a year for rapid assessments, and every three to five years for longer assessments. Few reported on human resource requirements for survey planning and implementation.
The information on costs, financing, and cost structure for these methods is not publicly available. Average costs for instrument development, translation, field testing, reproduction, training, implementation, analysis, reporting, etc. would be helpful for district managers to determine frequency of surveys and to allocate appropriate funds for these routine assessments.
Management oversight: Although most manuals or reports indicate that the primary responsibility and proprietorship is the national government, it is evident that these expensive undertakings cannot be independently performed by the MOH or local partners, and will require substantial financing from donor agencies. Local stakeholders are aware of the relevance, value, and utility of these surveys, but are inhibited by
________________________________________________________________________________________________________________________________________________________________________________________________________________________CCoommppaarriissoonn ooff HHFFAA MMeetthhooddss PPaaggee 1199 ooff 4477
resource constraints to sustain these measures. Capacity building at various levels is apparent but managers at the district level and frontline workers require simple, user-friendly tools for rapid assessments.
Opportunities for quality improvement, team-based problem solving to fulfill the learning and growth domain that the BSC method [24] advocates is often lacking in the assessment framework although some report increased coverage, service volume, and additional resources and staff deployed to districts performing sub-optimally or with severe resource constraints.
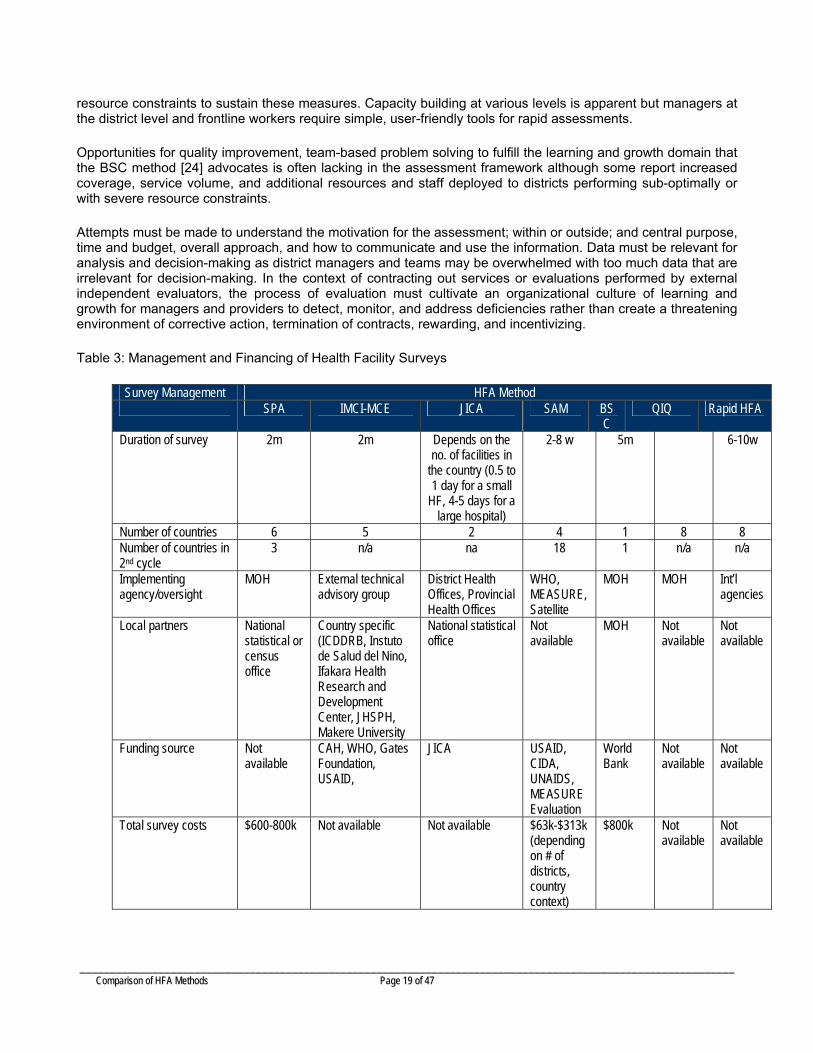
Attempts must be made to understand the motivation for the assessment; within or outside; and central purpose, time and budget, overall approach, and how to communicate and use the information. Data must be relevant for analysis and decision-making as district managers and teams may be overwhelmed with too much data that are irrelevant for decision-making. In the context of contracting out services or evaluations performed by external independent evaluators, the process of evaluation must cultivate an organizational culture of learning and growth for managers and providers to detect, monitor, and address deficiencies rather than create a threatening environment of corrective action, termination of contracts, rewarding, and incentivizing.
Table 3: Management and Financing of Health Facility Surveys
Survey Management HFA Method SPA IMCI-MCE JICA SAM BS
C QIQ Rapid HFA
Duration of survey 2m 2m Depends on the no. of facilities in
the country (0.5 to 1 day for a small
HF, 4-5 days for a large hospital)
2-8 w 5m 6-10w
Number of countries 6 5 2 4 1 8 8 Number of countries in 2nd cycle
3 n/a na 18 1 n/a n/a
Implementing agency/oversight
MOH External technical advisory group
District Health Offices, Provincial Health Offices
WHO, MEASURE, Satellite
MOH MOH Int’l agencies
Local partners National statistical or census office
Country specific (ICDDRB, Instuto de Salud del Nino, Ifakara Health Research and Development Center, JHSPH, Makere University
National statistical office
Not available
MOH Not available
Not available
Funding source Not available
CAH, WHO, Gates Foundation, USAID,
JICA USAID, CIDA, UNAIDS, MEASURE Evaluation
World Bank
Not available
Not available
Total survey costs $600-800k Not available Not available $63k-$313k (depending on # of districts, country context)
$800k Not available
Not available
________________________________________________________________________________________________________________________________________________________________________________________________________________________CCoommppaarriissoonn ooff HHFFAA MMeetthhooddss PPaaggee 2200 ooff 4477
Results of Key Informant Interviews on Utility of Select HFA Methods
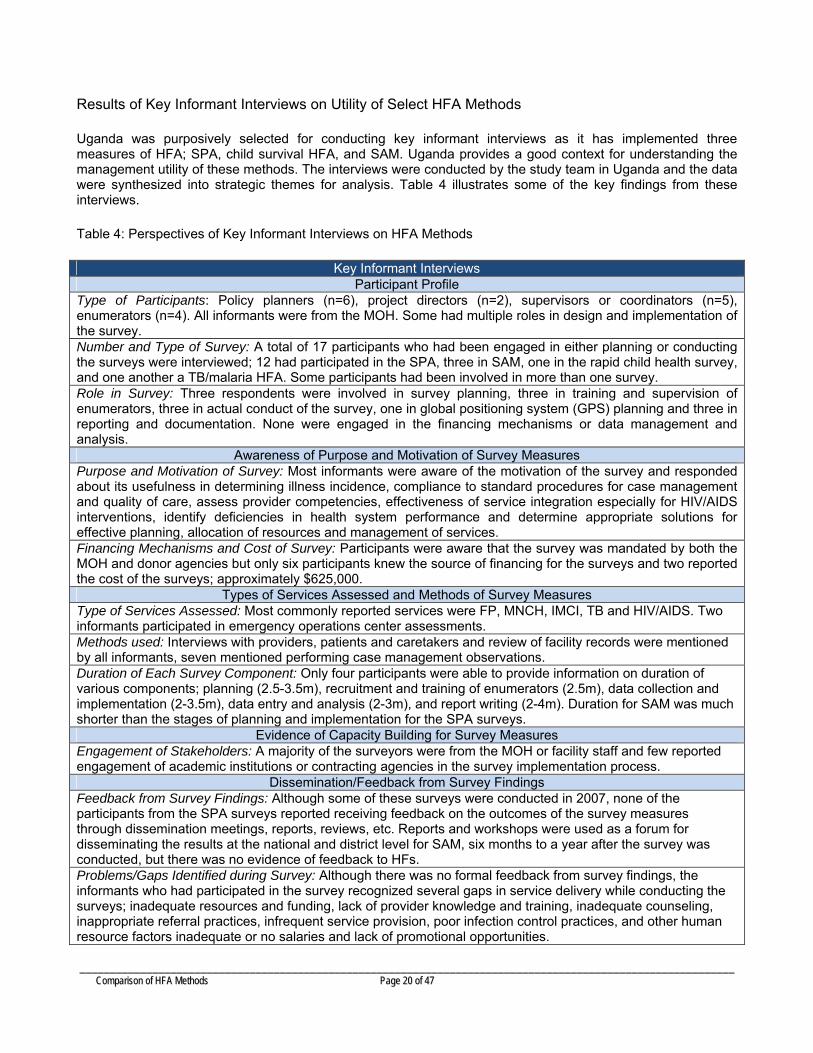
Uganda was purposively selected for conducting key informant interviews as it has implemented three measures of HFA; SPA, child survival HFA, and SAM. Uganda provides a good context for understanding the management utility of these methods. The interviews were conducted by the study team in Uganda and the data were synthesized into strategic themes for analysis. Table 4 illustrates some of the key findings from these interviews.
Table 4: Perspectives of Key Informant Interviews on HFA Methods
Key Informant Interviews Participant Profile
Type of Participants: Policy planners (n=6), project directors (n=2), supervisors or coordinators (n=5), enumerators (n=4). All informants were from the MOH. Some had multiple roles in design and implementation of the survey. Number and Type of Survey: A total of 17 participants who had been engaged in either planning or conducting the surveys were interviewed; 12 had participated in the SPA, three in SAM, one in the rapid child health survey, and one another a TB/malaria HFA. Some participants had been involved in more than one survey. Role in Survey: Three respondents were involved in survey planning, three in training and supervision of enumerators, three in actual conduct of the survey, one in global positioning system (GPS) planning and three in reporting and documentation. None were engaged in the financing mechanisms or data management and analysis.
Awareness of Purpose and Motivation of Survey Measures Purpose and Motivation of Survey: Most informants were aware of the motivation of the survey and responded about its usefulness in determining illness incidence, compliance to standard procedures for case management and quality of care, assess provider competencies, effectiveness of service integration especially for HIV/AIDS interventions, identify deficiencies in health system performance and determine appropriate solutions for effective planning, allocation of resources and management of services. Financing Mechanisms and Cost of Survey: Participants were aware that the survey was mandated by both the MOH and donor agencies but only six participants knew the source of financing for the surveys and two reported the cost of the surveys; approximately $625,000.
Types of Services Assessed and Methods of Survey Measures Type of Services Assessed: Most commonly reported services were FP, MNCH, IMCI, TB and HIV/AIDS. Two informants participated in emergency operations center assessments. Methods used: Interviews with providers, patients and caretakers and review of facility records were mentioned by all informants, seven mentioned performing case management observations. Duration of Each Survey Component: Only four participants were able to provide information on duration of various components; planning (2.5-3.5m), recruitment and training of enumerators (2.5m), data collection and implementation (2-3.5m), data entry and analysis (2-3m), and report writing (2-4m). Duration for SAM was much shorter than the stages of planning and implementation for the SPA surveys.
Evidence of Capacity Building for Survey Measures Engagement of Stakeholders: A majority of the surveyors were from the MOH or facility staff and few reported engagement of academic institutions or contracting agencies in the survey implementation process.
Dissemination/Feedback from Survey Findings Feedback from Survey Findings: Although some of these surveys were conducted in 2007, none of the participants from the SPA surveys reported receiving feedback on the outcomes of the survey measures through dissemination meetings, reports, reviews, etc. Reports and workshops were used as a forum for disseminating the results at the national and district level for SAM, six months to a year after the survey was conducted, but there was no evidence of feedback to HFs. Problems/Gaps Identified during Survey: Although there was no formal feedback from survey findings, the informants who had participated in the survey recognized several gaps in service delivery while conducting the surveys; inadequate resources and funding, lack of provider knowledge and training, inadequate counseling, inappropriate referral practices, infrequent service provision, poor infection control practices, and other human resource factors inadequate or no salaries and lack of promotional opportunities.

________________________________________________________________________________________________________________________________________________________________________________________________________________________CCoommppaarriissoonn ooff HHFFAA MMeetthhooddss PPaaggee 2211 ooff 4477
Measures Instituted to Address Gaps/Deficiencies: Some informants mentioned team-based problem solving, quality improvement initiatives, allocation of additional resources and deployment of additional personnel, improved supervision, additional training or job aids, performance incentives and provision of bicycles and ambulances to equip the facility as measures that were undertaken to address the gaps following the survey.
Advantages of Performing Surveys and Recommendations Advantages of Participating in Surveys: Responses varied from having a better understanding about the efficiency of operations, service delivery and integration, appropriate packaging of services and improving the quality of services by determining the gaps in performance. Perceived Challenges in Conducting these Surveys: All informants identified the lack of financial resources for conducting surveys as the major constraint at the national level. Other issues highlighted by those that participated in the SAM surveys were that the selected districts were not well informed, and enumerators were not paid adequately to conduct the surveys. Recommendations to Improve Applicability/Relevance of Surveys: In addition to the allocation of adequate resources for surveys, most recommended a quicker turn around for survey results and dissemination to enable them to address system deficiencies promptly and minimize time wasted on elaborate reporting procedures. Respondents from the SAM surveys recommended the integration of road access, infrastructure availability, reporting power, and supply of refrigerators to be included in the measures. Plans to Conduct HFA in the Future: Only two informants were aware of future plans for surveys, illustrating the lack of awareness among surveyors in how surveys are planned and managed. Contingency Plans for Conducting Surveys if Donor Support is Terminated: Only one participant felt that the surveys could be managed with existing national resources if donor support diminished or was terminated. Ensuring national budget allocation for survey mechanisms, creating rapid assessment procedures, and institutionalizing within the health systems activities were some of the recommendations provided for sustaining these measures.
Utility and Limitations of Current Health Facility Survey Methods for Management Decision-Making
Discussion of utility and limitations of health facility assessment should be done in terms of the objective of the assessment. Health facility assessment does not tell the state of the entire health systems but a piece of it. The WHO Health Systems Framework describes the six building blocs of the health systems that will need to be taken into consideration by any system that is focusing on the evaluation of the whole system. These building blocs include service delivery, human resource for health, information, medical products and logistics, financing, and governance. To obtain whole systems information, one will need to triangulate health facility data with information from different sources, including national health accounts (for information on financing), population based surveys/censuses (for information on service utilization and impact), vital registration, and special human resource surveys, e.g. labor force surveys and civil service payroll registries (for information on entry, distribution, and exits from the workforce). Health facility assessment offers no information on health financing or governance and only gives portions of information that are required for the analysis of health information and medical logistics. In general, health facility assessments provide detailed information on the context and content of service delivery, including inputs on processes, costs, outputs and quality, particularly access, coverage, and responsiveness of services to the needs (see Box 1, where illustrative indicators provided from health facility assessments are presented).
In general, complex measurement mechanisms, lack of integration in existing national information systems, difficulties in proofing statistical relevance (insufficient validity, lack of controlling for confounding factors, inappropriate sampling methods), high operational costs, limited utility, inconsistencies in performance incentives, delays in reporting to the internal users of the system and heavy reliance on donor assistance are some of the major drawbacks in routinizing these assessment approaches.[15]

________________________________________________________________________________________________________________________________________________________________________________________________________________________CCoommppaarriissoonn ooff HHFFAA MMeetthhooddss PPaaggee 2222 ooff 4477
Box 1 Key Information Provided by HF Data
Quantity and availability of services
Location of service delivery points Types of services available Quantity and frequency of services Staffing (numbers/qualifications/staffing patterns)
Quality of services
Guidelines for standards of care Health workers’ adherence to set guidelines for standards of care Availability and maintenance of diagnostics and client records
Support mechanisms
Condition of building and infrastructure (water, sanitation, electricity) Availability and condition of equipment Availability of supplies and medications Management systems and practices Existence of coordinating mechanisms among key services and programs: outreach services,
community workers, linkages with community
Complexities of the measurement mechanisms, lack of integration in existing national information systems, statistical relevance (validity, lack of control of confounding factors, inappropriate sampling methods), high operational costs, limited utility, inconsistencies in performance incentives, delays in reporting to the internal users of the system and heavy reliance on donor assistance are some of the major drawbacks in instituting these methods as routine performance measures.[15] The classic outcome measures of equity, effectiveness and efficiency which measure health status, access to and quality of care, patient satisfaction, risk protection, fair financing, cost effectiveness and accountability are seldom effectively integrated into the routine surveys that measure performance.[7]
Service Domains
Except for the HFC and BSC tools, almost all the HFA methods focus on child and maternal health and/or FP and HIV services. When looking for methods to rapidly assess health facilities, Rapid Health Facility Assessment (R-HFA), IMCI-MCE, QIQ, and Facility Audit Service of Quality (FASQ) would be appropriate. Not only are these methods quick and easy to use, they are designed self assessment methodologies that can be implemented by district health management teams. However, self assessment does come with a large possibility of losing the additional quality assurance of data being externally validated when data are collected by external assessors. SPA is a more comprehensive assessment of major primary health care services including malaria and TB in addition to maternal and child health, and HIV and FP. Selecting an appropriate HFA method involves a trade off between scope and depth. If we aim to assess the performance of a national or sub-national health system, the BSC would be a good option. However, when assessing more specific health services such as IMCI, HIV/AIDS, or FP, detailed study instruments focusing on these services would provide appropriate information on system readiness. Therefore, policy-makers and managers need to clarify the purpose of the HF survey, choose and adopt the most appropriate methodology while seeking technical assistance from relevant institutions.

________________________________________________________________________________________________________________________________________________________________________________________________________________________CCoommppaarriissoonn ooff HHFFAA MMeetthhooddss PPaaggee 2233 ooff 4477
Measurement Domains
If the primary purpose is to examine the availability of health infrastructure or health services, census-based approaches, such as SAM and HFC, are suitable option. However, availability of health services is not indicative of actual utilization and quality of such services; therefore, the results from SAM or HFC are useful only to highlight weakness of infrastructure, thereby flagging the problem in health systems for further examination. Although a census approach can obviate the risk of selection bias, it would be inefficient and expensive, particularly when we need to assess HFs in a large area, as information is inadequate in how districts are purposively selected.
Linkage to Household Survey Measures
Results of the SPA can be linked to a DHS household survey, as was demonstrated in Egypt. The SPA training manual describes how geo-coding may be accomplished but, information on how to link population- and health facility-based surveys is limited. In general, linking population-based and facility-based surveys requires advanced planning, selection, and management.
Linking household surveys and facility data raises important sampling questions.[6] Household surveys use population data as a sampling frame and usually have clusters of 15-30 households at the PSU level. Facilities that are close (note that “close” would need defining) to the PSU can be sampled, but this would not provide a representative sample of facilities used by the population. Alternatively, to obtain the latter information in the household survey on the names of facilities used by the sampled population could be collected and then a sample from a list can be derived according to proportions of households reporting use of each facility. Again, results would not be representative of facilities. For facility surveys that collect information from all facilities (i.e., a census of facilities), the problem does not arise since the information (e.g., from most used facilities) can, by definition, be linked to any household sample. Of interest from the linked data might be the quality of care at facilities nearest to the population or at facilities most used by the population.
Number of Indicators and Aggregate Measure of Performance
The rapid measures of QIQ and R-HFA have a relatively short battery of performance indicators that can be routinely implemented at the facility level with minimal resources. The IMCI-MCE provides aggregate measures of performance of quality of care and indexes of equipment and drug availability, provider and patient satisfaction, etc. However none of the measures weight priority indicators. Aggregate measures are appropriate for policy purposes to determine overall change in health system performance. The BSC uses median values of performance for benchmarking acceptable quality of care and determine improvements over time.
Validity of Measures
Although decision-making at the operational units must be driven by data from routine health management information systems, inherent deficiencies and biases in reporting caused in part by the unrealistic reporting burden and expectations for service provision of health providers have resulted in the need for validated survey measures. Discrepancies between findings from survey measures and routine health information systems warrant careful examination of the type of service, indicators employed, sampling universe, and period of assessment.
A 2008 publication on the over estimation of bed net use of HF surveys and censuses in comparison to household survey data has highlighted the need for additional studies to examine the validity, cost and utility of HFA measures, as this may lead to inappropriate strategies for public health and missed opportunities.[25]
None of the methods described perform multiple assessments of care on consecutive days. Client load varies depending on the day of assessment, and impacts the quality of care, although the literature provides conflicting evidence. Facilities that have a high volume of certain conditions have been shown to provide better quality of care in terms of evidence based standards and facilities with high volume of services have also demonstrated

________________________________________________________________________________________________________________________________________________________________________________________________________________________CCoommppaarriissoonn ooff HHFFAA MMeetthhooddss PPaaggee 2244 ooff 4477
poor provider compliance to clinical standards.[26,27] Except for the IMCI-MCE, which performs a reassessment “gold standard” with a trained physician, none of the other methods attempt to reassess or validate the findings, although some attempt to address this during training. The manuals provide minimal information on whether the facility visits are planned with prior notification of supervisors or performed as surprise visits to capture realities of service delivery.
Type of Enumerators
Most survey enumerators are trained providers from the MOH, academia, statistical institutions, and project staff. However in the absence of surveyors with clinical experience, school teachers have been used to assess quality of care, which raises concerns on validity of observations.
Interpretation of Survey Results
The interpretations of quality of care have to be made cautiously, considering the inherent biases due to sampling errors. Most measures require large sample sizes and appropriate statistical computations to assign attributable causes to certain disease or management interventions, particularly if these are measuring outcome variables.
Multiple/Parallel Performance Measures
Routine HMIS, which may be paper records or computerized systems, have inherent deficiencies and pose a dilemma in meaningful interpretations for improvements in health system performance. Health providers are encumbered with vast volumes of reporting requirements. In India and Tanzania, providers reported spending 30% to 50% of the time on reports.[28,29] Multiple measures including national HMIS measures, disease control vertical programs and donor-initiated approaches place increased demands on health providers and the system as they have multiple reporting requirements with considerable variability of indicators.[5]
Reporting Requirements and Measures to Address Performance Deficiencies Identified by HFAs
The audience for survey results varies from governments that need routine measures to allow informed decisions for funding for health system resources and policy to donors for documenting effectiveness of developmental funding to researchers for the evidence base on health system reform and scale up strategies. The often neglected stakeholders are the frontline workers, who seldom receive feedback on the performance of their HF. Timely feedback and dissemination to the functional units at the district level are often not carried out appropriately. Reports are disseminated at the national level but seldom shared with the health providers in the facility. In rare circumstances when they are disseminated, it is often not within an acceptable time frame to institute quality improvement strategies. Documentation on measures that were undertaken to correct performance deficiencies is often lacking. The importance of packaging the various types of data for various stakeholders; patients and community, care providers, managers and policy planners for appropriate decision making in the health system has been emphasized in publications.[5]
Information on Performance Improvement Measures
Reports must include adequate information on performance improvement activities undertaken by national or sub-national health systems in correcting deficiencies identified by HF surveys (Figure 2). Although some national information is available on deployment of additional staff, increase in resources, HF infrastructure, or management strategies, there is minimal evidence that these measures are undertaken to address specific performance deficiencies identified by HF assessments. The role of district management teams is critical to address performance deficiencies highlighted by surveys and the institution of performance improvement teams.

________________________________________________________________________________________________________________________________________________________________________________________________________________________CCoommppaarriissoonn ooff HHFFAA MMeetthhooddss PPaaggee 2255 ooff 4477
Figure 2: Illustrative steps in indentifying data for addressing a quality improvement problem.
Unsustainable Funding Mechanisms
Inconsistencies and gaps in the funding mechanisms for performing sophisticated surveys also pose enormous challenges to the national and local health system. The costs of planning, production of survey instruments, training, implementation, data entry, aggregation, reporting, and dissemination of data are often shared by the donors and the national systems. Furthermore, there is minimal evidence in developing countries where these measures are routinely integrated in the national health system performance initiatives without donor support. The information regarding the cost of survey is not provided in most methods. However, since all the methods examine each facility in one day using a group of surveyors, the total cost is likely to be dictated by the total number of HFs and districts sampled for the survey. Information is lacking on strategies employed to forecast the type and number of surveys to be implemented in each country. Anecdotal information from implementers of the major surveys indicates field costs ranging from $600,000 to $1 million. National health systems spend considerable time in integrating these sophisticated metrics for measurement and are not always ensured of continued donor investments to sustain their implementation.
Conclusions and Recommendations
Several HF survey methods commonly employed in the outpatient primary care facilities in developing countries were examined to determine their relative advantages and generate some useful recommendations to improve their utility and generalizability for appropriate decision-making. They vary in scope, type of sampling, type of service, methodology of data collection, and application. The SPA and SAM attempt to link health facility data to household measures to make meaningful interpretations of health system performance.
Attempts must be made to engage the frontline workers and district management teams in the development, execution, analysis of HFA, and improvement mechanisms to promote ownership and motivation for improved care. In situations with a large donor presence, efforts must be made to integrate existing methods and develop simple rapid surveys that can be conducted routinely and be comparable to indicators measured through the local and national HMIS. This would reduce redundancy, paper work, and free staff time to provide quality clinical care. Often data are underutilized or not communicated in a form and time that is practical for change by the frontline providers. Community awareness and accountability can also increase the demand for quality
Gap Analysis/ Performance Deficiencies
Baseline HF Survey Year X1
Quality Improvement/
Resource Allocation Problem
Follow Up HF Survey
Year X2
________________________________________________________________________________________________________________________________________________________________________________________________________________________CCoommppaarriissoonn ooff HHFFAA MMeetthhooddss PPaaggee 2266 ooff 4477
services and therefore means to communicate the results of the survey must be instituted appropriately. A well functioning supportive supervision system may be another support strategy that can be employed and integrated within the routine performance measure system to ensure success and ownership to these externally mandated measurement activities.
It is important to look beyond a single service delivery system to measure the performance of the entire health system because optimization of the performance of one or two services with significant donor investments like HIV/AIDS may lead to the sub-optimization of essential primary health services like reproductive health, translating to opportunity costs of optimizing specific vertical disease specific interventions.
Aggregate measures of performance indicators can provide a more comprehensive overview of performance for national level decision-making, but individual indictors are essential for instituting appropriate performance improvement strategies at the HF level.
Performance measures are a necessary investment for accountability of health resources. Despite the many drawbacks of existing methods, they provide a snap shot of resource availability, coverage and quality of essential primary health services, and outcome measures of health status of populations. To further improve the utility of these measures, additional efforts are needed to simplify these tools and ensure integration in the existing national health system monitoring mechanisms. Documentation of effectiveness of performance improvement strategies and dissemination to the appropriate stakeholders (especially to the front line health workers, community members, and district health team) is essential to promote data propriety and momentum for improving health service delivery.[15] In addition to the need for modifying the practices of the health institutions and developing the estimates and measures, additional efforts have to be made to document and measure changes in HF performance or service quality between these survey measures to offer evidence of improvements generated through increased resource investments, quality improvement strategies etc. Walker and colleagues recommend some practical measures to assess the validity of data and measures used.[2] Transparency and reporting or dissemination mechanisms to the appropriate audience must include the front line providers of the system who are seldom aware or informed of the findings of these assessments. This includes the cost structure of financing for these methods, and investments made by global health agencies and the implications for sustainability of future measures by the national health entity. Engagement of national and appropriate district and community level understanding and expertise in the design and validation of these measures is mandatory in ensuring data proprietorship and the ability to leverage local resources and expertise. This would facilitate appropriate local capacity building and expertise and allow national measurement systems to gradually wean away from the traditional practice of investing in external consultant expertise.
________________________________________________________________________________________________________________________________________________________________________________________________________________________CCoommppaarriissoonn ooff HHFFAA MMeetthhooddss PPaaggee 2277 ooff 4477
Appendices
Appendix A: Overview of National HFA Methods
The HFA methods described by Lindlow and Wagstaff [6] are summarized in this section.
Demographic and Health Surveys
The DHS have been providing important information at the household and individual level health data since 1984. The DHS tools collect data at the community level and more recently detailed facility surveys (SPA) have been collecting information on facilities as part of DHS+ activities. The SPAs provide information about the characteristics of health services including infrastructure, utilization, availability and quality. These surveys may be used when comparing different providers such as government facilities, nongovernmental organizations (NGOs), and community health workers.
In Kenya, the SPA that was conducted in 1999 focused on recording the availability and quality of services in the areas of FP, STIs and maternal and child health. The results highlighted problems of compliance with infection control procedures among clients as well as poor diagnostic processes where clients were not provided with adequate information to choose between interventions. The SPA also highlighted problems of drug stock outs for STI infections, lack of equipment to deal with obstetric complications and poor prescription practices.
The Living Standards Measurement Study (LSMS)
The World Bank established the LSMS in 1980 with the main objective to collect household level data to assess household welfare, to understand household behavior, and to evaluate the effect of various government policies on the living conditions of the population. It allows four types of analysis (i) descriptive analysis on living standards, (ii) monitoring of poverty and living standards over time, (iii) incidence and coverage of government programs, and (iv) impact of policies and programs on household behavior and welfare. The household surveys which form the core of LSMS, provide information on health related behavior, utilization of health services, health expenditures, insurance status, and access to health services. Complementary data are collected through community and price questionnaires and in some cases detailed service provider data has been collected.
In Jamaica the HF survey as part of the LSMS survey was carried out to collect information related to facility characteristics, drug supply and equipment, FP services at the primary level and more detailed data on facility characteristics, personnel and equipment at the secondary/tertiary level. In Vietnam the LSMS survey included school and HF surveys.
Situation Analysis (SA)
SA was introduced by the Population Council in 1989, and focuses on the system’s readiness of FP/reproductive health (RH) programs to deliver services and the quality of care received by clients. The SA approach includes structured interviews with managers and facility staff, inventory review of clinic facilities including the availability of equipment and consumables, review of service statistics for 12 months, direct observation of client-provider interaction and interviews with clients of FP and MCH services. Data from SAs have been used for developing training programs, formulating sector strategies and designing FP programs.
The Indonesia Family Life Survey (IFLS)
________________________________________________________________________________________________________________________________________________________________________________________________________________________CCoommppaarriissoonn ooff HHFFAA MMeetthhooddss PPaaggee 2288 ooff 4477
The IFLS is a longitudinal survey measuring a range of individual and household level behaviors and outcomes. Information on economic well-being, education, migration, labor, market outcomes, fertility and contraceptive use, health status, use of health care and health insurances are collected as well as community level data. With regards to the HF survey, the surveys cover government health centers and sub-centers, private clinics and doctors, midwives, nurses and paramedics, and community health posts. In general the questionnaires collect data on availability and prices of services, lab tests and drugs, availability of equipment and supplies, observations about the facility’s cleanliness as well as assess the knowledge of processes in patient care among health workers.
MEASURE Evaluation
The purpose of the project is to develop and apply methods for monitoring and evaluation in areas of FP, MH, STI/HIV/AIDS, nutrition, and infectious disease. The aims of the MEASURE Evaluation project are to (i) improve the ability of monitoring systems to track results, (ii) identify and test appropriate indicators, and (iii) evaluate interventions including their cost-effectiveness.
The Uganda DISH Survey
The Delivery of Improved Services for Health Survey (DISH) project is one of the largest RH programs in Uganda. Surveys within this project measure changes in reproductive and MCH knowledge and behavior. Two rounds of surveys have been carried out with both household and facility level data. The household component collects information on IEC, FP, MCH and nutrition, STIs, HIV/AIDS and HF. At the facility level, facility interviews and inventory questionnaires are administered as well as separate inventory questionnaires for pharmacies and drug shops.
Health Care Decentralization n Paraguay
The objective of this study was to measure the effect of decentralizing the management control for basic health services provision from central to municipal government in Paraguay. Public HF, their clients and municipality populations were the main units of analysis. Information on costs, efficiency, health service quality, and patterns of health service use and equity were collected. Three types of questionnaires were administered at the facility level: inventory surveys; interviews with facility staff; and direct observation of availability of supplies, equipment, etc. Exit interviews were conducted with clients to collect information on socio-economic characteristics, services received, reason for visit, travel time, payments, perceptions of quality, etc. In addition, a household survey was also administered to collect information on socioeconomic characteristics, health outcomes and health care seeking behavior.
WHO Multi-Country Evaluation of IMCI-MCE
The IMCI-MCE was carried out with the purpose to (i) document the effects of IMCI interventions on health workers performance, health systems and family behaviors; (ii) determine if the IMCI strategy as a whole has a measurable impact on reducing under five morbidity and mortality; (iii) describe the cost of IMCI implementation at different levels; (iv) provide a basis for improvements in implementation thereby increasing the sustainability of IMCI and other child health strategies; and (v) support planning and advocacy for childhood interventions by ministries of health in developing countries and global partners.
Public Expenditure Tracking Surveys (PETS)
Two surveys fall under the umbrella of PETS; tracing studies and quantitative service delivery surveys (QSDSs). Tracing studies track the flow of resources through the various levels of institutions to determine how much of the original resources reach the various levels of service and how long it takes for the resources to reach these levels. QSDS tries to make the linkage between service delivery units and administrative and logistical systems that are “upstream.” In Uganda, the PETS (1996) focused on why service delivery outputs in health and education sectors had not responded to considerable increases in public spending. The results showed how
________________________________________________________________________________________________________________________________________________________________________________________________________________________CCoommppaarriissoonn ooff HHFFAA MMeetthhooddss PPaaggee 2299 ooff 4477
weak governance and lack of accountability could prevent adequate budget implementation. A follow up tracing study was conducted in 1999 in the education sector, and found considerable improvements in the amount of funds schools received as compared to 1996. Some of these improvements were attributed to increases in transparency and accountability. However problems still exist including the delay in receiving funds at different levels of administration.
Service Availability Mapping
SAM [21] is used to provide district and national planners with an overview of what types of services are available and where and can be used to monitor the distribution of services and resources. SAM provides information on the availability and location of physical infrastructures, the location of health service delivery points, the availability and location of health services and health workers. This survey is useful when there is an immediate need for information on basic infrastructure and service availability. It is a district-owned facility monitoring system and can be used to guide decision making at the district and given that it is not disease specific it can be adapted to and implemented in different settings. SAM consists of two phases: the first phase includes a national-level stakeholder workshop where health priorities are identified and questionnaires are adapted based on identified health priorities, training, and dissemination. A separate facility questionnaire is used for all of the public and private HF in a subset of the districts. If interest exists to scale up after the completion of phase one, phase two, which is the national roll out phase is implemented. The main data collection tools are personal digital assistant (PDA) for the district and facility questionnaires and GPS for the facility locations. Since SAM is a monitoring tool, it can be implemented on a regular basis.
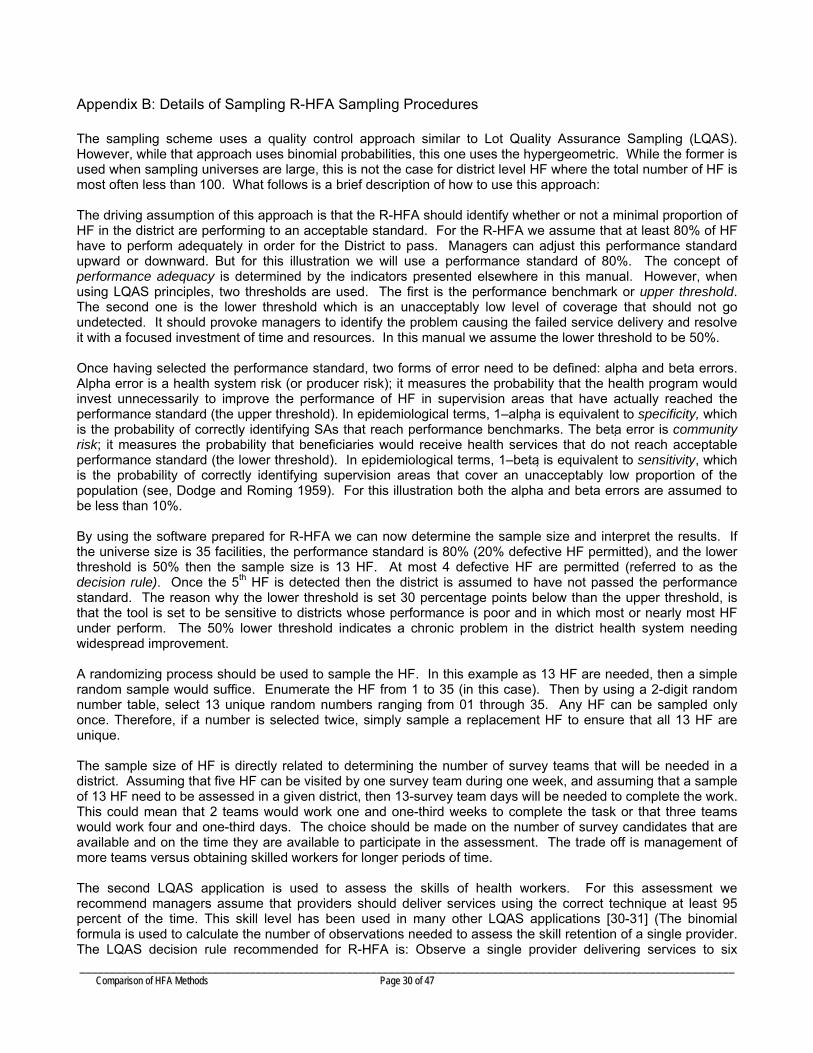
________________________________________________________________________________________________________________________________________________________________________________________________________________________CCoommppaarriissoonn ooff HHFFAA MMeetthhooddss PPaaggee 3300 ooff 4477
Appendix B: Details of Sampling R-HFA Sampling Procedures
The sampling scheme uses a quality control approach similar to Lot Quality Assurance Sampling (LQAS). However, while that approach uses binomial probabilities, this one uses the hypergeometric. While the former is used when sampling universes are large, this is not the case for district level HF where the total number of HF is most often less than 100. What follows is a brief description of how to use this approach: The driving assumption of this approach is that the R-HFA should identify whether or not a minimal proportion of HF in the district are performing to an acceptable standard. For the R-HFA we assume that at least 80% of HF have to perform adequately in order for the District to pass. Managers can adjust this performance standard upward or downward. But for this illustration we will use a performance standard of 80%. The concept of performance adequacy is determined by the indicators presented elsewhere in this manual. However, when using LQAS principles, two thresholds are used. The first is the performance benchmark or upper threshold. The second one is the lower threshold which is an unacceptably low level of coverage that should not go undetected. It should provoke managers to identify the problem causing the failed service delivery and resolve it with a focused investment of time and resources. In this manual we assume the lower threshold to be 50%. Once having selected the performance standard, two forms of error need to be defined: alpha and beta errors. Alpha error is a health system risk (or producer risk); it measures the probability that the health program would invest unnecessarily to improve the performance of HF in supervision areas that have actually reached the performance standard (the upper threshold). In epidemiological terms, 1–alpha is equivalent to specificity, which is the probability of correctly identifying SAs that reach performance benchmarks. The beta error is community risk; it measures the probability that beneficiaries would receive health services that do not reach acceptable performance standard (the lower threshold). In epidemiological terms, 1–beta is equivalent to sensitivity, which is the probability of correctly identifying supervision areas that cover an unacceptably low proportion of the population (see, Dodge and Roming 1959). For this illustration both the alpha and beta errors are assumed to be less than 10%. By using the software prepared for R-HFA we can now determine the sample size and interpret the results. If the universe size is 35 facilities, the performance standard is 80% (20% defective HF permitted), and the lower threshold is 50% then the sample size is 13 HF. At most 4 defective HF are permitted (referred to as the decision rule). Once the 5th HF is detected then the district is assumed to have not passed the performance standard. The reason why the lower threshold is set 30 percentage points below than the upper threshold, is that the tool is set to be sensitive to districts whose performance is poor and in which most or nearly most HF under perform. The 50% lower threshold indicates a chronic problem in the district health system needing widespread improvement. A randomizing process should be used to sample the HF. In this example as 13 HF are needed, then a simple random sample would suffice. Enumerate the HF from 1 to 35 (in this case). Then by using a 2-digit random number table, select 13 unique random numbers ranging from 01 through 35. Any HF can be sampled only once. Therefore, if a number is selected twice, simply sample a replacement HF to ensure that all 13 HF are unique. The sample size of HF is directly related to determining the number of survey teams that will be needed in a district. Assuming that five HF can be visited by one survey team during one week, and assuming that a sample of 13 HF need to be assessed in a given district, then 13-survey team days will be needed to complete the work. This could mean that 2 teams would work one and one-third weeks to complete the task or that three teams would work four and one-third days. The choice should be made on the number of survey candidates that are available and on the time they are available to participate in the assessment. The trade off is management of more teams versus obtaining skilled workers for longer periods of time. The second LQAS application is used to assess the skills of health workers. For this assessment we recommend managers assume that providers should deliver services using the correct technique at least 95 percent of the time. This skill level has been used in many other LQAS applications [30-31] (The binomial formula is used to calculate the number of observations needed to assess the skill retention of a single provider. The LQAS decision rule recommended for R-HFA is: Observe a single provider delivering services to six

________________________________________________________________________________________________________________________________________________________________________________________________________________________CCoommppaarriissoonn ooff HHFFAA MMeetthhooddss PPaaggee 3311 ooff 4477
consecutive children and allow no more than one error for any skill. If a second error occurs, judge the provider as not having retained the skill. This decision rule is 97% specific to providers who use the correct skills at least 95% of the time when delivering services. The tool assumes that the pattern in which children arrive at a HF is not associated with the care they receive. Therefore, any 6 consecutive children can be used as the sample for the assessment. Should a mother bring more than one child for treatment for one of the diseases used by the tool, the survey should select one of them randomly to serve as the index child. The other children (probably siblings) should be excluded from the study and the next care taker’s child sampled. Sampling Community Health Workers to Interview If the project will be working with community health workers (CHWs) to increase access to services, then assessment of their skills and readiness is a good idea. Most districts will not have many MOH-recognized CHWs, and so it may be feasible to assess a large fraction of them. In any case, a simple random sample of 40-50 of them will give a sample that will more than suffice to measure significant changes in quality over time (in the range of 20% or more) which is quite feasible in many places. To select a simple random sample, a line listing of all CHWs is necessary. A feasible way to obtain such a sample is from the District Health Officer, or possibly project staff’s own information. Then after listing all of the CHWs, determine the sampling fraction (x) needed to choose 40-50, begin with a random start on the list and mark every xth CHW on the list.

________________________________________________________________________________________________________________________________________________________________________________________________________________________CCoommppaarriissoonn ooff HHFFAA MMeetthhooddss PPaaggee 3322 ooff 4477
Appendix C: Summary Profile of Key HFA Methods
This section provides a summary of eight major HFA measures [21] employed by donor agencies and national health systems in developing countries. Although some of these were examined briefly in the profiles document, the implications of sampling and comparative advantages are more detailed in this document.
A. Service Provision Assessment
Management and Partner Institutions
The innovators of SPA [33-36] are the Measure Evaluation/DHS team and implemented by the MOH and local implementing partners (e.g., statistical or census office) with technical assistance from Macro International. The process is managed by Measure Evaluation and partner institutions vary with country; National Coordinating Agency for Population and Development, Central Bureau of Statistics, U.S. Agency for International Development (USAID), Department for International Development (United Kingdom), and United Nations Children’s Fund.
Description of Method
Purpose: National or regional monitoring of health system performance; tracks trends over time and sustainability of improvements. The tool provides information on the delivery of health services particularly in child health, maternity care, family planning, and STIs and HIV/AIDS with the aim of helping health programs and policy makers in prioritizing interventions to increase the provision of quality health services.
Measurement Domains: 1. Facility Inventory (Service Availability, Staffing, Supervision, Quality of Care, Catchment Areas, Vaccine Logistic System, Child Health Services, FP Services, Antenatal Care Services, Delivery Care Services, STI and HIV/AIDS Services, Laboratory Diagnostics, Availability of Contraceptive Supplies, Availability of Essential Medicines and Supplies for Providing Child Health, Maternal Health and STI and HIV/AIDS Services) 2. Provider Characteristics (Experience, Training, In-service Training) 3. Observation of Service Delivery (Client history, Examination of the client, Treatments provided, Elements of client counseling and education) 4. Clients (Client satisfaction, Client perception, Client characteristics)
Measurement Methods: Clinical Provider Observations, Client exit interview, Provider interview, Facility assessment, Record/Report Review
Description of Methodology: Survey instruments for data collection, are adopted from generic questionnaires developed by MEASURE DHS with appropriate adaptations by the local technical working group, to address national requirements and local context. These instruments are pre-tested before the actual survey. Data collectors and interviewers are recruited locally, consisting of clinical officers, nurses, and social scientists. Training is provided to these staff for a few weeks through classroom lectures and role-play for observations and interviews. The planned visits are usually conducted in one day for most facilities, but the duration is longer for tertiary care facilities and hospitals. If a particular service is not provided on the day of the survey, the team returns on a later day when the service is provided. Informed consent is obtained from personnel in charge of facilities, and interviewees as well as clients.
Duration of Assessment: It varies depending on the country, but estimated between 2-4months (e.g. 4 months in Tanzania, 4 months in Kenya, 2 months in Egypt), additional time is required for training.
Assessment Cycle: Recommended period is every 3-5 years, but determined locally.
________________________________________________________________________________________________________________________________________________________________________________________________________________________CCoommppaarriissoonn ooff HHFFAA MMeetthhooddss PPaaggee 3333 ooff 4477
Sampling Procedures
Type of Sampling Method: Probability sampling of HFs in a country using stratified sampling methods to allow comparison of facilities managed under different authorities (e.g. government, NGO, private) in each region, maintaining actual facility distribution in the country. The total sample size is determined on the basis of funding and logistic considerations, as well as the minimum sample size required for precision of the estimates.
Description of Sampling Procedure:
Districts: Sampling frame is a list of HFs at the country level
Facilities: All HF are included in the sampling frame and HF for assessments are selected based on stratified sampling to represent national and provincial distribution of different types of HF (i.e. hospitals, health centers, maternities, clinics, dispensaries and stand-alone voluntary counseling and testing (VCT) facilities with different managing authorities, including government, non-governmental organizations, private for-profit, and faith-based organizations). Major facilities such as national referral hospitals and provincial general hospitals are purposely included in the sample. A nationally representative sample of approximately 400 HF is included in the survey.
Patients/Clients: Opportunistic sampling is employed. Clients are selected for observation as they arrive to include a maximum of 5 clients per provider for each service, or a maximum of 15 observations per service for each facility. Approximately 4000 observations are conducted for each survey.
Providers: A sample of health providers are selected from those present on the day of the survey. Quota sampling, i.e eight interviews per facility is employed. However when there are fewer than eight providers in a facility, all providers are interviewed. It is recommended that data is weighted during analysis to account for over- and under-sampling. The sample includes approximately 1000 providers for each survey.
Registers/Records: Information on sampling of registers or records is not provided. Relevant records (e.g. antenatal care [ANC] coverage records, delivery records, child health medical records, individual patients’ records) are reviewed to ensure appropriate documentation during the interview with service providers.
Inference on validity and robustness of sampling procedures: Facilities are sampled by stratified sampling to account for different types of facilities and geographical locations, which is a statistically reasonable method as long as a reliable sampling frame is already available. Sampling of providers and clients is not meant to be representative, and these data are weighted during analysis to account for the differentials caused by over-sampling or under-sampling of providers with a particular qualification in a facility type and region. However, results of the provider/patient observations may be biases as providers/clients who are present early on the day of the survey may not always be representative of the providers/clients who normally provide or receive the services of interest in the facility unless the surveys randomly select the day and time of the survey.
Countries Implemented
Bangladesh, Carribbean, Egypt, Ghana, Guyana, Guatemala, Kenya, Rwanda, Tanzania, Zambia
Management Utility
Implications for Managers: Utility, decision-making, appropriateness, etc. This is an expensive and resource intense undertaking to be performed by national health systems but provides a comprehensive overview of health system performance for basic services. If linked effectively to household data it can provide valuable evidence on outcome measures following inputs in health systems at the district level for district health management teams.

________________________________________________________________________________________________________________________________________________________________________________________________________________________CCoommppaarriissoonn ooff HHFFAA MMeetthhooddss PPaaggee 3344 ooff 4477
Accessibility to Data, Reports and Software: Manuals, survey forms, data entry software etc are available through the public domain. Data are entered and analyzed using CS-PRO and available in SPSS format through the public domain after national dissemination. However managers and teams require training in the use of the survey forms, sampling procedures, data entry and analysis. This can also be adopted for other service areas.
Financing: USAID, Measure DHS, and MOH.
Advantages: SPA can provide detailed information on health services quality, allowing comparison by organizational types, facility types, and geography. The survey encompasses a wide range of health service assessment: inventory, provider interview, observation of service delivery, and client perception. The sampling strategy of SPA could be applied to other health service areas. One study conducted in Egypt attempted to link household survey (DHS) with SPA by using geographical information with the aim of examining FP service quality and utilization [36]. If SPA were conducted in the same sites as the DHS by using geo-coding, it would provide a more realistic perspective of health system performance and health outcomes.
The method attempts to build local capacity as local implementers are trained in survey management and in data processing. They are also provided a template for report preparation and workshops are held for local participation and contribute to developing the survey indicators. Data user workshops are planned for appropriate use and dissemination of information. Results have been used for strategic planning at the national level in Ghana and Kenya. The use of uniform definitions for elements being assessed increases the appeal of data for comparative analysis of programs, organization facilities and regions.
Disadvantages: Sampling of health care providers and clients is not representative. Another potential limitation is the multiple service assessment (child health, maternal health, FP, STI), which may require some level of clinical expertise to observe and assess provider-client interactions. Requires considerable training of surveyors to ensure data quality. Does not provide a gold standard validation or identify cause of poor performance except for inadequacies in inputs or structure.
B. Service Availability Mapping
Management
WHO and the MEASURE Evaluation project jointly designed this tool which is implemented by the MOH with various partner institutions.
Description of Method
Purpose: To collect information on availability of HF, health services (maternal and child health, HIV/AIDS, TB, malaria), and health care workers to map and monitor health service availability on a routine basis in all districts or as subset of districts. The tool is used to quantify, estimate, and map services at HF over time in a given district and country with the aim of enabling district and national planners to use service availability mapping as a tool for decision-making.
Measurement Domains: 1. Physical infrastructure (facilities, beds, basic medical equipment), location of facilities, availability of health services, human resources. 2. Availability of services and service providers, by district, and by facility. 3. Estimated coverage of specific interventions, by district.
Measurement Methods: Facility assessment, record/report review, key informant interviews.

________________________________________________________________________________________________________________________________________________________________________________________________________________________CCoommppaarriissoonn ooff HHFFAA MMeetthhooddss PPaaggee 3355 ooff 4477
Description of Methodology: Two sets of questionnaires are designed for district and facility assessment. Data is collected through key informant interviews at the district and facility level. At the district level, district medical officers are usually selected and interviewed for about an hour. The facility questionnaire requires meeting with multiple key informants depending upon the type and the size of facilities being visited. A key implementation step is the adaptation of the core questionnaires and identification of health priorities. The selection of health priorities are done through involving all relevant stakeholders. Teams are trained to use specific software and apply questionnaires. After data collection, a report is produced and disseminated and if there is interest to scale up SAM, phase II activities are planned which mirror phase I and also includes building the capacity at the district level. The main data collection tools are PDAs for both the district and facility questionnaires and GPS for collecting at facility locations.
Duration of Assessment: Approximately 5 to 7 weeks.
Assessment Cycle: Six month routine assessments are recommended for monitoring purposes.
Sampling Procedures
Type of Sampling Method: The method uses a census approach where all facilities in selected districts are sampled. Districts are selected based upon country needs, rather than donor-driven mandates. In most cases, districts with minimal available health information are selected. The facility questionnaire is carried out in all public and private HFs in the selected districts for rapid assessment of the availability of key programs and resources. The number of districts to be included in the census varies depending upon the resources and necessity determined by MOH. For example, 54 districts were mapped in the case of Uganda’s SAM. Districts: Purposefully selected (non-probability). No specific guidelines are provided for selection of districts. Facilities: All HF in a selected district are selected for assessment. Patients/Clients: Not applicable. Providers: Key informants at each facility are selected purposefully. Registers/Records: Not applicable.
Validity and robustness of sampling procedures: In this model all facilities are selected so there is no probability sampling and data are available on the entire population of facilities. However districts are not randomly selected.
Countries Implemented
Albania, Burkina Faso, Kenya, Ethiopia, Ghana, Rwanda, Tanzania, Uganda, Zambia
Management Utility
Implications for Managers: Implications involve utility, decision-making, appropriateness, etc. The instrument is to be used for district level monitoring of health service availability and does not provide information on the quality of services. The focus is on health facility inputs and structural capacity for managers to further investigate the supply chain management. Accessibility to Data, Reports and Software: Open access to manual, survey forms, data entry software, etc. Financing: MOH and donor support, limited technical assistance is available from WHO.
________________________________________________________________________________________________________________________________________________________________________________________________________________________CCoommppaarriissoonn ooff HHFFAA MMeetthhooddss PPaaggee 3366 ooff 4477
Advantages: For a census, SAM seems to be a relatively rapid and inexpensive method to establish a health service monitoring system at a district level. The outcome is a visually friendly map illustrating geographic distribution of health services, which would be helpful to identify resource deficiencies of health systems if population density information is also available at the sub-district, district or a country level. SAM provides increased capacity at the national and district levels to use PDAs, GPS and other hardware and software, and can be implemented into routine supervisory visits by district medical officers and their teams. Disadvantages: The tool does not provide measures for quality of services and resources and is not designed to provide comprehensive information on all aspects of health systems. The use of GPS and PDA may have considerable resource implications especially with rapid changes in technology and therefore require careful consideration for long term application in developing countries.
C. Facility Audit of Service Quality
Management The innovators of this survey tool are MEASURE Evaluation project staff. It is implemented through the MOH. Description of Method Purpose: Project and district level monitoring of staffing, operating hours, community linkages, quality control, service availability; reproductive and child health services at all HFs at the district level. Rapid measure of indicators for reproductive/child health, FP, STI, HIV/AIDS for facility-based care and support, providing an integrated service profile. The approach is ideal, and indeed designed, for district level monitoring and evaluation of health facility readiness to provide services. Measurement Domains: System preparedness including facility infrastructure; electricity, water, telephone, lighting, vehicles, privacy/capacity, emergency transportation, laboratory. Readiness to provide quality care in six areas: FP; STI management; antenatal care; maternal/delivery care and post abortion care’ child health/welfare; and HIV prevention, treatment, and care. Digital maps of facilities and services available. It measures approximately 105 standard indicators of service readiness and quality although modifications can be based on the heath facility context. Measurement Methods: Clinical Provider Observations, Client interview, Facility assessment
Description of Methodology: A single interviewer spends about an hour and half in each facility performing an audit interview and inventories. Implemented through district or local project staff, FASQ involves the measurement of a short list of generic indicators, which are adapted and, as relevant, expanded, depending on the users data needs. The survey instrument and guidelines are also locally adapted prior to the survey. Data collection tools include facility audit questionnaires in 9 sections: general information in infrastructure, staff, drugs, supply and equipment inventories, FP STI management, ANC, maternity/delivery, post-abortion care, child health/welfare, HIV prevention, treatment and care and GPS for location of facilities.
Duration of Assessment: Not applicable. Assessment Cycle: Every one to two years. Sampling Procedures Type of Sampling Method: This is a census approach and therefore all functional HF in the district are selected for assessment.
________________________________________________________________________________________________________________________________________________________________________________________________________________________CCoommppaarriissoonn ooff HHFFAA MMeetthhooddss PPaaggee 3377 ooff 4477
Description of Sampling Procedure: All operational facilities both government and private are included. Districts: Purposive selection of districts Facilities: All functional HFs. Patients/Clients: Not applicable. Providers: Not applicable. Registers/Records: Not applicable. Implications for Managers: Utility, decision-making, appropriateness, etc. This is a relatively simple tool with minimal staff requirements and can be implemented rapidly as it does not require sampling procedures. Data on cost and financing of surveys is not publicly available. Advantages: This is a relatively rapid and low cost measure that can be implemented by district teams with minimal or no technical assistance required as there are no sampling requirements. It is a census, so there is no need for complex sample plans. It provides information from digital mapping illustrating service availability, gaps in coverage, and inequities in access. The tool can be adapted for other services. Comparisons can be made for select indicators with the QIQ and SPA. As it is designed for district-level monitoring and evaluation, it is a practical tool for decentralized settings. Datasets can be created in any software; EpiInfo, stata, SAS, SPSS, etc. Disadvantages: Rapid assessments are not comprehensive to cover all aspects of service delivery as in SPA and, therefore, should be used as a supplementary measure. Performance measures for equipment, pharmaceuticals, infection control, and staffing are limited.
D. Quick Investigation of Quality
Management QIQ [37] was also generated by the MEASURE evaluation project and has been implemented by MOHs. Description of Method Purpose: QIQ monitors quality of care in clinic-based FP programs and other reproductive health services. Measurement Domains: All indicators measured in QIQ are related to FP and reproductive health. The instrument consists of 25 indicators to measure three elements: compliance with guidelines by providers and facility staff, clients’ perception, and availability of equipment and pharmaceuticals at facilities. Measurement Methods: Clinical Observations, Client interview, Facility audit Description of Methodology: The short list indicators for QIQ are measured by using three methods of data collection: facility audit through questions to the manager, observation of client-provider interactions and selected clinical procedures, and exit interviews with observed patients. The survey team comprised of providers with a clinical background (e.g. doctors, nurses, midwives, social scientists) performs assessments for one day in each selected facility. Assessment Cycle: Every two years
________________________________________________________________________________________________________________________________________________________________________________________________________________________CCoommppaarriissoonn ooff HHFFAA MMeetthhooddss PPaaggee 3388 ooff 4477
Sampling Procedures Type of Sampling Method: Although probability sampling is recommended, the method employs both probability (facilities) and non-probability (clients and providers) sampling. Sampling frame is a list of all facilities that provide FP services, stratified by type (e.g. hospitals, health centers, health posts, etc.) and geographical location (e.g. province). The first step is to choose a sample of provinces by using a systematic sampling with probability proportional to the number of facilities offering FP services located in each province. The number of provinces to be chosen is dictated by the resources available for the monitoring activity. The sample size of total observations, as well as client exit interviews needed, is calculated to detect changes of 10 or 15 percentage points with 90% power (or 80% power) and alpha=0.05. Description of Sampling Procedure: Districts: First, a geographically ordered list of provinces is created. A sample of provinces or comparable sub-divisions is selected using systematic sampling with probability proportional to the number of HF offering FP per province. The total number of provinces to be sampled is dictated by the resources available for the survey, but as a guideline, it should not exceed 20% to 25% of all provinces. Facilities: A stratified, two-stage cluster design is used. Facilities are stratified into groups according to type. Within each facility-type stratum, facilities are sampled by using systematic sampling with probability proportional to client volume. The total target sample size of facilities is determined in proportion to client volume in each stratum. Patients/Clients: Two options are mentioned for sampling patients/clients. The first is to obtain a fixed number per facility (for example, five or 10). An alternative is to obtain as many observations/interviews as possible during a fixed data collection period. Providers: Similar to number of patients/clients observed. Registers/Records: Not applicable. Inference on validity and robustness of sampling procedures: The strategy for sampling facilities is well designed and statistically valid, although a reliable sampling frame (i.e. a list of facilities, service volumes for each facility) might not always be available. It would be preferable if probability sampling were used to select patients/clients and providers. Countries Implemented Ecuador, Turkey, Uganda, Zimbabwe, Paraguay, Tanzania, Nicaragua, Bangladesh Management Utility Implications for Managers: Utility, decision-making, appropriateness, etc. QIQ is designed for FP and reproductive health services. The instrument has only 25 indicators; therefore it can be used as a rapid performance tool. The sampling strategy is developed based on indicators for FP; however, by modifying the sampling frame, a similar sampling strategy can be used to monitor other areas of health programs and services. Costs and Financing: Minimal information is provided on costs of survey and financing institutions. Advantages: QIQ is a simple, practical, and low-cost methodology suitable to monitor quality of care in FP and reproductive health services routinely. QIQ can be applied in several scenarios: for the MOH to monitor the quality of FP services at MOH facilities or to assess quality in a network of clinics, and comparing intervention to non-intervention areas.

________________________________________________________________________________________________________________________________________________________________________________________________________________________CCoommppaarriissoonn ooff HHFFAA MMeetthhooddss PPaaggee 3399 ooff 4477
Disadvantages: Since the scope of information collected through this survey is limited, and does not provide an overview of primary health services although it can be adapted for other services. Effective application to service areas will be challenging as it would increase the battery of indicators and may compromise the quality of the data. Conducting multiple sets of QIQ-like surveys for individual service areas may be an alternative.
E. Balanced Score Card
Management BSC was primarily designed for industry and later adapted for assessing and improving performance in health care.[38] Adapted from Robert Kaplan and David Norton’s Balanced Score Card approach with several domains, it is currently implemented in assessing the performance of the basic package of health services in Afghanistan. The implementing agency is the Ministry of Public Health, with Johns Hopkins University and the Indian Institute of Health Management Research as the third-party evaluators. These annual assessments have been ongoing since 2004. Description of Method Purpose: Comprehensive strategy to monitor performance of a basic package of primary health services delivered by NGOs and ministries. Designed to benchmark well performing provinces for appropriate management and improvement of service delivery. Measurement Domains: 1. Patient and community (satisfaction, perception of service quality) 2. Staff (satisfaction, salary) 3. Structural inputs (e.g. availability of equipment, drugs, laboratory, guidelines, infrastructure, medical records, and TB registration) 4. Service provision (e.g. proper history taking, time spent with patient, availability of ANC) 5. Financial systems 6. Overall vision (e.g. female % of new outpatients) Measurement Methods: Clinical provider observations, client interview, provider interview, facility assessment, record/report review. Description of Methodology: The survey team is expected to perform all assessments within a day. Seven instruments are used to collect information: observation of patient consultation (under 5 years old), observation of patient consultation (5 years or older), exit interview (under 5 years old), exit interview (5 years or older), health worker interview, community health worker interview, health facility assessment. Observation of patient consultation and health worker observation is conducted by a survey team. Duration of Assessment: Five months. Assessment Cycle: Annual. Sampling Procedures Type of Sampling: Stratified-random sampling (probability sampling) of facilities from all provinces, patients, and providers. Stratified sampling methodology according to facility type; basic health centers, comprehensive health center, and outpatient and maternity wings at district hospitals. The sample includes approximately 600 HF, 5,000 observations of patient care, and 1,500 interviews with health workers. Surveyors are selected from each province and range from school teachers, college graduates and para-health professionals.
________________________________________________________________________________________________________________________________________________________________________________________________________________________CCoommppaarriissoonn ooff HHFFAA MMeetthhooddss PPaaggee 4400 ooff 4477
Facilities: Employs a stratified random sample of all facilities providing the basic package of health services in all provinces, up to a maximum of 25 facilities in each province. In the provinces where there are less than 25 functional facilities at the time of the survey all the facilities that are accessible as determined by the Provincial Public Health Director office, are included. However, in provinces, where there are more than 25 functional facilities at the time of sampling, facilities are randomly selected to include three district hospitals, seven comprehensive health centers, and 15 basic health centers.
Patients/Clients: Observation of patient care is based on a systematic sample of interactions of adults and children with the main provider, with a target of five adults and five children selected systematically using a random starting point and a sampling interval determined by the average number of new patients seen in a day.
Providers: Randomly sampled in each stratum of three types of providers (doctors, nurses, community health workers).
Registers/Records: N/A
Inference on validity and robustness of sampling procedures: In contrast to other methodologies, BSC employs the representative sampling strategy for both facility level and client/provider level; hence the results are more generalizable to the entire province.
Management Utility
Implications for Managers: Utility, decision-making, appropriateness, etc. The evaluation is performed by a third party entity and financed entirely by a donor agency. Capacity building efforts for future implementation of MOH have been initiated but are not adequate for sustaining efforts in similar magnitude and rigor.
Accessibility to Data, Reports and Software: Data, manuals, and data entry software are not publicly available.
Cost of Survey: The cost of the monitoring and evaluation for BSC was only 2.5% of the cost of delivering the basic package of health services. Approximately $800,000 in field costs for implementation. The financing is provided by the World Bank.
Advantages: Considering that BSC has been conducted fairly successfully for several years in a fragile health system, application of the BSC would be possible in many countries to determine deficient performance and benchmark successful strategies employed by various contracting mechanisms. The comprehensive approach of including a range of primary health services allows a more robust measure of health system performance at the national and sub-national level. Multiple service indicators are available for examining service provision indicators on quality of care and system preparedness of practical use to managers and providers and aggregate indices allow management decision making at the policy level. Some measures of CHW knowledge and performance are also included.
Disadvantages: Conducting the BSC at a national level is an enormous undertaking requiring high-level commitment and technical expertise, as well as substantial funding. Ministries of health in many countries would not be capable of conducting BSC independently without appropriate partnerships with funding agencies and academic institutes.
F. IMCI-MCE Health Facility Survey
Management
The IMCI-MCE surveys [39] were developed by WHO. They encourage involvement of staff at all levels of the health systems, such as the national level (e.g. MOH staff), regional level (e.g., district medical officer), and partners supporting child health programs (e.g., local and international NGOs).
________________________________________________________________________________________________________________________________________________________________________________________________________________________CCoommppaarriissoonn ooff HHFFAA MMeetthhooddss PPaaggee 4411 ooff 4477
Description of Method
Purpose: To evaluate the quality of care delivered to sick children at outpatient facilities in the framework of the IMCI.
Measurement Domains: Health workers’ compliance with clinical guidelines, perception and satisfaction of care takers’, availability of equipment and supplies. Measurement Methods: Clinical provider observations, client interview, facility assessment, record/report review.
Description of Methodology: A team of two surveyors and one supervisor spend one day at each facility to conduct the survey. The minimum number of facilities visited in each sampling area is assumed to be between 25 and 35. Survey staff are selected by the survey coordinator in partnership with national and district supervisors. Surveyors are usually physicians, nurses and health assistants.
Duration of Assessment: Four weeks for planning and preparation, three weeks for training and conducting of survey, and one week for data entry and analysis. Total duration: two months.
Assessment Cycle: A cycle is not specified; rather, the survey should be conducted when there is a need for information (e.g., baseline evaluation, follow-up evaluation).
Sampling Procedures
Type of Sampling Method: A census of all facilities is recommended in the targeted region although for practical purposes this is not followed. Survey: Few regions that are representative of the whole country or a random sample of regions/districts are selected. In a small country, sampling from facilities throughout the country may be considered. Description of Sampling Procedure: Facilities: A single sample of facilities can be chosen when the program is interested in the overall results. A stratified sampling strategy by different locations and/or different groups of facilities can be chosen when a program wants to compare results between different areas or groups in the survey area. A complete list of all eligible HF providing sick child outpatient services in the sampling area is used as a sampling frame. Systematic random sampling by facility type/geographic area is used. The minimum number of facilities that can be visited in each sampling area is between 25 and 35. Precision and design effect is based on expected number of cases at each facility. Patients/Clients: All sick children meeting the criteria (e.g. age, specified symptoms, first visit for the current problem) presenting at the facility during the morning clinic session are included in the survey in order of arrival. Observations of child consultation are conducted for all selected children followed by exit interviews and re-examination of all selected children. Providers: Similar to patient sampling Registers/Records: Information for the past 1 month (the total number of visits with breakdown demographic information of children) is to be collected.
Inference on validity and robustness of sampling procedures: Appropriate sampling of health facilities to obtain a representative sample is performed for each survey area. All sick children presenting in the morning at each facility are selected. This may also introduce bias as children presenting in the morning may be at higher risk and those being seem by the providers in the afternoon may receive better quality of care due to a lower client load as reported in some studies.
________________________________________________________________________________________________________________________________________________________________________________________________________________________CCoommppaarriissoonn ooff HHFFAA MMeetthhooddss PPaaggee 4422 ooff 4477
Countries Implemented
Tanzania, Bangladesh, Peru, Uganda, Brazil
Management Utility
Implications for Managers: Utility, decision-making, appropriateness, etc. The method can be routinely employed at the district level to examine the quality of child health services and can be adapted for other services accordingly. The manual is user friendly and publicly accessible, however, the re-assessments may result in additional costs.
Accessibility to Data, Reports and Software: Open access to manuals, survey forms, and data entry procedures.
Financing for the survey is provided by both the MOH and donors and no cost information was available for survey implementation.
Advantages: This methodology is focused on pediatric care in view of IMCI; therefore, in this particular health service area, detailed information can be obtained. Also, the manual for the survey is very user-friendly for health providers from various settings to comprehend. A “gold standard” reassessment is conducted to compare the validity and quality of assessments by surveyors.
Disadvantages: Surveyors need to be clinically competent enough to assess guidelines and clinical care recommended by the IMCI protocol although a gold standard reassessment is performed, which has cost and time implications in low resource settings. The availability of a physician or trained IMCI provider to conduct the gold standard assessments with the exception in research settings may be a challenge.
G. Health Facility Census
Management
HFC [41] was designed by Japanese International Cooperation Agency (JICA) and implemented by MOHs through the establishment of steering and technical committees. The partner institution is a national statistical office.
Description of Method
Purpose: Collect information on availability of HF infrastructure, health services, and human resources to identify HF that do not meet established criteria. This is used for planning and managing health systems development and resource acquisition and investment. As stated by Hozumi et. al.,[21] HFC is useful at the preparation phase of a national strategic planning cycle, particularly when basket funding is being introduced and cost estimation for capital investment is required.
Measurement Domains: Availability and condition of physical infrastructure/health service/equipment, location of health service delivery points, staffing patterns on the day of assessment.
Measurement Methods: Facility assessment, mapping of facilities.
Description of Methodology: Data collection tools are comprised of health service module, GPS, building assessment module, utility module, medical equipment module, and human resource data form. Key to HFC is the formation of stakeholder implementation groups, including a steering committee and a technical committee. The steering committee sets strategic directions and periodically reviews progress and the technical committee implements the HFC in the field and develops data collection tools where data are collected by sub-national

________________________________________________________________________________________________________________________________________________________________________________________________________________________CCoommppaarriissoonn ooff HHFFAA MMeetthhooddss PPaaggee 4433 ooff 4477
health offices. The main data collection tools are health service modules, GPS/location, building assessment modules, utility module, medical equipment module and human resource data form.
Duration of Assessment: For a typical primary level facility, data collection is conducted in one day by two data collectors. For higher-level facilities, data collection may be extended to six days.
Assessment Cycle: Not applicable.
Sampling Procedures
This method uses a census approach and all public and semi-public health service facilities are selected.
Inference on validity and robustness of sampling procedures: All eligible facilities are visited. Probability sampling is not required and estimates for the entire population of facilities are available.
Implementation Countries
Malawi and Zambia.
Management Utility
Implications for Managers: Utility, decision-making, appropriateness, etc. HFC can be used to estimate required costs for capital investment in the process of a national strategy in revamping health service infrastructure.
Accessibility to Data, Reports and Software: Not publicly available.
Financing and Costs: Financing is provided by both MOH and JICA. Survey costs are not publicly available.
Advantages: HFC covers all HF in a targeted area; therefore, it is possible to collect detailed information on physical assets of HF without requiring a complex sampling strategy. HFC-collects information on physical assets on all public and semi-public HF, could serve as a baseline assessment for monitoring and evaluation of investment into the health sector, provides an atlas of HF, a HF database, a medical equipment database, and a capital investment cost-estimate program.
Disadvantages: HFC measures the coverage and availability of HF; however, the method is not designed to measure quality of health care, client satisfaction, and detailed information of human resources.
H. Rapid HFA
Management
Rapid HFA [41] is a combined effort of Measure Evaluation/DHS, Child Survival Technical Support, Child Survival Program, and USAID, and implemented by such agencies like the World Bank and U.S.-based NGOs.
Description of Method
Purpose: To evaluate the quality of first level HF (non-referral facilities) and allied community service providers for maternal, neonatal, and child health services. Measurement Domains: 1. Assessment, diagnosis, and treatment of children with the most common illnesses (diarrhea, fever/malaria, and acute respiratory tract infections). 2. Availability of health services, essential infrastructure, staff, equipment, and supplies in HF.
________________________________________________________________________________________________________________________________________________________________________________________________________________________CCoommppaarriissoonn ooff HHFFAA MMeetthhooddss PPaaggee 4444 ooff 4477
3. Quality of management processes in facilities (e.g., training, supervision, record keeping) in first level HF. Measurement Methods: Clinical provider observations, client interview, provider interview, facility assessment, record/report review.
Description of Methodology: Observation of clinical care for sick child, exit interview of caretaker of sick child, HF checklist and supervisor interview, health worker interview, and community health worker assessment modules used in this survey. Each survey team consists of two or three providers with at least one clinician; doctor or nurse. Each facility is surveyed in one day.
Duration of Assessment: A total of six to 10 weeks is suggested (two to four weeks for preparation, such as partnership, hire team, choose units, etc., three or four days for training, four to six days for data collection and data entry, and two to four weeks for report writing and dissemination).
Assessment Cycle: Survey is conducted at the baseline and repeated in three to five years after a project is completed. The tool (or sections) also may be used for routine monitoring at more frequent intervals.
Sampling Procedures
Census: A census of facilities in a district may be conducted if there are a few facilities or the tool is employed for routine monitoring. HF providing health services of interest are selected for the census.
Survey: Sampling of facilities is used if the number of facilities is in the area being assessed (usually a district) is large. All HF providing health services of interest are included in the sampling frame.
Description of Sampling Procedure: Districts: Districts of interest are selected purposefully. Facilities: HF are sampled per district using Lot Quality Sampling (LQAS) procedures. Sample size is calculated to determine whether or not a minimal proportion of HFs in the district is performing to an acceptable standard. The adequate performance standard (e.g., 80% of HFs in a district has adequate performance) and the lower threshold (e.g. 50% of HFs has adequate performance, suggesting failed service delivery) are determined in order to calculate the sample size for a district by using the software designed for R-HFA. HF are selected through simple random sampling. (Refer to Appendix B for additional information) Patients/Clients: Six consecutive sick children with fever, acquired respiratory illness (ARI), or diarrheal diseases (one child per care taker if siblings are observed during the same visit) are selected for observation of care provision and exit interviews are conducted on caretakers of the selected children. If more than one child does not receive the optimal care the HF is considered to be non compliant to the quality requirements. Providers: At each facility assessed, the lead or primary person that manages sick children is interviewed. In addition, a CHW module is conducted on a simple random sample of 40-50 of CHWs. A list of all CHWs is obtained from the District Health Officer, or from project staff. All providers are listed and a sampling fraction required to generate 40-50 CHWs is determined and random sampling is carried out. Registers/Records: A record/register review is carried out to identify if treatments are consistent with diagnoses. In addition, drug supply management records are reviewed to assess quality and availability of drugs.
Inference on validity and robustness of sampling procedures: LQAS methods are employed to facilitate management decision-making and are not designed to provide estimates of most indicators of a given precision as other methods do.
________________________________________________________________________________________________________________________________________________________________________________________________________________________CCoommppaarriissoonn ooff HHFFAA MMeetthhooddss PPaaggee 4455 ooff 4477
Countries Implemented
Zambia, Bangladesh, Liberia, Madagascar, Philippines, Rwanda, India, Tanzania.
Management Utility
Implications for Managers: Utility, decision-making, appropriateness, etc. This tool is practical for services focusing on maternal-neonatal-child health. Sampling strategies are representative.
Accessibility to Data, Reports and Software: Reports presently are available from NGOs using R-HFA or through USAID’s Development Experience Clearinghouse. Financing and Cost of Survey: Information is not publicly available. Advantages: If the tool is used at pre and post intervention or baseline and final evaluation it provides an indication of improvement due to strategies employed by the NGO at the HF or district level. The sampling strategy is robust and representative and the method is relatively rapid as it employs few key performance indicators for routine monitoring. The requirements for assessment are minimal as only one surveyor is required in the survey team and gold standard reassessments are not performed. All indicators can be tabulated manually. The LQAS rapid methodology has been applied at the national level for Child Survival and Malaria control programs. The method is particularly appealing to district level managers as it use small sample sizes and allows prompt decision making contrary to large surveys requiring estimates with confidence intervals. The sample size formula includes the number of facilities in the district being assessed. Districts with a low number of facilities will require a smaller number of facilities to be assessed than a district with a large number of facilities. A sample size calculator is publicly available for users of this method. It also includes a module to map CHW resources and measure performance. The LQAS method provides a more rapid sampling procedure for NGO’s that are operating in a single district or province and do not require national level estimates and therefore less resource intensive.
Disadvantages: Compared to the IMCI-MCE the sampling manual is not very user friendly for application by mid-level managers unless supported by training on LQAS methods. Rapid HFA only includes child and maternal health but can be modified for use for other services. Except for the CHW Module and sampling methods both the IMCI-MCE and Rapid HFA tools measure similar indicator of performance.
________________________________________________________________________________________________________________________________________________________________________________________________________________________CCoommppaarriissoonn ooff HHFFAA MMeetthhooddss PPaaggee 4466 ooff 4477
References
1. World Health Organization (WHO). The World Health Report 2000 – Health Systems: Improving Performance. Geneva: WHO; 2000.
2. Walker N, Bryce J, Black RE. Interpreting health statistics for policymaking: the story behind the headlines. [Review.] Lancet. 2007;369(9565):956-963.
3. Boerma T, Stansfield S. Health statistics now: are we making the right investments? Lancet. 2000;369:779-786.
4. Murray CLJ. Towards good practice for health statistics: lessons from the Millennium Development Goal health indicators. Lancet. 2000;369:862-873.
5. AbouZahr C. From data to policy: good practices and cautionary tales. Lancet. 2000;369:1039-1046. 6. Lindelow M, Wagstaff A. Health facility surveys: an introduction. [World Bank Policy Research Working
Paper No. 2953.] Washington: World Bank; 2003.Available at http://ssrn.com/abstract=636315. 7. Kruk ME, Freedman LP. Assessing health system performance in developing countries: a review of the
literature. Health Pol. 2008;85(3):263-276. 8. Murray JL, Evans DB, eds. Health Systems Performance Assessment. Debates, Methods and
Empiricism. Geneva: World Health Organization; 2003. 9. Murray CJ, Frenk J. A framework for assessing the performance of health systems. Bull World Health
Org. 2000;78(6):717-731. 10. World Health Organization. MEASURE Service Provision Assessment (SPA). [Web page.] Accessed
May 5, 2009 at http://www.emro.who.int/gfatm/guide/tools/spa/spa.html. 11. Angeles G, Stewart JF, Gaete R, Mancini D, Trujillo A, Fowler CI. Health Care Decentralization in
Paraguay: Evaluation of Impact on Cost, Efficiency, Basic Quality, and Equity — Baseline Report. [TR-00-04.]. Chapel Hill, NC: MEASURE Evaluation; 2000. Available at http://www.cpc.unc.edu/measure/publications/pdf/tr-00-04.pdf.
12. de Silva A. A framework for measuring responsiveness. [GPE Discussion Paper Series No. 32]. Geneva: World Health Organization; 1999.
13. Lovice R, Rubardt M, Fagan D, Powers MB. Partnership Defined Quality: A Tool Book for Community and Health Provider Collaboration for Quality Improvement. Westport, CT: Save the Children/US; 2003. Available at http://www.savethechildren.org/publications/technical-resources/saving-newborn-lives/country-documents/Partnership-defined-quality-a-tool.pdf.
14. Addai E. The Community Scorecard Approach for Performance Assessment. London: WaterAid; 2004. Available at http://www.wateraid.org/documents/no_4csc_final__briefing_paper.pdf.
15. Eddy DM. Performance measurement: problems and solutions. Health Affairs. 1998;17(4):7-25. 16. Forsberg BC, Barros FC, Victora CG. Developing countries need more quality assurance: how health
facility surveys can contribute. Health Pol Plan.1992;7:193-196. 17. Donabedian A. Explorations in Quality Assessment and Monitoring, Volume 1: The Definition of Quality
and Approaches to its Assessment. Washington: Health Administration Press; 1980. 18. Waters H, Abdallah H, Santillán D. Application of activity-based costing (ABC) for a Peruvian NGO
healthcare provider. Int J Health Plann Man. 2001;16:3-18. 19. Hussain H, Waters H, Omer SB, Khan A, Baig IY, Mistry R, Halsey N. The cost of treatment for child
pneumonias and meningitis in the northern areas of Pakistan. Int J Health Plann Man. 2006;21:229-238. 20. Hulton AL, Matthews Z, Stones WR. Applying a framework for assessing the quality of maternal health
services in urban India. Soc Sci Med. 2007;64(10):2083-2095. 21. Hozumi D, Fronczak N, Noriega Minichiello S, Buckner B, Fapohunda B. Profiles of Health Facility
Assessment Methods. [TR-06-36]. Chapel Hill, NC: MEASURE Evaluation; 2006. 22. Health Facility Technical Working Group. The signature domain and geographic coordinates: a
standardized approach for uniquely identifying a health facility. [Working paper, WP-07-91.] Chapel Hill, NC: MEASURE Evaluation; 2007.
23. Turner AG, Angeles G, Tsui AO, Wilkinson M, Magnani R. Sampling Manual for Facility Surveys for Population, Maternal Health, Child Health and STD Programs in Developing Countries. [MS-01-03.] Chapel Hill, NC: MEASURE Evaluation; 2001.
24. Peters DH, Noor AA, Singh LP, Kakar FK, Hansen P, Burnham G. A balanced scorecard for health services in Afghanistan. Bull World Health Org. 2007;85:146-151.
________________________________________________________________________________________________________________________________________________________________________________________________________________________CCoommppaarriissoonn ooff HHFFAA MMeetthhooddss PPaaggee 4477 ooff 4477
25. Skarbinski J, Winston CA, Massaga JJ, Kachur SP, Rowe AK. Assessing the validity of health facility-based data on insecticide-treated bednet possession and use: comparison of data collected via health facility and household surveys — Lindi region and Rufiji district, Tanzania, 2005. Trop Med Int Health 2008;13(3):396-405.
26. Adam T, Amorim DG, Edwards SJ, Amaral J, Evans DB. Capacity constraints to the adoption of new interventions: consultation time and the integrated management of childhood illness in Brazil. Health Pol Plan. 2005;20(Suppl 1):i49-i57.
27. Williams SC, Koss RG, Morton DJ, Schmaltz SP, Loeb JM. Case volume and hospital compliance with evidence-based processes of care. Int J Qual Health Care. 2008;20:79-87.
28. Sharma RC; Dutt SC. Time spent on primary health records and reports in India [letter]. World Health Forum. 1993;14(2):177-178.
29. World Health Organization (WHO). Working Together for Health: The World Health Report 2006. Geneva: WHO; 2006. Available at http://www.who.int/whr/2006/whr06_en.pdf.
30. Valadez JJ. Assessing Child Survival Programs in Developing Countries: Testing Lot Quality Assurance Sampling. Boston, MA: Harvard University Press; 1991.
31. Valadez JJ, Weld L, William VV. Monitoring community health workers’ performance through Lot Quality Assurance Sampling. Am J Pub Health. 1995;85:1165-1166.
32. Training manual for conducting Service Provision Assessment (SPA) [draft 02/01/02] and List of indicators [table]. Calverton, MD: MEASURE DHS+; 2002. Available at http://www.cpc.unc.edu/measure/publications/pdf/ms-02-09-tool06-training_manual.pdf and http://www.cpc.unc.edu/measure/publications/pdf/ms-02-09-tool06-indicators.pdf.
33. National Bureau of Statistics [Tanzania], ORC Macro. Tanzania Service Provision Assessment Survey 2006, Preliminary Report. Calverton, MD: ORC Macro; 2007. Available at www.nbs.go.tz/TSPA/TSPA_2006_PREL_REPORT.pdf.
34. Ministry of Health and Population [Egypt], El-Zanaty Associates [Egypt], ORC Marco. Egypt Service Provision Assessment Survey 2004. Calverton, MD: ORC Macro; 2005. Available at www.measuredhs.com/pubs/pdf/SPA7/SPA7.pdf.
35. National Coordinating Agency for Population and Development [Kenya], Ministry of Health [Kenya], Central Bureau of Statistics [Kenya], ORC Macro. Kenya Service Provision Assessment Survey 2004. Calverton, MD: ORC Macro; 2005. Available at http://www.measuredhs.com/pubs/pub_details.cfm?ID=561.
36. Hong R, Montana L, Mishra V. Family planning services quality as a determinant of use of IUD in Egypt. 2006. BMC Health Ser Res. 2006;6:79.
37. MEASURE Evaluation. Quick Investigation of Quality (QIQ). A User's Guide for Monitoring Quality of Care in Family Planning. [MS-01-02]. Chapel Hill, NC: MEASURE Evaluation; 2001. Available at https://www.cpc.unc.edu/measure/publications/pdf/ms-01-02.pdf
38. Kaplan RS, Norton DS. The Balanced Scorecard. Boston: Harvard Business School Press; 1996. 39. World Health Organization (WHO). Health Facility Survey — Tools to Evaluate the Quality of Care
Delivered to Sick Children Attending Outpatient Facilities. Geneva: WHO; 2003. Available at http://whqlibdoc.who.int/publications/2003/9241545860.pdf.
40. Health facility assessment tools workshop, final report. Monitoring and Evaluation Working Group, Jan. 14-15, 1999, Calverton, MD, sponsored by Child Survival Technical Support, USAID, and CORE.
41. Manual of Rapid Health Facility Assessment: a tool to enhance quality and access at the primary health care level [unpublished]. USAID/CORE/MACRO/MEASURE.