m..dd.. a-- mggeen neerrall imeeddiicciinnee--...
TRANSCRIPT

DDIISSSSEERRTTAATTIIOONN OONN
TTHHEE SSTTUUDDYY OOFF LLIIPPIIDD PPRROOFFIILLEE CCHHAANNGGEESS IINN CCIIRRRRHHOOSSIISS OOFF LLIIVVEERR
Submitted To
TTHHEE TTAAMMIILLNNAADDUU DDRR.. MM..GG..RR.. MMEEDDIICCAALL UUNNIIVVEERRSSIITTYY
In Partial Fulfilment of the Regulations for the Award of
The Degree of
MM..DD.. -- GGEENNEERRAALL MMEEDDIICCIINNEE-- BBRRAANNCCHH –– II
TTHHAANNJJAAVVUURR MMEEDDIICCAALL CCOOLLLLEEGGEE,,
TTHHAANNJJAAVVUURR -- 661133 000044..
TTHHEE TTAAMMIILLNNAADDUU DDRR.. MM..GG..RR.. MMEEDDIICCAALL UUNNIIVVEERRSSIITTYY
CCHHEENNNNAAII -- 660000 003322..
AAPPRRIILL –– 22001155
CERTIFICATE
This is to certify that this dissertation entitled “ THE STUDY OF LIPID
PROFILE CHANGES IN CIRRHOSIS OF LIVER ” is the bonafide
original work of Dr. KUMARESAN .S in partial fulfilment of the requirements
for M.D Branch -I (General Medicine) Examination of the Tamilnadu
Dr. M.G.R. Medical University to be held in APRIL - 2015. The period of study
was from JANAURY – 2014 - AUGUST 2014.
Prof.Dr. P.G. SANKARANARANAN,M.D.,
Head of the Department,
Department of Internal Medicine,
Thanjavur Medical College,
Thanjavur - 613 004.
P
PROF. Dr. P.G. SANKARANARAYANAN, M.D.,
DEAN I/C,
THANJAVUR MEDICAL COLLEGE, THANJAVUR – 613 004
Prof. Dr. K. NAGARAJAN, M.D.,
Unit Chief M-2
Department of Internal Medicine,
Thanjavur Medical College,
Thanjavur - 613 004.
Thanjavur - 613004.

DECLARATION
I, Dr. KUMARESAN .S , solemnly declare that the dissertation
titled DISSERTATION ON “THE STUDY OF LIPID PROFILE
CHANGES IN CIRRHOSIS OF LIVER” is a bonafideworkdone by me at
Thanjavur Medical College, Thanjavur during Januuary 2014 – september
2014 under the guidance and supervision of Prof. Dr. K. NAGARAJAN,
M.D., Unit Chief M-2, Thanjavur Medical College, Thanjavur.
This dissertation is submitted to TamilnaduDr. M.G.R Medical
University towards partial fulfilment of requirement for the award of M.D.
degree (Branch -I) in General Medicine.
Place: THANJAVUR. (Dr. KUMARESAN .S)
Date: Postgraduate Student,
M.D. in General Medicine,
Thanjavur Medical College.

ACKNOWLEDGEMENT
I gratefully acknowledge and my sincere thanks to the Dean,
PROF. Dr. MAHADEVAN, MS Thanjavur Medical College, Thanjavur, for
allowing me to do this dissertation and utilize the institutional facilities.
I am extremely grateful to PROF. Dr. P. G. SANKARANARAYANAN
.,Head of the Department, Department of Internal Medicine, Thanjavur
Medical College, for his full-fledged support throughout my study and valuable
suggestions and guidance during my study and my post graduate period.
I am greatly indebted to PROF. Dr. K. NAGARAJAN MD my Professor
and Unit Chief, who is my guide in this study, for his timely suggestions,
constant encouragement and scholarly guidance in my study and post graduate
period.
I profoundly thank my professors PROF. Dr. S. MANOHARAN, M.D;
PROF. Dr. C. GANESAN, M.D, PROF. Dr. D. NEHRU, DMRD, M.. Dr.
GUNASEKARAN, M.D D.M., (Registrar), for their advice, guidance and
valuable criticism which enabled me to do this work effectively.
I would like to express my gratitude to PROF. Dr. R. GANESAN MD DM
Department of Gastroentrology for his immense help in the study which enabled

me to complete this work and also permitting me to utilize the facilities
available in the department.
My sincere thanks to assistant professors Dr. J .VIJAYABABU
SATHISHKUMAR MD,DM., Dr. S. VETRIVEL, M.D.,DCH, DDVL for their
motivation, encouragement and support.
I am also thankful to Dr. RATHA, MD, DM for spending their valuable
time in giving UGI scopy reports for my study.
I am also thankful to all lap technician and paramedical staff help do my
study.
A special mention of thanks to all the patients who participated in this
study for their kind cooperation without whom the study would not be possible.
I would like to thank my colleagues and friends who have been a constant
source of encouragement.
I express my heartful love, thanks and sense of gratitude to God and
beloved parents, my wife Dr. K. Ilavarasi MBBS., DO and my dear son with
my dearest family members for their kind cooperation and help extended during
my research tenure.
I praise almighty who has bestowed me the grace, courage and strength to
achieve this target. Last but not least I want to thank all those who have helped
me directly or indirectly to make this work a success but missed a mention.

CONTENTS
SL.NO. TITLE PAGE NO.
1 INTRODUCTION 1
2 AIMS OF THE STUDY 4
3 REVIEW OF LITERATURE 5 - 71
4 MATERIALS AND METHODS 72 - 75
5 RESULTS AND ANALYSIS 75 - 104
6 DISCUSSION 105 - 108
7 CONCLUSION 109
8 ANNEXURE –I BIBLIOGRAPHY I - VII
9 ANNEXURE –II PROFORMA VIII - XIV
10 ANNEXURE –III MASTER CHART XIV-XVIII
11 ANNEXURE –IV ABBREVIATIONS XIX- XX
12 ANNEXURE –V CONSENT FORM XXI
13
ANNEXURE –VI INSTITUTIONAL
ETHICAL COMMITTEE APPROVAL CERTIFICATE
XXII
14 LIST OF FIGUTURES XXIII - XXIV
15
LIST OF TABLES
XXV - XXVI
ABSTRACT
Background:
Cirrhosis is often associated with impaired lipid metabolism. However
,there are only a few studies regarding lipid profile in cirrhosis that have been
undertaken in India. The aim of the study is to assess the degree of alteration of
serum lipid profile in cirrhotic patients and also to detect its relationship with the
complication of cirrhosis and assess the severity.
Materials asnd Methods:
This prospective study was conducted in 50 cirrhosis patients admitted in
Thanjavur medical hospital .A questionnaire of personal characteristics including
history of alcoholism , detailed present and past history was elicited for each
patient. Serum lipid profile (total, low-density lipoprotein (LDL), high-density
lipoprotein (HDL) cholesterol and triglyceride) was recorded.
Lipid levels in our study was correlated with the complications of cirrhosis
.Statistical analysis was done using T –test.
Results:
Majority of the cases were in the 41-50 years age group. In patients with cirrhosis,
the total serum cholesterol level was decreased. There was a significant decrease in
serum HDL and LDL cholesterol and triglyceride levels . This low lipid level was

scompared with various complications of cirrhosis and the data was statistically
analysed and it shows no correlation between complications and low lipid levels.
Conclusion:
In this study, we found that there was marked reduction of serum lipid profile
values in patients with cirrhosis. Therefore, a search for lipid profile abnormality
should be performed in every cirrhotic patient. There was no significant correlation
between the serum lipid values and the incidence of complications of cirrhosis.
Key words: Cirrhosis, serum lipid profile complication.
1
1. INTRODUCTION
Cirrhosis of liver is a very common disease which clinicians encounter both
at primary and tertiary care. Cirrhosis is a degenerative condition of the liver in
which normal hepatic tissue is replaced by anatomically abnormal structures,
which eventually impair liver function.
Liver cirrhosis represents the advanced stage of hepatic injury caused by
chronic liver diseases such as hepatitis and alcoholic liver disease and various
other causes and may gradually progress towards end-stage liver failure even liver
cancer.
In the early 1920s, the cirrhotic mortality rates declined steeply in the United
States due to the introduction of the national Prohibition act (Ban on the sale,
production and transportation of alcohol). However, once the Prohibition was
ended, the mortality rates increased again until the mid-70s, when people realized
the consequences associated with alcohol abuse and started participating in AA
(Alcoholics Anonymous) meetings.
Reduced exposure to hepatitis infections also attributed to the declining
cirrhotic mortality rate from the 70’s. Similar time trends were observed for
European countries, with the exception of the United Kingdom and some Nordic
2
countries. Especially the high cirrhotic mortality rate across Scotland, where the
overall alcohol consumption doubled over the past four decades, remains
extremely alarming. With no effective treatment, at least not for advanced and
irreversible stages, liver cirrhosis becomes a global health issue, accounting
annually for an estimated 800000 deaths worldwide.
Exact incidence rates are difficult to estimate as cirrhosis often remains
unnoticed until end-stage liver failure has occurred. However, in Belgium, about
84000 patients were diagnosed with cirrhosis in 2008 and 2009, of whom 4769
patients died in a Belgian hospital. Although several treatments (Antibiotics,
healthy diet, abstaining from alcohol etc.) attempt to restrict further disease
progression and reduce complications, liver transplantation is the only appropriate
option when the liver ceases to function or complications are no longer
suppressible.
But even after liver transplantation, long-term survival of the patient is not
guaranteed as alcohol relapse or liver rejection may occur. To offset the risk of
relapse, patients suffering from alcoholic cirrhosis are commonly only eligible for
a liver transplant after establishing a 6 month period of abstinence from alcohol.

3
Lipids are one of the necessary components which control cellular functions
and homeostasis. Liver plays an essential role in lipid metabolism, several stages
of lipid synthesis and transportation.
The liver plays a key role in the metabolism of plasma lipids and
lipoproteins. As majority of endogenous cholesterol is synthesized in the hepatic
microsomes. Synthesis and metabolism of cholesterol is impaired in chronic liver
disease resulting in a decrease in plasma levels. Severe metabolic impairment in
cirrhosis can produce a worsening of the serum lipoprotein pattern. High‑ density
lipoprotein (HDL) cholesterol and its major Apo lipoproteins have been shown to
be reduced in cirrhosis, as also the serum levels of low‑density lipoprotein (LDL)
cholesterol.
Hence this study aims at studying the lipid profile changes in Cirrhosis,
thereby reassessing the need for lipid profile in all the patients as a prognostic
tool.

4
AIMS AND OBJECTIVES
The study of lipid profile [Total cholesterol (TC), triglycerides (TG)
high density lipoprotein (HDL), low density lipoprotein (LDL) and very
low density lipoprotein (VLDL)] changes in cirrhosis of liver.
Correlation of lipid changes with various complication of Cirrhosis.
To assess the severity of Cirrhosis related to lipid profile changes.

5
2. REVIEW OF LITERATURE
2.1. HEPATIC ANATOMY
The liver- Hepar in Greek, is the largest parenchymal organ, weighting
approximately 1.2 - 1.5 kg even at rest, the liver receives up to 25% of the total
cardiac output (1), indicating its major role in the metabolism and its necessity for
survival. Various metabolic and detoxifying functions are carried out by the liver.
As the main site of glycogenolysis and gluconeogenesis, the liver is involved in
regulating the blood sugar level. Other metabolic functions include the breakdown
of proteins and lipids, and the synthesis of cholesterol and triglycerides.
The most prominent detoxifying function of the liver is the
biotransformation of lipophilic substances (Medication, nutrition additives, steroid
hormones etc.) in order to make them more water-soluble and thus to increase the
possibility of excretion. The liver also produces daily about 500 ml of bile, which
either drains directly into the duodenum or is temporarily stored in the gallbladder.
The liver relies on liver cells as well as on three mass transport systems to ensure
the metabolic work load and the removal of drugs and toxins from the blood. The
mass transport systems consist of the vascular system, the biliary system and the
lymphatic system.
6
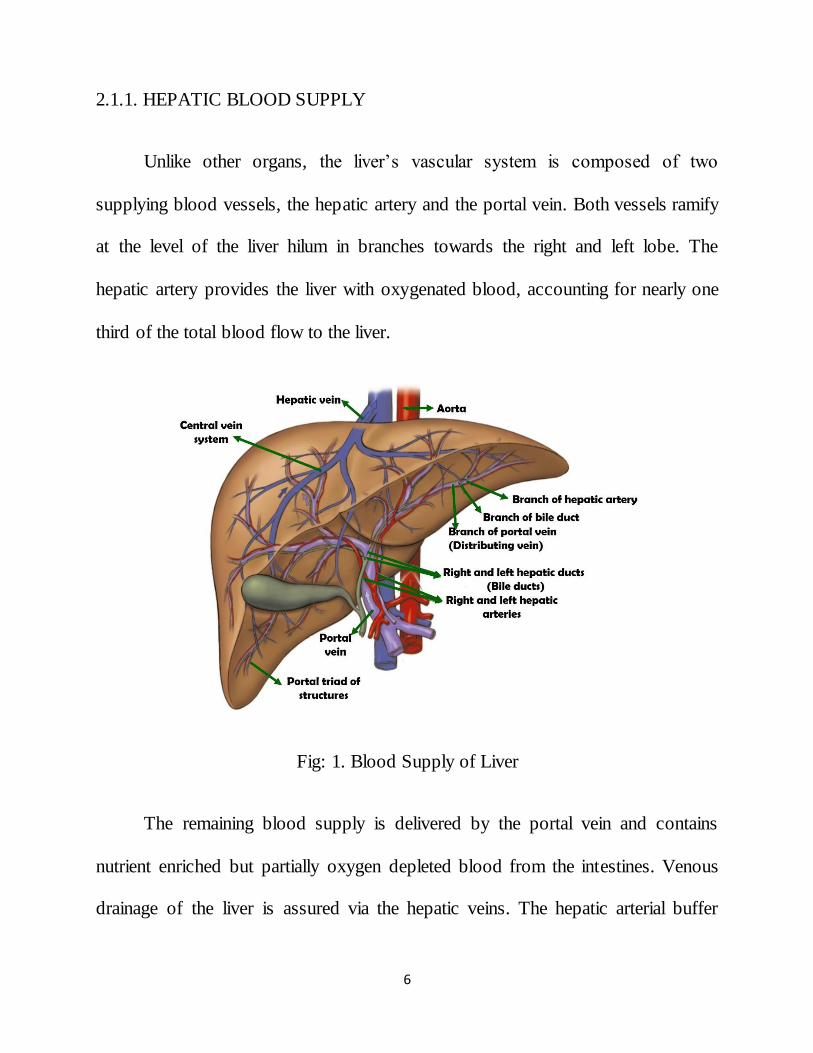
2.1.1. HEPATIC BLOOD SUPPLY
Unlike other organs, the liver’s vascular system is composed of two
supplying blood vessels, the hepatic artery and the portal vein. Both vessels ramify
at the level of the liver hilum in branches towards the right and left lobe. The
hepatic artery provides the liver with oxygenated blood, accounting for nearly one
third of the total blood flow to the liver.
Fig: 1. Blood Supply of Liver
The remaining blood supply is delivered by the portal vein and contains
nutrient enriched but partially oxygen depleted blood from the intestines. Venous
drainage of the liver is assured via the hepatic veins. The hepatic arterial buffer
7
response (HABR) is a mechanism to regulate the hepatic blood supply. Alterations
in the portal flow are compensated by changes in hepatic arterial flow in order to
ensure a constant hepatic blood flow. The mechanism depends on the amount of
adenosine locally washed away by the portal blood flow, resulting in either arterial
dilation or contraction (2).
The hepatic biliary tree counts two hepatic bile ducts emerging from the
liver. Both unite in the live hilum to form the common hepatic duct, which guides
the bile produced in the liver into the duodenum (1). The liver also produces a
large amount of lymph, which is mainly produced at a microstructural level (The
sinusoids). As a consequence, the liver has a deep lymphatic network to ensure the
drainage of the lymph directionally towards the heart (3).
2.1.2 FUNCTIONAL ANATOMY
2.1.2.1 HEPATIC LOBULE
The liver lobes are on a microstructural level, composed of repetitive
anatomical units called lobules (4). The lobules resemble the shape of hexagonal
prisms, which are penetrated by portal tracts at the periphery and central veins in
the centrum. The different vessel systems are separated by approximately 0.5 mm
(5). Portal triads contain the terminal intrahepatic ramifications of the portal vein,
8
hepatic artery and bile duct (Respectively portal venule, hepatic arteriole and a bile
ductule).
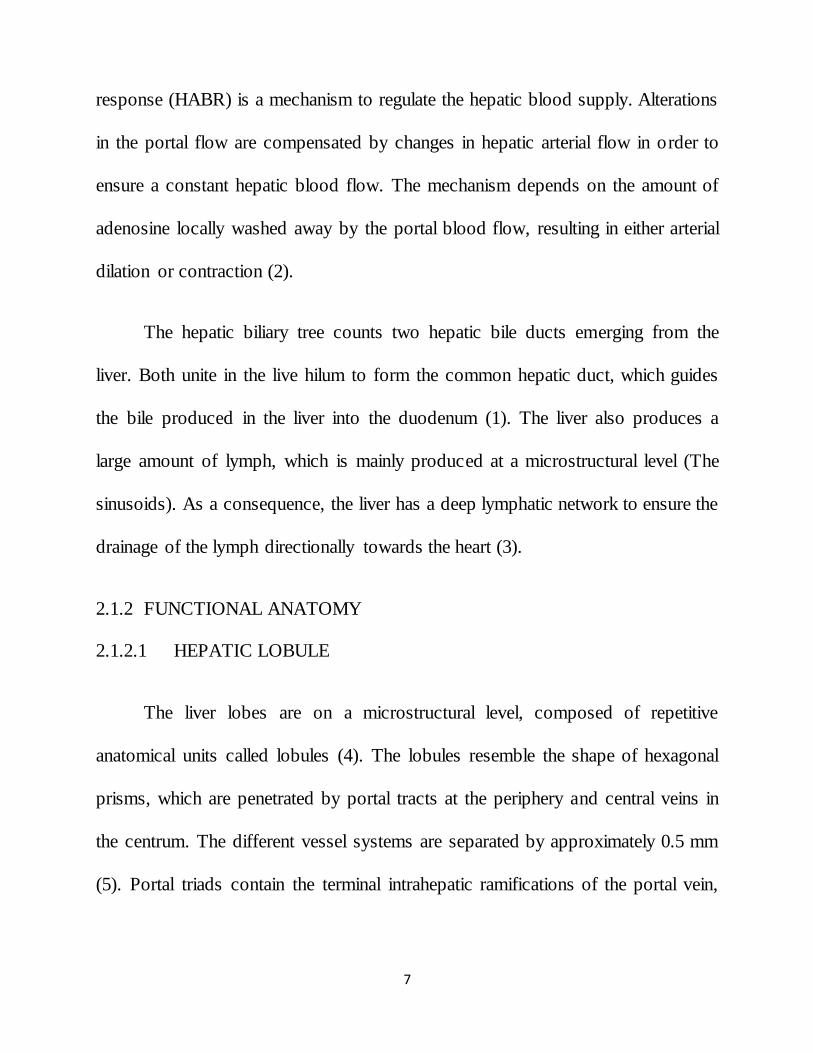
2.1.2.2 HEPATIC ACINUS
When looking from a metabolic perspective to the microcirculation, one of
the proposed functional units is the hepatic acinus (6). The acinus is centered on a
line connecting two terminal portal tracts and is divided in different metabolic
zones.
Fig: 2. Hepatic Acinus
The periportal zone I is situated closest to the arriving oxygenated blood
flow. Therefore, zone I hepatocytes are specialized in oxidative liver functions
(e.g. gluconeogenesis). The centrilobular zone III, on the other hand, receives

9
blood of inferior quality and thus may suffer most from ischemic injury. Although
this region is easily subjected to damage, it still provides a significant contribution
to the detoxification of blood.
Hepatocytes residing in zone II have functional and morphological
properties intermediate between cells of zones I and III. Hence, hepatocytes
contained within zone I survive longer and may form the basis for liver
regeneration after partial hepatectomy or hepatocellular damage.
This well-orchestrated regenerative response of the mature functioning cells
enables the liver to restore lost tissue up to two third of its total mass, while
simultaneously performing vital functions to maintain the body homeostasis
(7 & 5).
2.1.2.3 RHOMBOIDAL ACINUS
The rhomboidal acinus is located on the line connecting two terminal portal
triads consisting of a portal venule, hepatic arteriole and bile ductule. Zones I, II,
and III represent metabolic regions increasingly distant from the blood supply.
Zone I receives blood with the best quality with regard to oxygen and nutrients.
The circulatory peripheral zone III suffers most from injury (8).
10
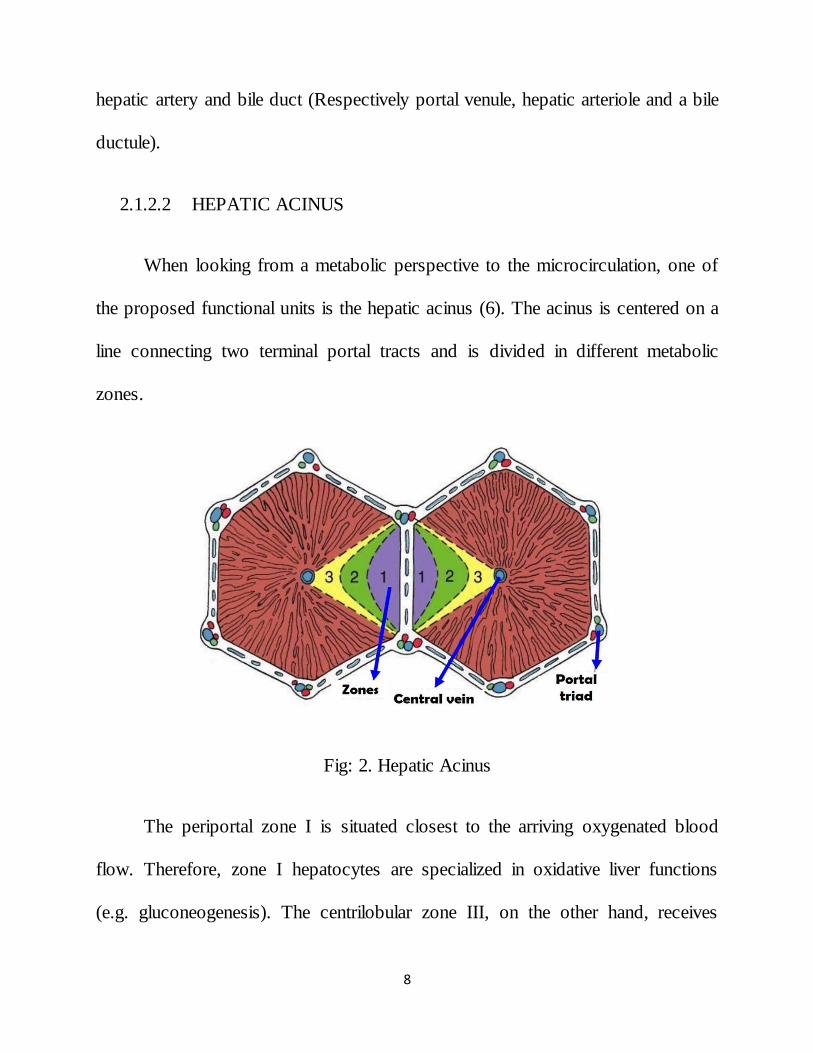
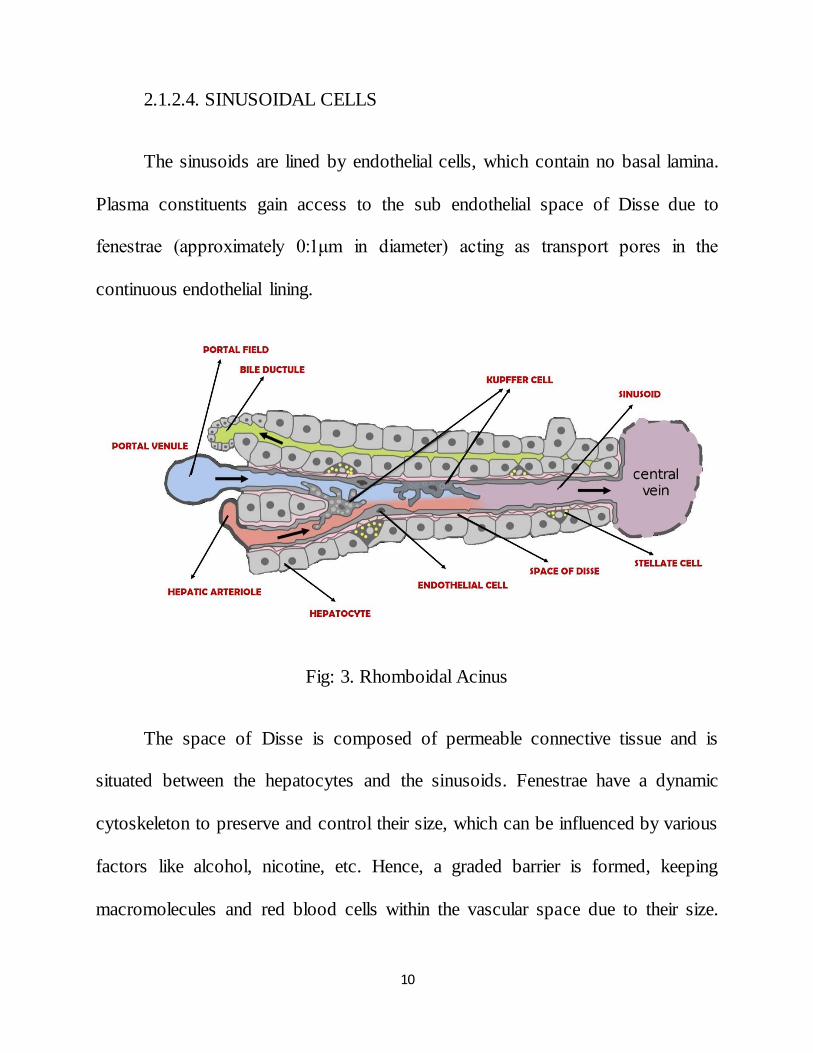
2.1.2.4. SINUSOIDAL CELLS
The sinusoids are lined by endothelial cells, which contain no basal lamina.
Plasma constituents gain access to the sub endothelial space of Disse due to
fenestrae (approximately 0:1μm in diameter) acting as transport pores in the
continuous endothelial lining.
Fig: 3. Rhomboidal Acinus
The space of Disse is composed of permeable connective tissue and is
situated between the hepatocytes and the sinusoids. Fenestrae have a dynamic
cytoskeleton to preserve and control their size, which can be influenced by various
factors like alcohol, nicotine, etc. Hence, a graded barrier is formed, keeping
macromolecules and red blood cells within the vascular space due to their size.
11
White blood cells, however are able to migrate through the endothelial cells into
the space of Disse and thence to the periportal region where lymph vessels in the
connective tissue ensure their return into the bloodstream. Moreover, pinocytosis,
carried out by the endothelial cells, enables the clearance of other vital (macro)
molecules from the circulation. Sinusoids thus form a vascular bed that functions
as a biofilter. The extracellular matrix may alter the sinusoidal capacity to sieve the
passing blood particles as it influences the diameter of the endothelial fenestrae (5).
2.2 CIRRHOSIS
The liver is an organ that can withstand a certain degree of damage, because
of its remarkable ability to regenerate lost tissue after injury. However, in case of
cirrhosis, repeated insults or chronic liver disease diffusely damages the liver cells
in the whole organ, causing inflammatory changes which result in cell necrosis.
As a reaction to the damaging process, fibrogenesis is activated to cooperate
in the wound healing process. In addition, hyperplasia of the surviving cells
eventually occurs leading to the formation of hepatocellular nodules. As injury to
the liver cells advances, progressive scarring of the liver and distortion of its
architecture manifests, causing hepatic impairment. Cirrhosis tends to get worse
over time and may even become life threatening. Despite several attempts, no all-
encompassing definition exists to describe cirrhosis in all its aspects.

12
The currently most used definition dates back from 1978 (Anthony) and is
exclusively defined in morphological terms:
Cirrhosis is a diffuse process characterized by fibrosis and the conversion of
normal architecture into structurally abnormal (regenerative) nodules (9).
Two independent characteristics, the connective tissue septa and
regenerative nodules, account for the main pathophysiologic chronic condition of
cirrhosis, irrespective of its etiologic starting point. Despite the fact that
parenchymal necrosis is omitted from the morphological definition, it is generally
presumed that a large part of the fibrosis synthesis is the result of necrosis.
Necrosis is therefore an essential feature as it entails not only the premature death
of cells but also the accompanying environmental reactions to and the
disappearance of dead cells.
The term cirrhosis thus implies an alteration of the hepatic circulation and is
traditionally assumed to be irreversible. In contrast, a recent study indicates that
cirrhosis regression or even reversal can be achieved after the successful treatment
of the underlying liver disease coupled with antifibrotic agents.

13
2.2.1. ETIOLOGY
Cirrhosis is defined as widespread fibrosis and nodule formation. Congenital
hepatic fibrosis consists of fibrosis without nodules. Partial nodular transformation
consists of nodules without fibrosis. Cirrhosis is a dynamic and complex process
which may be evoked by nutritional deficiencies, chemical agents and lack of
oxygen, viral and bacterial infections and metabolic disturbances. The most
common diseases that give rise to cirrhosis include chronic hepatitis, fatty liver
disease and chronic biliary disease (10). Alcoholic liver disease and hepatitis C are
the predominant causes of cirrhosis in Western countries, whereas the prevalence
of hepatitis B-induced cirrhosis is vastly increasing in developing countries. Since
the detection of the hepatitis C virus and non-alcoholic steatohepatitis, cirrhosis of
which the etiology cannot be diagnosed (Cryptogenic cirrhosis) only rarely occurs
(11). Often, co-factors including age, sex, obesity, alcohol and genetic factors
interact with the prevailing cause. Alcohol consumption, for instance, may severely
increase the likelihood of disease progression in patients with hepatitis B or C (5).
The following are various causes of Cirrhosis.
Viral hepatitis (A, B, C, D, E and G)
Alcohol
NASH
14
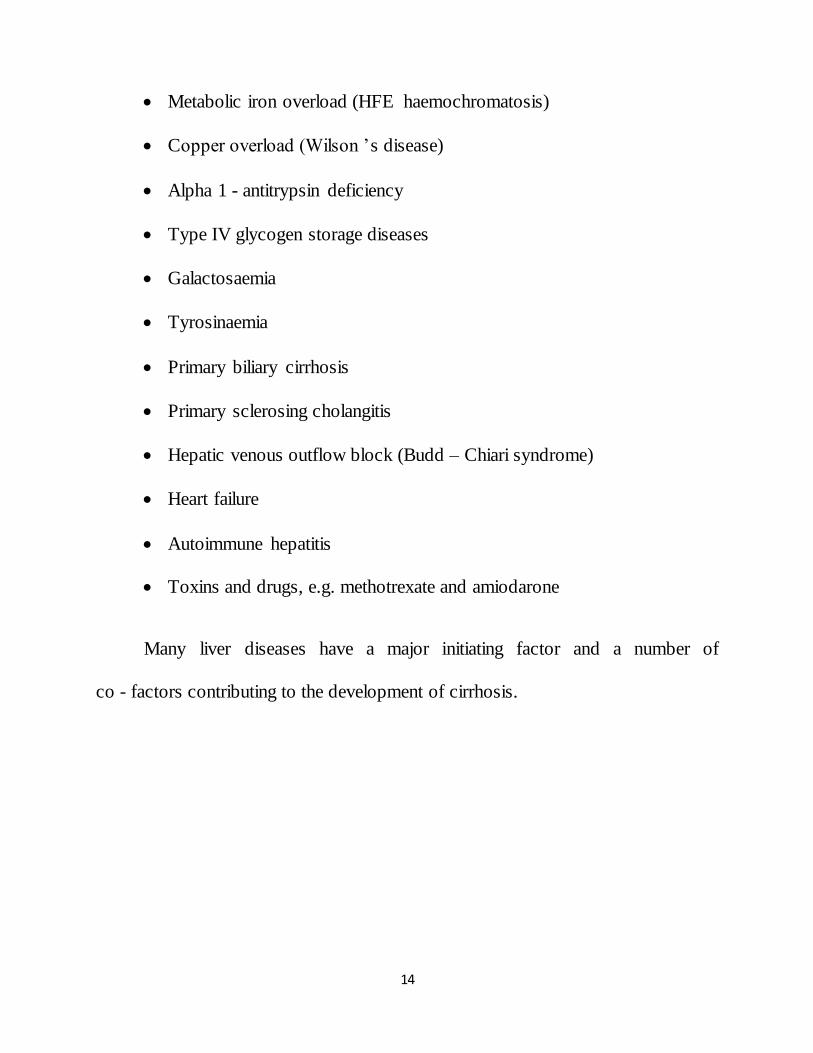
Metabolic iron overload (HFE haemochromatosis)
Copper overload (Wilson ’s disease)
Alpha 1 - antitrypsin deficiency
Type IV glycogen storage diseases
Galactosaemia
Tyrosinaemia
Primary biliary cirrhosis
Primary sclerosing cholangitis
Hepatic venous outflow block (Budd – Chiari syndrome)
Heart failure
Autoimmune hepatitis
Toxins and drugs, e.g. methotrexate and amiodarone
Many liver diseases have a major initiating factor and a number of
co - factors contributing to the development of cirrhosis.

15
Fig.4. Co - Factors for Development of Cirrhosis
Patients with insulin resistance or diabetes mellitus, or who are immune
suppressed, are at higher risk for developing cirrhosis from several etiologies. Thus
in many cases there can be a principal factor and interacting co - factors which
cause a patient to develop cirrhosis. The relative importance of these co -factors
may vary from patient to patient (5).
2.2.1.1. CHRONIC HEPATITIS
Common forms of chronic hepatitis include hepatitis B, hepatitis C and
autoimmune hepatitis. Pathological features that arise in chronic viral hepatitis
comprise parenchymal cell necrosis and periportal inflammation.

16
2.2.1.1.1. HEPATITIS C
The hepatic C virus (HCV) most likely evolves a mechanism to interfere
with immune signaling pathways and to prohibit antiviral actions. As such, the
virus enables the evasion of the host innate and adaptive immune response inside
infected hepatocytes. In addition, cytotoxic activity of natural killer cells towards
HCV-infected liver cells is down regulated. So once chronicity is established, the
virus can persevere despite the presence of cytotoxic T lymphocytes (CTL) and,
moreover, it is believed to be insensitive to antiviral cytokines. However, infected
and inflamed areas still initiate fibrogenesis through activation of hepatic stellate
cells with cytokines and other signaling molecules. Regions around the portal
tracts are primarily affected, the fibrosis thereafter gradually extends out into the
lobules towards the central veins (5).
2.2.1.1.2. HEPATITIS B
The pathogenesis of hepatic B virus (HBV)-related liver injury is driven by
complex interactions between the virus and the host immune response. Patients
affected with chronic hepatitis B do contain antibodies against hepatitis B,
however, these antibodies are not enough to overpower the infection. The virus
manages to infiltrate hepatocytes through endocytosis. Its continued reproduction
inside hepatocytes causes the adaptive immune response, in particular virus

17
specific CTLs, to react in an attempt to purify HBV from affected hepatocytes. The
killing of infected but viable liver cells contributes to most of the hepatocellular
necrosis (12 & 5).
2.2.1.1.3. AUTOIMMUNE HEPATITIS
Autoimmune hepatitis occurs when the host immune system invades hepatic
cells. Genetic predisposition or acute liver infection may be underlying reasons.
The abnormal immune response leads to liver inflammation and cell necrosis. Both
hepatitis B and autoimmune hepatitis are considered high grade necro
inflammatory diseases, as opposed to hepatitis C. Therefore, large regions of
parenchymal extinction are commonly produced by the former (5).
2.2.1.2. ALCOHOLIC FATTY LIVER DISEASE
Sustained alcohol abuse favors the development of alcoholic fatty liver
disease. Excess alcohol intake leads to an increased oxidative stress via generation
of reactive oxygen species (ROS). Some of the consequences of increased ROS
include altered mitochondrial activity, DNA damage, the destruction of membranes
via lipid peroxidation, and the release of pro inflammatory cytokines.
18
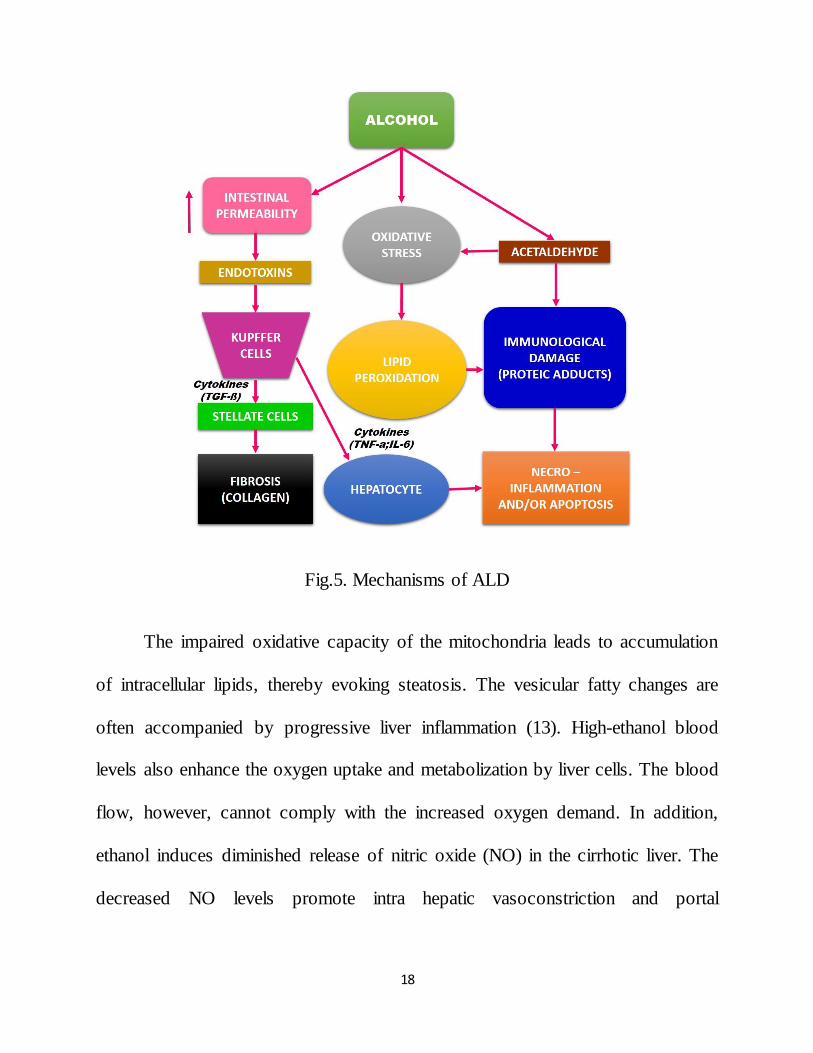
Fig.5. Mechanisms of ALD
The impaired oxidative capacity of the mitochondria leads to accumulation
of intracellular lipids, thereby evoking steatosis. The vesicular fatty changes are
often accompanied by progressive liver inflammation (13). High-ethanol blood
levels also enhance the oxygen uptake and metabolization by liver cells. The blood
flow, however, cannot comply with the increased oxygen demand. In addition,
ethanol induces diminished release of nitric oxide (NO) in the cirrhotic liver. The
decreased NO levels promote intra hepatic vasoconstriction and portal

19
hypertension. Both oxygen deficiency and reduced perfusion cause a hypoxic state
in centrilobular regions of the liver lobule.
Fig.6. Pathogenesis of ALD
Disorders of energy metabolism, ensued from either hypoxia or decreased
mitochondrial activity, can lead to hepatic injury (5 & 13). Furthermore, chronic
alcohol consumption increases the absorption of bacterial endotoxins. The
endotoxins, in turn, sensitize Kupffer cells, causing the exaggerated transcription
of proinflammatory cytokines (TNF-a, IL-6 and TGF-b).
The cytokines promote activation of stellate cells and induce
necroinflammation or apoptosis, leading to collagen synthesis and hepatocyte

20
ballooning (liver cell degeneration due to swelling and enlargement). Sinusoidal
fibrosis is often associated with alcoholic fatty liver disease, as it predominates in
the centrilobular zone situated around terminal hepatic vein (13).
2.2.1.3. NON-ALCOHOLIC FATTY LIVER DISEASE
Non-alcoholic fatty liver disease is commonly diagnosed in people with
diabetes and obesity. The relatively benign disease, which is related to metabolic
syndrome, can progress to inflammation of the liver and concomitant fat
accumulation (5 & 14).
2.2.1.4. CHRONIC BILIARY DISEASE
Chronic biliary diseases are marked by extra- or intra hepatic cholestasis.
Though prolonged biliary obstruction usually causes the inflammatory destruction
of bile ducts, metabolic disturbances (Genetic defects and medications) are also
considered as underlying causes. The progressive damage to the ducts impairs the
drainage of bile acids. Biliary products accumulate in the liver and, when leaking
outwards, damage the normal tissue. A network of fibrotic septa connecting
enlarged portal triads are often found in biliary cirrhosis. Other cirrhotic features,
including regenerative nodules and anastomoses, are rarer and less developed (14
& 10).

21
2.2.2. PATHOGENESIS
2.2.2.1. FIBROGENESIS
Fibrogenesis is an innate reparative process that contributes to the natural
wound healing response in injured tissue. Fibrous connective tissue is produced in
an attempt to limit and encapsulate the damaged area. However, sustained signals
associated with chronic or repetitive hepatocellular injury result in excessive
formation of scar tissue. Persistent accumulation of fibrosis can eventually cause
the development of cirrhosis (13 & 15).
The evolution of a normal to fibrotic and subsequent cirrhotic liver is a
complex process engaging several hepatic cells and mediators to restrict the
damage. The progression of fibrosis can vary among individuals and depends on
the cause of hepatic injury. In addition, factors including alcohol consumption,
male gender and greater age at the time of infection are all associated with ‘rapid
fibrosers’. Genetic determinants may also contribute to variable progression
rates (5).

22
Fig. 7. Fibrogenesis of liver
In the normal liver, strands of type IV (non-fibrillary) collagen are present in
the space of Disse among other low-density components to provide cellular support
and molecular signals.
The low-density connective tissue matrix and fenestrated basement
membrane thus enable the unhampered exchange of substances between the
sinusoidal lumen and hepatocytes. After hepatic injury, a vast increase in high-
density fibril-forming collagen (type I and III) deposition is observed along portal
tracts, in spaces of Disse and in regions of necroinflammatory collapse.
The growing accumulation of type I collagen, key characteristic of
fibrogenesis, originates from both reduced degradation and increased synthesis.
The hepatic stellate cells (HSC) and portal fibroblasts are the main cell types

23
involved in fibrogenesis that synthesize collagen in the liver. Both cell types differ
in location and physiology, the stellate cells lie within spaces of Disse whereas
portal fibroblasts reside within the vicinity of portal tracts (5).
2.2.2.2. HEPATIC STELLATE CELLS
In the quiescent state, hepatic stellate cells generate primarily type IV
collagen. During hepatic injury, inflammatory mediators, including both apoptotic
and necrotic hepatocytes and paracrine stimuli from neighboring cell types
(Endothelial cells, Kupffer cells, etc.) initiate the stellate cell activation.
Subsequently, key cytokines are able to further stimulate the activated HSC
causing the transformation into myofibroblasts.
The phenotypic switch induces besides collagen synthesis (type I and III)
also cellular proliferation, loss of retinoid droplets, increased contractility,
chemotaxis and the production of matrix-degrading enzymes and inflammatory
signals. The high-density collagen deposition in the space of Disse leads to an
increased and denser fibril-forming matrix. Sources producing collagenases with
activity towards type I collagen are less developed as opposed to collagenases of
the normal basement membrane collagen type IV.
The increasing scar matrix can therefore not be sufficiently degraded, which
hinders the transport of solutes and growth factors across the interstitial space.

24
Irregular matrix deposition generally happens in damaged and inflamed areas of
the parenchyma and imposes detrimental effects on the hepatocytes’ differentiated
cell function. Sinusoidal vascular resistance is enlarged by the tonic contraction of
these myofibroblasts (14).
A recent study also indicates that paracrine signals released by activated
HSCs may promote progenitor cell expansion, the outcome of which is either
hepatic regeneration or promotion of hepatocarcinogenesis (16). Once hepatic
homeostasis has restored, the activated HSCs either revert to quiescent phenotypes
or are cleared by apoptosis. The cross-linking of collagen and the maturation of the
hepatic scar, however, remain the determinants of hepatic fibrosis reversibility
(15).
2.2.2.2. PORTAL FIBROBLASTS
Portal fibroblasts are thought to play a pivotal role in cholestatic liver
diseases and ischemia (15). The cells are triggered by injury to portal tracts,
resulting in excessive collagen deposition near ducts and ductules. Their rapid
proliferation may engender biliary fibrosis to run an aggressive course.
Furthermore, hepatic macrophages show divergent roles as matrix remodeling
regulators. During fibrotic progression, macrophages promote fibrogenesis,
whereas during fibrotic regression matrix degradation is accelerated (16).

25
2.2.2.3. REGENERATIVE NODULES
Cirrhosis is considered as an advanced stage of liver fibrosis, characterized
by alterations of the lobular structure and the presence of regenerative nodules and
vascular anastomoses. Several theories have been offered to elucidate the
regenerative mechanism and the formation of fibrous septa, two critical events
inherent to cirrhotic progression. Septa or sheetlike structures arise due to various
causes. In the presence of steatosis, fat droplets merge to form fatty cysts, around
which micromembranes develop.
Eventually the fat disappears from the cysts and the connective tissue
framework condenses into septa. In addition, stress-induced fissures appear
between areas of irregular distributed fat. Fine connective tissue membranes are
deposited in these fissures and cumulate into straight septa (10).
Fibrotic membranes laid down around inflamed portal tracts, however, are
more important during the septa-forming process, especially in the absence of
steatosis. These connective tissue membranes radiate from the portal tracts into the
parenchyma and converge afterwards to become septa. The septa development
leads to a rearrangement of liver cell plates. Hepatocellular damage also
contributes substantially to the septa formation, as irregular tissue stresses can
evoke intralobular and periportal fissures. In these fissures, membranes aggregate
26
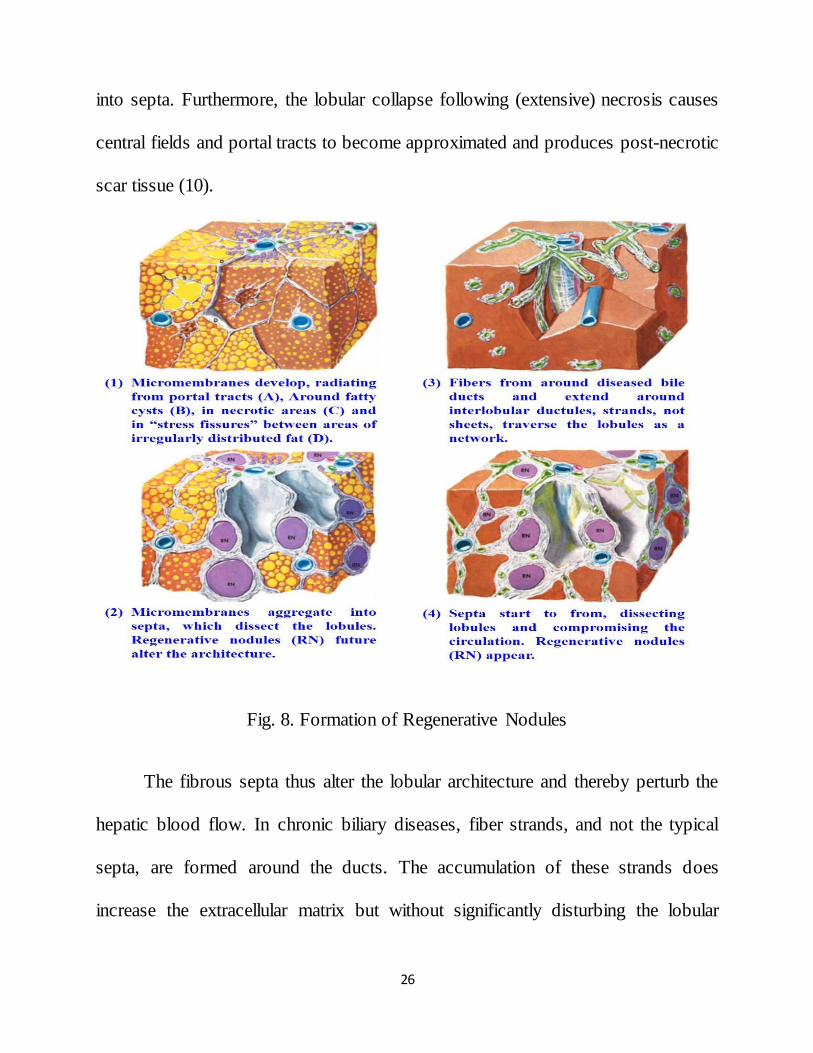
into septa. Furthermore, the lobular collapse following (extensive) necrosis causes
central fields and portal tracts to become approximated and produces post-necrotic
scar tissue (10).
Fig. 8. Formation of Regenerative Nodules
The fibrous septa thus alter the lobular architecture and thereby perturb the
hepatic blood flow. In chronic biliary diseases, fiber strands, and not the typical
septa, are formed around the ducts. The accumulation of these strands does
increase the extracellular matrix but without significantly disturbing the lobular
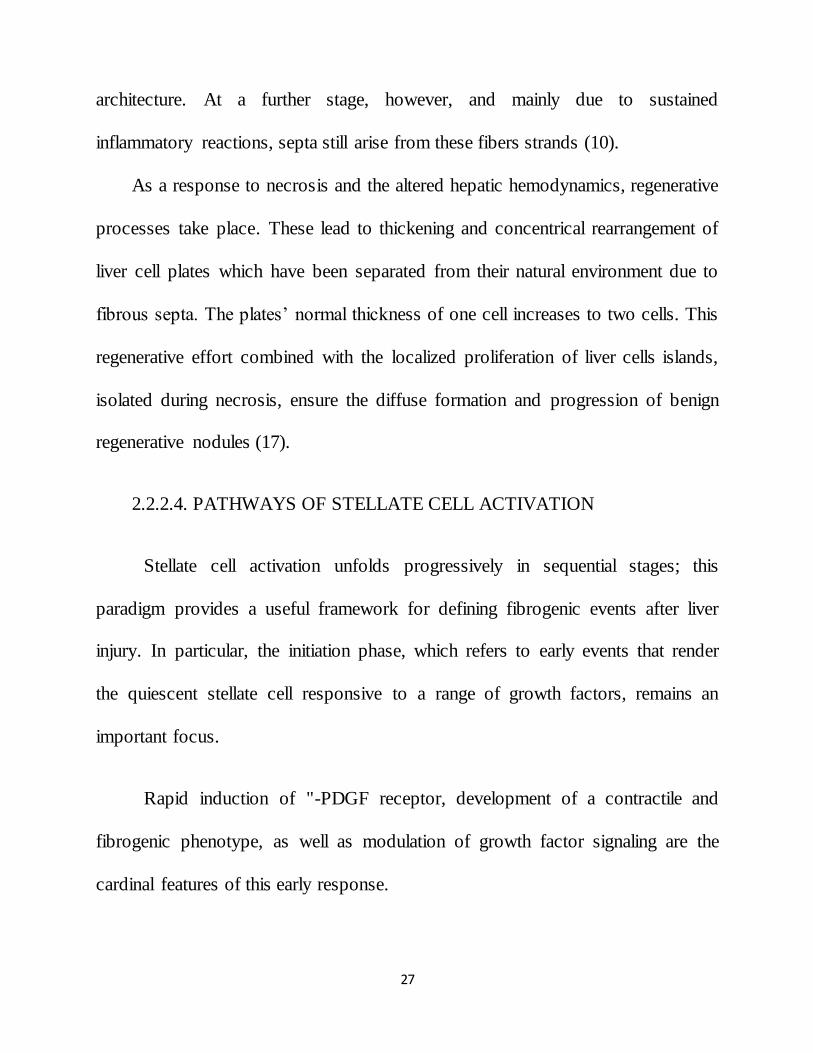
27
architecture. At a further stage, however, and mainly due to sustained
inflammatory reactions, septa still arise from these fibers strands (10).
As a response to necrosis and the altered hepatic hemodynamics, regenerative
processes take place. These lead to thickening and concentrical rearrangement of
liver cell plates which have been separated from their natural environment due to
fibrous septa. The plates’ normal thickness of one cell increases to two cells. This
regenerative effort combined with the localized proliferation of liver cells islands,
isolated during necrosis, ensure the diffuse formation and progression of benign
regenerative nodules (17).
2.2.2.4. PATHWAYS OF STELLATE CELL ACTIVATION
Stellate cell activation unfolds progressively in sequential stages; this
paradigm provides a useful framework for defining fibrogenic events after liver
injury. In particular, the initiation phase, which refers to early events that render
the quiescent stellate cell responsive to a range of growth factors, remains an
important focus.
Rapid induction of "-PDGF receptor, development of a contractile and
fibrogenic phenotype, as well as modulation of growth factor signaling are the
cardinal features of this early response.

28
Features of stellate cell activation can be distinguished between those that
stimulate initiation and those that contribute to perpetuation. Initiation is provoked
by soluble stimuli that include oxidant stress signals (Reactive oxygen
intermediates), apoptotic bodies, lipopolysaccharide (LPS), and paracrine stimuli
from neighboring cell types including hepatic macrophages (Kupffer cells),
sinusoidal endothelium and hepatocytes. Perpetuation follows, characterized by a
number of specific phenotypic changes including proliferation, contractility,
fibrogenesis, altered matrix degradation, chemotaxis and inflammatory signaling.
Eventually the fat disappears from the cysts and the connective tissue
framework condenses into septa. In addition, stress-induced fissures appear
between areas of irregular distributed fat. Fine connective tissue membranes are
deposited in these fissures and cumulate into straight septa Fibrotic membranes
laid down around inflamed portal tracts, however, are more important during the
septa-forming process, especially in the absence of steatosis.

29
Fig. 9. Pathway of hepatic stellate cell activation
These connective tissue membranes radiate from the portal tracts into the
parenchyma and converge afterwards to become septa. The septa development
leads to a rearrangement of liver cell plates.
Hepatocellular damage also contributes substantially to the septa formation,
as irregular tissue stresses can evoke intralobular and periportal fissures. In these
fissures, membranes aggregate into septa. Furthermore, the lobular collapse
following (Extensive) necrosis causes central fields and portal tracts to become
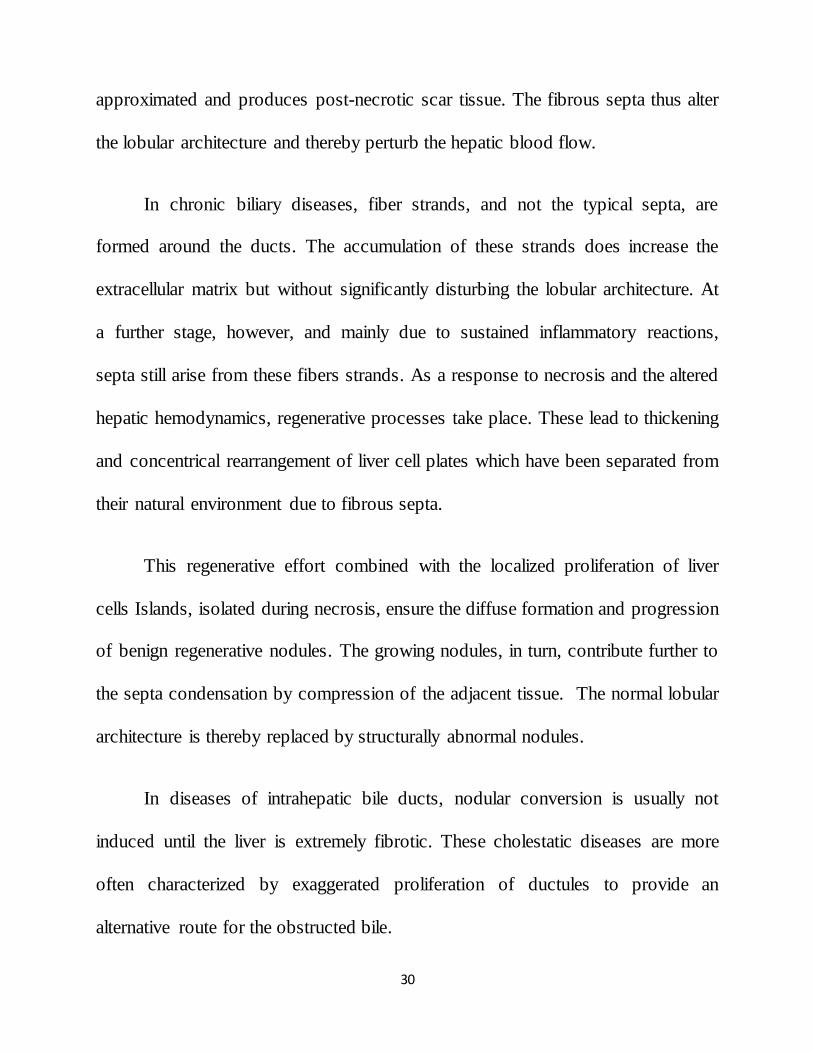
30
approximated and produces post-necrotic scar tissue. The fibrous septa thus alter
the lobular architecture and thereby perturb the hepatic blood flow.
In chronic biliary diseases, fiber strands, and not the typical septa, are
formed around the ducts. The accumulation of these strands does increase the
extracellular matrix but without significantly disturbing the lobular architecture. At
a further stage, however, and mainly due to sustained inflammatory reactions,
septa still arise from these fibers strands. As a response to necrosis and the altered
hepatic hemodynamics, regenerative processes take place. These lead to thickening
and concentrical rearrangement of liver cell plates which have been separated from
their natural environment due to fibrous septa.
This regenerative effort combined with the localized proliferation of liver
cells Islands, isolated during necrosis, ensure the diffuse formation and progression
of benign regenerative nodules. The growing nodules, in turn, contribute further to
the septa condensation by compression of the adjacent tissue. The normal lobular
architecture is thereby replaced by structurally abnormal nodules.
In diseases of intrahepatic bile ducts, nodular conversion is usually not
induced until the liver is extremely fibrotic. These cholestatic diseases are more
often characterized by exaggerated proliferation of ductules to provide an
alternative route for the obstructed bile.

31
2.2.2.5. MORPHOLOGY OF CIRRHOSIS
Cirrhosis can be subdivided, based on its morphology, into micronodular or
macronodular forms. Micronodular cirrhosis implies that almost all the
regenerative nodules are less than 3mm in diameter (9). It most commonly
originates from diseases in which a hepatotoxic agent or metabolic disorder
uniformly affects the lobules. For instance, high-dose ethanol exposure causes
primarily the deposition of connective tissue septa along sinusoids, linking portal
tracts to central veins. When nearly all portal tracts and central veins are connected
by septa, the fibrous tissue strongly constrains the enlarging nodules. Micronodules
barely contain portal tracts or terminal hepatic veins.
Cirrhotic macronodules, on the other hand, may comprise residual portal
structures and central veins, which are not bound by septa. Its diameter varies
notably and ranges from 3mm to several centimeters. Macronodular cirrhosis is
usually due to viral hepatitis and arises after continued massive collapse of
cirrhotic parenchyma, promoting accentuated regeneration (10). Although
regenerative nodules are benign, it is not uncommon that some progress along a
carcinogenic pathway to become malignant nodules or hepatocellular carcinoma
(17).

32
2.2.2.6. HEMODYNAMIC ALTERATIONS
Additional to the complex molecular processes involved in fibrogenesis
(interacting cells, fibrogenic mediators, etc.) and the formation of regenerative
nodules, modifications to the angioarchitecture are also considered as a central
aspect in the pathological pathway to cirrhosis. These changes, including
sinusoidal remodeling, angiogenesis and the development of intrahepatic shunts,
increase the intrahepatic vascular resistance leading to various complications.
Moreover, the degraded sinusoids hamper the metabolic exchange between
sinusoids and hepatocytes, which may progress to life-threatening liver failure.
2.2.2.6.1. SINUSOIDAL CAPILLARIZATION
Sinusoidal capillarization induces microcirculatory distortions in the liver. It
comprises collagenization of the space of Disse, deposition of basement
membranes and alterations of fenestrae is accompanied by a loss of hepatocyte
microvilli.
The aggregation of fibrous connective tissue, due to fibrogenesis, hampers
the diffusion of blood solutes across the extravascular space of Disse during the
metabolic exchange between sinusoids and hepatocytes. Moreover, the excessive

33
fibrotic tissue in the space of Disse combined with the hepatic stellate cells’ tonic
contraction, leads to narrowing of sinusoids and hence increases the sinusoidal
vascular resistance which, in turn, impedes sinusoidal perfusion (5).
Fig. 10. Collagen deposition and sinusoidal constriction in cirrhosis.
The formation of basement membranes near the endothelium and
epithelium, acts as an additional barrier to restrict access to the extravascular
space. In addition, the number and size of fenestrae progressively decreases in
cirrhotic livers. The fenestrated sinusoids are therefore transformed into continuous
and more rigid capillaries, which contribute further to the increasing intrahepatic
vascular resistance and the subsequent development of portal hypertension.
The limited permeability of the sinusoids deprives the hepatocytes of
nutrients and the ability to perform vital metabolic functions. Sinusoidal

34
capillarization hence contributes to liver failure, regardless of the metabolic
capacity of hepatocytes (18, 19 & 20).
2.2.2.6.2. ANGIOGENESIS AND INTRAHEPATIC SHUNTS
The anomalies frequently observed in cirrhotic livers, are angiogenesis and
the presence of intrahepatic shunts. Both vascular abnormalities predominate along
regions of active inflammation and fibrous septa. In these hypoxic conditions, the
transcription of the vascular endothelial growth factor (VEGF) is substantially up
regulated by hepatic stellate cells in order to stimulate angiogenesis. It is likely that
the sustained hypoxic state in fibrotic areas thus gives rise to the formation of new
blood vessels or the reopening of preformed vessels, to countervail the inadequate
blood supply and to restore the intrahepatic blood circulation (21 & 22).
In post-necrotic scars or during the septa formation, liver sinusoids get
entrapped within connective tissue. After parenchymal collapse, portal and central
field’s approximate and adjacent septa eventually merge to form fibrous bridges
between portal tracts and central veins. The bridging separates the sinusoids
entirely from the parenchyma. While some of the trapped sinusoids are obliterated
due to the fibrous septa, others are transformed into widened porto-hepatic venous
anastomoses (or internal Eck’s fistulae). Blood, guided into those low hindrance
pathways, bypasses the liver cells, and is shunted directly into central veins (5).
35
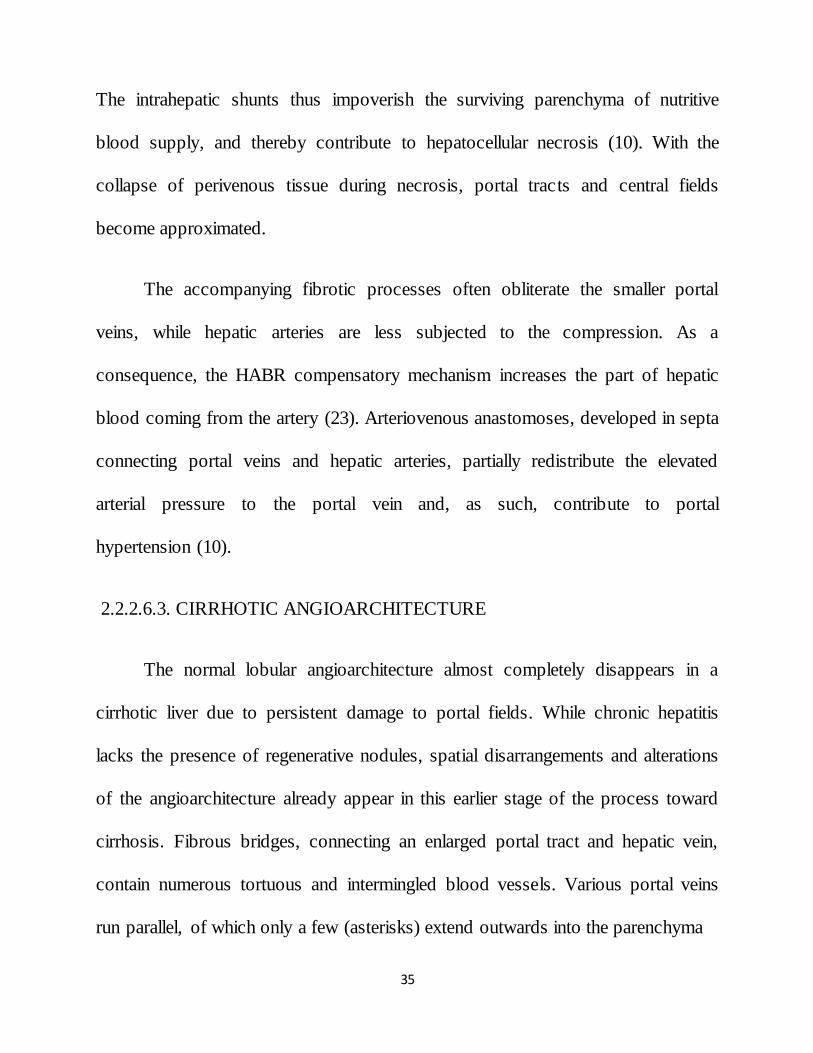
The intrahepatic shunts thus impoverish the surviving parenchyma of nutritive
blood supply, and thereby contribute to hepatocellular necrosis (10). With the
collapse of perivenous tissue during necrosis, portal tracts and central fields
become approximated.
The accompanying fibrotic processes often obliterate the smaller portal
veins, while hepatic arteries are less subjected to the compression. As a
consequence, the HABR compensatory mechanism increases the part of hepatic
blood coming from the artery (23). Arteriovenous anastomoses, developed in septa
connecting portal veins and hepatic arteries, partially redistribute the elevated
arterial pressure to the portal vein and, as such, contribute to portal
hypertension (10).
2.2.2.6.3. CIRRHOTIC ANGIOARCHITECTURE
The normal lobular angioarchitecture almost completely disappears in a
cirrhotic liver due to persistent damage to portal fields. While chronic hepatitis
lacks the presence of regenerative nodules, spatial disarrangements and alterations
of the angioarchitecture already appear in this earlier stage of the process toward
cirrhosis. Fibrous bridges, connecting an enlarged portal tract and hepatic vein,
contain numerous tortuous and intermingled blood vessels. Various portal veins
run parallel, of which only a few (asterisks) extend outwards into the parenchyma

36
to nourish liver cells. Those rather small veins resemble point-like inflow sources
and provide the nutrition for liver cells to regenerate. When regenerative nodules
become completely isolated from their portal blood supply, hepatic arteries are
assumed to contribute to the maintenance of the nodules (5). Another hypothesis,
however, suggests that angiogenic pathways are activated within regenerative
nodules to promote the formation of new blood vessel (10).
Fig. 11. Formation of Cirrhotic Angioarchitecture
2.2.3. CLIICAL FEATURE COMPLICATIONS
Based on clinical outcomes, cirrhosis can be described as either
compensated or decompensated. Decompensation implies the manifestation of
clinically evident complications resulting from either portal hypertension or liver
deficiency (jaundice etc.).

37
Fig.12. Complications of Cirrhosis
Compensated cirrhosis, on the other hand, is non-symptomatic, as the liver is
able to compensate for the incurred liver damage. However, it can progress
towards decompensation (24).
2.2.3.1. PORTAL HYPERTENSION
All forms of cirrhosis lead to portal hypertension and the primary event is
obstruction to portal blood flow. Portal venous blood is diverted into collateral
channels and some bypasses the liver cells and is shunted directly into the hepatic
venous radicles in the fibrous septa.

38
Fig.13. Formation of Portal Hypertension
These portohepatic anastomoses develop from pre - existing sinusoids e
nclosed in the septa. Even larger portohepatic venous anastomoses are found in the
cirrhotic liver. About one - third of the total blood flow perfusing the cirrhotic liver
may bypass sinusoids, and hence functioning liver tissue, through these channels.
The obstruction to portal flow is partially due to nodules which compress
hepatic venous radicles. This would lead to a postsinusoidal portal hypertension.
However, in cirrhosis, the wedged hepatic venous (sinusoidal) and main portal
pressures are virtually identical and the stasis must extend to the portal inflow

39
vessels. Sinusoids probably provide the greatest resistance to flow. Changes in the
space of Disse, particularly collagenization, result in sinusoidal narrowing and this
may be particularly important in the alcoholic. Hepatocyte swelling in the
alcoholic may also reduce sinusoidal flow.
Portal hypertension may arise in cirrhotic livers as a consequence of the
increased intrahepatic vascular resistance (regenerative nodules and fibrous tissue)
coupled with an increased portal blood flow (hyperdynamic circulation). Due to
the distorted angioarchitecture and abnormal hemodynamics, the blood pressure in
the portal venous system, normally varying between 5 and 10 mmHg, then exceeds
a value of 10 mmHg (24 & 25). The hypertension can be linked to most of the
clinical complications of cirrhosis.
2.2.3.2. ASCITES
Ascites is the accumulation of excessive fluid within the peritoneal cavity. It
is most frequently encountered in patients with cirrhosis and other forms of severe
liver disease, although a number of other disorders may lead to either transudative
or exudative ascites.
40
2.2.2. PATHOGENESIS
The accumulation of ascitic fluid represents a state of total body water and
sodium excess, but the event that initiates this imbalance is unclear. Three theories
have been proposed.
The “Underfilling” theory suggests that the primary abnormality is
inappropriate sequestration of fluid within the splanchnic vascular bed due to
portal hypertension and a consequent decrease in effective circulating blood
volume. According to this theory, an apparent decrease in intravascular volume
(underfilling) is sensed by the kidney, which responds by retaining salt and water.
The “Overflow” theory suggests that the primary abnormality is
inappropriate renal retention of salt and water in the absence of volume depletion.
A third, more attractive theory, the peripheral arterial vasodilatation
hypothesis, may unify the earlier theories. It accounts for the constellation of
arterial hypotension and increased cardiac output in association with high levels of
vasoconstrictor substances that are routinely found in patients with cirrhosis and
ascites. Again, sodium retention is considered secondary to arterial vascular
underfilling which is the result of a disproportionate increase of the vascular
compartment due to arteriolar vasodilation rather than from decreased intravascular
volume.

41
According to this theory, portal hypertension results in splanchnic arteriolar
vasodilation, mediated by nitric oxide, and leads to underfilling of the arterial
vascular space and baroreceptor-mediated stimulation of reninangiotensin,
sympathetic output, and antidiuretic hormone release. Regardless of the initiating
event, a number of factors contribute to accumulation of fluid in the abdominal
cavity. Elevated levels of serum epinephrine and norepinephrine have been well
documented. Increased central sympathetic outflow is found in patients with
cirrhosis and ascites but not in those with cirrhosis alone. Increased sympathetic
output results in diminished natriuresis by activation of the renin-angiotensin
system and diminished sensitivity to atrial natriuretic peptide.
Portal hypertension plays an important role in the formation of ascites by
raising hydrostatic pressure within the splanchnic capillary bed. Hypoalbuminemia
and reduced plasma oncotic pressure also favor the extravasation of fluid from
plasma to the peritoneal cavity. Thus ascites is infrequent in patients with cirrhosis
unless both portal hypertension and hypoalbuminemia are present. Hepatic lymph
may weep freely from the surface of the cirrhotic liver due to distortion and
obstruction of hepatic sinusoids and lymphatics and contribute to ascites formation.
Renal factors also play an important role in perpetuating ascites. Patients
with ascites fail to excrete a water load in a normal fashion. They have increased

42
renal sodium reabsorption in proximal and distal tubules, the latter largely due to
increased plasma renin activity and secondary hyperaldosteronism. Insensitivity to
circulating atrial natriuretic peptide, often present in elevated concentrations in
patients with cirrhosis and ascites, may be an important contributory factor in
many patients. Renal vasoconstriction, perhaps resulting from increased serum
prostaglandin or catecholamine levels, may also contribute to sodium retention.
Recently a role for endothelin, a potent vasoconstrictor peptide, has been proposed.
While elevated levels have been reported by some, this has not been observed by
others (5).
2.2.3. CLINICAL FEATURES AND DIAGNOSIS
Usually ascites is first noticed by the patient because of increasing
abdominal girth. More pronounced accumulation of fluid may cause shortness of
breath because of elevation of the diaphragm. When peritoneal fluid accumulat ion
exceeds 500 mL, ascites may be demonstrated on physical examination by the
presence of shifting dullness, a fluid wave, or bulging flanks. Ultrasound
examination, preferably with a Doppler study, can detect smaller quantities of
ascites.

43
2.2.3.1. VARICES (COLLATERAL CIRCULATION)
Extensive portal – systemic venous communications develop in order to
decompress the high – pressure portal venous system. Maintenance of portal
hypertension after the collateral are formed, is attributed to a resultant increase in
splanchnic blood flow.
2.2.3.1.1. MAJOR SITES OF COLLATERALS
Oesophageal and gastric varices (Left gastric vein and short gastric vein
join with intercostal, diaphragragmatic, oesophageal and azygos veins of
the caval system).
Heamorrhoids (Superior haemorrhoidal vein of the portal system to
middle and inferior haemorrhoidal veins of the caval system).
Caput medusa (Remnants of the umbilical circulation of the foetus
present in the falciform ligament may form a large paraumbilical vein).
Other sites of anastomoses are retroperitoneal vein, lumber vein, omental
veins and veins over bare area of the liver.
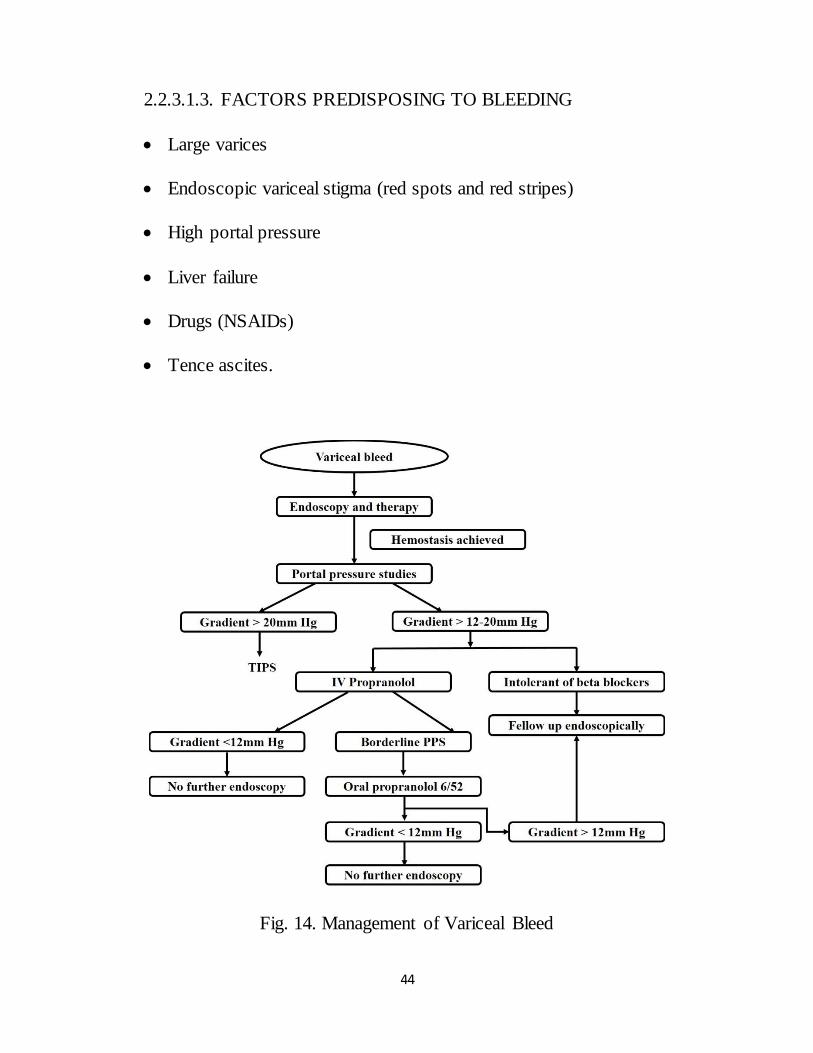
2.2.3.1.2. VARICEAL BLEEDING
Variceal bleeding occurs when portal venous pressure is more than 12 mm
Hg. Mostly bleeding arises from oesophageal varices within 3 to 5 cm of the
oesophagogastric junction or from gastric varices.
44
2.2.3.1.3. FACTORS PREDISPOSING TO BLEEDING
Large varices
Endoscopic variceal stigma (red spots and red stripes)
High portal pressure
Liver failure
Drugs (NSAIDs)
Tence ascites.
Fig. 14. Management of Variceal Bleed

45
2.2.4. HEPATIC ENCEPHALOPATHY
The hyperdynamic circulation is probably caused by an overproduction of
nitric oxide, a vasodilator molecule, in the extrahepatic blood flow. The NO
overproduction is promoted by the increased intestinal permeability of bacterial
endotoxins. Due to the NO molecule, the vascular resistance in the splanchnic and
systemic circulations substantially decreases, leading to an increased splanchnic
blood flow (and portal blood flow) and elevated cardiac output.
Fig.15. Mechanisms of Hepatic Encephalopathy
46
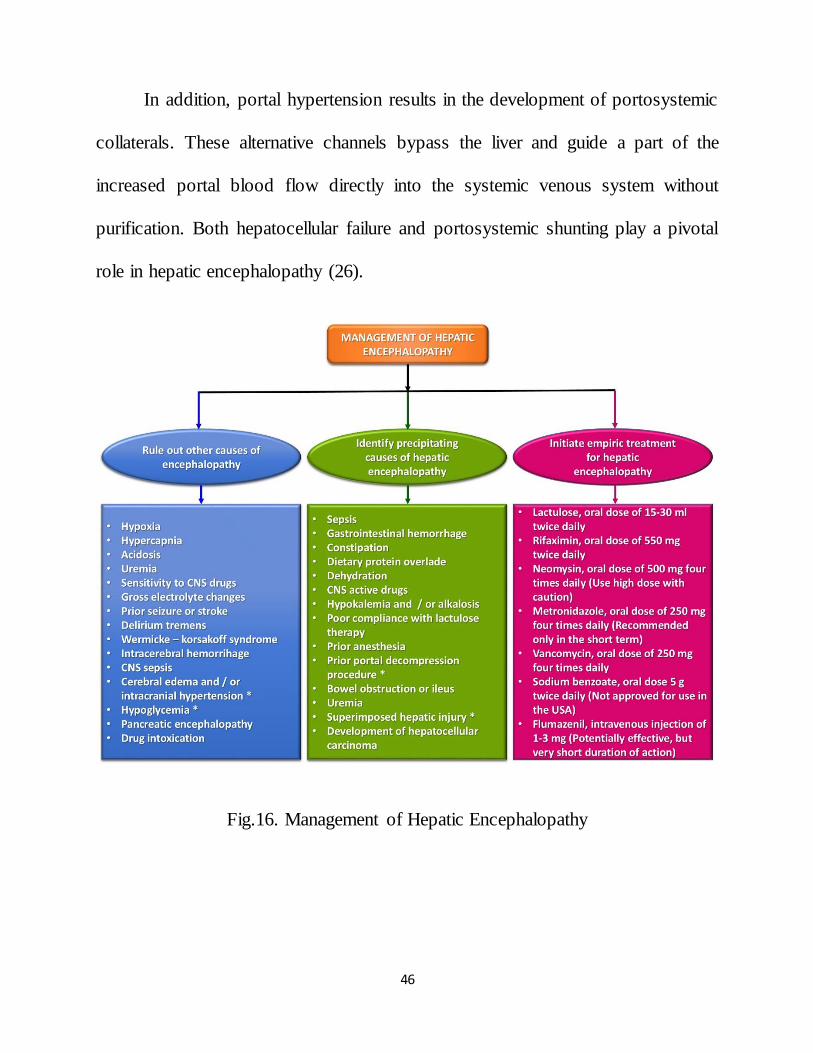
In addition, portal hypertension results in the development of portosystemic
collaterals. These alternative channels bypass the liver and guide a part of the
increased portal blood flow directly into the systemic venous system without
purification. Both hepatocellular failure and portosystemic shunting play a pivotal
role in hepatic encephalopathy (26).
Fig.16. Management of Hepatic Encephalopathy

47
2.2.5. SPONTANEOUS BACTERIAL PERITONITIS
It is defined as infected ascetic fluid in the absence of recognizable
secondary cause of peritonitis. It is associated with an ascetic protein of <1gm/dL.
Spontaneous Bacterial Peritonitis (SBP) can occur in upto 30% of individuals.
2.2.5.1. ORGANISMS
Coliforms, Streptococci, Camphylobacter; uaually infection is blood –
borne. Ascitic fluid infection can also be due to staph. Aureus and Enterococcus.
E. coli infection is more common.
2.2.5.2. MECHANISM
Bacterial translocation from the gut through mesenteric node. Culture are
more likely to be positive when 10 ml of ascetic fluid is inoculated into two culture
bottles at the bed side. If more than two organisms are identified in culture,
secondary bacterial peritonitis due to preformation should be considered.
2.2.6. HEPATORENAL SYNDROME
The haemodynamic alteration in kidneys are as a result of decreased effective
blood volume and increased sympathetic tone. Increased intra – abdominal and
renal venous pressure and alteration of balance between vasoactive humoral agents

48
such as renin – angiotensin, prostaglandins, theromboxanes, kinins, endotoxins,
and renal kallikrein may play a role.
Fig.17. Hepatorenal Syndrome
Involvement of endothelin – 1and 3 has been implicated in hepatorenal
syndrome. Role of nitric oxide has also been suggested as one of the mechanisms.
The kidneys are anatomically, histologically and functionally normal.
49
Following six criterias must be present to confirm diagnosis;
Cirrhosis with ascites
Serum creatinine > 1.5 mg %.
Absence of other causes of renal failure as evidenced by proteinuria >
500 mg/dL, urine RBC> 50/HPF and abnormal renal USG.
No evidence of treatment with nephrotoxic drugs/vasodilators.
Absence of shock
Absence of sustained improvement of renal function following at least 2
days of diuretic withdrawal and volume expansion with albumin.
2.2.7. HEPATOPULMONARY SYNDROME
Hepatopulmonary syndrome is characterised by
Advanced Chronic Liver Disease
Arterial Hypoxaemia (Decreased Pao2)
Intra – Pulmonary Vasodilatation
No Primary Cardio – Pulmonary Disorder (26).
2.2.8. OTHER COMPLICATIONS
Hyponatraemia
High Output Cardiac Failure
Peripheral Arterial Vasodilatation
Central Under filling Collateral Formation

50
Increased Splanchnic Blood Flow
2.3. LIPID METABOLISMS
2.3.1. THE ADIPOSE TISSUE
Triglycerides comprise around 95% of dietary lipids and can be stored
within the specialised storage organ adipose tissue, or within other organs,
principally liver and muscle. Lipids play essential roles in energy storage, vitamin
absorption, cellular membrane maintenance and cellular signalling.
The fatty acid content of the body originates either from exogenous dietary
sources or from endogenous synthesis. Circulating lipoprotein and chylomicron-
bound lipids increase following an intake of lipid containing foodstuffs.
Lipoprotein lipase breaks down the triacylglycerol (triglyceride) from these
circulating complexes, releasing non-esterified fatty acids (NEFA) which are taken
up into adipocytes, where they are esterified into triglyceride and stored.
The high energy density of triglyceride (9 kcal/g) means that it is a more
efficient energy store than protein (4 kcal/kg) or carbohydrates (3.75 kcal/kg).
During a period of energy demand which is greater than exogenous supply, the
stored triglyceride is hydrolysed by hormone-sensitive lipase and re-mobilised

51
back into the circulation as NEFA. These opposing actions of lipid storage and
lipolysis are under strict hormonal control.
The hormones adrenaline, adrenocorticotropic hormone (ACTH) and
glucagon promote lipolysis, whereas insulin promotes lipid storage and
esterification. This hormonal profile is ultimately influenced by metabolic need,
metabolic reserves and stress.
Traditionally adipose tissue was considered as being merely the major
storage organ for triglyceride, and little significance was attributed to ectopic lipid
storage in liver or muscle. This has radically changed over the past decade or so.
Adipose tissue has emerged as a major endocrine organ, muscle lipids have
been implicated in insulin resistance and hepatic lipid in altering local and whole-
body metabolic and inflammatory status.
Adipose tissue secretes over 100 differing factors including adipokines,
steroid hormones, fatty acids, and prostaglandins. With the exception of
adiponectin, these factors are all released in greater amounts with increasing
adipose tissue volume. Adiponectin, a key regulatory factor, promotes insulin
sensitivity and β-oxidation.
52
About 20% of the total body weight of a normal young adult constituted by
adipose tissue. There is almost no limit to the extent to which this stroke of adipose
tissue can be increased. Thus in obese individual weighing 140 Kg more than 50%
of the body weight is represented by adipose tissue.
Adipose tissue is found subcutaneously over the entire body in man, with
some extra deposits in the areas of the buttocks and breasts. There are large
deposits of adipose tissue in the mesentery, some around the kidneys and the heart.
In addition to its physiologic role as a stroke of calories, adipose tissue plays a
structural role for example in cushioning of viscera and as an insulating layer
reducing the rates of loss of body heat.
The mature adipose tissue cell (adipocyte) consists of a large structureless
droplet of lipid surrounded by a very thin rim of cytoplasm (27). For many years
adipose tissue was considered to be relatively inert tissue. The mass of the adipose
tissue in sustaining the body during starving is evident even to the casual observer.
2.3.2. LIPID CHEMISTRY
A lipid is a fat like substance that may not actually be related to fatty acids
although occasionally the terms lipids and lipoids are used synonymously. Lipids
are waxy, greasy, and oily compounds of the body. It is hydrophobic in nature. In
the body fat serves as an efficient source of energy, except for the brain. Caloric
53
value of fat is 9KCL/gm. Combination of fat and protein (lipoprotein) are
important cellular constituents. They form important dietary constituents as an
account of their high calorific value and the fat soluble vitamins and the essential
fatty acids contained in them (28 & 29).
2.3.3. CHEMICAL CLASSIFICATION OF PLASMA LIPIDS
Simple lipids
Fatty acids
Steroids
Cholesterol
Steroid hormones
Vitamin D
Carotene
Vitamin A,E,K
Prostaglandins
Complex lipids
Triglyceride
Cholesterol ester
Phospholipids
Sphingolipids
Waxes
2.3.4. FUNCTIONS
In general lipids are important as;
Structure of cell membranes, because lipids are integral part of all cell
membranes.
54
As ready source of energy, because lipids supply over half of the energy
utilized in basal metabolism.
A structure of sex hormones.
Thermal blanket, because their presence in subcutaneous tissue insulates
the body against heat loss.
2.5.5. FATTY ACIDS
They are carboxylic acids obtained from the hydrolysis of mainly glycerol
and cholesterol. They contain on even number of carbon atoms and are straight
chain derivatives. The chain may be saturated (containing no double bonds) or
unsaturated (containing one or more double bonds). The main saturated fatty acids
in the plasma are butyric, caproic, palmitic and stearic acid.
Unsaturated fatty acids are again subdivided into:
Monounsaturated (monoethenoid, monoenoic acids).
Poly unsaturated (Polyethenoid, polyenoic acids).
Eicosinoids: Comprise prostaglandins, leucotriens, prostaglandins and
thrombaxane.

55
Many other fatty acids have been detected in the biologic material Normal
Values: 250-400 mg/dl. Free fatty acids are immediately available energy source
and provides much of the energy requirements of the body (28 & 29).
2.3.5. CHOLESTEROL
It was first described towards the end of 18th century by French chemist De
Fourerol. It is distributed in all cells of the body but particularly in nervous tissue.
Cholesterol is the most important compound of those classed as sterols. It is a
precursor of bile acids, the steroid hormones and Vitamin D. With fatty acids, it
forms waxes. It is a stable white crystalline substance insoluble in water but readily
soluble in chloroform, ether, alcohol, and other fat solvents. The sterol is present in
high amounts in nervous tissue (2%), liver (0.3%), skin (0.3%) and intestine
(0.2%) and certain endocrine glands (27 & 29).
The relative high content of the cholesterol in skin may be related to vitamin
D formation and that in adrenals to steroid hormones synthesis. Much attention
being directed to cholesterol at present time, not only because of its close
relationship to other steroids in the body, but also because cholesterol is involved
in certain degenerative changes in the arterial well known as atherosclerosis.
Normal Values: Range from 160-240 mg/dl.

56
2.3.6. TRIGLYCERIDES (TRIACYLGLYCEROLS)
The triacylglycerols or so called neutral fats, are esters of the alcohol glycerol
and fatty acids. According to the current standardized, terminology of the
International Union of Pure and Applied Chemistry (IPAUC) and the International
Union of Biochemistry (IUB), the monoglycerides, diglycerides and triglycetides
are to be designated monoacyl, diacyl and triacylglycerols respectively.
On hydrolysis triglycerides may yield 3 molecules of fatty acid, and 1
molecule of glycerol when it is boiled with an alkali such as NAOH or KOH. Then
glycerol and Na and K salt of fatty acids (soap) are formed (27 & 29). Aggregates
of triglycerides (80%), phospholipids (7%) and cholesterol (9%) are coated with
lipoproteins to produce particles called chylomicrons.
Normal values: 40-150 mg%.
2.3.7. PHOSPHOLIPIDS
Phospholipids are complex lipids, resembling triglycerides, but containing
phosphate and a nitrogenous base. The major phospholipids in plasma are lecithin
and sphingomyelin. The phosphate and nitrogenous base are water-soluble. Lipids
are carried in the plasma in the form of lipoprotein complexes. These complexes of

57
lipid and protein impart solubility to the otherwise insoluble lipids, and all lipids
enter and travel through the blood stream as lipid-protein complexes.
2.3.8. STRUCTURE OF A LIPOPROTEIN PARTICLE
The lipoproteins are globular particles of high molecular weight that
transports non-polar lipids through the plasma. Each lipoprotein particle contains a
hydrophobic core of triglyceride and cholesterol ester, surrounded by a coat
containing polar phospholipids, free cholesterol and apoproteins 8 that stabilize the
lipoprotein particle so that it can remain in solution form in the plasma. The
apoprotein decides the role of a lipoprotein like binding to specific enzyme or onto
cell membrane, thus directing the lipoprotein to the site of metabolism.
Schulz (1897) and Machebouf (1929) suspected the role of lipid protein
complexes in maintaining the lipids in solution in plasma. Application of new
physical methods for protein separation including electrophoresis and
centrifugation expedited progress in lipoprotein chemistry. Tiselius et al in 1941
reported the existence of two lipoprotein classes, seperable by moving boundary
electrophoresis. These were alpha and beta lipoproteins. After another decade pre
betalipoprotein was identified by zonal electrophoresis.

58
2.3.9. MAJOR CLASSES OF APOLIPOPROTEINS
Apolipoprotein A (A I,A II)
Apolipoprotein B(B48,B100)
Apolipoprotein C(CII,III,IV)
Apolipoprotein E(E2,E3,E4)
Apoproteins provide structural stability to lipoproteins (30) such as
solubilizing lipids, activating enzymes, and initiating receptor mediated clearance
of lipoproteins.
Table. 1. Major Classes of Lipoproteins
Measurement of apoprotein A levels may predict patients with increased risk
of coronary artery disease better than HDL levels. Research has shown that

59
apolipoprotein A appears to be an independent risk factor in the development of
cardiovascular disease.
There are two major proteins in the apoprotein B family. The smaller one is
apoprotein B-48 which is the major structural protein of chylomicrons and is
responsible for the secretion of the same (30). The larger form is apoprotein B-100,
the major structural protein of VLDL (31) and LDL. It is essential for the secretion
of VLDL from liver and as a ligand for removal of LDL by LDL receptor. It may
be elevated in some patients with coronary heart disease and normal cholesterol
levels.
Apoprotein C is found in all lipoproteins. They regulate the activity of
lipoprotien lipase and inhibit removal of chylomicrons and VLDL by liver.
Apoprotein C2 activates the enzyme. Its absence prevents normal lipolysis and
causes hypertriglyceridemia. Apoprotein C3 retards catabolism of VLDL and
chylomicrons (30).
Apolipoprotein E also is present in VLDL and chylomicrons. They are
required for normal catabolism of remnants by a specific receptor on the liver that
recognizes Apoprotein E. There are three forms of apoprotein E1, E2, E3, E4 (30).

60
2.3.10. NORMAL LIPOPROTEIN METABOLISM
Chylomicrons are formed from dietary fats and cholesterol absorbed in the
intestine. They are secreted into the lymph, pass through the thoracic duct and
eventually enter the systemic circulation. As chylomicrons enter capillaries, they
come into contact with an enzyme, lipoprotein lipase, located on the surface of
endothelial cells particularly in adipose tissue and muscle. Lipoprotein lipase needs
insulin for maintenance of adequate tissue levels. The interaction of chylomicrons
and lipoprotein lipase results in hydrolysis of triglyceride to fatty acids and
glycerol.
Fig.18. Cholesterol – Carrying Lipoproteines
61
2.3.11. OVERVIEW OF HEPATIC FATTY ACID METABOLISM IN
HEALTH
The liver is the key organ in determining the metabolism and distribution of
fatty acids. It is the source of endogenous synthesis and degrades or interconverts
exogenous fatty acids. The resultant fatty acids may either be stored in the liver
itself, or exported to adipose tissue and muscle. Hepatic fatty acid metabolism is
dynamic with triglyceride turnover occurring every 2 days.
Circulating fatty acids are either bound to lipoproteins or albumin.
Lipoprotein-bound lipids, which include chylomicron complexes, are internalised
into cells following the formation of a specific apolipoprotein-receptor complex.
Dietary medium-chain triglycerides enter the portal circulation directly, whereas
longer chain fatty acids enter the vascular circulation complexed with
chylomicrons via the lymphatic system and the thoracic duct.
Historically it was believed that in contrast to lipid-lipoprotein complexes,
the albumin bound NEFAs are internalised into cells via simple and direct
penetration of the plasma membrane. The recently discovered cluster
differentiation protein 36 (CD 36) forms a pathway for hepatic fatty acid uptake
which is upregulated by insulin and experimental models of NAFLD (Ge, Zhou et
al. 2010; Larter, Chitturi et al. 2010). As a result NEFAs are the key fatty acid
62
source for the liver with an uptake that is directly proportional to its delivery rate
(Havel, Kane et al. 1970) and potentially increased by insulin resistance and
NAFLD. The concentration of circulating NEFAs is dependent on their release
from adipocytes and myocytes. This is regulated by hormone sensitive lipase, 20
which is stimulated by adrenaline, and inhibited by insulin (Qureshi and Abrams
2007).
Insulin also acts to reduce circulating glucose concentrations by promoting
its tissue uptake. Insulin resistance however results in increased circulating
concentrations of insulin, and the principal hepatic fatty acid substrates, namely
glucose and NEFA. As a result insulin resistance promotes hepatic lipogenesis as
will be further discussed later. Intra-hepatic fatty acids are cytotoxic (Gibbons,
Wiggins et al. 2004) and so are further metabolised by three potential and separate
processes: either beta-oxidation, VLDL synthesis or intra-hepatic storage as
triglycerides. In the presence of high energy demand, intra-hepatic fatty acids
undergo oxidation to generate energy in the form of ATP. If there is a low energy
demand then intra-hepatic fatty acids are esterified into triglycerides and either
stored in the hepatocyte or exported as VLDL.

63
2.3.11.1. OXIDATION
Within the mitochondria fatty acids in the form of acyl-CoA molecules are
progressively cleaved by β-oxidation to generate ATP. The process is initiated at
the carboxyl end and involves the successive disruption of the link between the α-2
and β-3 carbon atoms (Lavoie and Gauthier 2006). At the end of each cycle the
chain is reduced by two carbon atoms, and one molecule of FADH2, NADH and
acetyl CoA is produced. The acetyl-CoA is then further oxidised within the
mitochondria via the citric acid cycle, while the FADH2 and NADH enter the
electron-transport chain. The process is repeated until the whole chain is oxidised.
Microsomal (α and ω) oxidation occurs within the endoplasmic reticulum by
members of the cytochrome P450 family. They catalyse the oxidation of a variety
of exogenous and endogenous compounds and play a relatively minor role in fatty
acid oxidation.
2.3.11.2. VLDL SYNTHESIS
The addition of a single glycerol molecule to three fatty acids forms a
triglyceride. Triglycerides cannot freely cross hepatocyte membranes, and so are
either stored within the hepatocyte itself, or are coated in lipoproteins, incorporated
within VLDL, and exported into the systemic circulation. VLDLs are formed
within the liver and are a complex fusion of lipoproteins (predominantly 21

64
Apolipoprotein B-100), lipids and phospholipids. VLDL secretion facilitates the
transfer of intra-hepatic fatty acids to peripheral adipose stores (Gibbons, Wiggins
et al. 2004).
2.3.11.3. STORAGE WITHIN THE HEPATOCYTES
The final option for fatty acids is of conversion to triglycerides and storage
within the hepatic cytosol. Factors that directly promote hepatic triglyceride
storage are poorly understood.
Intra-hepatic storage appears to occur when fatty acid production exceeds the
liver’s oxidation or exportation abilities.
Apoprotein C II and insulin are activators of this enzyme and apoprotein C III is
an inhibitor. After lipolysis is complete, a chylomicron remnant is released back
into the circulation and is cleared rapidly by the liver, by a specific receptor
mediated interaction which involves recognition of apoprotein E. The major
component of the newly secreted chylomicrons are apoproteins B 48 and AI. In the
lymphatics, the chylomicrons acquire apoproteins C and E mainly from HDL
particles. VLDL is synthesized endogenously by the liver. The core lipid is
triglyceride, and 20 % is cholesterol.

65
The major apoprotein is apoprotein B 100. But apoprotein C and E are also
present. Normally after overnight fast, chylomicrons are cleared from the plasma
and triglyceride circulates as VLDL. The metabolsim of VLDL is similar to
chylomicrons, VLDL transports triglycerides to tissues to be used as fuel, or to the
adipose tissue for storage. After interaction with lipoprotein lipase, a VLDL
remnant is produced which is converted to LDL or removed by the liver via a
specific receptor interaction involving apoprotein E.
HDL is important for removal of cholesterol from the peripheral tissues to the
liver and for metabolism of chylomicrons and VLDL. The liver and intestine
secrete nascent HDL particles, which take up cholesterol from chylomicrons and
VLDL to become HDL3.
After esterification of plasma HDL cholesterol by enzyme LCAT lecithin
cholesterol acyl transferase, further uptake of cholesterol transforms HDL3 to
HDL2. HDL2 can transfer cholesterol to VLDL to be taken up by the liver, or
deliver cholesterol directly to liver after conversion to HDL3 by hepatic
triglyceride lipase.

66
2.3.11.4. LIPID TRANSPORT
2.3.11.4.1. THE EXOGENOUS PATHWAY
The dietary triglycerides and cholesterol are incorporated into large
lipoprotein complexes called chylomicrons within the intestinal epithelial cells.
The chylomicrons are secreted into the intestinal lymph and pass into general
circulation for transport to the capillaries of adipose tissue and skeletal muscle
where they adhere to the binding sites on capillary walls, while bound to these
endothelial surfaces the chylomicrons are exposed to the enzyme lipoprotein
lipase. Also the chylomicrons contain an apoprotein, apoprotein C-11 activates
lipase liberating free fatty acids (FFA) and monoglycerides.
Through the endothelial cells there fatty acids enter the underlying
adipocytes or muscle cells, where they are either reesterified to triglycerides or
oxidized (27 & 29). The rest of the chylomicron dissociates from the capillary
endothelium and reenters the circulation.

67
Fig.19. Mechanisms of VLDL
It will now form a compound relatively poor in triglycerides and enriched in
cholesteryl esters. Ultimately chylomicron is converted into a chylomicron
remnant particle which is transported and taken up by the liver, this is mediated by
binding of apoprotein E to specific receptors called chylomicron remnant
receptors. The surface bound remnant particles are taken into the cell and
degraded. The overall result of chylomicron process is to delivery dietary
triglycerides to adipose tissue and cholesterol to the liver. In the liver some of
cholesterol gets converted to bile acids, which are excreted into the intestine to acts
as detergents and facilitates absorption of dietary fat.
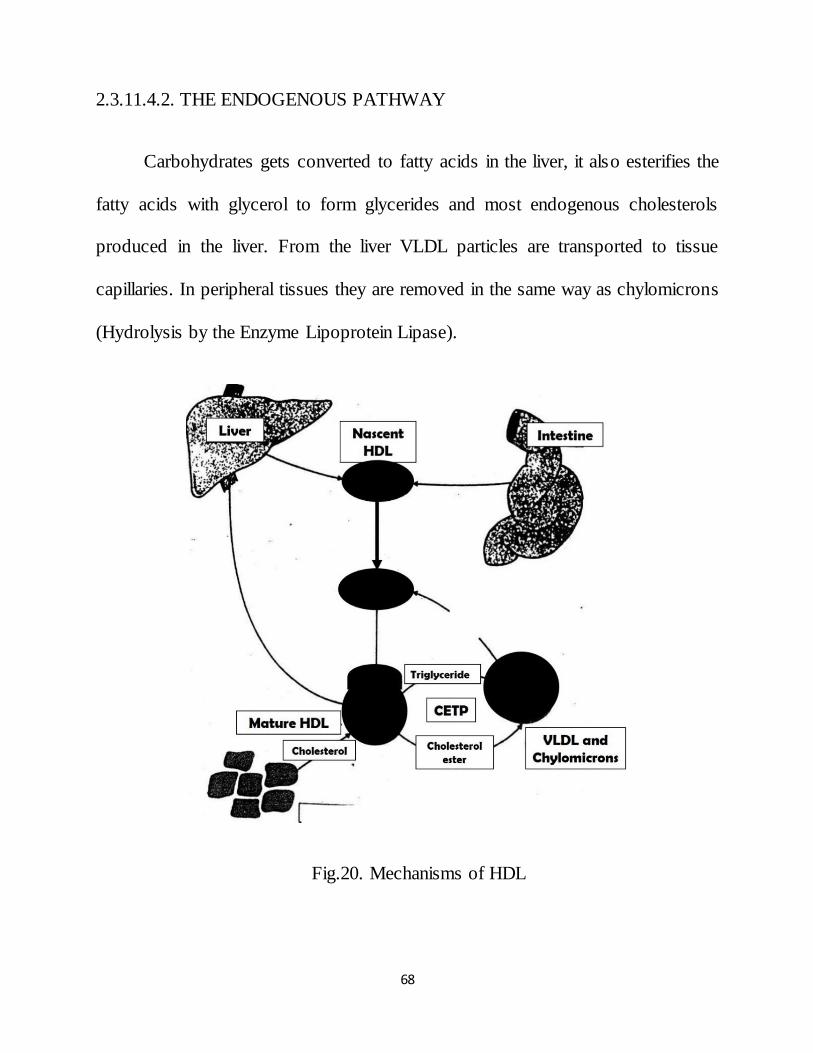
68
2.3.11.4.2. THE ENDOGENOUS PATHWAY
Carbohydrates gets converted to fatty acids in the liver, it also esterifies the
fatty acids with glycerol to form glycerides and most endogenous cholesterols
produced in the liver. From the liver VLDL particles are transported to tissue
capillaries. In peripheral tissues they are removed in the same way as chylomicrons
(Hydrolysis by the Enzyme Lipoprotein Lipase).
Fig.20. Mechanisms of HDL

69
The remnants generated from the action of lipoprotein lipase on VLDL are
designated as intermediate density lipoprotein. Through LDL receptors a portion of
LDL particle is catabolized by the liver the remaining LDL remain in plasma.
Ultimately transformation of LDL particle to cholesterol rich LDL (28 & 29).
The function of LDL is to supply cholesterol to a variety of extra hepatic
parenchymal cells such as adrenal cortical cells, lymphocytes, muscles cells and
renal cells. These cells have LDL receptors localized on the cell surface. The
molecule is bound and enters the cells where the cholesterol is used, released and
become available to the cell for membrane synthesis (29).
Fig.21. Lipoprotein Metabolism

70
This bindings and uptake of LDL suppresses endogenous synthesis. When
the membranes of parenchymal and Scavenger cells undergo turnover and the cells
die and removed, unesterified cholesterol is released into plasma where it binds,
initially to HDL (catalyze by the plasma enzyme LCAT), transferred to VLDL and
eventually appear in LDL.
This establishes a cycle by which LDL delivers cholesterol to extra hepatic
cells and by which cholesterol is returned to LDL from extrahepatic cells via HDL.
Most of the cholesterol released from extrahepatic tissue is transported to the liver
for excretion in the bile.
The liver plays an essential role in lipid metabolism, several stages of lipid
synthesis and transportation (32, 33 & 34). Alcohol consumption cause fatty liver,
alcoholic hepatitis and ultimately, alcoholic cirrhosis in some patients
(35, 36 & 37).
The liver plays a key role in the metabolism of plasma lipids and
lipoproteins (38). Most of the endogenous cholesterol is synthesized in the hepatic
microsomes, synthesis and metabolism of cholesterol is impaired in chronic liver
disease resulting in a decrease in plasma levels (39).

71
Severe metabolic impairment in cirrhosis can produce a worsening of the
serum lipoprotein pattern. High‑density lipoprotein (HDL) cholesterol and its
major apolipoproteins have been shown to be reduced in cirrhosis, as also the
serum levels of low‑density lipoprotein (LDL) cholesterol (39).

72
III. MATERIALS AND METHODS
3.1. STUDY DESIGN
This study is a single center non randomized prospective study meant to
study lipid profile changes in patients with cirrhosis of liver.
3.2. STUDY PERIOD
Consecutive patients of cirrhosis admitted in Thanjavur medical college
hospital during the period of January 2014 to august 2014 were taken up for the
study.
3.3. STUDY CENTRE
This study was carried out in department of medicine Thanjavur medical
college hospital, Thanjavur, Tamil nadu India. All cases were admitted and
examine in details in the ward & clinical data was recorded in the profoma
annexed herein.
3.4. CLINICAL DETAILS
Personal particular like age, sex details were obtained. Extensive history will
be taken to rule out various other conditions which can lead to decrease in lipid

73
profile. Detailed past history were elicited and evidence of hepatic enchalopathy,
hepatorenal syndrome and other major complication were notedand previous
hospitalization were noted.
3.5. INCLUSION CRITERIA
Age more than 18 years
Known and established cases of Cirrhosis of liver by ultrasound abdomen
and biochemical studies.
3.6. EXCLUSION CRITERIA
Patients who had used Insulin or other Oral Hypoglycaemic drugs within
previous 30 days.
Patients who had used cholesterol lowering drugs within previous 30
days.
Patients with other disease likely to decrease the lipid levels like Diabetes
Mellitus, Hypertension, chronic smokers were excluded.
3.7. CLINICAL EXAMINATION
Clinical examination was done in a detailed manner and vital signs were
recorded and systemic examination was carried out acites, slenomegaly and all
other important were noted and recorded.

74
3.8. LIST OF INVESTIGATIONS DONE
Total Leukocyte Count
Differential Leukocyte Count
Hemoglobin
ESR
Fasting Lipid Profile (Total cholesterol, Triglycerides, HDL, LDL)
Random Blood Sugar
Blood Urea
Serum Creatinine
LFT
PT
INR
UGI scopy
USG abdomen
3.9. LIPID PROFILE
Blood sample was collected in all patients who was in fasting state.

75
DATA AND STATISTICAL ANALYSIS (ANOVA)
The patient data was collected prospectively and entered into the profoma
(Annexure) the data was digitalized in Microsoft excel software and statistical
analysis it was done SPSS 20 software. The categorical variable have been
described as proportion and percentage. The continuous variable have been
expressed as mean and standard Deviation as well as range.
The effect of various future on lipid profile changes was analyzed by
unpaired T- test (Difference between mean) for complications. Chi squire test have
been used to compare the categorical data P-value < 0.05 was considered
significant in the study.

76
IV. RESULTS AND ANALYSIS
This study was conducted 50 consecutive patients, with cirrhosis of liver got
admitted in Thanjavur medical college Hospital studied over a period of eight
month from January 2014 to Augusts 2014. This study to determine the levels of
Total cholesterol, HDL, LDL and Triglycerides in cirrhotic patients. Extensive
history was taken to rule out various other conditions which can lead to decrease in
lipid profile.
Blood routine investigations such as hemoglobin, total leukocyte count,
differential leukocyte count, ESR, Random blood sugar, Lipid profile and renal
function tests LFT, PT, INR and UGI scopy will be done in order to rule out
various other conditions which can lead to alter the lipid profile. The Lipid profile
of patients LFT, PT, INR and UGI scopy and clinical complication were computed
and analyzed.
4.1. AGE DISTRIBUTION
In our study of 50 patients below 40 were 32% of the total and above 40
years of age were 68 %. Among this 68 % maximum were in age group of 41 to 50
years of age which is 36% of total study group.

77
4.2. SEX AND ALCOHOLISM DISTRIBUTION
All the patients enrolled in our study were males. Among them 94 % were
alcoholics. 6% were nonalcoholic.
4.3. LIPID PROFILE IN CIRRHOTIC PATIENTS IN GENERAL
Among total of 50 patients of the patients 46% had total cholesterol
below 140 and 54% of the patients had total cholesterol above 140.
Among total of 50 patients 70 patients had HDL below 40 and 30% of
the patients had above 40.
Among total of 50 patients, 48%of the patients had LDL below 80 and
52% of the patients had above 80.
Among total of 50 patients, 64% patients had below 150 and 36% of the
patients had above 150.
4.4. CIRRHOTIC PATIENTS WITH ACSITIES OR SPLENOMEGALY
Among total of 50 patients, 82 % patients were with ascites and 18 %
without ascites.
Among total of 50 patients, 88% patients were with splenomegaly and 12
% without splenomegaly.

78
4.5. LIPID PROFILE VARIATION IN CIRRHOTIC PATIENTS WITH
VARIOUS PRESENTATIONS.
LIPID PROFILE IN PATIENTS WITH HISTORY OF HEPATIC
ENCEPHALOPATHY (Previously Treated and Recovered)
The difference in mean of total cholesterol, HDL, LDL. TG among
two groups ie. Patients with history of encephalopathy (44%) and those
without encephalopathy (54%) were not statistically significant with
P value > 0.05.
LIPID PROFILE IN PATIENTS WITH HISTORY OF HEPATO
RENAL SYNDROME
The difference in mean of total cholesterol, HDL, LDL. TG among
two groups ie patients with history of hepatorenal syndrome (36% of the
total) and those without hepatorenal syndrome (64%) were statistically
significant with P value < 0.05.
LIPID PROFILE IN PATIENTS WITH LOW AND NORMAL SERUM
ALBUMIN
The difference in mean of total cholesterol, HDL, LDL. TG among
two groups ie patients with low serum albumin (72%) and those with normal
serum albumin (28%) were statistically significant with P value < 0.05.

79
LIPID PROFILE IN PATIENTS WITH VARICES AND WITHOUT
VARICES IN UGI SCOPY.
The difference in mean of total cholesterol, HDL, LDL. TG among two
groups ie patients with varices (68%) and those without varices (32%) were not
statistically significant with P value > 0.05.
In our study of 50 patients patients below 40 were 32% of the total and
above 40 years of age were 68 %. Among this 68 % maximum were in age group
of 41 to 50 years of age which is 36% of total study group.
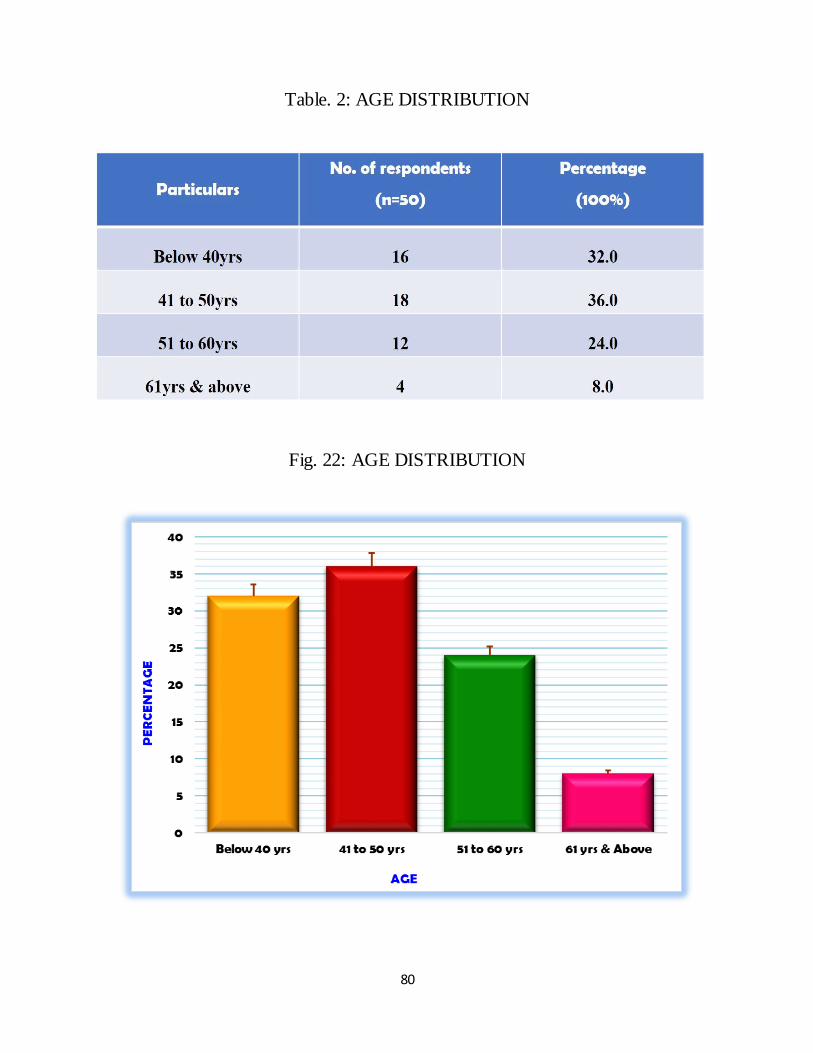
80
Table. 2: AGE DISTRIBUTION
Fig. 22: AGE DISTRIBUTION

81
Table. 3: SEX DISTRIBUTION
Fig. 23: SEX DISTRIBUTION
All the patients enrolled in our study were males. Among them 94 % were
alcoholics. 6% were nonalcoholic.
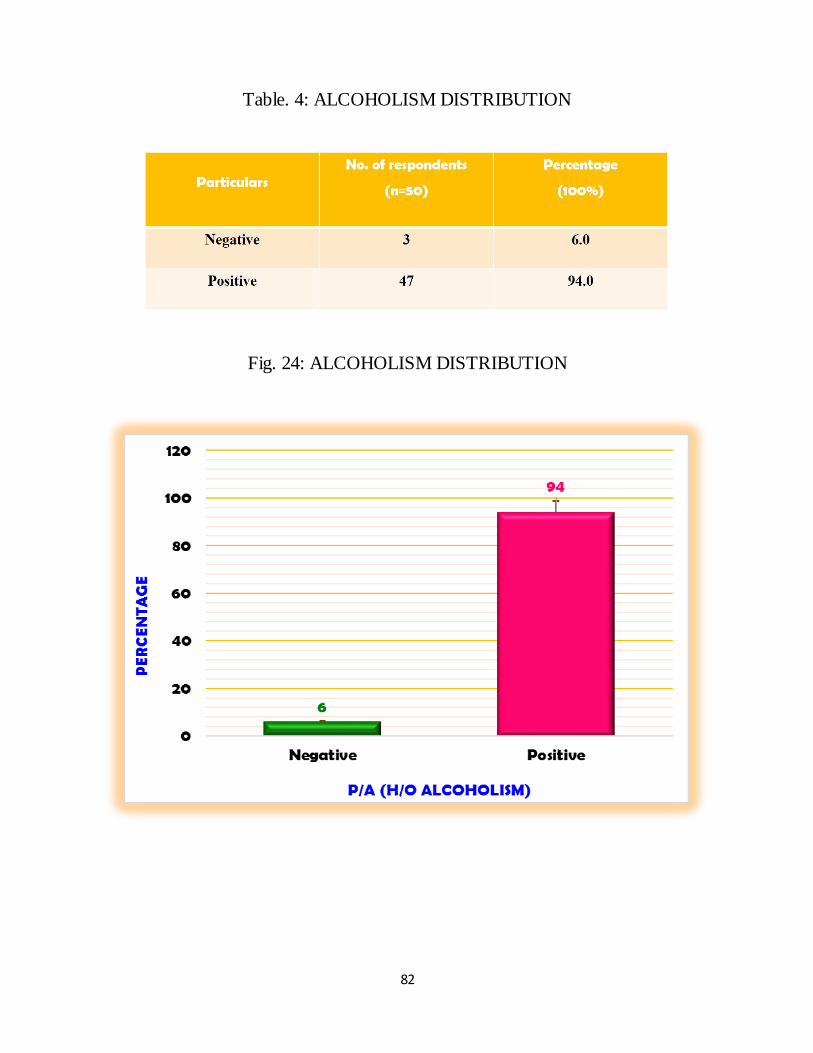
82
Table. 4: ALCOHOLISM DISTRIBUTION
Fig. 24: ALCOHOLISM DISTRIBUTION
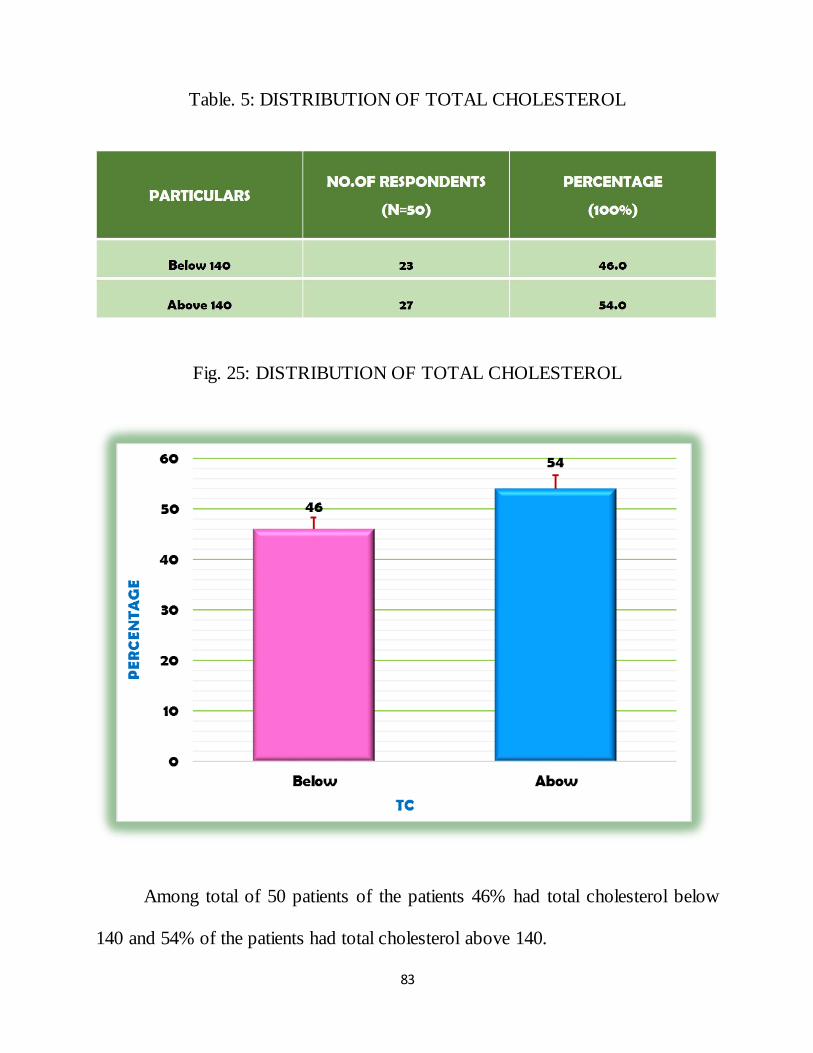
83
Table. 5: DISTRIBUTION OF TOTAL CHOLESTEROL
Fig. 25: DISTRIBUTION OF TOTAL CHOLESTEROL
Among total of 50 patients of the patients 46% had total cholesterol below
140 and 54% of the patients had total cholesterol above 140.
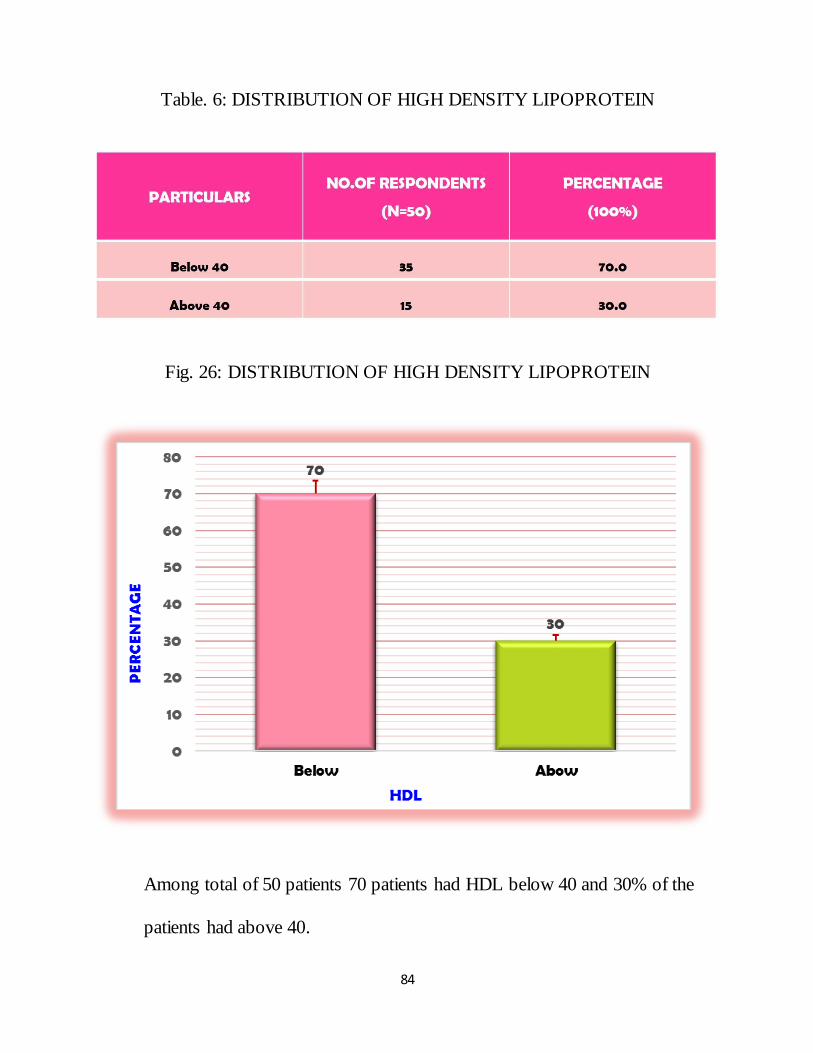
84
Table. 6: DISTRIBUTION OF HIGH DENSITY LIPOPROTEIN
Fig. 26: DISTRIBUTION OF HIGH DENSITY LIPOPROTEIN
Among total of 50 patients 70 patients had HDL below 40 and 30% of the
patients had above 40.
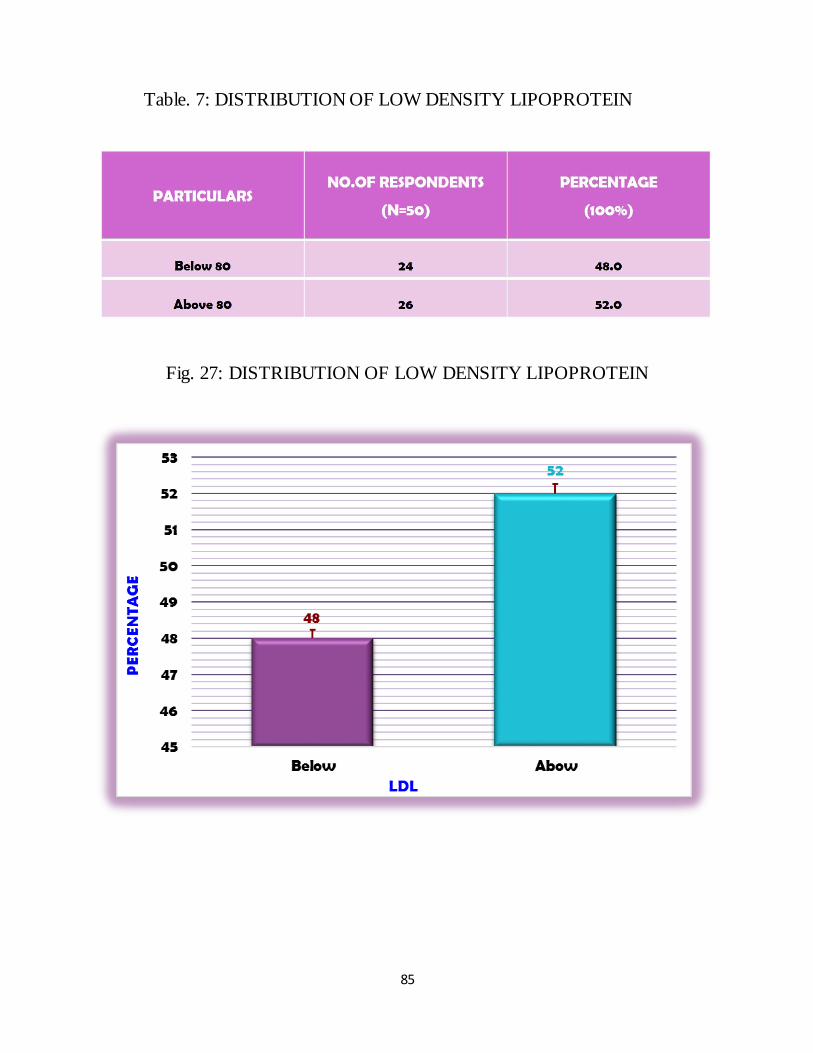
85
Table. 7: DISTRIBUTION OF LOW DENSITY LIPOPROTEIN
Fig. 27: DISTRIBUTION OF LOW DENSITY LIPOPROTEIN

86
Table. 8: DISTRIBUTION OF TRIGLYCERIDE
Fig. 28: DISTRIBUTION OF TRIGLYCERIDE
Among total of 50 patients, 64% patients had below 150 and 36% of the
patients had above 150.
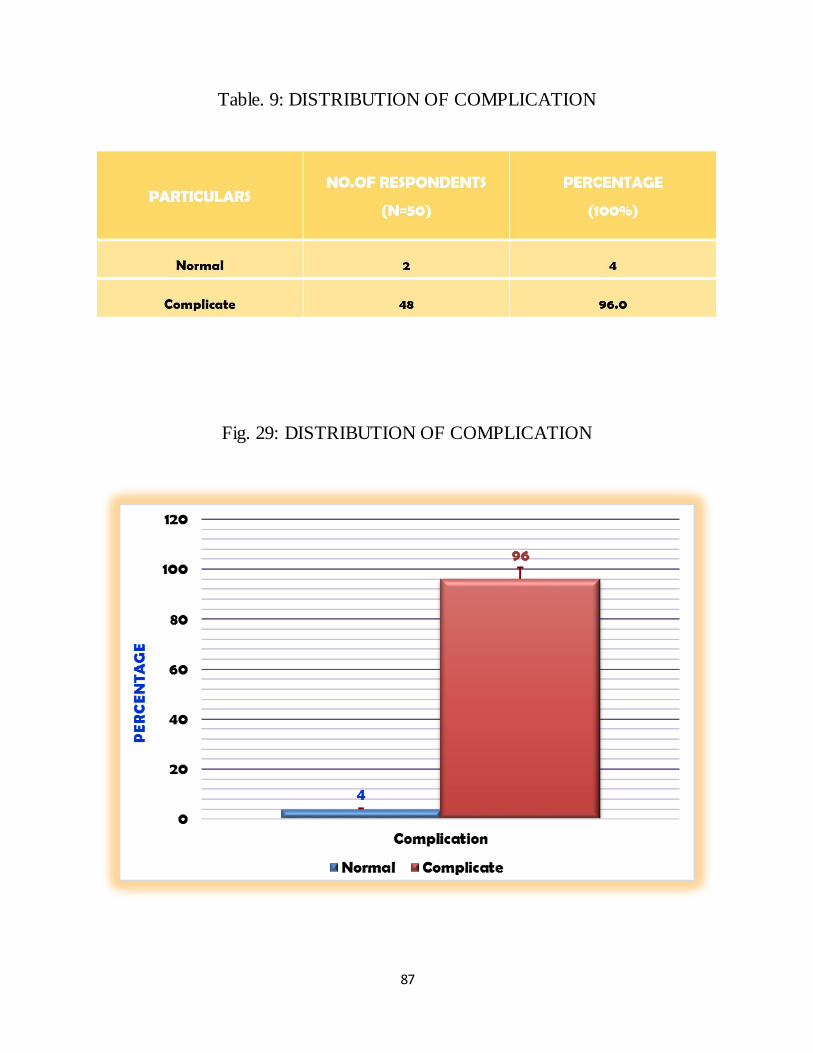
87
Table. 9: DISTRIBUTION OF COMPLICATION
Fig. 29: DISTRIBUTION OF COMPLICATION

88
Table. 10: COMPLICATION CORRELATED TO LIPIDS DISTRIBUTION
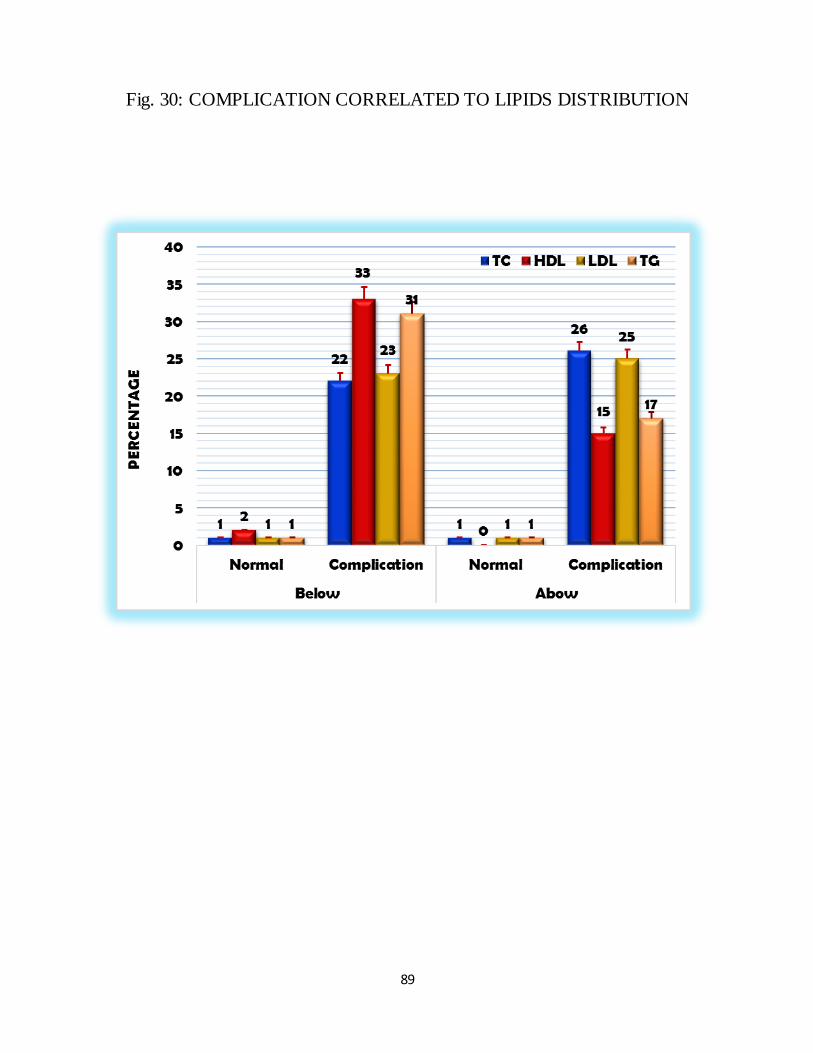
89
Fig. 30: COMPLICATION CORRELATED TO LIPIDS DISTRIBUTION

90
Table. 11: EVIDENCE OF HEPATIC ENECEPHALOTHY
Fig. 31: EVIDENCE OF HEPATIC ENECEPHALOTHY

91
Table. 12: EVIDENCE OF HEPATO RENAL SYNDROME
Fig. 32: EVIDENCE OF HEPATO RENAL SYNDROME
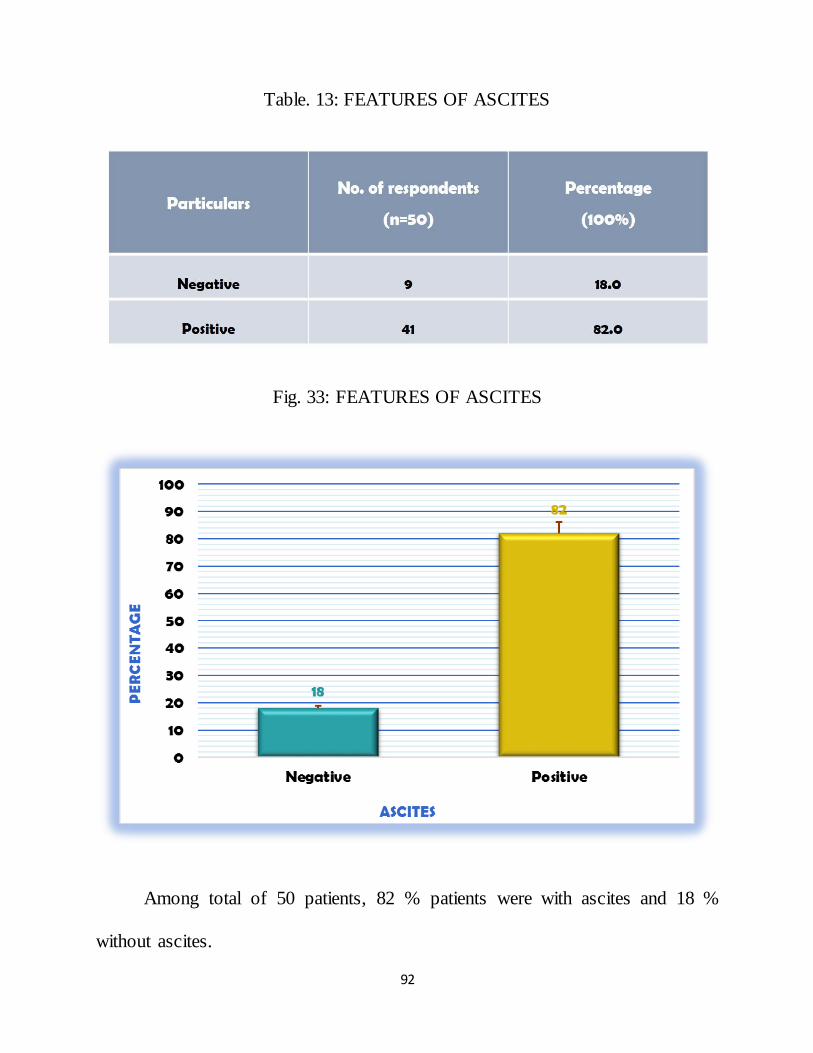
92
Table. 13: FEATURES OF ASCITES
Fig. 33: FEATURES OF ASCITES
Among total of 50 patients, 82 % patients were with ascites and 18 %
without ascites.

93
Table. 14: EVIDENCE OF SPLENOMEGALY
Fig. 34: EVIDENCE OF SPLENOMEGALY
Among total of 50 patients, 88% patients were with splenomegaly and 12 %
without splenomegaly.

94
Table. 15: DISTRIBUTION OF SERUM ALBUMINE
Fig. 35: DISTRIBUTION OF SERUM ALBUMINE

95
Table. 16: EVIDENCE OF VARIES IN UGI SCOPY
Fig. 36: EVIDENCE OF VARIES IN UGI SCOPY
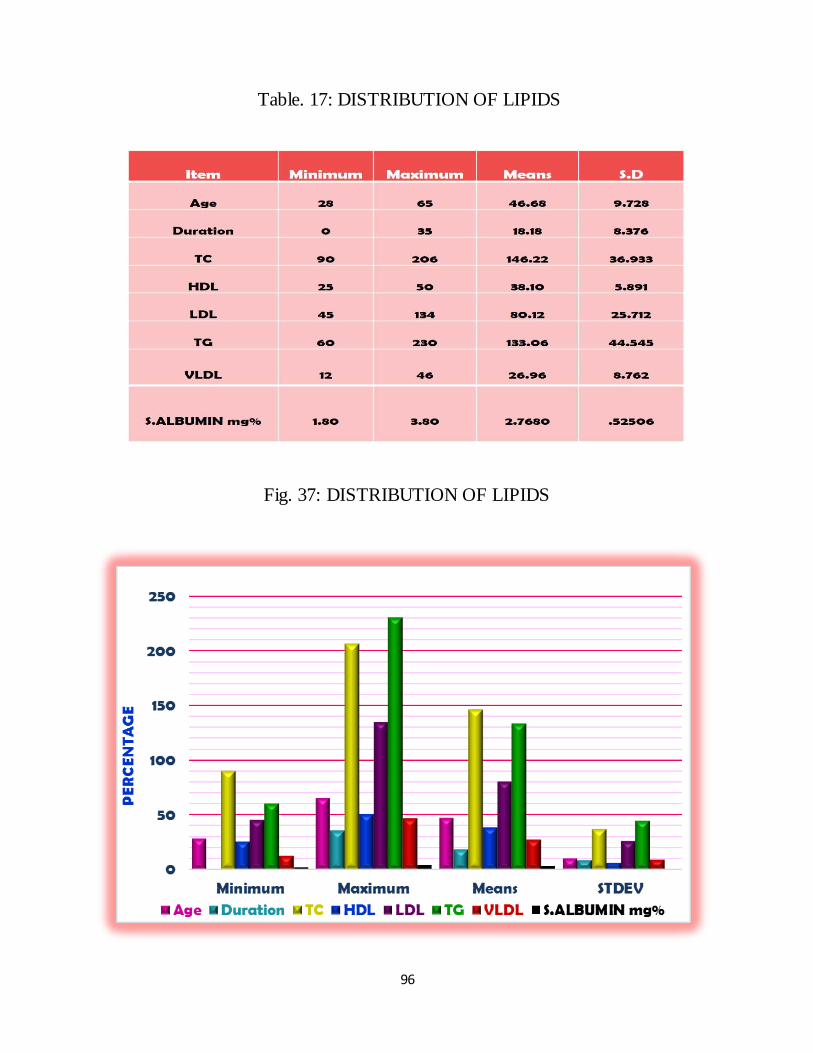
96
Table. 17: DISTRIBUTION OF LIPIDS
Fig. 37: DISTRIBUTION OF LIPIDS
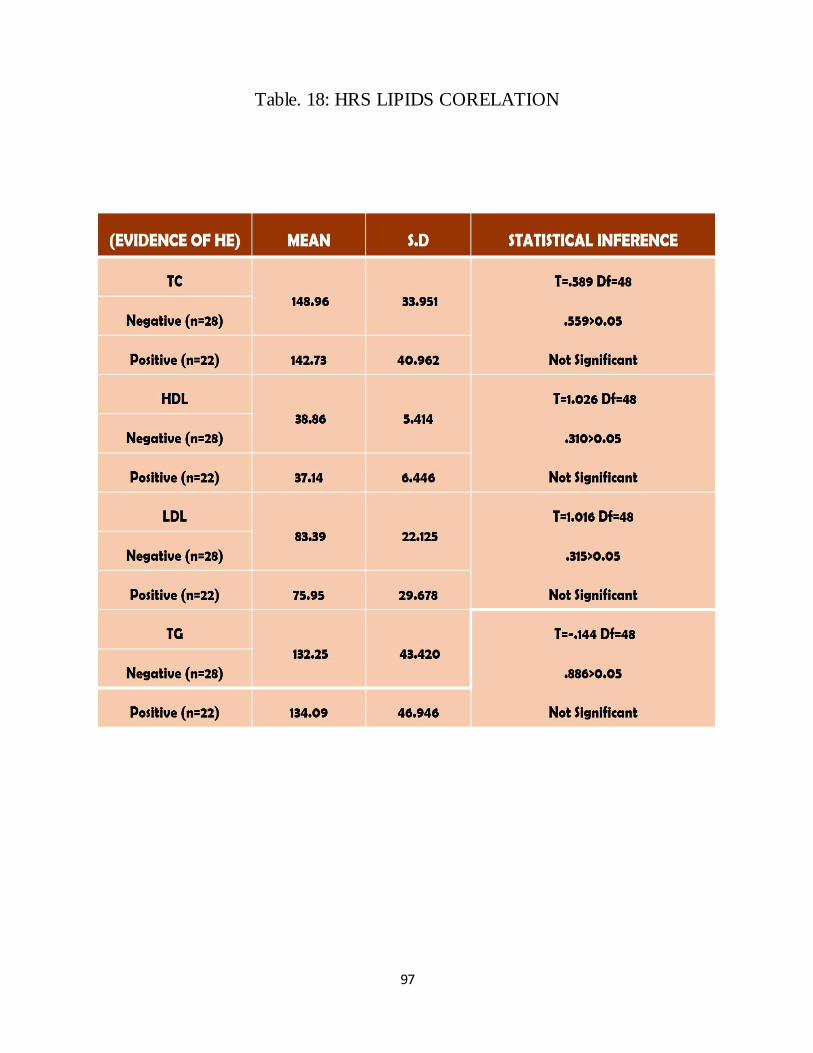
97
Table. 18: HRS LIPIDS CORELATION

98
Fig. 38: HRS LIPIDS CORELATION

99
Table. 19: LIPIDS DISTRIBUTION IN HRS
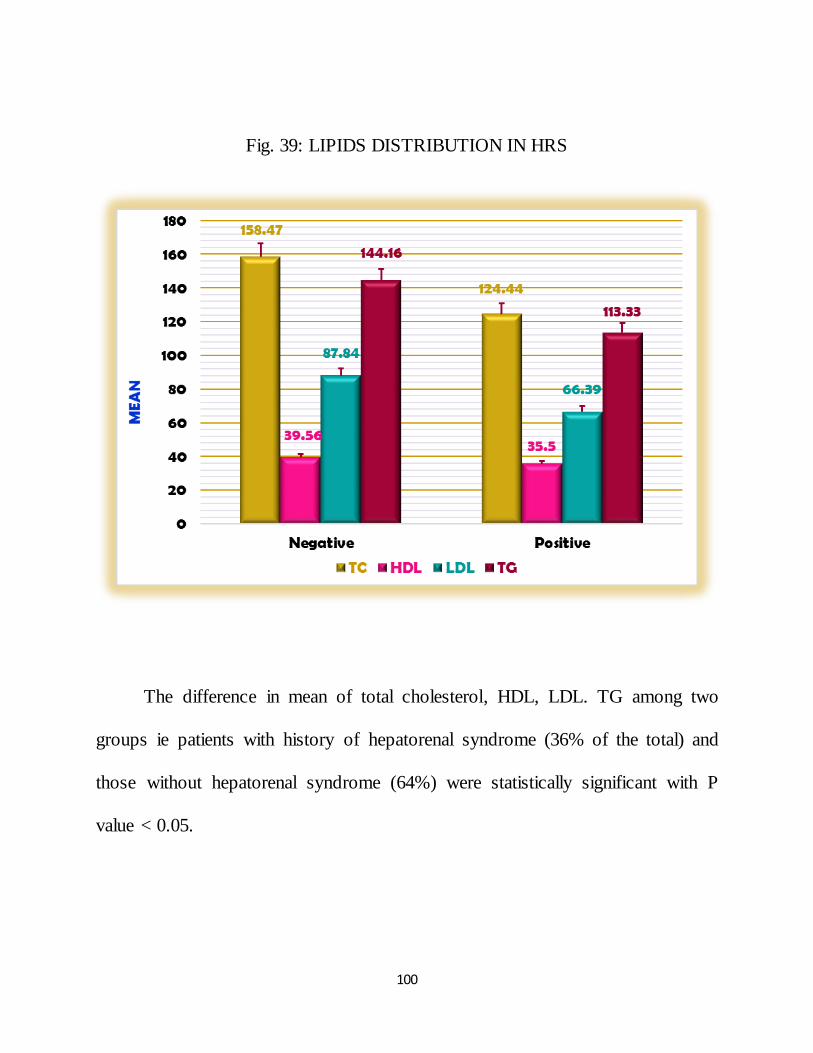
100
Fig. 39: LIPIDS DISTRIBUTION IN HRS
The difference in mean of total cholesterol, HDL, LDL. TG among two
groups ie patients with history of hepatorenal syndrome (36% of the total) and
those without hepatorenal syndrome (64%) were statistically significant with P
value < 0.05.

101
Table. 20: SERUM ALBUMINE IN LIPIDS DISTRIBUTION

102
Fig. 40: SERUM ALBUMINE IN LIPIDS DISTRIBUTION
The difference in mean of total cholesterol, HDL, LDL. TG among two
groups ie patients with low serum albumin (72%) and those with normal serum
albumin (28%) were statistically not significant with P value > 0.05.

103
Table. 21: VARIES IN UGI SCOPY OF DISTRIBUTION

104
Fig. 41: VARIES IN UGI SCOPY OF DISTRIBUTION
The difference in mean of total cholesterol, HDL, LDL. TG among two
groups ie patients with varices (68%) and those without varices (32%) were not
statistically significant with P value > 0.05.
105
DISCUSSION
Lipids are the important components of cellular function and also
homeostasis. Liver play a very essential role in lipid metabolism and various stages
of lipid synthesis and transportation. Therefore we expect an abnormal lipid profile
in those with cirrhosis. There is reduced level of serum cholesterol triglyceride,
high density lipoprotein and low density lipoprotein in patient with chronic liver
dysfunction because of reduction of lipoprotein biosynthesis (45).
In our study 50 cirrhotic patient included among this 36% were 41 to 50
years of age group others are evenly distributed. In Nigerian medical journal shows
the same result and international monthly journal in the field of hepatology also the
same result that alcoholic cirrhosis is involved 41 to 50 years of age.
In our study group 94% of population gave the history of alcohol
consumption. Nigerian medical journal January February 2013 shows the similar
results in that all cases were male, except one. They observed that majority of the
cases (51%) had consumed alcohol regularly for a period of 5‑10 years, followed
by 22% cases having consumed alcohol for 10‑15 years (41).

106
We noted that total cholesterol below the normal level in 46% of the patients
included in our study group. High density lipoprotein were low in 70% of the study
group, low density lipoprotein was low in 48% and 64% have low triglyceride
level in our study group.
Various study gave the similar result in Nigerian medical journal January
February 2013 shows the median total cholesterol and HDL cholesterol were
significantly low compared with controls groups and LDL cholesterol low level but
statistically not significant.
The international monthly journal in the field of hepatology December 2010
shows there was a significant decrease in serum triglyceride, total, HDL and LDL
cholesterol levels also the low level in patient with cirrhosis is inversely related
with the severity of the cirrhosis (40).
Journal of the Arab society for medical research 2012 the triglyceride, total,
HDL and LDL cholesterol is impaired in cirrhotic patient irrespective of the
incidence of hepatocellular carcinoma in those patients.
The total and LDL cholesterol, triglyceride level was inversely related to the
severity of cirrhosis without HCC. In cirrhosis associated with hepato cellular
carcinoma HDL cholesterol have an inverse correlation to the severity of the
disease.

107
In our study population 50 patients with cirrhosis 48 patients have various
complications like acites, splenomagly, hapatic in encephalopathy, hepato renal
syndrome varices about 98% of the total populations.
We stratified the data with respect to Total cholesterol, Triglycerides, HDL,
LDL although we stood the statistical analysis to find that whether theirs any
significant correlation between the lipids abnormality and complication of
cirrhosis.
It failed to show any significant association with lipids profile abnormality
with various complication of cirrhosis of liver.
Though our study report shows that cirrhosis is associated with low
cholesterol levels, we proceeded to correlate the two major complications
including Hepatorenal syndrome and hepatic encephalopathy. HRS is found to
have statistically significant correlation with the low lipid levels. But there was no
association with hepatic encephalopathy.
Investigation like serum albumin and varices in UGI scopy result were
found to be not statistically significant.

108
However the result of the study serve as a baseline for further study in lipid
profile changes in cirrhosis. Further study in this field warranted. In future it may
provide valid relation between cirrhosis severity and lipid profile changes.

CONCLUSION
This study was carried out in 50 patients of cirrhosis and we arrived at the
following conclusions.
46% of patients shows significant reduction in total cholesterol.
Among them 70% of them had High Density Lipoproteins cholesterol
reduction.
The Low Density Lipoproteins was reduced in 48% of the study population.
Triglyceride also shows the similar trend in reduction almost 64 % had the
low level.
Various complication of cirrhosis failed to shows any significant association
with low lipid profile but the hepato renal syndrome shows the significant
correlation with the low lipids level.
In our study there is no correlation between the severity of the cirrhosis of
liver and low lipids profile changes abnormality.
So lipid profile should be used as a routine screening test in cirrhosis.
These values help to ascertain the prognosis and severity.
BIBLIOGRAPHY
1. S. R. Abdel-Misih and M. Bloomston, “Liver anatomy,” Surgical Clinics of
North America, vol. 90, no. 4, p. 643, 2010.
2. W. W. Lautt, “Mechanism and role of intrinsic regulation of hepatic arterial
blood flow: hepatic arterial buffer response,” American Journal of
Physiology-Gastrointestinal and Liver Physiology, vol. 249, no. 5, pp. G549–
G556, 1985.
3 O. Ohtani and Y. Ohtani, “Lymph circulation in the liver,” The Anatomical
Record, vol. 91, no. 6, pp. 643–652, 2008.
4. F. Kiernan, “The anatomy and physiology of the liver,” Philosophical
transactions of the Royal Society of London, vol. 123, pp. 711–770, 1833.
5. J. S. Dooley, A. Lok, A. Burroughs, and J. Heathcote, Sherlock’s diseases of
the liver and biliary system, 12th ed. Wiley-Blackwell, 2011.
6. A. Rappaport, Z. Borowy, W. Lougheed, and W. Lotto, “Subdivision of
hexagonal liver lobules into a structural and functional unit. Role in hepatic
physiology and pathology,” The Anatomical Record, vol. 119, no. 1, pp. 11–
33, 1954.
7. R. Taub, “Liver regeneration: from myth to mechanism,” Nature Reviews
Molecular Cell Biology, vol. 5, no. 10, pp. 836–847, 2004.

8. B. C. Isenberg and J. Y. Wong, “Building structure into engineered tissues,”
Materials Today, vol. 9, no. 12, pp. 54–60, 2006.
9. P. Anthony, K. Ishak, N. Nayak, H. Poulsen, P. Scheuer, and L. Sobin, “The
Morphology of cirrhosis. Recommendations on definition, nomenclature, and
Classification by a working group sponsored by the world health
organization.” Journal of clinical pathology, vol. 31, no. 5, pp. 395–414, 1978.
10. F. H. Netter, The netter collection of medical illustrations. Digestive System:
Liver, Biliary tract, Pancreas. Saunders, 1964, vol. 3.
11. D. Schuppan and N. H. Afdhal, “Liver cirrhosis,” The Lancet, vol. 371, no.
9615, pp. 838–851, 2008.
12. M. Iannacone, G. Sitia, Z. M. Ruggeri, and L. G. Guidotti, “Hbv pathogenesis
in animal models: recent advances on the role of platelets,” Journal of
hepatology, vol. 46, no. 4, pp. 719–726, 2007.
13. A. Gramenzi, F. Caputo, M. Biselli, F. Kuria, E. Loggi, P. Andreone, and M.
Bernardi, “Review article: alcoholic liver disease–pathophysiological aspects
and risk factors,” Alimentary pharmacology & therapeutics, vol. 24, no. 8, pp.
1151–1161, 2006.
14. R. D. Odze and J. R. Goldblum, Surgical Pathology of the GI Tract, Liver,
Biliary Tract, and Pancreas, 2nd ed. Saunders, 2009.

15. S. L. Friedman, “Mechanisms of hepatic fibrogenesis,” Gastroenterology, vol.
134, no. 6, pp. 1655–1669, 2008.
16. C. Kordes, I. Sawitza, A. Müller-Marbach, N. Ale-Agha, V. Keitel, H.
Klonowski-Stumpe, and D. Häussinger, “Cd133+ hepatic stellate cells are
progenitor cells,” Biochemical and biophysical research communications, vol.
352, no. 2, pp. 410–417, 2007.
17. R. F. Hanna, D. A. Aguirre, N. Kased, S. C. Emery, M. R. Peterson, and C.
B. Sirlin, “Cirrhosisassociated hepatocellular nodules: Correlation of
histopathologic and mr imaging features1,” adiographics, vol. 28, no. 3, pp.
747–769, 2008.
18. P. Huet, C. Goresky, J. Villeneuve, D. Marleau, and J. Lough, “Assessment
of liver microcirculation in human cirrhosis.” Journal of Clinical
Investigation, vol. 70, no. 6, p. 1234, 1982.
19. J. Villeneuve, M. Dagenais, P. Huet, A. Roy, R. Lapointe, and D. Marleau,
“The hepatic microcirculation in the isolated perfused human liver,”
Hepatology, vol. 23, no. 1, pp. 24–31, 1996.
20. E. Vanheule, A. M. Geerts, J. Van Huysse, D. Schelfhout, M. Praet, H. Van
Vlierberghe, M. De Vos, and I. Colle, “An intravital microscopic study of the
hepatic microcirculation in cirrhotic mice models: relationship between
fibrosis and angiogenesis,” International journal of experimental pathology,
vol. 89, no. 6, pp. 419–432, 2008.
21. H. Hano and S. Takasaki, “Three-dimensional observations on the alterations
of lobular architecture in chronic hepatitis with special reference to its
angioarchitecture for a better understanding of the formal pathogenesis of
liver cirrhosis,” Virchows Archiv, vol. 443, no. 5, pp. 655–663, 2003.
22. Y. Fukukura, O. Nakashima, A. Kusaba, M. Kage, and M. Kojiro,
“Angioarchitecture and blood circulation in focal nodular hyperplasia of the
liver,” Journal of hepatology, vol. 29, no. 3, pp. 470–475, 1998.
23. V. Gülberg, K. Haag, M. Rössle, and A. L. Gerbes, “Hepatic arterial buffer
response in patients with advanced cirrhosis,” Hepatology, vol. 35, no. 3, pp.
630–634, 2002.
24. G. Garcia-Tsao, S. Friedman, J. Iredale, and M. Pinzani, “Now there are many
(stages) where before there was one: in search of a pathophysiological
classification of cirrhosis,” Hepatology, vol. 51, no. 4, pp. 1445–1449, 2010.
25. G. Garcia-Tsao, R. J. Groszmann, R. L. Fisher, H. O. Conn, C. E. Atterbury,
and M. Glickman, “Portal pressure, presence of gastroesophageal varices and
variceal bleeding,” Hepatology, vol. 5, no. 3, pp. 419–424, 1985.

26. W. K. Al-Hamoudi, “Cardiovascular changes in cirrhosis: Pathogenesis and
clinical implications,” Saudi journal of gastroenterology: official journal of
the Saudi Gastroenterology Association, vol. 16, no. 3, p. 145, 2010.
27. Daniel J.Rader,Helen H, Hobbs et al.,Disorders of lipoprotein metabolism, In
Fauci,Braundald,Kasper et al.,Harrison’sprinciples of internal medicine,17th
edi,Newyork,USA,2008:P2416. 34)
28. Durrington PN. Lipid and lipoprotein disorders. Chapter 11.6 In Weatherall
DJ, Ledingham G and Warrel DA Edt. Oxford Textbook of Medicine. 3rd
edition, Vol. 2, New York, Oxford Medical Publications, 1996: p.1413.
29. Peter A Mayer et al., Lipid Transport and storage, cholesterol synthesis,
transport and excretion, In Robert K. Murray, Daryl K, Granner et al.,,
Harper’s Illustrated Biochemistry, 26th edition, 2003; 205: p 219.
30. Wade S, Smith, Sclaiborne Johnston et al., Cerebrovascular diseases. In:
Kasper DL, Fauci AS, Longo DL, Braunwald E, Hauser SL, Jameson JL, Edt.
Harrison’s Principles of Internal Medicine, 16th edition, New York, USA,
2005; 2: pp. 2372.
31. Albucher JF, Ferrieros J et al., Serum lipids in young patients with ischaemic
stroke, a case control study. J Neurology Neurosurgery Psychiatry 2000; 69
(1): 29-33.
32. McIntyre N. Plasma lipids and lipoproteins in liver disease. Gut 1978;
19:526-530.
33. Kroon PA, Powell EE. Liver, lipoproteins and disease: I. Biochemistry of
lipoprotein metabolism. J Gastroenterol Hepatol 1992; 7:214‑24.
34. Ghadir MR, Riahin AA, Havaspour A, Nooranipour M, Habibinejad AA. The
Relationship between lipid profile and severity of liver damage in cirrhotic
patients. Hepat Mon 2010; 10:285‑8.
35. Lelbach WK. Cirrhosis in the alcoholic and its relation to the volume of
alcohol abuse. Ann N Y Acad Sci 1975; 252:85‑105.
36. Becker U, Deis A, Sorensen TI, Gronbaek M, Borch‑Johnsen K, Muller CF,
et al., Prediction of risk of liver disease by alcohol intake, sex, and age: A
Prospective population study. Hepatology 1996; 23:1025‑9.
37. Gao B, Bataller R. Alcoholic liver disease: Pathogenesis and new therapeutic
targets. Gastroenterology 2011; 141:1572‑85.
38. Canbay A, Bechmann L, Gerken G. Lipid metabolism in the liver. Z
Gasteroenterol 2007; 45:35‑41.
39. Jarike AE, Momoh JA. Plasma total cholesterol, high density lipoprotein
cholesterol and low density lipoprotein cholesterol levels in liver cirrhosis in
Nigerians. Nig Qt J Hosp Med 1996; 6:157‑9.
40. Mohammad reza ghadir et al.,, the relationship between lipid profile and
severity of liver damage in cirrhotic patients. Hepat mon: 2011:10(4):285-
288.
41. Phukan JP, Sinha A, Deka JP. Serum lipid profile in alcoholic cirrhosis: A
study in a teaching hospital of north-eastern India. Niger Med J 2013; 54:5-9.
42. Gao B, Bataller R. Alcoholic liver disease: Pathogenesis and new therapeutic
Targets. Gastroenterology 2011; 141:1572‑85.
43. Tome S, Lucey MR. Review article: Current management of alcoholic liver
disease. Aliment Pharmacol Ther 2004; 19:707‑14.
44. Khairy H. et al.,, lipid profile among cirrhotic patients with and without
hepatocellular carcinoma in Upper Egypt, The journal of arab society for
medical research.2012:7:33-37
45. Halsted CH. Nutrition and alcoholic liver disease. Semin liver Dis. 2004;
24(3):289-304.

PROFORMA
Name : IP No :
Age : D.O.A :
Sex : D.O.D :
Religion : Hospital :
Address : Occupation :
I. PRESENTING COMPLAINTS:
1. Distention of abdomen 8. Dyspeptic symptoms
2. Swelling of lower limbs 9. Loss of apetite/weight
3. Pain abdomen 10. Haemetamesis
4. Mass per abdomen 11. Bleeding per rectum
5. Fever 12. Sleep disturbance
6. Yellowish discoloration of eyes
7. Altered sensorium
II. PASTHISTORY
a. Similar ailments like presenting symptoms
b. Previous hospitalization for reduced output ,altered sensorium.
c. History of Jaundice
d. Blood transfusion
e. Intake of Hepatotoxic drugs

f. History of Immunization
g. Past history of any abdominal operations
h. Other illness
III. PERSONAL HISTORY
a. Diet : Veg./mixed
b. Sleep : Disturbed/undisturbed
c. Alcohol consumption : Duration
d. Bowel and micturition habits
Regular :
Constipation/Diarrhoea :
e. Apetitc :
IV. GENERAL PHYSICAL EXAMINATION
Built : Nourishment :
Scalp hair : Weight :
Skin : Height :
Conjunctiva : Sclera :
Oral cavity :

Neck : Lymph node enlargement : Yes / No
Thyroid enlargement : Yes / No
Parotid enlargement : Yes / No
Upper Limbs : Flapping tremors
Dupytrens contracture
Palmar erythema
Spider Navei
Oedema : Pitting/non pitting :
Jugular venous pulse :
Foetar hepaticus :
Anaemia :
Icterus :
Cyanosis :
Clubbing :
Lymph nodes :
Gynaecomastia :
Vital signs : Pulse/min :
Blood pressure in mm Hg :
Temperature :
Respiratory rate :
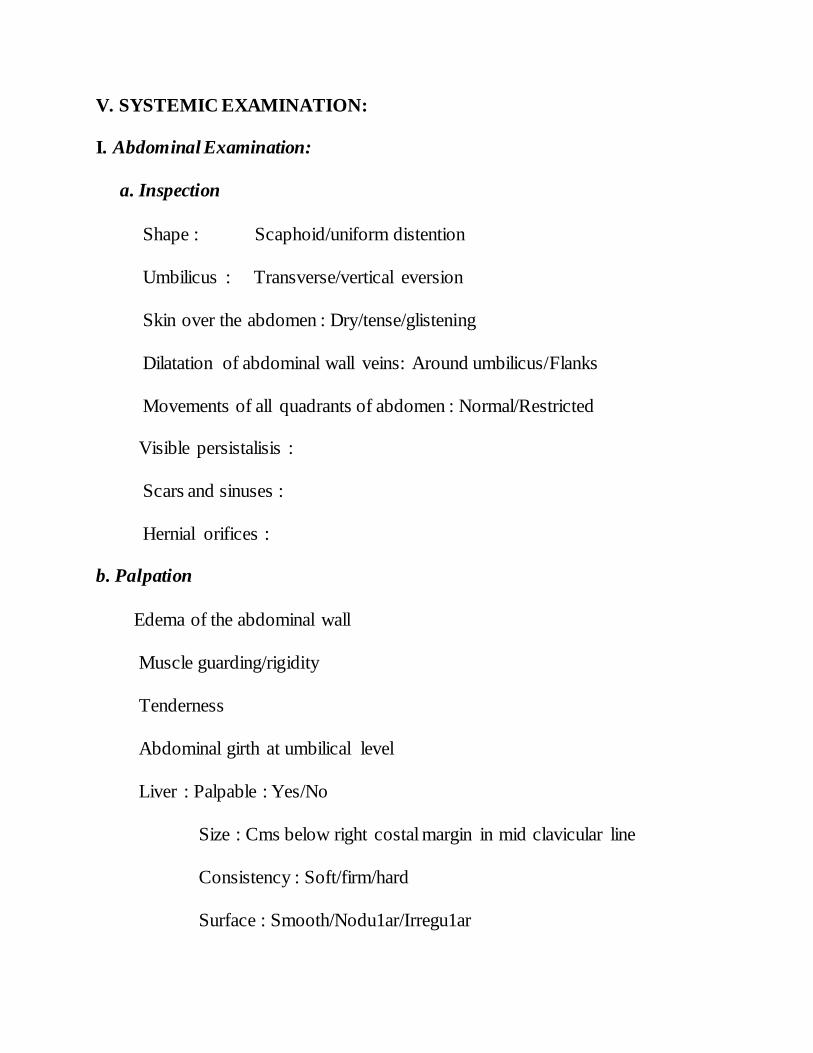
V. SYSTEMIC EXAMINATION:
I. Abdominal Examination:
a. Inspection
Shape : Scaphoid/uniform distention
Umbilicus : Transverse/vertical eversion
Skin over the abdomen : Dry/tense/glistening
Dilatation of abdominal wall veins: Around umbilicus/Flanks
Movements of all quadrants of abdomen : Normal/Restricted
Visible persistalisis :
Scars and sinuses :
Hernial orifices :
b. Palpation
Edema of the abdominal wall
Muscle guarding/rigidity
Tenderness
Abdominal girth at umbilical level
Liver : Palpable : Yes/No
Size : Cms below right costal margin in mid clavicular line
Consistency : Soft/firm/hard
Surface : Smooth/Nodu1ar/Irregu1ar
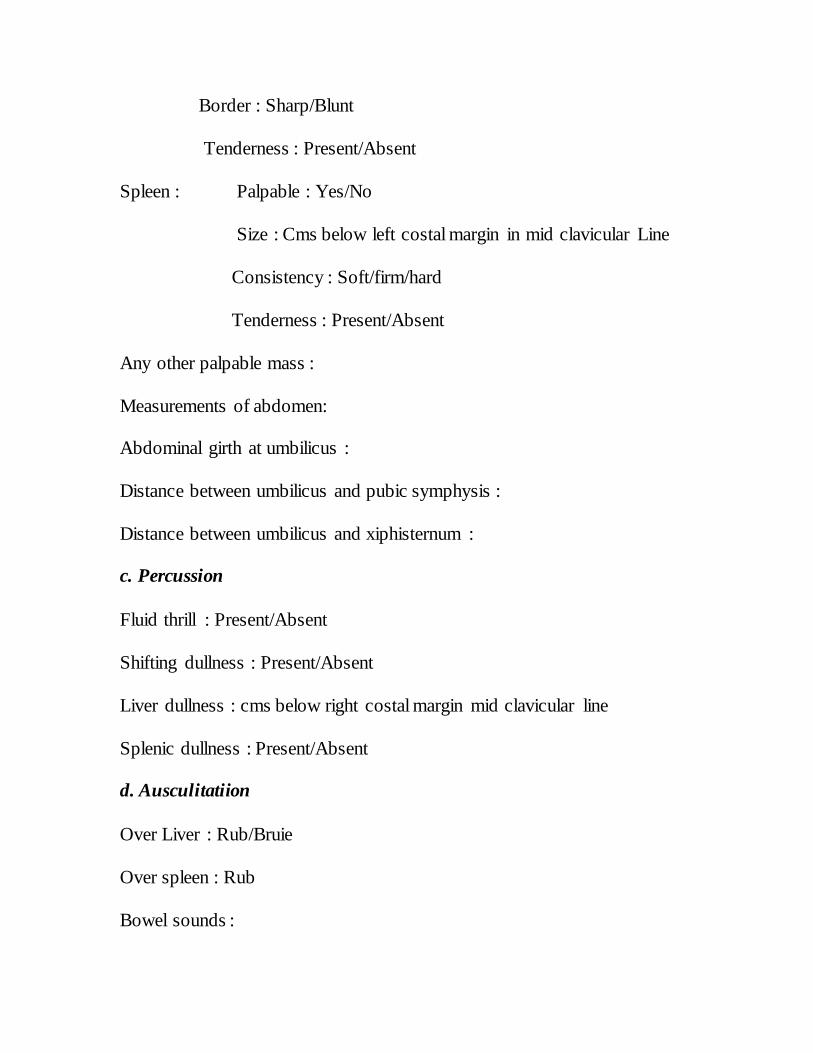
Border : Sharp/Blunt
Tenderness : Present/Absent
Spleen : Palpable : Yes/No
Size : Cms below left costal margin in mid clavicular Line
Consistency : Soft/firm/hard
Tenderness : Present/Absent
Any other palpable mass :
Measurements of abdomen:
Abdominal girth at umbilicus :
Distance between umbilicus and pubic symphysis :
Distance between umbilicus and xiphisternum :
c. Percussion
Fluid thrill : Present/Absent
Shifting dullness : Present/Absent
Liver dullness : cms below right costal margin mid clavicular line
Splenic dullness : Present/Absent
d. Ausculitatiion
Over Liver : Rub/Bruie
Over spleen : Rub
Bowel sounds :

e. External Genatalia :
2. Cardio Vascular system examination
3. Respiratory system examination
4. Central nervous system examination
IX. INVESTIGATIONS
1. Routine Haematological examination
Hb gm% :
Total Count :
Differential count :
2. Urine analysis : Sugar :
Albumin : Microscopy :
Bile salts/Bile pigments :
Urobilinogen :
3. Random blood sugar in mg/dl :
4. Blood urea in mg/dl :
5. Serum creatinine in mg/dl :
6. Liver function tests :
Serum total Billirubin :
Serum total proteins :
Serum Albumin :

Serum Globulin :
Albumin/Globulin ratio :
S.G.O.T :
S.G.P.T :
Serum Alkaline Phosphotase :
7. Lipid profile :
Tota cholesterol :
HDL :
LDL :
Triglyceride :
VLDL :
8.PT &INR :
8.ECG :
9.Ultrasound abdomen :
TREATMENT :
SUMMARY AND CONCLUSION :
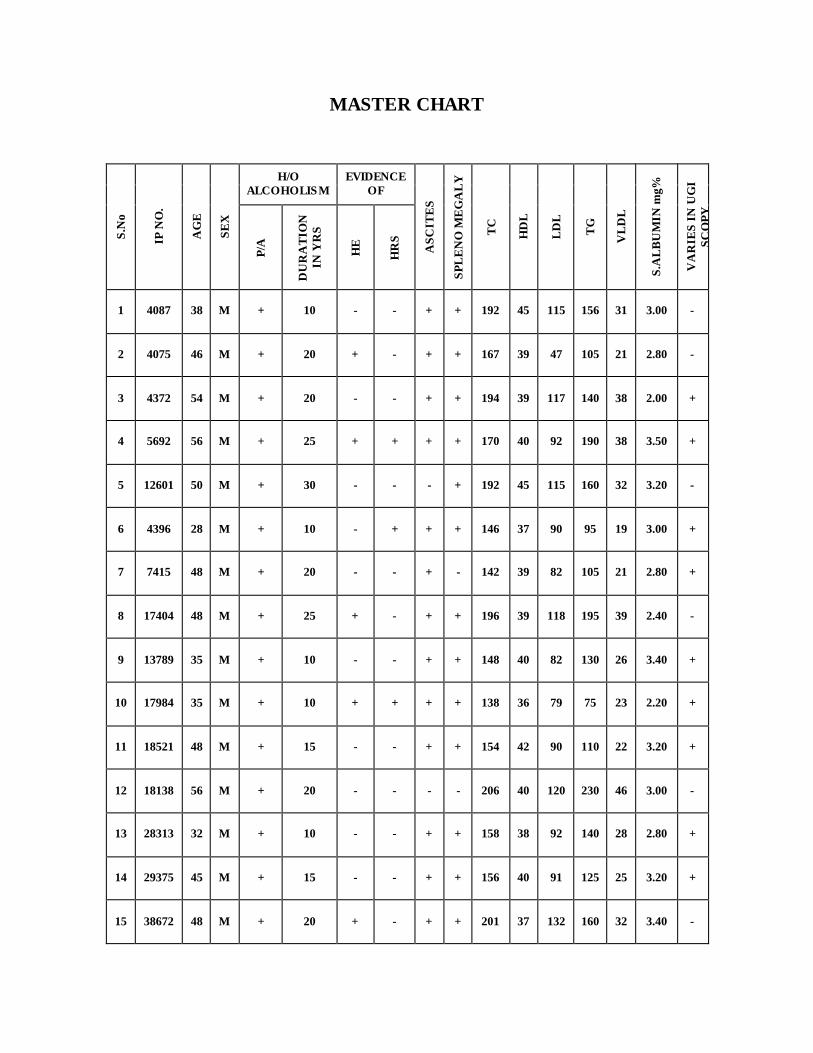
MASTER CHART
S
.No
IP N
O.
AG
E
SE
X
H/O
ALCOHOLISM
EVIDENCE
OF
AS
CIT
ES
SP
LE
NO
ME
GA
LY
TC
HD
L
LD
L
TG
VL
DL
S.A
LB
UM
IN m
g%
VA
RIE
S I
N U
GI
SC
OP
Y
P/A
DU
RA
TIO
N
IN Y
RS
HE
HR
S
1 4087 38 M + 10 - - + + 192 45 115 156 31 3.00 -
2 4075 46 M + 20 + - + + 167 39 47 105 21 2.80 -
3 4372 54 M + 20 - - + + 194 39 117 140 38 2.00 +
4 5692 56 M + 25 + + + + 170 40 92 190 38 3.50 +
5 12601 50 M + 30 - - - + 192 45 115 160 32 3.20 -
6 4396 28 M + 10 - + + + 146 37 90 95 19 3.00 +
7 7415 48 M + 20 - - + - 142 39 82 105 21 2.80 +
8 17404 48 M + 25 + - + + 196 39 118 195 39 2.40 -
9 13789 35 M + 10 - - + + 148 40 82 130 26 3.40 +
10 17984 35 M + 10 + + + + 138 36 79 75 23 2.20 +
11 18521 48 M + 15 - - + + 154 42 90 110 22 3.20 +
12 18138 56 M + 20 - - - - 206 40 120 230 46 3.00 -
13 28313 32 M + 10 - - + + 158 38 92 140 28 2.80 +
14 29375 45 M + 15 - - + + 156 40 91 125 25 3.20 +
15 38672 48 M + 20 + - + + 201 37 132 160 32 3.40 -

16 4860 45 M + 10 - + + + 98 32 52 70 14 3.20 +
17 4329 32 M + 12 + + + + 204 42 134 190 38 3.00 +
18 23006 43 M + 20 + - + + 130 30 68 160 32 2.80 -
19 30085 58 M + 25 - - + + 194 44 108 220 42 2.60 +
20 38116 64 M + 30 - - + + 110 31 60 95 19 2.20 +
21 39314 65 M + 25 + + + + 104 36 50 90 18 2.00 -
22 34378 62 M - - - - - + 120 36 60 120 24 3.40 -
23 40213 31 M + 20 - + + + 114 40 52 110 22 3.00 +
24 41612 40 M + 10 + - + + 116 42 54 80 20 3.20 +
25 43702 40 M + 10 - - + + 126 34 70 110 22 3.00 +
26 37893 60 M + 28 - - - + 110 38 55 85 17 2.80 -
27 38012 55 M + 30 + + + + 124 37 50 135 27 2.20 -
28 38956 60 M + 25 + + + + 90 25 45 100 20 2.00 +
29 39103 35 M + 20 + + + + 93 29 48 80 16 1.80 +
30 39261 47 M + 20 - - + - 134 38 70 130 26 1.80 +
31 40374 38 M + 20 - - - - 137 35 75 135 27 2.80 +
32 2227 45 M + 10 + - + + 168 44 94 150 30 2.50 +
33 3769 50 M + 20 - - + - 172 45 90 185 37 3.20
34 4544 41 M + 15 - + + + 164 46 86 160 32 2.60 +

35 14736 54 M + 20 + + - + 104 32 54 90 18 2.00 +
36 19428 52 M - - - - - + 186 45 102 192 38 3.50 +
37 25150 50 M + 25 + - - - 184 40 108 180 36 2.20 -
38 28901 55 M + 30 + + + 98 30 52 80 16 2.90 +
39 29012 45 M + 20 + - - + 180 48 92 200 40 3.00 +
40 1692 38 M + 10 - - + + 146 37 90 95 19 3.40 +
41 1693 45 M + 12 + - + + 184 50 96 190 38 3.60 -
42 2921 38 M + 18 - - + + 174 44 98 160 32 2.60 -
43 9290 38 M + - - + + + 192 48 106 190 38 3.00 +
44 15080 60 M + 28 + + + + 90 35 45 100 20 2.00 +
45 16208 56 M + 15 + - + + 184 44 101 195 39 2.40 +
46 17493 32 M + 18 - - + + 102 25 65 60 12 2.80 -
47 80518 64 M + 28 + + + + 110 31 60 95 19 3.00 +
48 30911 40 M + 30 - - + + 108 33 54 115 21 3.80 -
49 37764 45 M + 35 + + + + 105 31 52 110 22 2.20 +
50 38804 44 M + 10 - + + 96 32 48 80 16 2.00 +

KEY WORDS
+ - PRESENT
- - ABSENT
HE - HEPATIC ENCEPHALOPATHY
HRS - HEPATO RENAL SYNDROME
LDL - LOW DENSITY
LIPOPROTEIN
TG - TRIGLYCERIDE
TC - TOTAL CHOLESTEROL
HDL - HIGH DENSITY LIPOPROTEIN
LDL <100 - LOW VALUE
TC<140 - LOW VALUE
HDL <40 - LOW VALUE

xix
ABBREVIATIONS
ACTH - Adrenocorticotropic Hormone
ATP - Adenosine Tri Phosphate
CTL - Cytotoxic T Lymphocytes
DNA - Deoxy Ribose Nucleic Acid
ESR - Erythrocyte Sedimentation Rate
FFA - Free Fatty Acids
HBV - Hepatic B Virus HCC
HCV - Hepatic C Virus
HDL - High Density Lipoprotein
HSC - Hepatic Stellate Cells
INR - International Normalized Ratio
IUB - International Union of Biochemistry
IPAUC - International Union of Pure and Applied Chemistry
KCL/gm - kilocalories / gram
Kg - Kilogram
KOH - Potassium Hydroxide
LCAT - Lecithin Cholesterol Acyl Transferase
LDL - Low Density Lipoprotein

xx
LFT - Liver Function Test
LPS - LipoPolySaccharide
Mg - Milligram
mg/dl - milligram/ deciliter
NADH - Sodium Adenosine Dioxide
NAOH - Sodium Adenosine Hydroxide
NEFA - Non-Esterified Fatty Acids
NSAID - Non-Steroidal Anti Inflammatory Drug
PT - Prothrombine Time
ROS - Reactive Oxygen Species
RBC - Red Blood Cells
SBP - Spontaneous Bacterial Peritonitis
TC - Total Cholesterol
TG - TriGlyceride
UGI - Upper Gastro Intestinal
USG - Ultrasonography
VEGF - Vascular Endothelial Growth Factor
VLDL - Very Low Density Lipoprotein
% - Percentage
μm - Micrometer

xxi
CONSENT FORM
I __________________________________________ hereby give consent to
participate in the study conducted by DR .S.KUMARESAN Post graduate in the
Department of General Medicine ,Thanjavur Medical College & Hospital,
Thanjavur – 613004 and to use my personal clinical data and result of investigation
for the purpose of analysis and to study the nature of disease. I also give consent for
further investigations
Place :
Date : Signature of Participant

xxii

xxiii
LIST OF FIGURES
FIG. 1. BLOOD SUPPLY OF LIVER
FIG. 2. HEPATIC ACINUS
FIG. 3. RHOMBOIDAL ACINUS
FIG. 4. CO - FACTORS FOR DEVELOPMENT OF CIRRHOSIS
FIG. 5. MECHANISMS OF ALD
FIG. 6. PATHOGENESIS OF ALD
FIG. 7. FIBROGENESIS OF LIVER
FIG. 8. FORMATION OF REGENERATIVE NODULES
FIG. 9. PATHWAY OF HEPATIC STELLATE CELL ACTIVATION
FIG. 10. COLLAGEN DEPOSITION AND SINUSOIDAL CONSTRICTION IN
CIRRHOSIS.
FIG. 11. FORMATION OF CIRRHOTIC ANGIOARCHITECTURE
FIG. 12. COMPLICATIONS OF CIRRHOSIS
FIG. 13. FORMATION OF PORTAL HYPERTENSION
FIG. 14. MANAGEMENT OF VARICEAL BLEED
FIG. 15. MECHANISMS OF HEPATIC ENCEPHALOPATHY
FIG. 16. MANAGEMENT OF HEPATIC ENCEPHALOPATHY
FIG. 17. HEPATORENAL SYNDROME
FIG. 18. CHOLESTEROL – CARRYING LIPOPROTEINES
FIG. 19. MECHANISMS OF VLDL
FIG. 20. MECHANISMS OF HDL
FIG. 21. LIPOPROTEIN METABOLISM
FIG. 22. AGE DISTRIBUTION
FIG. 23. SEX DISTRIBUTION

xxiv
FIG. 24. ALCOHOLISM DISTRIBUTION
FIG. 25. DISTRIBUTION OF TOTAL CHOLESTEROL
FIG. 26. DISTRIBUTION OF HIGH DENSITY LIPOPROTEIN
FIG. 27. DISTRIBUTION OF LOW DENSITY LIPOPROTEIN
FIG. 28. DISTRIBUTION OF TRIGLYCERIDE RELATED TO LIPIDS
LEVEL
FIG. 29. DISTRIBUTION OF COMPLICATION
FIG. 30. COMPLICATION CORRELATED TO LIPIDS DISTRIBUTION
FIG. 31. EVIDENCE OF HEPATIC ENECEPHALOTHY RELATED TO
LIPIDS LEVEL
FIG. 32. EVIDENCE OF HEPATO RENAL SYNDROME RELATED TO
LIPIDS LEVEL
FIG. 33. FEATURES OF ASCITES
FIG. 34. EVIDENCE OF SPLENOMEGALY
FIG. 35 DISTRIBUTION OF SERUM ALBUMINE RELATED TO LIPIDS
LEVEL
FIG. 36 EVIDENCE OF VARIES IN UGI SCOPY RELATED TO LIPIDS
LEVEL
FIG. 37 DISTRIBUTION OF LIPIDS
FIG. 38 HRS LIPIDS CORELATION
FIG. 39 LIPIDS DISTRIBUTION IN HRS
FIG. 40 SERUM ALBUMINE IN LIPIDS DISTRIBUTION
FIG. 41 VARIES IN UGI SCOPY OF DISTRIBUTION

xxv
LIST OF TABLES
Table. 1: MAJOR CLASSES OF LIPOPROTEINS
Table. 2: AGE DISTRIBUTION
Table. 3: SEX DISTRIBUTION
Table. 4: ALCOHOLISM DISTRIBUTION
Table. 5: DISTRIBUTION OF TOTAL CHOLESTEROL
Table. 6: DISTRIBUTION OF HDL
Table. 7: DISTRIBUTION OF LDL
Table. 8: DISTRIBUTION OF TG
Table. 9: DISTRIBUTION OF COMPLICATION
Table. 10: COMPLICATION CORRELATED TO LIPIDS DISTRIBUTION
Table. 11: EVIDENCE OF HEPATIC ENECEPHALOTHY
Table. 12: EVIDENCE OF HEPATO RENAL SYNDROME
Table. 13: FEATURES OF ASCITES
Table. 14: EVIDENCE OF SPLENOMEGALY
Table. 15: DISTRIBUTION OF SERUM ALBUMINE
Table. 16: EVIDENCE OF VARIES IN UGI SCOPY
Table. 17: DISTRIBUTION OF LIPIDS
Table. 18: HRS LIPIDS CORELATION
xxvi
Table. 19: LIPIDS DISTRIBUTION IN HRS
Table. 20: SERUM ALBUMINE IN LIPIDS DISTRIBUTION
Table. 21: VARIES IN UGI SCOPY OF DISTRIBUTION