mchenry solar farm deir - stancounty.com
TRANSCRIPT

Draft
McHENRY SOLAR FARM Environmental Impact Report SCH#: 2010122021
Prepared for May 2011Modesto Irrigation District P.O. Box 4060 Modesto, CA 95352

Draft
McHENRY SOLAR FARM Environmental Impact Report SCH#: 2010122021
Prepared for May 2011 Modesto Irrigation District P.O. Box 4060 Modesto, CA 95352
225 Bush Street Suite 1700 San Francisco, CA 94104 415.896.5900 www.esassoc.com
209517.01

OUR COMMITMENT TO SUSTAINABILITY | ESA helps a variety of public and private sector clients plan and prepare for climate change and emerging regulations that limit GHG emissions. ESA is a registered assessor with the California Climate Action Registry, a Climate Leader, and founding reporter for the Climate Registry. ESA is also a corporate member of the U.S. Green Building Council and the Business Council on Climate Change (BC3). Internally, ESA has adopted a Sustainability Vision and Policy Statement and a plan to reduce waste and energy within our operations. This document was produced using recycled paper.

McHenry Solar Farm i May 2011 Draft Environmental Impact Report
TABLE OF CONTENTS McHenry Solar Farm Draft Environmental Impact Report
Page Executive Summary ........................................................................................................ ES-1
ES.1 Introduction ........................................................................................................ ES-1 ES.2 Project Objectives .............................................................................................. ES-1 ES.3 Project Setting and Location .............................................................................. ES-3 ES.4 Project Description ............................................................................................. ES-3 ES.5 Alternatives ........................................................................................................ ES-4 ES.6 Environmentally Superior Alternative ................................................................. ES-5 ES.7 Areas of Controversy and Issues to be Resolved .............................................. ES-5 ES.8 Summary of Impacts and Mitigation Measures .................................................. ES-6
1. Introduction .................................................................................................................. 1-1
1.1 Purpose of This Document ................................................................................... 1-1 1.2 Project Overview ................................................................................................... 1-1 1.3 Use of this Document by Agencies ....................................................................... 1-2 1.4 Public Review and Comment ................................................................................ 1-3 1.5 Reader’s Guide to This EIR .................................................................................. 1-4
2. Project Description ...................................................................................................... 2-1
2.1 Project Overview ................................................................................................... 2-1 2.2 Project Location and Existing Land Use ............................................................... 2-2 2.3 Project Purpose and Need .................................................................................... 2-4 2.4 Project Objectives ................................................................................................. 2-4 2.5 Project Facilities .................................................................................................... 2-5
2.5.1 Solar Panel Array ....................................................................................... 2-5 2.5.2 Modular Power Block and Cabling ............................................................. 2-5 2.5.3 Tracker Unit ............................................................................................... 2-6 2.5.4 Project Substation .................................................................................... 2-10 2.5.5 Operation and Maintenance (O&M) Building ............................................ 2-10 2.5.6 Other Site Improvements ......................................................................... 2-12 2.5.7 Water Requirements and Waste Generation ........................................... 2-12 2.5.8 Sub-transmission/Distribution Line and Switchyard ................................. 2-16 2.5.9 New Fiber Optic Cable ............................................................................. 2-19
2.6 Construction ........................................................................................................ 2-19 2.6.1 Site Preparation ....................................................................................... 2-19 2.6.2 Solar Array Construction .......................................................................... 2-22 2.6.3 O&M Building Construction ...................................................................... 2-22 2.6.4 Substation and Switchyard Construction .................................................. 2-22

Table of Contents
Page
McHenry Solar Farm ii May 2011 Draft Environmental Impact Report
2. Project Description (continued) 2.6.5 Sub-transmission and Distribution Line Installation .................................. 2-23 2.6.6 Conductoring ............................................................................................ 2-25 2.6.7 New Fiber Optic Cable ............................................................................. 2-25 2.6.8 Construction Overview ............................................................................. 2-25
2.7 Operation and Maintenance................................................................................ 2-28 2.7.1 Operation and Maintenance Workforce .................................................... 2-28 2.7.2 Automated Facility Control and Monitoring System ................................. 2-28 2.7.3 Panel Washing ......................................................................................... 2-28 2.7.4 Site Maintenance ..................................................................................... 2-29 2.7.5 Continued Agricultural Use as Grazing Land ........................................... 2-29
2.8 Decommissioning and Site Reclamation ............................................................ 2-29 2.8.1 Decommissioning of Applicant Facilities .................................................. 2-29 2.8.2 MID Switchyard, Sub-transmission/Distribution Lines, and
Control Building ...................................................................................... 2-31 2.9 References ......................................................................................................... 2-31
3. Description of Alternatives ......................................................................................... 3-1 3.1 Alternatives Overview ........................................................................................... 3-1 3.2 Alternatives Development and Screening Process ............................................... 3-1
3.2.1 Alternatives Screening Methodology .......................................................... 3-2 3.2.2 Consistency with Project Objectives .......................................................... 3-2 3.2.3 Feasibility ................................................................................................... 3-2 3.2.4 Potential to Eliminate Significant Environmental Effects ............................ 3-3
3.3 Summary of Screening Results ............................................................................ 3-4 3.3.1 Alternatives Evaluated in Detail in this EIR ................................................ 3-4 3.3.2 Alternatives Rejected from Detailed Consideration .................................. 3-15
3.4 References ......................................................................................................... 3-18 4. Environmental Analysis .............................................................................................. 4-1 Introduction to Environmental Analysis .......................................................................... 4-1
4.1 Aesthetics, Visual Quality, and Light and Glare ................................................. 4.1-1 4.2 Agriculture and Forest Resources ..................................................................... 4.2-1 4.3 Air Quality .......................................................................................................... 4.3-1 4.4 Biological Resources ......................................................................................... 4.4-1 4.5 Cultural and Paleontological Resources ............................................................ 4.5-1 4.6 Energy Conservation ......................................................................................... 4.6-1 4.7 Geology and Soils .............................................................................................. 4.7-1 4.8 Greenhouse Gas Emissions .............................................................................. 4.8-1 4.9 Hazards and Hazardous Materials ..................................................................... 4.9-1 4.10 Hydrology and Water Quality ........................................................................... 4.10-1 4.11 Land Use and Planning ................................................................................... 4.11-1 4.12 Mineral Resources ........................................................................................... 4.12-1 4.13 Noise ............................................................................................................... 4.13-1 4.14 Population and Housing ................................................................................... 4.14-1 4.15 Public Services ................................................................................................ 4.15-1 4.16 Recreation ....................................................................................................... 4.16-1 4.17 Transportation/Traffic ....................................................................................... 4.17-1 4.18 Utilities and Service Systems ........................................................................... 4.18-1

Table of Contents
Page
McHenry Solar Farm iii May 2011 Draft Environmental Impact Report
5. Comparison of Alternatives ........................................................................................ 5-1 5.1 Comparison Methodology ..................................................................................... 5-1 5.2 Comparison of Alternatives and Identification of the Environmentally
Superior Alternative ........................................................................................... 5-2 6. Cumulative Impacts ..................................................................................................... 6-1
6.1 Projects Considered in the Cumulative Analysis ................................................... 6-1 6.2 Cumulative Impacts Analysis ................................................................................ 6-5
7. Other CEQA Considerations ....................................................................................... 7-1
7.1 Significant Unavoidable Environmental Impacts ................................................... 7-1 7.2 Significant Irreversible Changes ........................................................................... 7-1 7.3 Growth-Inducing Impacts ...................................................................................... 7-2
8. Report Preparation ...................................................................................................... 8-1 8.1 Report Authors ...................................................................................................... 8-1 8.2 Agencies and Organizations Contacted ................................................................ 8-2
9. Glossary and Acronyms .............................................................................................. 9-1 9.1 Glossary................................................................................................................ 9-1 9.2 Acronyms and Abbreviations ................................................................................ 9-3
10. Mitigation Monitoring Plan ........................................................................................ 10-1 10.1 Introduction ......................................................................................................... 10-1 10.2 Mitigation Implementation and Monitoring .......................................................... 10-1 10.3 Mitigation Enforcement ....................................................................................... 10-2 10.4 Mitigation Monitoring Plan Measures .................................................................. 10-2
Appendices
A. Scoping Report ...........................................................................................................A-1 B. Air Resources .............................................................................................................B-1 C. Hazards and Hazardous Materials ............................................................................. C-1
List of Figures
2-1 Project Site Location Map.......................................................................................... 2-3 2-2 Proposed Site Plan .................................................................................................... 2-7 2-3 SunPower Tracker Unit Schematic Diagram ............................................................. 2-9 2-4 Operations and Maintenance Building Elevations ................................................... 2-11 2-5 Conceptual Landscape Plan ................................................................................... 2-13 2-6 Proposed Interconnection, Optional Interconnection Alignments, and On-Site Interconnection Facilities ....................................................................... 2-17 2-7 Proposed Fiber Optic Cable Alignment ................................................................... 2-20 2-8 Profile of Proposed Wooden Pole Structures .......................................................... 2-24 3-1 Non-Agricultural Site Alternative ............................................................................. 3-11 4.1-1 Photograph Viewpoint Location Map ...................................................................... 4.1-3 4.1-2a Setting Photos ........................................................................................................ 4.1-5 4.1-2b Setting Photos ........................................................................................................ 4.1-6
Table of Contents
Page
McHenry Solar Farm iv May 2011 Draft Environmental Impact Report
List of Figures (continued)
4.1-3 Visual Simulation of Proposed Interconnection .................................................... 4.1-12 4.1-4 Visual Simulation of Western Project Boundary ................................................... 4.1-13 4.1-5 Visual Simulation of Interconnection Option 1 ...................................................... 4.1-14 4.1-6 Visual Simulation of Interconnection Option 2 ...................................................... 4.1-15 4.2-1 Important Farmland and Williamson Act Contracted Land within the Project Vicinity ................................................................................................... 4.2-5 4.4-1 Vegetative Habitats within the Project Study Area ................................................. 4.4-3 4.4-2 Special-Status Species within the Project Vicinity ................................................ 4.4-11 4.11-1 General Plan Land Use Designations within the Project Vicinity .......................... 4.11-2 4.13-1 Typical A – Weighted Sound Levels ..................................................................... 4.13-2 4.13-2 Short Term Noise Measurement Locations .......................................................... 4.13-6 6-1 Projects Considered in the Cumulative Impact Analysis ........................................... 6-4
List of Tables
ES-1 Summary of Impacts and Mitigation for the Proposed Project ................................ ES-8 ES-2 Proposed Project vs. Alternatives – Summary of Environmental Impact Conclusions ..................................................................................................... ES-18 1-1 Summary of Potential Permit Requirements ............................................................. 1-3 2-1 Proposed Construction Schedule and Workforce .................................................... 2-26 2-2 Construction Equipment by Construction Phase ..................................................... 2-27 3-1 Summary of Preliminary Significant Environmental Impacts of the McHenry Solar Farm ............................................................................................. 3-4 3-2 Summary of Alternatives Screening Analysis – McHenry Solar Farm ....................... 3-5 4.0-1 Alignment/Interconnection Option Providing a “Worst Case” by Resource Area ....... 4-5 4.2-1 Recent Farmland Conversions in Stanislaus County ............................................. 4.2-6 4.3-1 Air Quality Data Summary (2007-2009) for the Study Area .................................... 4.3-3 4.3-2 San Joaquin Valley Air Basin Attainment Status .................................................... 4.3-4 4.3-3 State and National Criteria Air Pollutant Standards ................................................ 4.3-6 4.3-4 SJVAPCD Rule 8021 Measures Applicable to the Project ..................................... 4.3-9 4.3-5 Project Construction Emissions Estimates ........................................................... 4.3-13 4.4-1 Project Site Habitat/Vegetation Communities ......................................................... 4.4-2 4.4-2 Special-Status Species Potentially Occurring on the Project Site .......................... 4.4-7 4.5-1 Previously Recorded Cultural Resources within a 0.5-mile Radius of the Project Site ........................................................................................................ 4.5-6 4.5-2 Paleontological Potential Criteria .......................................................................... 4.5-12 4.8-1 Recommended Actions of Climate Change Scoping Plan ...................................... 4.8-5 4.8-2 Project GHG Emission Estimates ........................................................................... 4.8-8 4.10-1 Beneficial Uses of Waters within the Study Area .................................................. 4.10-5 4.10-2 Definitions of Beneficial Uses of Surface Waters ................................................. 4.10-5 4.13-1 Modeled Ambient Traffic Ldn Noise Levels in Vicinity of the Project Site .............. 4.13-5 4.13-2 Ambient Noise Levels Measured in the Study Area ............................................. 4.13-7 4.13-3 Maximum Allowable Noise Exposure – Stationary Noise Sources ....................... 4.13-8 4.13-4 Typical Noise Levels from On-site Construction Equipment and Vehicles ......... 4.13-14 4.17-1 Estimated Daily Vehicle Trips for Project Construction ........................................ 4.17-8 4.17-2 Project Construction Trip Percent Contribution to Roadway Traffic Volumes ..... 4.17-10 5-1 Proposed Project vs. Alternatives – Summary of Environmental Impact Conclusions .......................................................................................................... 5-3

Table of Contents
Page
McHenry Solar Farm v May 2011 Draft Environmental Impact Report
List of Tables (continued)
6-1 McHenry Solar Farm Cumulative Impact Analysis Projects List ................................ 6-2 10-1 Mitigation Monitoring Plan for the McHenry Solar Farm Project .............................. 10-3

McHenry Solar Project ES-1 May 2011 Draft Environmental Impact Report
EXECUTIVE SUMMARY
ES.1 Introduction
This Environmental Impact Report (EIR) is an informational document intended to disclose to the public and decision-makers the environmental consequences of the McHenry Solar Farm Project (Project) proposed by Solar Star California VIII, LLC (Solar Star or Applicant).1 This Executive Summary includes the following sections:
Introduction (ES.1) Project Objectives (ES.2) Project Setting and Location (ES.3) Project Description (ES.4) Alternatives (ES.5) Environmentally Superior Alternative (ES.6) Areas of Controversy and Issues to be Resolved (ES.7) Summary of Impacts and Mitigation Measures (ES.8)
A comparative summary of the impacts of the Project and the alternatives to the Project is provided in Table ES.1.The EIR assesses the direct, indirect, and cumulative environmental impacts that could occur as a result of the construction, operation, maintenance, and eventual decommissioning of the Project.
ES.2 Project Objectives The California Renewable Portfolio Standard legislation enacted in 2002 (Senate Bill 1078) and accelerated in 2006 requires retail sellers of electricity to obtain 20 percent of their supply of electricity from renewable energy sources, such as solar, by 2010. Governor Schwarzenegger set a state-wide goal of achieving a 33 percent renewable energy share by 2020 in order to reduce the impact of greenhouse gases on the environment. The 33 percent goal was enacted into law by Governor Brown on April 12, 2011 with his signing of Senate Bill 1X-2.
MID currently obtains approximately 27 percent of its electrical supply from renewable energy sources, with all but 1 percent of that coming from wind energy projects located outside of MID territory. MID has a need to diversify its renewable energy portfolio by procuring power with
1 Solar Star California VIII, LLC, is a wholly-owned subsidiary of the SunPower Corporation.

Executive Summary
McHenry Solar Project ES-2 May 2011 Draft Environmental Impact Report
more predictable operating characteristics than wind power. In this context, the Applicant and MID are proposing the Project to provide an economically viable source of clean renewable electricity generation that meets California’s growing demand for power, fulfills numerous state and national renewable energy policies, and provides important geographic and source diversity for MID’s energy portfolio. The objectives for the Project are as follows:
1. Assist MID in meeting its Renewable Portfolio Standard and goals aimed at reducing greenhouse gas (GHG) emissions.
2. Further MID’s efforts to achieve its goals for renewable energy generating capacity within MID’s total energy portfolio.
3. Diversify MID’s renewable energy portfolio, which is presently 96 percent wind powered, by adding solar power, which has more predictable operating characteristics.
4. Assist in meeting MID’s peak power load by adding solar power capacity, which has peak generation on sunny, hot summer days.
5. Increase transmission efficiency of MID’s renewable energy portfolio by locating solar power plant facilities within MID’s electric service territory and as near as possible to existing electrical sub-transmission and distribution facilities, which reduces line losses associated with transmitting electricity over long distances.
6. To the extent feasible, site the project on disturbed land to avoid or minimize impacts to special-status species or habitat.
7. To the extent feasible, site the project on land that would not require cancelation of a Williamson Act contract.
8. Use a proven and available solar photovoltaic technology that qualifies as an Eligible Renewable Energy Resource pursuant to Public Utilities Code Section 399.12, Public Resources Code Section 25741, and the California Energy Commission’s “Renewable Portfolio Standard: Eligibility Guidebook.”
9. Ensure that the Project can be constructed in a technologically feasible manner and operated in a manner that allows electricity to be provided at a competitive price.
10. Upgrade MID’s operational communications to enhance the reliability of MID’s electric system.
11. Accommodate a mix of agricultural and non-agricultural uses of the site by making the land underneath the solar panel array available for grazing.
12. Decommission the Project after its useful life and restore the Project site to its pre-existing agricultural use.

Executive Summary
McHenry Solar Project ES-3 May 2011 Draft Environmental Impact Report
ES.3 Project Setting and Location
The 154-acre Project site is located in northern unincorporated Stanislaus County between the City of Riverbank and community of Del Rio. Current land use within the Project site is predominantly agricultural, and includes row cropping (strawberries), agricultural facilities such as irrigation lines, and related access roads and staging areas. Surrounding land uses include orchards, rural farm residences, a furniture store, a residential subdivision and golf course, and open space surrounding the Stanislaus River.
ES.4 Project Description
Overview The Project includes the construction and operation of a 25-megawatt alternating current (MWac) photovoltaic (PV) electricity generating facility that would deliver solar-generated power to MID’s sub-transmission and distribution system. As part of the Project, MID proposes to construct, own, and operate a switching station in a new switchyard to be located adjacent to the proposed on-site Project substation. The Project also includes a new overhead 69-kilovolt (kV) sub-transmission line and 12-kV distribution line that would interconnect the proposed solar facility to MID’s existing electric system by connecting to an existing 69-kV sub-transmission line and 12-kV distribution line. Power generated by the Project would be delivered directly to MID pursuant to the terms of a 25-year power purchase agreement. Decommissioning of the project and site restoration to pre-existing use could occur after 25 years.
Project Components Specifically, the Project would comprise the following components:
Solar field comprised of a combination of 1- and 1.5-MW power blocks.
On-site substation.
Operation and Maintenance (O&M) building.
69-kV electrical switchyard.
Approximately 700-foot-long, 69-kV double-circuit overhead electric sub-transmission line, and 12-kV distribution line.
Approximately 7.5 miles of new overhead fiber optic cable.
Control building.
Other on-site improvements, including access roads, fencing, lighting, and landscaping.
Construction of the entire Project would occur over 10 consecutive months, expected to begin in September 2011, with an anticipated completion by end of July 2012. Construction of the proposed MID switchyard, sub-transmission line, and fiber optic cable is expected to take 6 months, and would occur within the 10-month overall Project construction timeframe.

Executive Summary
McHenry Solar Project ES-4 May 2011 Draft Environmental Impact Report
ES.5 Alternatives
No Project Alternative Under the No Project Alternative, the property would continue to be used for agriculture unless and until some other use was approved (consistent with applicable land use regulations and in accordance with available infrastructure and community services). The analysis of the No Project Alternative in this document focuses on a no-development/no Project scenario where the existing agricultural use is continued.
With a no-development scenario, the property would continue in agricultural use and the existing environmental setting would be maintained. Changes to that setting, including changes to the landscape (aesthetics, habitat, and land use/agriculture); construction-related noise, traffic, and air emissions would not occur; and environmental benefits relating to renewable energy would not occur on the site. Available irrigation and other infrastructure would remain in place, and, public and utility services would continue to be provided or available to the site and its occupants as they are now.
Reduced Project Alternative The Reduced Project Alternative would be a smaller version of the proposed Project using the same PV technology, but with a greater setback distance from McHenry Avenue (along the west property line) and Patterson Road (along the south property line). The greater setbacks would place the solar panels further from the edge of the roadways and would allow for more landscape planting, which in turn, would allow for a more dense screening of the solar panels from motorists and other passers-by. Increasing the setback distance would reduce the area available for solar panel installation, and thus, would decrease the amount of energy that could be produced. The 300-foot setback along McHenry Avenue and Patterson Road – if this alternative is implemented – would reduce the solar panel area by approximately 10 percent, which would reduce the generating capacity of the site by at least 3 MW (the array layout is based on a combination of 1- and 1.5-MW power blocks, so the output loss would be in 1- or 1.5-MW increments).
Non-Agriculture Site Alternative The Non-Agriculture Site Alternative consists of locating the facility at the former Shell Lab Site, which is located in Stanislaus County approximately 4 miles southwest of the proposed Project site. The site is on approximately 29 acres of land zoned Planned Industrial. A variety of buildings and other structures currently exist on the site. To prepare the site for installation of solar panels, these existing structures would need to be demolished and removed, and the site graded. Because the site is already flat, grading would be limited to only that necessary to re-establish the existing grade subsequent to demolition and removal of the structures. Because the size of the site is approximately 20 percent of the proposed Project site, the energy output of the site would similarly be approximately 20 percent of the proposed Project – approximately

Executive Summary
McHenry Solar Project ES-5 May 2011 Draft Environmental Impact Report
5 MW. The actual energy output could be slightly less or slightly more than this estimated amount, depending on the final design configuration of power blocks on the site.
ES.6 Environmentally Superior Alternative
CEQA Guidelines §15126.6(e)(2) requires an EIR to identify an environmentally superior alternative. If the environmentally superior alternative is the No Project Alternative, the EIR also must identify an environmentally superior alternative from among the other alternatives. In general, the environmentally superior alternative is defined as that alternative with the least adverse impacts to the project area and its surrounding environment.
The No Project Alternative would avoid all impacts of the proposed Project and would not create any new significant impacts of its own. However, as noted in Section 4.8.5, the No Project Alternative would result in the continued long-term adverse impacts associated with greenhouse gas emissions compared to implementation of the proposed Project. The CEQA Guidelines define the environmentally superior alternative as that alternative with the least adverse impacts to the project area and its surrounding environment; therefore, the No Project Alternative is considered the environmentally superior alternative for CEQA purposes because it would not create any of the localized impacts of the Project, even though its total net effect on the environment would be less beneficial than that of the Project. The No Project Alternative would fail to meet the basic Project Objectives of assisting MID in meeting its Renewable Portfolio Standard and goals aimed at reducing GHG emissions by locating a PV solar plant within MID’s electric service territory as near as possible to existing electrical sub-transmission and distribution facilities.
Among the remaining two alternatives (Reduced Project and Non-Agriculture Site), neither would result in any new significant impacts, so the comparison of alternatives and the Project is reduced to minor distinctions between impacts that would be less than significant or mitigated to less than significant. Neither the Non-Agriculture Site Alternative nor the Reduced Project Alternative would result in a material lessening of adverse impacts associated with the Project, but each alternative would result in less renewable energy than would the Project. Therefore, the Project is considered the environmentally superior alternative.
ES.7 Areas of Controversy and Issues to be Resolved
Areas of controversy known to the lead agencies, including issues raised by agencies and the public, must be identified in the Executive Summary of an EIR (Cal. Code Regs. §15123). The scoping phase of the EIR, conducted from December 6, 2010 to January 5, 2011, identified the following key areas of concern for consideration in the EIR.
Agricultural resources, including use of buffers and conversion of prime farmland;
Air quality, including construction emissions and toxic air contaminants;
Location of proposed access driveway;
Grading and drainage impacts on adjacent roadways;

Executive Summary
McHenry Solar Project ES-6 May 2011 Draft Environmental Impact Report
Use of the project site after decommissioning;
Aesthetics and visibility of the site from adjacent roadways.
ES.8 Summary of Impacts and Mitigation Measures
This section summarizes the resource areas evaluated in this EIR, as well as impacts of implementation of the Project and alternatives.
Resource Areas Evaluated This section summarizes the potential impacts of implementing the Project or alternatives. The affected environment and the potential direct and indirect effects of the Project and alternatives are described and evaluated in Chapter 4 of this EIR for the resource areas listed below. The comparative analysis of alternatives is in Chapter 5 and the cumulative impact analysis is in Chapter 6. Other CEQA considerations are in addressed in Chapter 7. Chapter 4 is organized into the following 18 environmental resource or issue areas:
4.1 Aesthetics, Visual Quality, and Light and Glare 4.10 Hydrology and Water Quality 4.2 Agriculture and Forest Resources 4.11 Land Use and Planning 4.3 Air Quality 4.12 Mineral Resources 4.4 Biological Resources 4.13 Noise 4.5 Cultural and Paleontological Resources 4.14 Population and Housing 4.6 Energy Conservation 4.15 Public Services 4.7 Geology and Soils 4.16 Recreation 4.8 Greenhouse Gas Emissions 4.17 Transportation and Traffic 4.9 Hazards and Hazardous Materials 4.18 Utilities and Service Systems
Summary of Impacts A summary table (Table ES-1) is included at the end of this Executive Summary that provides a summary of the impacts of the Project for each of the resource areas assessed in this EIR. Detailed analysis of impacts is contained in Chapter 4. No impacts were indentified for:
Land Use and Planning Public Services Mineral Resources Recreation Population and Housing
Impacts were found to be less than significant for:
Aesthetics, Visual Quality, and Light and Glare Hydrology and Water Quality Agriculture and Forest Resources Noise Energy Conservation Utilities and Service Systems Geology and Soils

Executive Summary
McHenry Solar Project ES-7 May 2011 Draft Environmental Impact Report
Implementing the Project could result in the potential for significant impacts to occur for:
Air Quality Greenhouse Gas Emissions Biological Resources Hazards and Hazardous Materials Cultural and Paleontological Resources Transportation and Traffic
Where potentially significant impacts are identified, mitigation measures are proposed that would reduce the extent of the impacts to a less than significant level. There are no impacts associated with the Project that would be significant and unavoidable.
Table ES-2 compares the conclusions of the impact analyses for the alternatives against the conclusions for the Project. The comparative analysis summarized in Table ES-2 shows that there are no potential impacts for which the proposed Project is the Least Preferred alternative, and there are two potential impacts for which the proposed Project is the Preferred alternative (for the other 16 potential impacts, there is no preferred alternative).

Executive Summary
McHenry Solar Project ES-8 May 2011 Draft Environmental Impact Report
TABLE ES-1 SUMMARY OF IMPACTS AND MITIGATION FOR THE PROPOSED PROJECT
Environmental Impact
Significance before
Mitigation Mitigation Measures
Significance after
Mitigation
Aesthetics, Visual Quality, and Light and Glare
Impact 4.1-1: The Project could degrade the existing visual character or quality of the site and its surroundings.
Less than Significant
None required
Impact 4.1-2: The Project would create a new source of light or glare which could adversely affect daytime or nighttime views in the area.
Potentially Significant
Mitigation Measure 4.1-2: Nighttime Construction Lighting. Nighttime construction lighting, if required, shall be shielded and oriented downward to minimize effects on any nearby receptors. Lighting shall be directed toward active construction areas only, and shall have the minimum brightness necessary to ensure worker safety.
Less than Significant
Agriculture and Forest Resources
Impact 4.2-1: The Project would temporarily discontinue the current exclusive agricultural use (row crops) of Prime Farmland to a mix of agricultural use (grazing) and non-agricultural use.
Less than Significant
None required
Air Quality
Impact 4.3-1: Construction and decommissioning activities would generate emissions of criteria pollutants, including suspended and inhalable particulate matter and equipment exhaust emissions.
Potentially Significant
Mitigation Measure 4.3-1: Implement Dust Control Measures. The Applicant shall submit a Dust Control Plan to the APCO for approval prior to start of construction (and, subsequently, decommissioning) activities. The Plan shall cover both Applicant and MID activities, and shall require implementation of the following dust control measures.
All disturbed areas, including storage piles, that are not being actively used for construction purposes, shall be effectively stabilized of dust emissions using water, chemical stabilizer/suppressant, covered with a tarp or other suitable cover, or vegetative ground cover.
All on-site unpaved roads and off-site unpaved access roads shall be effectively stabilized of dust emissions using water or chemical stabilizer/suppressant.
All land clearing, grubbing, scraping, excavation, land leveling, grading, cut and fill, and demolition activities shall be effectively controlled of fugitive dust emissions using application of water or by presoaking.
When materials are transported off-site, all material shall be covered or effectively wetted to limit visible dust emissions, and at least six inches of freeboard space from the top of the container shall be maintained.
Limit or expeditiously remove trackout (i.e., accumulation of mud or dirt from Project-related vehicle tires) from adjacent public streets near the Project access points. Trackout shall be immediately removed from public streets when it extends 50 or more feet from the Project access points; otherwise trackout shall be removed at the end of each workday. (The use of dry rotary brushes is expressly prohibited except where preceded or accompanied by sufficient wetting to limit the visible dust emissions.)(Use of blower devices is expressly forbidden).
Less than Significant

Executive Summary
TABLE ES-1 (Continued) SUMMARY OF IMPACTS AND MITIGATION FOR THE PROPOSED PROJECT
McHenry Solar Project ES-9 May 2011 Draft Environmental Impact Report
Environmental Impact
Significance before
Mitigation Mitigation Measures
Significance after
Mitigation
Air Quality (cont.)
Impact 4.3-1 (cont.) Following the addition of materials to, or removal of materials from, the surface of outdoor storage piles, said piles shall be effectively stabilized of fugitive dust emissions using sufficient water or chemical stabilizer/suppressant.
Limit traffic speed on unpaved on-site roads to 15 mph.
Install sandbags or other erosion control measures to prevent silt runoff to public roadways from sites with a slope greater than one percent.
Install windbreaks at windward side(s) of construction areas.
Suspend excavation and grading activity when winds exceed 20 mph.
Impact 4.3-2: Operation of the Project would generate exhaust emissions of criteria pollutants from routine operations.
Less than Significant
None required
Impact 4.3-3: The Project could result in permanently disturbed land that would serve as a source of fugitive dust emissions.
Less than Significant
None required
Impact 4.3-4: Construction and decommissioning emissions associated with the Project could result in emissions of ozone precursors and particulate matter that would be cumulatively considerable.
Potentially Significant
Mitigation Measure 4.3-4: Implement Mitigation Measure 4.3-1. Less than Significant
Impact 4.3-5: Operation and maintenance of the Project could generate emissions of criteria pollutants that would be cumulatively considerable.
Less than Significant
None required
Impact 4.3-6: The Project would generate emissions of criteria pollutants, potentially exposing sensitive receptors to harmful pollutant concentrations.
Potentially Significant
Mitigation Measure 4.3-6: Implement Mitigation Measure 4.3-1. Less than Significant
Impact 4.3-7: The Project would generate emissions of Toxic Air Contaminants, potentially exposing sensitive receptors to harmful pollutant concentrations.
Less than Significant
None required

Executive Summary
TABLE ES-1 (Continued) SUMMARY OF IMPACTS AND MITIGATION FOR THE PROPOSED PROJECT
McHenry Solar Project ES-10 May 2011 Draft Environmental Impact Report
Environmental Impact
Significance before
Mitigation Mitigation Measures
Significance after
Mitigation
Biological Resources
Impact 4.4-1: Applicant Project activities could result in potential disturbance or loss of Swainson’s hawk and their habitat.
Potentially Significant
Mitigation Measure 4.4-1a: Preconstruction Surveys for Swainson’s Hawk. If Project-related construction or decommissioning activities are planned to occur during the nesting period (March 1 to September 15), the Applicant shall engage a qualified biologist to conduct preconstruction surveys for Swainson’s hawk and their nests no more than 14 days before the start of construction or decommissioning activities within 0.25 mile of the Project site where access is available. Survey results shall be submitted to CDFG at least three days prior to the start of construction or decommissioning activities. If active nests are not identified, no further action is required and construction/decommissioning may proceed. If active nests are identified, the Applicant shall consult with CDFG to develop and implement suitable avoidance measures, consistent with the Staff Report Regarding Mitigation for Impacts to Swainson’s Hawks in the Central Valley of California (CDFG, 1994). To avoid impacting breeding efforts, no construction or decommissioning activities shall occur between March 1 and September 15 within 500 feet of an active nest that could cause nest abandonment or forced fledging. These buffers may be reduced in consultation with CDFG.
Depending on conditions specific to each active nest, and the relative location and rate of construction or decommissioning activities, it may be feasible for such activities to occur as planned within the buffer without impacting the breeding effort. In this case (to be determined in consultation with CDFG), the nest(s) shall be monitored by a qualified biologist during construction or decommissioning within the buffer. The monitor shall have “stop work” authority. If, in the professional opinion of the monitor Project activities are negatively affecting the nesting behavior of the bird, the monitor shall stop all such activities within the designated buffer. Construction or decommissioning activities shall not resume until either the monitor has determined that the young have fledged the nest or as otherwise approved by CDFG.
With CDFG concurrence, construction activities that are initiated outside the nesting season may continue even if raptors choose to nest within 500 feet of work activities. Thus, work may continue without delay if surveys verify the local absence of nesting raptors, or if construction begins outside the nesting period (September 16 to February 28).
Less than Significant
Mitigation Measure 4.4-1b: Reduce Construction Noise Levels. If it appears that noise or vibration from vibratory post driving associated with Project construction (or other similar noise-generating construction or decommissioning activity) could affect nesting Swainson’s hawks that arrive after the start of construction, specific measures, including but not limited to use of noise dissipaters, shall be implemented to reduce noise levels. During post driving, a noise level of no greater than 85 decibels (measured at the nest) shall be used as general guidance for nests that are established after construction.
Impact 4.4-2: MID activities could result in potential disturbance or loss of Swainson’s hawk and their habitat.
Potentially Significant
Mitigation Measure 4.4-2: Avian-safe Transmission Line (MID). Transmission poles should be designed using criteria identified in Avian Power Line Interaction Committee (APLIC, 2006).
Less than Significant

Executive Summary
TABLE ES-1 (Continued) SUMMARY OF IMPACTS AND MITIGATION FOR THE PROPOSED PROJECT
McHenry Solar Project ES-11 May 2011 Draft Environmental Impact Report
Environmental Impact
Significance before
Mitigation Mitigation Measures
Significance after
Mitigation
Biological Resources (cont.)
Impact 4.4-3: Project activities could impact other tree-nesting raptors and/or protected nesting migratory birds.
Potentially Significant
Mitigation Measure 4.4-3: Preconstruction Raptor Surveys (Applicant). If Project-related construction and/or decommissioning activities are to occur during the breeding period for nesting raptors and/or protected nesting migratory birds (February 1 through August 31), the Applicant shall engage a qualified biologist to conduct preconstruction surveys of all potential habitat within 500 feet of the Project site no more than 14 days prior to the start of construction or decommissioning activities. If active nests are not identified, no further action is necessary. If active nests are identified during preconstruction surveys, a no-disturbance buffer shall be created around active raptor nests and nests of other special-status birds during the breeding season, or until it is determined by the qualified biologist that all young have fledged. Typical buffers are 500 feet for raptors and 250 feet for other nesting birds (e.g., waterfowl, and passerine birds). The size of these buffer zones and types of construction or decommissioning activities allowed in these areas could be further modified in coordination with CDFG and shall be based on existing noise and disturbance levels in the Project area.
Less than Significant
Impact 4.4-4: Project activities could result in potential disturbance or loss of burrowing owls and their habitat.
Potentially Significant
Mitigation Measure 4.4-4a: Preconstruction Burrowing Owl Surveys (Applicant). The Applicant shall engage a qualified biologist to conduct preconstruction surveys for burrowing owls 14 to 30 days prior to the start of construction or decommissioning, using the most current CDFG protocol. Surveys shall cover grassland areas within a 500-foot buffer from all Project construction/decommissioning activities that are within suitable grasslands habitat, including checking for adult and juvenile burrowing owls and owl nests. If owls are detected during surveys, occupied burrows shall not be disturbed.
Construction/decommissioning exclusion areas (e.g., orange exclusion fence or signage) shall be established around the occupied burrows, where no disturbance shall be allowed. During the nonbreeding season (September 1 through January 31), the exclusion zone shall extend 160 feet around occupied burrows. During the breeding season (February 1 through August 31), exclusion areas shall extend 250 feet around occupied burrows.
If the above requirements cannot be met, passive relocation of on-site owls may be implemented as an alternative, but only during the nonbreeding season and only with prior CDFG approval. Passive relocation shall be accomplished by installing one-way doors on the entrances of burrows located within 160 feet of the Project area. The one-way doors shall be left in place for 48 hours to ensure the owls have left the burrow. The burrows shall then be excavated with a qualified biologist present. Construction/decommissioning shall not proceed until the Project area is deemed free of owls by the qualified biologist.
Less than Significant
Mitigation Measure 4.4-4b: Preconstruction Burrowing Owl Surveys (MID). Prior to construction, MID shall conduct pre-construction surveys for burrowing owl for the sub-transmission/distribution line and fiber optic cable alignment. These surveys shall be conducted using the most up-to-date CDFG published protocols (e.g., CDFG's 1995 Staff Report on Burrowing Owl Mitigation). If owls are detected during surveys, occupied burrows shall not be disturbed.

Executive Summary
TABLE ES-1 (Continued) SUMMARY OF IMPACTS AND MITIGATION FOR THE PROPOSED PROJECT
McHenry Solar Project ES-12 May 2011 Draft Environmental Impact Report
Environmental Impact
Significance before
Mitigation Mitigation Measures
Significance after
Mitigation
Cultural and Paleontological Resources
Impact 4.5-1: The proposed Project could potentially cause an adverse change in the significance of a unique archaeological resource pursuant to §15064.5.
Potentially Significant
Mitigation Measure 4.5-1: If Cultural Resources are Discovered During Ground-Disturbing Activities, Suspend Work until Resource is Evaluated. Prior to the initiation of site preparation or start of construction (and, subsequently, decommissioning), the Applicant shall retain a qualified professional archaeologist to complete an archaeological resources training program for construction workers involved in grading and excavation activities. Training shall include awareness and recognition of archaeological materials and the procedures to follow if construction crews encounter such materials in the course of earthwork, excavation, or grading. If archaeological resources are encountered, all activity within 50 feet of the find shall cease until it can be evaluated by a qualified archaeologist. Prehistoric archaeological materials could include obsidian and chert flaked-stone tools (e.g., projectile points, knives, scrapers) or toolmaking debris; culturally darkened soil (“midden”) containing heat-affected rocks, artifacts, or shellfish remains; and stone milling equipment (e.g., mortars, pestles, handstones, or milling slabs); and battered stone tools, such as hammerstones and pitted stones. Historic-period materials could include stone, concrete, or adobe footings and walls; filled wells or privies; and deposits of metal, glass, and/or ceramic refuse. The archaeologist shall notify the Applicant and MID if the resource may be significant. An appropriate treatment plan for the resources shall then be developed by the Applicant for approval by MID. The archaeologist shall consult with Native American representatives in determining appropriate treatment for prehistoric or Native American cultural resources, if discovered.
In considering any suggested mitigation proposed by the archaeologist, the Applicant and MID shall determine whether avoidance is feasible in light of factors such as the nature of the find, project design, costs, and other considerations. If avoidance is not feasible, other appropriate measures (e.g., data recovery) shall be instituted. Work may proceed in other parts of the Project site while mitigation for cultural resources in other areas of the site is being carried out.
Less than Significant
Impact 4.5-2: The proposed Project could potentially destroy a unique paleontological resource or site or unique geologic feature.
Potentially Significant
Mitigation Measure 4.5-2: If Paleontological Resources are Discovered During Ground-Disturbing Activities, Suspend Work until Resource is Evaluated. Prior to the initiation of site preparation or start of construction (and, subsequently, decommissioning), the Applicant shall retain a qualified professional paleontologist or a California Registered Professional Geologist (California RPG) with appropriate paleontological expertise, as defined by the Society of Vertebrate Paleontology’s Conformable Impact Mitigation Guidelines Committee (SVP 1995 Guidelines), to carry out a paleontological resources training program for construction workers involved in grading and excavation activities. Training shall include awareness and recognition of potential fossil materials and the procedures to follow if construction crews encounter fossil materials in the course of earthwork, excavation, or grading. If construction crews discover potential fossils, all earthwork or other types of ground disturbance within 50 feet of the find shall stop immediately until the qualified professional paleontologist can assess the nature and importance of the find. Based on the scientific value or uniqueness of the find, the monitor may record the find and allow work to continue, or recommend salvage and recovery of the fossil. The Applicant shall require the paleontologist to be “on-call” throughout the duration of ground-disturbing activities.
Less than Significant

Executive Summary
TABLE ES-1 (Continued) SUMMARY OF IMPACTS AND MITIGATION FOR THE PROPOSED PROJECT
McHenry Solar Project ES-13 May 2011 Draft Environmental Impact Report
Environmental Impact
Significance before
Mitigation Mitigation Measures
Significance after
Mitigation
Cultural and Paleontological Resources (cont.)
Impact 4.5-3: The proposed Project could potentially disturb any human remains, including those interred outside of formal cemeteries.
Potentially Significant
Mitigation Measure 4.5-3: Halt Work if Human Skeletal Remains are Identified During Construction. If human skeletal remains are uncovered during Project construction (and, subsequently, decommissioning), work shall immediately halt within 100 feet of the find. The Applicant shall contact the Stanislaus County Coroner to evaluate the remains and shall follow the procedures and protocols set forth in §15064.5(e)(1) of the CEQA Guidelines. If the County Coroner determines that the remains are Native American, the Applicant shall contact the Native American Heritage Commission, in accordance with Health and Safety Code Section 7050.5, subdivision (c), and Public Resources Code 5097.98 (as amended by AB 2641). The Native American Heritage Commission will designate a Most Likely Descendent of the deceased Native American, who will provide recommendations as to the future disposition of the remains.
Less than Significant
Energy Conservation
Impact 4.6-1: The construction, operation and maintenance, and decommissioning of the Project could result in consumption of energy.
Less than Significant
None required
Impact 4.6-2: Construction, operation and maintenance, and decommissioning of the Project would require use of transportation energy.
Less than Significant
None required
Impact 4.6-3: The Project’s overall use of efficient transportation alternatives would be limited.
Less than Significant
None required
Geology and Soils
Impact 4.7-1: The Project could expose people or structures to potential adverse effects, including the risk of loss, injury, or death involving strong seismic ground shaking and earthquake-induced ground failure (such as liquefaction and lateral spreading).
Less than Significant
None required
Impact 4.7-2: The Project could result in soil erosion or loss of topsoil.
Less than Significant
None required
Impact 4.7-3: The Project could be located on expansive soil, as defined in Table 18-1-B of the Uniform Building Code (1994), creating risks to life or property.
Less than Significant
None required

Executive Summary
TABLE ES-1 (Continued) SUMMARY OF IMPACTS AND MITIGATION FOR THE PROPOSED PROJECT
McHenry Solar Project ES-14 May 2011 Draft Environmental Impact Report
Environmental Impact
Significance before
Mitigation Mitigation Measures
Significance after
Mitigation
Geology and Soils (cont.)
Impact 4.7-4: The Project site could have soils incapable of adequately supporting the use of septic tanks or alternative wastewater disposal systems where sewers are not available for the disposal of wastewater.
Less than Significant
None required
Greenhouse Gas Emissions
Impact 4.8-1: The Project would result in emissions of greenhouse gases that would contribute to global climate change.
Less than Significant
None required
Impact 4.8-2: The Project could conflict with the California Air Resources Board’s Climate Change Scoping Plan.
Potentially Significant
Mitigation Measure 4.8-2: Low SF6 Leak Rate Circuit Breaker and Monitoring. The Applicant shall ensure that the circuit breaker installed at the proposed new substation has a guaranteed SF6 annual leak rate of no more than 0.5 percent by volume. The Applicant shall provide Modesto Irrigation District with documentation of compliance, such as specification sheets, prior to installation of the circuit breaker. In addition, the Applicant shall monitor the SF6-containing circuit breaker at the substation consistent with Scoping Plan Measure H-6 for the detection and repair of leaks.
Less than Significant
Hazards and Hazardous Materials
Impact 4.9-1: Project construction, decommissioning, and operation/maintenance could create a hazard to the public or the environment through the routine transport, use, or disposal of hazardous materials.
Less than Significant
None required
Impact 4.9-2: The Project could result in an accidental spill or leak during construction or decommissioning that could release hazardous materials into the environment.
Potentially Significant
Mitigation Measure 4.9-2: Accidental Spill Prevention and Response Plan. The Applicant shall prepare an Accidental Spill Prevention and Response Plan for construction and decommissioning activities for review and approval by Modesto Irrigation District. The plan shall identify measures to prevent accidental spills from leaving the site and methods for responding to and cleaning up spills to limit the amount of materials released into the environment. Such measures shall include, but not be limited to, ensuring that absorbent material, tarps, storage drums, and other emergency spill supplies and equipment are kept at the Project site at all times.
Less than Significant
Hydrology and Water Quality
Impact 4.10-1: The Project could potentially degrade water quality such that it could violate water quality standards or waste discharge requirements.
Less than Significant
None required

Executive Summary
TABLE ES-1 (Continued) SUMMARY OF IMPACTS AND MITIGATION FOR THE PROPOSED PROJECT
McHenry Solar Project ES-15 May 2011 Draft Environmental Impact Report
Environmental Impact
Significance before
Mitigation Mitigation Measures
Significance after
Mitigation
Hydrology and Water Quality (cont.)
Impact 4.10-2: The Project could alter the existing drainage pattern of the site in a manner that could result in erosion or sedimentation on- or off-site, or which could contribute to flooding.
Less than Significant
None required
Impact 4.10-3: The Project could create or contribute runoff water that could exceed the capacity of existing or planned stormwater drainage systems or provide additional sources of polluted runoff.
Less than Significant
None required
Impact 4.10-4: The Project could expose people or structures to a risk of loss, injury, or death involving flooding, including flooding as a result of the failure of a levee or dam.
Less than Significant
None required
Land Use and Planning
The Project would have no impacts in this resource area.
Mineral Resources
The Project would have no impacts in this resource area.
Noise
Impact 4.13-1: Project-related post driving would result in exposure of persons to groundborne vibration.
Less than Significant
None required
Impact 4.13-2: Operation and maintenance of the Project would increase local ambient noise levels.
Less than Significant
None required
Impact 4.13-3: Project construction and decommissioning activities would temporarily increase local ambient noise levels.
Less than Significant
None required
Population and Housing
The Project would have no impacts in this resource area.
Executive Summary
TABLE ES-1 (Continued) SUMMARY OF IMPACTS AND MITIGATION FOR THE PROPOSED PROJECT
McHenry Solar Project ES-16 May 2011 Draft Environmental Impact Report
Environmental Impact
Significance before
Mitigation Mitigation Measures
Significance after
Mitigation
Public Services
The Project would have no impacts in this resource area.
Recreation
The Project would have no impacts in this resource area.
Transportation and Traffic
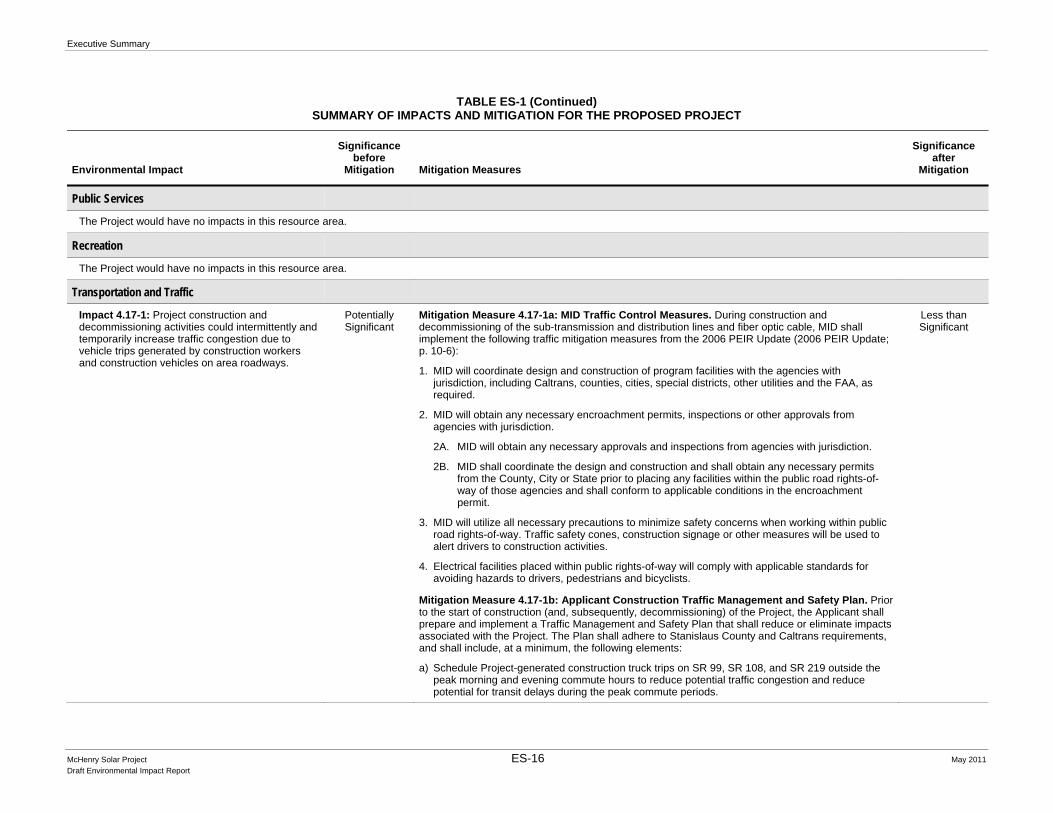
Impact 4.17-1: Project construction and decommissioning activities could intermittently and temporarily increase traffic congestion due to vehicle trips generated by construction workers and construction vehicles on area roadways.
Potentially Significant
Mitigation Measure 4.17-1a: MID Traffic Control Measures. During construction and decommissioning of the sub-transmission and distribution lines and fiber optic cable, MID shall implement the following traffic mitigation measures from the 2006 PEIR Update (2006 PEIR Update; p. 10-6):
1. MID will coordinate design and construction of program facilities with the agencies with jurisdiction, including Caltrans, counties, cities, special districts, other utilities and the FAA, as required.
2. MID will obtain any necessary encroachment permits, inspections or other approvals from agencies with jurisdiction.
2A. MID will obtain any necessary approvals and inspections from agencies with jurisdiction.
2B. MID shall coordinate the design and construction and shall obtain any necessary permits from the County, City or State prior to placing any facilities within the public road rights-of-way of those agencies and shall conform to applicable conditions in the encroachment permit.
3. MID will utilize all necessary precautions to minimize safety concerns when working within public road rights-of-way. Traffic safety cones, construction signage or other measures will be used to alert drivers to construction activities.
4. Electrical facilities placed within public rights-of-way will comply with applicable standards for avoiding hazards to drivers, pedestrians and bicyclists.
Less than Significant
Mitigation Measure 4.17-1b: Applicant Construction Traffic Management and Safety Plan. Prior to the start of construction (and, subsequently, decommissioning) of the Project, the Applicant shall prepare and implement a Traffic Management and Safety Plan that shall reduce or eliminate impacts associated with the Project. The Plan shall adhere to Stanislaus County and Caltrans requirements, and shall include, at a minimum, the following elements:
a) Schedule Project-generated construction truck trips on SR 99, SR 108, and SR 219 outside the peak morning and evening commute hours to reduce potential traffic congestion and reduce potential for transit delays during the peak commute periods.

Executive Summary
TABLE ES-1 (Continued) SUMMARY OF IMPACTS AND MITIGATION FOR THE PROPOSED PROJECT
McHenry Solar Project ES-17 May 2011 Draft Environmental Impact Report
Environmental Impact
Significance before
Mitigation Mitigation Measures
Significance after
Mitigation
Transportation and Traffic (cont.)
Impact 4.17-1 (cont.) b) Comply with transportation permit requirements of Caltrans and CHP when scheduling Project-generated construction truck trips carrying oversized loads. In addition, provide pre-notification to local police, fire, and emergency service providers of the timing, location, and duration of construction activities that could affect the movement of emergency vehicles on area roadways.
c) Place signs (e.g., “Slow Trucks”, and/or “Trucks Turning Ahead”) along appropriate roads to notify drivers of construction traffic throughout the duration of the construction period.
Impact 4.17-2: The Project could conflict with established congestion management programs on affected roads or highways.
Less than Significant
None required
Impact 4.17-3: Project construction and decommissioning activities could substantially increase traffic hazards due to construction in or adjacent to roads.
Potentially Significant
Mitigation Measure 4.17-3: Implement Mitigation Measures 4.17-1a and 4.17-1b. Less than Significant
Impact 4.17-4: The Project could result in inadequate emergency access.
Potentially Significant
Mitigation Measure 4.17-4: Develop an Emergency Access Plan for the Site. The Applicant shall develop and implement an Emergency Access Plan, which shall include evacuation routes and strategies to ensure accessibility and mobility for project area and emergency vehicles. Additional measures include developing an emergency action plan that identifies roles and responsibilities during emergencies and to update the plan regularly.
Less than Significant
Utilities and Service Systems
Impact 4.18-1: The proposed Project would require or result in the construction of new stormwater drainage facilities, the construction of which could cause significant environmental effects.
Less than Significant
None required

Executive Summary
McHenry Solar Farm ES-18 May 2011 Draft Environmental Impact Report
TABLE ES-2 PROPOSED PROJECT VS. ALTERNATIVES
SUMMARY OF ENVIRONMENTAL IMPACT CONCLUSIONS
Resource Area Proposed Project Reduced Project Alternative Non-Agriculture Site Alternative
Aesthetics, Visual Quality, and Light and Glare
Impacts determined to be Less than Significant.
No Preference
Impacts would be similar to but slightly less than the proposed Project.
No Preference
Impacts would be slightly greater than the proposed Project during construction and decommissioning, but slightly less than the proposed Project during operation.
No Preference
Agriculture and Forest Resources
Impacts determined to be Less than Significant.
No Preference
Impacts would be similar to proposed Project.
No Preference
Impacts would be similar to proposed Project.
No Preference
Air Quality Impacts determined to be Less than Significant with Mitigation.
No Preference
Impacts would be similar to but slightly less than the proposed Project.
No Preference
Impacts would be similar to or slightly greater than the proposed Project.
No Preference
Biological Resources
Impacts determined to be Less than Significant with Mitigation.
No Preference
Impacts would be similar to the proposed Project.
No Preference
Impacts would be similar to but slightly less than the proposed Project.
No Preference
Cultural and Paleontological Resources
Impacts determined to be Less than Significant with Mitigation.
No Preference
Impacts would be similar to the proposed Project.
No Preference
Impacts would be potentially greater than the proposed Project, but still mitigable to Less than Significant.
No Preference
Energy Conservation
Impacts determined to be Less than Significant; beneficial contribution resulting from generation of renewable energy.
Preferred
Impacts would be similar to but slightly less than the proposed Project; less of a beneficial contribution than the proposed Project due to less renewable energy generation.
No Preference
Impacts would be similar to but slightly less than the proposed Project; less of a beneficial contribution than the proposed Project due to substantially less renewable energy generation.
Least Preferred
Geology and Soils Impacts determined to be Less than Significant.
No Preference
Impacts would be similar to the proposed Project.
No Preference
Impacts would be similar to the proposed Project.
No Preference
Greenhouse Gas Emissions
Impacts determined to be Less than Significant with Mitigation; overall beneficial impact from net GHG reduction.
Preferred
Impacts determined to be Less than Significant with Mitigation; slightly less overall beneficial impact than proposed Project from lower net GHG reduction.
No Preference
Impacts determined to be Less than Significant with Mitigation; less overall beneficial impact than proposed Project from substantially lower net GHG reduction.
Least Preferred

Executive Summary
TABLE ES-2 (Continued) PROPOSED PROJECT VS. ALTERNATIVES
SUMMARY OF ENVIRONMENTAL IMPACT CONCLUSIONS
McHenry Solar Farm ES-19 May 2011 Draft Environmental Impact Report
Resource Area Proposed Project Reduced Project Alternative Non-Agriculture Site Alternative
Hazards and Hazardous Materials
Impacts determined to be Less than Significant with Mitigation.
No Preference
Impacts would be similar to but slightly less than the proposed Project.
No Preference
Impacts would be potentially greater than the proposed Project, but still mitigable to Less than Significant.
No Preference
Hydrology and Water Quality
Impacts determined to be Less than Significant.
No Preference
Impacts would be similar to the proposed Project.
No Preference
Impacts would be similar to but slightly greater than the proposed Project.
No Preference
Land Use and Planning
No impacts.
No Preference
Impacts would be similar to the proposed Project.
No Preference
Impacts would be similar to the proposed Project.
No Preference
Mineral Resources
No impacts.
No Preference
Impacts would be similar to the proposed Project.
No Preference
Impacts would be similar to the proposed Project.
No Preference
Noise Impacts determined to be Less than Significant.
No Preference
Impacts would be similar to but slightly less than the proposed Project.
No Preference
Impacts would be greater than the proposed Project, but still mitigable to Less than Significant.
No Preference
Population and Housing
No impacts.
No Preference
Impacts would be similar to the proposed Project.
No Preference
Impacts would be similar to the proposed Project.
No Preference
Public Services No impacts.
No Preference
Impacts would be similar to the proposed Project.
No Preference
Impacts would be similar to the proposed Project.
No Preference
Recreation No impacts.
No Preference
Impacts would be similar to the proposed Project.
No Preference
Impacts would be similar to the proposed Project.
No Preference
Transportation and Traffic
Impacts determined to be Less than Significant with Mitigation.
No Preference
Impacts would be similar to but slightly less than the proposed Project.
No Preference
Impacts would be less than the proposed Project.
No Preference
Utilities and Service Systems
Impacts determined to be Less than Significant.
No Preference
Impacts would be similar to but slightly less than the proposed Project.
No Preference
Impacts would be similar to but slightly less than the proposed Project.
No Preference

McHenry Solar Farm 1-1 May 2011 Draft Environmental Impact Report
CHAPTER 1 Introduction
1.1 Purpose of This Document
This Environmental Impact Report (EIR) is an informational document intended to disclose to the public and decision-makers the potential environmental impacts of the McHenry Solar Farm (the Project) proposed by Solar Star California VIII, LLC1 (Solar Star, or Applicant). This document assesses the direct, indirect, and cumulative environmental impacts that could occur as a result of the construction, operation, maintenance, and eventual decommissioning of the Project. The analysis in this document is based upon information submitted to the lead agency, the Modesto Irrigation District (MID), as part of the Applicant’s Large Generating Facility Interconnection Request, as well as information contained in the Applicant’s Use Permit (UP) application to the Stanislaus County Department of Planning & Community Development, as well as from independent studies and research conducted by the EIR preparers.
This EIR examines the potential impacts of the Project and alternatives to the Project. All of the resource areas in the California Environmental Quality Act (CEQA) Guidelines Appendix G Checklist were studied: Aesthetics, Agriculture and Forest Resources, Air Quality, Biological Resources, Cultural Resources, Energy Conservation, Geology and Soils, Greenhouse Gas Emissions, Hazards and Hazardous Materials, Hydrology and Water Quality, Land Use and Planning, Mineral Resources, Noise, Population and Housing, Public Services, Recreation, Transportation and Traffic, and Utilities and Service Systems.
1.2 Project Overview
The Applicant proposes to construct, operate, and ultimately decommission a 25-megawatt alternating current (MWac) photovoltaic (PV) electricity generating facility and associated infrastructure on approximately 154 acres in northern unincorporated Stanislaus County, to be known as the McHenry Solar Farm. The proposed site is located between the City of Riverbank and the community of Del Rio, along Patterson Road near its intersection with McHenry Avenue. The Project would generate and deliver solar-generated power to the MID sub-transmission and distribution system.
As part of the Project, MID is proposing to construct, own, and operate a switching station in a new switchyard to be located adjacent to the proposed on-site Project substation. The substation would interconnect a new overhead 69-kilovolt (kV) sub-transmission line and 12-kV distribution line to 1 Solar Star California VIII, LLC is a wholly-owned subsidiary of the SunPower Corporation.

1. Introduction
McHenry Solar Farm 1-2 May 2011 Draft Environmental Impact Report
the proposed solar facility and the existing MID electric system by connecting to an existing 69-kV sub-transmission line and 12-kV distribution line along McHenry Avenue.
1.3 Use of this Document by Agencies
CEQA Guidelines § 15124(d) requires that an EIR contain a statement briefly describing the intended uses of the EIR. The CEQA Guidelines indicate that the EIR should identify the ways in which the Lead Agency and any responsible agencies would use this document in their approval or permitting processes. The following discussion summarizes the roles of the agencies and the intended uses of the EIR.
1.3.1 Modesto Irrigation District MID is the lead agency for CEQA compliance in evaluation of SolarStar LLC’s proposed McHenry Solar Farm, and has directed the preparation of this EIR. Interconnection of the proposed solar power plant to MID’s electric grid must be preceded by MID’s discretionary action to approve a Large Generator Interconnection Agreement (LGIA), which would define all facilities necessary to safely and reliably operate MID’s electric system with the Project. This EIR will be used by MID, in conjunction with other information developed in MID’s formal record, when considering whether to approve the LGIA. Pursuant to CEQA requirements, MID will determine the adequacy of the Final EIR and, if determined adequate, MID will certify the document as complying with CEQA. If MID approves this project with significant and unavoidable environmental impacts, it must state why in a Statement of Overriding Considerations, which would be included in MID’s decision regarding the LGIA.
1.3.2 Other Agencies Several other agencies will rely on information in this EIR to inform them in their decision regarding the issuance of specific permits related to project construction or operation. These include, but are not limited to, a UP, Encroachment Permit, Grading Permit, and Building Permit from Stanislaus County. No federal agencies are expected to have reviewing and/or permitting authority. Details about requisite permits are provided in Table 1-1.
1.4 Public Review and Comment
1.4.1 Scoping On December 6, 2010, MID published and distributed a Notice of Preparation (NOP) to advise interested local, regional, and State agencies, Native American tribal organizations, and interested public, that an EIR would be prepared for the proposed Project. The NOP solicited both written and verbal comments on the EIR’s scope during a 30-day comment period. Additionally, the NOP presented the background, purpose, description, and location of the proposed Project, potential issues to be addressed in the EIR, and contact information for additional information regarding the Project.

1. Introduction
McHenry Solar Farm 1-3 May 2011 Draft Environmental Impact Report
TABLE 1-1 SUMMARY OF POTENTIAL PERMIT REQUIREMENTS
Agency Permits and Other Requirements Jurisdiction/Purpose
State Agencies California Department of Transportation
Encroachment Permit Construction, operation, and maintenance within, under, or over state highway right-of-way (ROW)
California Regional Water Quality Control Board
National Pollutant Discharge Elimination System Construction Storm water Permit
Storm water discharges associated with construction activities disturbing more than one acre of land
Section 401 Water Quality Certification (or waiver)
Certifies that project is consistent with state water quality standards
Office of Historic Preservation Section 106 Review, National Historic Preservation Act
Construction, operation, and maintenance on land that may affect cultural or historic resources
Local Agencies Stanislaus County Use Permit Permit to allow the Project as a
conforming use in an A-2 district.
Encroachment Permit (ministerial) Construction, operation, and maintenance within, under, or over city or county road ROW
Building and Grading Permits (ministerial)
Site grading and construction of on-site structures
During the 30-day public scoping period, interested parties were able to submit written comments on the scope of issues to be included in the EIR for the proposed Project. There were 15 letters or emails received during the scoping period. Appendix A to this EIR contains the Scoping Report, which includes a copy of the NOP, the NOP mailing list, a detailed description of all written comments received, a description of comments that are not within the scope of CEQA, and copies of the written comments.
The overarching themes of the written comments in the Scoping Report that fall within the purview of the CEQA process follow.
Impacts to aesthetics;
Impacts from loss of farmland;
Impacts related to grading and drainage (runoff);
Impacts to air quality from construction equipment emissions and earth disturbance;
Impacts to biological resources;
Impacts to historical and archaeological resources; and,
Ensure that alternatives are adequately addressed.

1. Introduction
McHenry Solar Farm 1-4 May 2011 Draft Environmental Impact Report
1.4.2 Public Comment on the Draft EIR This Draft EIR is being circulated to local and state agencies and to interested individuals who may wish to review and comment on the report. Written comments may be submitted to MID during the 45-day public review period. Written comments on this Draft EIR will be accepted via regular mail, fax, and e-mail and at a public meeting that will be noticed under separate cover. All comments received will be addressed in a Response to Comments document, which, together with this Draft EIR, will constitute the Final EIR for the proposed Project.
This Draft EIR identifies the environmental impacts of the proposed Project on the existing environment, indicates how those impacts would be mitigated or avoided, and identifies and evaluates alternatives to the proposed Project. This document is intended to provide MID with the information required to exercise its jurisdictional responsibilities with respect to the proposed Project, which would be considered at a separately noticed public meeting of the MID Board of Directors.
CEQA requires that a Lead Agency shall neither approve nor implement a project, as proposed, unless the significant environmental impacts have been reduced to an acceptable level. An acceptable level is defined as eliminating, avoiding, or substantially lessening significant environmental effects to below a level of significance. If the Lead Agency approves a project, although significant impacts identified in the Final EIR cannot be fully mitigated, the Lead Agency must state in writing the reasons for its action. Findings and a Statement of Overriding Considerations must be included in the record of project approval and mentioned in the Notice of Determination (NOD).
1.5 Reader’s Guide to this EIR
This EIR is organized as follows:
Executive Summary. Provides a summary description of the proposed Project, the alternatives, and the Environmentally Superior Alternative. Also provides a tabulation of the impacts and mitigation measures for the proposed Project and alternatives.
Chapter 1, Introduction. Provides a brief description the proposed Project, outlines the public agency use of the EIR, describes the scoping process, and describes how a Final EIR will be prepared.
Chapter 2, Project Description. Describes the Purpose and Need for the proposed Project, identifies the Project Objectives, and provides a detailed description of the proposed Project.
Chapter 3, Alternatives. Provides a description of the alternatives screening and evaluation process, a description of alternatives considered but eliminated from further analysis and the rationale for doing so, and a description of the alternatives analyzed in Chapter 4.

1. Introduction
McHenry Solar Farm 1-5 May 2011 Draft Environmental Impact Report
Chapter 4, Environmental Analysis. Analyzes each environmental resource area, including: a) the setting, which describes environmental conditions and regulatory information; b) the standards for determining the level of potential environmental impacts for each issue; c) potential impacts, which indicate the environmental effects that are anticipated from the Project; and d) mitigation measures for impacts that are identified as potentially significant.
Chapter 5, Comparison of Alternatives. Provides a discussion of the relative advantages and disadvantages of the proposed Project and the alternatives that were evaluated, and identifies the CEQA Environmentally Superior Alternative.
Chapter 6, Cumulative Impacts. Identifies the projects considered in the cumulative analysis, and describes the cumulative impacts of the proposed Project when considered together with other past, present, and reasonably foreseeable future projects.
Chapter 7, Other CEQA Considerations. Provides a discussion of growth-inducing impacts, significant environmental effect that cannot be avoided, and irreversible environmental changes.
Chapter 8, Report Preparers. Identifies the authors and reviewers of this Draft EIR
Chapter 9, Glossary and Acronyms. Presents definitions of terms and a list of acronyms used throughout the EIR.
Chapter 10, Mitigation Monitoring Plan. Provides a discussion of the mitigation monitoring program requirements for the Project.
Appendix A. Contains the Scoping Report, which includes the NOP as well as copies of comments received on the NOP.
Appendix B. Contains emission calculation spreadsheets for criteria air pollutants and greenhouse gases.
Appendix C. Contains the results of the environmental database search for hazardous materials.

McHenry Solar Farm 2-1 May 2011 Draft Environmental Impact Report
CHAPTER 2 Project Description
2.1 Project Overview
Solar Star California VIII, LLC1 (Solar Star, or Applicant) proposes to construct, operate, and ultimately decommission a 25-megawatt alternating current (MWac) photovoltaic (PV) electricity generating facility and associated infrastructure on approximately 154 acres in northern unincorporated Stanislaus County, to be known as the McHenry Solar Farm (Project). The Project would generate and deliver solar-generated power to the MID sub-transmission and distribution system.
As part of the Project, MID is proposing to construct, own, and operate a switching station in a new switchyard, to be located adjacent to the proposed on-site Project substation, and a new overhead 69-kilovolt (kV) sub-transmission line and 12-kV distribution line. The new sub-transmission and distribution lines would interconnect the proposed solar facility to the existing MID electric system by connecting to an existing 69-kV sub-transmission line and 12-kV distribution line along McHenry Avenue. Construction of the interconnection for the proposed solar power plant would be preceded by MID’s discretionary action to approve the Large Generator Interconnection Agreement (LGIA). The LGIA would define all facilities necessary to safely and reliably operate MID’s electric system with the Project.
Major components of the proposed Solar Star facilities are:
Solar field comprised of a combination of 1- and 1.5-MW power blocks
On-site substation
Operation and Maintenance (O&M) building
Other site improvements, including access roads, fencing, lighting, and landscaping
Major components of the proposed MID facilities are:
69-kV electrical switchyard on the Project site
Approximately 700-foot-long 69-kV double-circuit overhead electric sub-transmission line and 12-kV distribution line
1 Solar Star California VIII, LLC is a wholly-owned subsidiary of the SunPower Corporation.

2. Project Description
McHenry Solar Farm 2-2 May 2011 Draft Environmental Impact Report
Approximately 7.5 miles of new overhead fiber optic cable to be installed on the poles of an existing distribution and 69-kV sub-transmission line system
A control building
Major project development milestones are (dates are approximate):
September 2011: start construction
March 2012: begin commercial operation
July 2012: project completion.
The Project would operate year-round, and would have the capacity to produce 25 MW of solar power. The Project would generate electricity during daylight hours when electricity demand is at its peak, and would provide for the annual electricity needs of approximately 6,000 residences.
2.2 Project Location and Existing Land Use
The proposed site is located in northern unincorporated Stanislaus County between the City of Riverbank and community of Del Rio, along Patterson Road near the intersection with McHenry Avenue, and consists of Assessor’s Parcel Numbers (APNs) 074-002-021, -029, -030, and -031. The residence and associated buildings located on a portion of these parcels are not part of the Project site. The site location is shown in Figure 2-1.
The site is designated for agricultural use in the Stanislaus County General Plan (Stanislaus County, 2008; p. 1-36) and is zoned Exclusive Agriculture with a 40-acre minimum parcel size (A-2-40) pursuant to Zoning Map in Chapter 20 of the Stanislaus County Code. The County Code allows for the Planning Commission to authorize a utility facility in zone A-2 Section 21.20.030. Current land use within the Project site is predominantly agricultural, and includes row cropping (strawberries), agricultural facilities such as irrigation lines, and related access roads and staging areas. An existing dirt road that is aligned through the center of the site perpendicular to Patterson Road contains a buried irrigation system. The buried irrigation pipeline also is aligned parallel to and approximately 215 feet north of Patterson Road, crossing the site from the eastern edge to the existing dirt road.
McHenry Avenue and Patterson Road bound the western and southern portions of the Project site, respectively. Beyond these two roads are orchards, ancillary agricultural uses (including staging areas and farm residences) and a furniture store. To the northwest is the community of Del Rio. Land uses in Del Rio are primarily single-family residences and also includes the privately-owned Del Rio Golf and Country Club. The lands to the north and east of the site consist of orchards, agricultural-related staging areas, rural farm residences, and open space surrounding the Lower Stanislaus River which is located approximately 1 mile northwest of the Project site.
An existing 69-kV sub-transmission line is aligned along on the west side of McHenry Avenue adjacent to the Project site. This sub-transmission line crosses to the east side of McHenry Avenue at the northwest corner of the site (Figure 2-1).

McHenry Solar Farm . 209517.01Figure 2-1
Project Site Location MapSOURCE: Stanislaus County GIS, 2010 McHenry Solar Farm . 209517.01
Figure 2-1Project Site Location Map
SOURCE: Stanislaus County GIS, 2010
Project Site
Residence (notpart of project)
Agriculture
074-007-003102.32acres
004-076-00795.89acres
074-002-001305.49acres
004-077-01585.39acres
004-076-00357.04acres
074-002-01456.16acres
004-001-05779.62acres
074-002-01134.44acres
074-007-00429.28acres
074-007-01628.26acres
074-002-02621acres
074-007-01820.04acres
004-077-01619.73acres
004-077-01719.71acres
074-007-01111.63acres
074-007-01010.33acres
074-007-0199.68acres
074-003-022366.22acres
074-002-00632.35acres
074-002-01027.44acres
074-003-02140.9acres
074-007-01337.62acres
074-002-03317.1acres
074-003-01623.94acres
074-007-01526.32acres
074-002-01311.63acres
074-007-01413.19acres
074-002-0324.79acres
074-007-0122.76acres
074-007-0171.99acres
074-002-03149.17acres
074-002-03040.2acres
074-002-02939.43acres074-002-021
28.1acres
074-002-03423.87acres
074-002-0075.46acres
MC
HE
NR
Y A
VE
LADD RDPATTERSON RD
SK
ITT
ON
E R
D
STEWART RD
BE
LTIS
DR
HARTLEY DR
DE
L C
IEL
O W
Y
SP
Y G
LA
SS
DR
SH
ER
RY
LN
SOURCE: Staninslaus County GIS, 2010
Project Location
Merced County
Stanislaus County
San Joaquin County TuolumneCounty
§̈¦5
ST132
ST108ST99
"
McHenry Solar Farm. 209517.01
Figure -1McHenry Solar Farm
Site Location Map
Zoning Designation
EXCLUSIVE AGRICULTURE- 40 ACRE
PLANNED DEVELOPMENT
RURAL RESIDENTIAL
0 1,000
Feet
Modesto M
ain C
anal
Modesto M
ain C
anal
2-3

2. Project Description
McHenry Solar Farm 2-4 May 2011 Draft Environmental Impact Report
2.3 Project Purpose and Need
The California Renewable Portfolio Standard legislation enacted in 2002 (Senate Bill 1078) and accelerated in 2006 requires retail sellers of electricity to obtain 20 percent of their supply of electricity from renewable energy sources, such as solar, by 2010. Governor Schwarzenegger also set a state-wide goal of achieving a 33 percent renewable energy share by 2020 to reduce the impact of greenhouse gases on the environment. The 33 percent goal was enacted into law by Governor Brown on April 13, 2011 with his signing of Senate Bill 2X. Power generated by the Project would be delivered directly to MID pursuant to the terms of a 25-year power purchase agreement.
MID currently obtains approximately 27 percent of its electrical supply from renewable energy sources (MID, 2010; p. 2). All but one percent of that renewable energy comes from wind energy projects, all of which are located outside of MID’s system and many of which are located in Oregon’s Columbia River Gorge. MID has a need to diversify its renewable energy portfolio by procuring power with more predictable operating characteristics than wind power. Unlike wind, local solar power would provide peak electricity generation that would coincide well with MID’s customer peak load (sunny, hot summer days). Local solar power would also avoid line losses associated with transmitting electricity over long distances from remote sources. In this context, the Applicant and MID are proposing the Project as an economically viable source of clean renewable electricity generation that helps meet California’s growing demand for power, fulfills numerous state and national renewable energy policies and goals, and provides important geographic and source diversity for MID’s energy portfolio.
2.4 Project Objectives
The objectives for the Project are to:
Assist MID in meeting its Renewable Portfolio Standard and goals aimed at reducing greenhouse gas (GHG) emissions.
Further MID’s efforts to achieve its goals for renewable energy generating capacity within MID’s total energy portfolio.
Diversify MID’s renewable energy portfolio, which is presently 96 percent wind powered, by adding solar power, which has more predictable operating characteristics.
Assist in meeting MID’s peak power load by adding solar power capacity, which has peak generation on sunny, hot summer days.
Increase transmission efficiency of MID’s renewable energy portfolio by locating solar power plant facilities within MID’s electric service territory and as near as possible to existing electrical sub-transmission and distribution facilities, which reduces line losses associated with transmitting electricity over long distances.

2. Project Description
McHenry Solar Farm 2-5 May 2011 Draft Environmental Impact Report
To the extent feasible, site the project on disturbed land to avoid or minimize impacts to special-status species or habitat.
To the extent feasible, site the project on land that would not require cancelation of a Williamson Act contract.
Use a proven and available solar photovoltaic technology that qualifies as an Eligible Renewable Energy Resource pursuant to Public Utilities Code Section 399.12, Public Resources Code Section 25741, and the California Energy Commission’s “Renewable Portfolio Standard: Eligibility Guidebook” (CEC, 2008).
Ensure that the Project can be constructed in a technologically feasible manner and operated in a manner that allows electricity to be provided at a competitive price.
Upgrade MID’s operational communications to enhance the reliability of MID’s electric system.
Accommodate a mix of agricultural and non-agricultural uses of the site by making the land underneath the solar panel array available for grazing.
Decommission the Project after its useful life and restore the Project site to its pre-existing agricultural use.
2.5 Project Facilities
The Project facilities are described in detail below.
2.5.1 Solar Panel Array The Project would be configured as a solar panel array comprised of solar photovoltaic panels made of high efficiency monocrystalline silicon with anti-reflective glass. The solar panel array would generate electricity directly from sunlight, collect it to a single point at the Project substation, and interconnect it to MID’s sub-transmission and distribution system for delivery to its customers. The solar panel array configuration would use approximately 150 acres of the site (Figure 2-2).
2.5.2 Modular Power Block and Cabling The solar panel array would contain a combination of 1- and 1.5-MW modular power blocks, depending on final site design. Each 1-MW power block would be approximately 6 acres in size, and would contain 72 rows of solar PV panels with 4 “strings” of 10 panels per row. Each 1.5-MW power block would be approximately 9 acres in size, and would contain 108 rows of solar PV panels, also with 4 “strings” of 10 panels per row. Individual PV panels and rows would be electrically connected together in series to carry direct current (DC) electricity. Multiple DC strings would be wired into an aboveground combiner box to merge the strings into a single high-current cable. From the combiner boxes, the cabling would be installed underground approximately 3 feet deep to inverters housed in containers (7 feet wide, 11.6 feet long, 6.6 feet

2. Project Description
McHenry Solar Farm 2-6 May 2011 Draft Environmental Impact Report
tall) mounted on small concrete pads (0.5 foot thick) distributed across the site. The inverters would change the DC output from the combiner boxes to alternating current (AC) electricity. Next, the AC electricity for the modular power block would be increased to medium voltage with a standard “step-up” transformer. The medium voltage cabling would create one to two collection circuits that would carry the electricity from the modular power blocks to the Project substation. The medium voltage collection circuits would be installed underground to the substation in trenches that would be approximately 3 feet deep.
2.5.3 Tracker Unit Each modular power block is typically comprised of individual tracker units (four for the 1-MW power block and six for the 1.5-MW power block). The tracker units contain the rows of solar PV panels oriented in the north-south direction. The tracker units would rotate the rows of solar PV panels from east to west throughout the day following the sun to maximize exposure to sunlight; thereby, maximizing electrical output. The rows of each tracker unit would be linked together and rotated in unison by an industrial-grade system controller and drive unit. A schematic of the proposed tracker is shown in Figure 2-3. The tracker units would include seven major components, described below:
Drive Unit. Within a tracker unit, multiple rows of solar PV panels would be linked by a steel drive strut, which would be oriented perpendicular to the axis of rotation. Each row would be connected to the drive strut by a torque arm, which acts as a lever, enabling the drive strut to rotate the rows together as the drive unit moves the drive strut forward and backward. The drive unit typically is mounted at the first row in a tracker unit, and consists of a 0.5-horsepower bi-directional AC motor that rotates the drive strut via an industrial-grade screw jack. The drive unit would be connected to an industrial-grade variable-frequency drive (VFD) that translates commands from the control computer into AC voltage that applies power to the motor, the screw jack, and finally to the drive strut and the rows.
Tracker Controller. The Tracker controller is a self-contained industrial-grade control computer that would incorporate all of the software needed to operate the system. The controller would include a liquid crystal display (LCD) monitor that displays a combination of calibration parameters and status values, providing field personnel with a user-friendly configuration and diagnostic interface. The LCD would enable field adjustment, calibration, and testing.
PV Panels. The system would incorporate high-efficiency commercially-available Underwriters Laboratory (UL)-listed solar PV panels that are made from monocrystalline silicon, anti-reflective glass, aluminum frame, and copper electrical wires with plastic sheathing. By design, the solar PV panels would absorb sunlight to maximize electrical output and use anti-reflective glass, resulting in approximately half the reflectance of standard residential and commercial glass (SunPower, 2008). Due to the limited rotation angles, the solar PV panels have no potential for reflecting the sun’s rays upon any ground-based observer off-site. These panels would be protected from impact by tempered glass, and would have factory applied ultraviolet (UV)- and weather-resistant “quick connect” wire connectors.

Project Site
McHenry Solar Farm . 209517.01Figure 2-2
Project Site PlanSOURCE: SunPower, 2010
2-7

THIS PAGE INTENTIONALLY LEFT BLANK

McHenry Solar Farm . 209517.01Figure 2-3
SunPower Tracker Unit Schematic DiagramSOURCE: SunPower, 2010
2-9

2. Project Description
McHenry Solar Farm 2-10 May 2011 Draft Environmental Impact Report
Steel Tracking Structure. The steel tracking structure would be able to withstand high-wind conditions (up to 90 miles per hour (mph)), site-specific wind gust and aerodynamic pressure effects, and seismic events. The frame would be elevated to approximately 5 feet above the ground and would consist of long horizontal beams atop vertical posts.
DC-AC Inverter. The inverter would change the electrical current from DC, which is produced in the solar cells, to AC, which is distributed to MID’s customers.
Combiner Boxes. Combiner boxes would merge the DC module wiring into a single high-current cable.
Data Acquisition System (DAS). Integrated with the inverter, this system is made up of multiple components including a data logger and sensors to record AC power output. Other integrated components include equipment to record weather conditions, including ambient temperature measured in degrees Celsius (°C), incoming solar radiation measured in watts per square meter (W/m2), and wind speed measured in meters per second (m/s). The DAS enables system data transfer and performance monitoring via the Project on-site Operation & Maintenance (O&M) facility and SunPower’s Operations Center located in Richmond, California.
2.5.4 Project Substation The proposed substation (approximately 13,000 square feet, 130 feet by 100 feet) would collect the medium voltage circuits that carry power from the individual modular power blocks. The substation would contain metering equipment, switchgear, a series of fuses and circuit breakers that act as protective relays, and transformers to step-up the voltage to match the voltage of the sub-transmission grid at MID’s Ladd Road Substation. Electricity would flow from the Project substation through the main transformer where it would be stepped up from 34-kV medium voltage to the 69-kV interconnection voltage of MID’s electric system. The location of the proposed substation is shown on Figure 2-2.
2.5.5 Operation and Maintenance (O&M) Building The Project includes an operation and maintenance (O&M) building located adjacent to the proposed Project substation and the proposed MID switchyard. The design and construction of this building would be consistent with county building standards. The approximately 2,000-square-foot O&M building would provide offices, materials storage, an equipment warehouse, and restroom facilities.
The O&M building would be a pre-engineered steel building approximately 17 feet high at its peak with a neutral-colored steel siding to minimize visual impact. The maintenance area of the building would include roll-up doors to provide equipment access to the maintenance portion of the building as well as personal access doors. Figure 2-4 provides an elevation drawing of a typical O&M building. A parking area with six parking spaces would be provided, and would comply with applicable requirements of the county building code and zoning ordinance.

Exhibit M - Elevation Drawings of O&M Facility
McHenry Solar Farm . 209517.01Figure 2-4
Operations and Maintenance Building ElevationsSOURCE: SunPower, 2010
WEST SIDE ELEVATION
SOUTH ELEVATION
EAST SIDE ELEVATION
NORTH ELEVATION
2-11

2. Project Description
McHenry Solar Farm 2-12 May 2011 Draft Environmental Impact Report
2.5.6 Other Site Improvements
Access Roads
Access roads would be developed for ingress and egress, and between the solar array rows to facilitate installation, maintenance, and cleaning of the solar panels. Locations of the proposed access roads are shown in the site plan on Figure 2-2. During decommissioning of the facility, it is anticipated that the same access roads would be used for removal of the facility components.
Fencing and Site Security
As necessary for public safety and site security, the Applicant would install a 6- to 8-foot-high fence around the perimeter of the Project site with landscaping installed at key locations to minimize visibility. At the O&M building, substation, and site entrance, exterior security lighting would be installed to provide for safe access to the building and project facilities. Security personnel would monitor the facility during non-business hours and times when no O&M staff would be present on-site. Security personnel would be the first responders to any incidents on the Project site and would escalate to local law enforcement only as necessary.
Lighting
Exterior security lighting would be provided at the O&M building. Lighting also would be provided at the main entrance to the facility on McHenry Road and at the proposed Project substation and switchyard for safety and security. Lights would be shielded or directed downward to reduce off-site light scatter, and would remain on from dusk to dawn.
Landscape Plan
A landscape buffer of appropriate drought tolerant trees and shrubs would be installed along the western side and segments of the southern side of the Project site to create a visual screen of the solar panel array along McHenry and Patterson roads. Additional perimeter landscaping would be installed at key corners and other locations to minimize visibility of the project from sensitive receptors. The Project would include site preparation with a short staple grass mix suitable for grazing. The landscape plan would include specifications for long-term maintenance. The proposed landscaping would comply with the County Code - Chapter 21.102 Landscape and Irrigation Standards. See Figure 2-5 for a conceptual depiction of proposed landscaping.
2.5.7 Water Requirements and Waste Generation
Water and Wastewater
During construction, the primary use of water would be for dust control. Water may also be needed to moisture condition the soils for proper compaction at roads and foundations. The estimated construction-related water demand is 10 acre-feet, although actual demand may vary by several acre-feet, depending on the season that construction work occurs. Water from an on-site well that is currently used to irrigate the site would be used for Project construction.

McHenry Solar Farm . 209517.01Figure 2-5
Conceptual Landscape PlanSOURCE: SunPower, 2010
Note: Views A and B depict typical variability of planting patterns along the landscape buffer.
2-13

TH
IS P
AG
E IN
TE
NT
ION
AL
LY
LE
FT
BL
AN
K

2. Project Description
McHenry Solar Farm 2-15 May 2011 Draft Environmental Impact Report
During operation and maintenance, drinking water and process water would also be supplied by the existing on-site well and would require on-site treatment for domestic use and to provide the necessary water quality for solar panel cleaning. Water treatment would be accomplished using a local vendor such as Culligan to provide a “whole house” system with self-contained replaceable treatment cylinders identical to systems used in residential applications. During the life of the Project, the panels would be washed approximately two to four times per year. Approximately 2 to 4 acre-feet per year would be needed for this use. No wastewater would be generated during panel washing because the water used would simply soak into the soil or would evaporate. Restroom facilities would be provided in the O&M building and would be served by a private septic system to be developed on-site.
During Project decommissioning and site restoration, dust control would be needed and several acre-feet of water may be used, depending on the time of year that those activities would occur. Restroom facilities during Project construction and decommissioning would be provided by portable units to be serviced by licensed providers.
Hazardous Materials and Hazardous Waste
Construction and decommissioning of the Project would involve the use of hazardous materials, such as fuels and greases to fuel and service construction equipment. Such substances may be stored in temporary aboveground storage tanks or sheds located on the Project site. The fuels stored on-site would be in a locked container within a fenced and secure temporary staging area. Trucks and construction vehicles would be serviced from off-site facilities. The use, storage, transport, and disposal of hazardous materials used in construction of the facility would be carried out in accordance with federal, state, and county regulations. No extremely hazardous substances (i.e., those governed pursuant to Title 40, Part 335 of the Code of Federal Regulations) are anticipated to be produced, used, stored, transported, or disposed of as a result of project construction. Material Safety Data Sheets for all applicable materials present on-site would be made readily available to on-site personnel, as required by the Stanislaus County Environmental Health Services Department.
Operation and maintenance of the Project is not expected to require hazardous materials or to generate hazardous waste. The transformers proposed to be located at the Project substation would use biodegradable seed oil, which is not a hazardous material (Cooper Power Systems, 2005). Oil disposal would occur in accordance with applicable regulations. PV panels and inverters would produce no waste during operation.
Non-Hazardous Solid Waste
All waste materials that could not be reused or recycled would be categorized by the Applicant to guarantee proper final disposal. Examples of disposable wastes include wood from cribbing and packing materials and miscellaneous refuse generated during construction. All construction debris would be placed in appropriate on-site containers and periodically disposed of by a licensed hauler in accordance with applicable regulations. Non-hazardous construction materials that cannot be reused or recycled would likely be disposed of at municipal county landfills.

2. Project Description
McHenry Solar Farm 2-16 May 2011 Draft Environmental Impact Report
2.5.8 Sub-transmission/Distribution Line and Switchyard
MID Switchyard
The switchyard would be an integral part of the interconnection between the proposed solar power plant and MID’s existing electric system. Electricity would flow from the proposed on-site substation through the main transformer where it would be stepped up from 34-kV medium voltage to the 69-kV interconnection voltage of MID’s electric system. The interconnection to MID’s electric system would occur in a proposed MID switchyard that would contain power circuit breaker equipment and metering equipment for delivery of the output from the proposed power plant to MID’s electric system, as well as an electrical ground safety grid and concrete pads to support the switchyard equipment. An 800-square-foot (20 feet by 40 feet) control building would also be constructed within the MID switchyard that would house communications and other equipment used to reliably interconnect the solar facility to MID’s electric system. The control building would be a pre-engineered steel building approximately 17 feet high at its peak painted in a neutral color to minimize visual impact.
The proposed switchyard would occupy approximately 15,625 square feet (125 feet by 125 feet) on the Project site (Figure 2-2). Although it would be located within the fenced area of the 154-acre solar electric facility and accessible only by MID staff, the proposed switchyard would be fenced with an 8-foot-high cyclone fence topped with barbed wire, as required by MID security standards. The control building would be located within the security fence surrounding the proposed switchyard.
Sub-transmission and Distribution Line
MID is required to meet the electricity demand of the areas that it serves. Electricity that is generated a considerable distance from the ultimate consumers is delivered by 500-kV and 230-kV overhead transmission lines to bulk transmission substations that convert the 500-kV or 230-kV power to 115-kV (transmission lines) or 69-kV (sub-transmission lines) that is, in turn, conveyed to neighborhood distribution substations that reduce the power down to 12-kV (distribution lines) for commercial and residential customers. An existing 69-kV sub-transmission line (the Ladd-Clough line) is aligned on the west side of McHenry Avenue adjacent to the Project site (Figure 2-6). The Ladd-Clough line crosses to the east side of McHenry at the northwest corner of the site, and connects to MID’s existing Ladd Substation located near the intersection of Ladd Road and Tully Road and the Clough Substation located on Clough Avenue in Escalon, California.
The proposed overhead sub-transmission line would convey electricity generated at the proposed solar power plant to the Ladd and Clough Substations for distribution to customers within MID’s electric service area. The proposed sub-transmission line would require approximately 700 feet of 69-kV double-circuit2 overhead electric sub-transmission line along the north boundary of the Project site. That sub-transmission line would connect the proposed MID switchyard in a loop
2 A circuit consists of three conductors (wires), so a double-circuit would consist of six conductors.

500’
SCALE
Option 1
Option 2
Optional
ConnectionPoint
Proposed Interconnection
ExistingLadd-Clough
69-kV Line
ProposedConnection
Point
LEGEND
Proposed Interconnection
Option 1
Option 2
MID Switchyard
Power Plant Substation
MID Control Building
O&M Building
Project Boundary
N
To CloughSubstation
To LaddSubstation
Note: Only one of the three interconnection configurations and associated MID Switchyard, Power Plant Substation, Control Building, and O&M Building depicted in this figure will be selected.
McHenry Solar Farm . 209517.01Figure -6
Proposed Interconnection and Optional AlignmentsSOURCE: Sunpower 2010
LEGENDProposed Interconnection
Option 1
Option 2
MID Switchyard
Power Plant Substation
MID Control Building
O&M Building
Project Site Boundary
McHenry Solar Farm . 209517.01Figure 2-6
Proposed Interconnection, Optional Interconnection Alignments,and On-Site Interconnection Facilities
SOURCE: SunPower, 2010
Note: Only one of the three interconnection configurations and associated MID Switchyard, Power Plant Substation, Control Building, and O&M Building depicted in the figure would be selected.
2-17

2. Project Description
McHenry Solar Farm 2-18 May 2011 Draft Environmental Impact Report
configuration (three conductors going in and three conductors coming out of the switching equipment in the new switchyard) to the existing Ladd-Clough 69-kV line on the east side of McHenry Avenue at the northwest corner of the Project site.
To connect to the existing sub-transmission and distribution lines, the proposed alignment would require replacement of one existing 65-foot-tall wooden pole that has an existing 12-kV distribution line on it (located at the northwest corner of the proposed Project site) with one 65-foot-tall wooden pole to accommodate both the new double-circuit overhead sub-transmission line and the existing 12-kV distribution line. Approximately four new 65-foot-tall double-circuit wooden poles would be strung with a new 650-foot-long section of 69-kV overhead double-circuit sub-transmission line and 12-kV distribution line from the northeast corner of the proposed project site to the MID proposed switchyard. The poles would be spaced approximately 200 feet apart. A 50-foot-long span of the 69-kV double-circuit sub-transmission line would be strung from the 65-foot-tall double-circuit pole into the proposed MID switchyard. A total of approximately five new poles would be required for this alignment.
Two other options for the sub-transmission line alignment are being considered by MID and are analyzed in this EIR. They are:
Option 1: Approximately 300 feet of 69-kV double-circuit overhead electric sub-transmission line that would be constructed approximately 0.25 mile north of Patterson Road on the east side of McHenry Avenue. This alignment would connect the proposed MID switchyard in a loop configuration, three conductors going in and three conductors coming out of the switching equipment in the new switchyard, to the existing Ladd-Clough 69-kV line on the west side of McHenry Avenue.
To connect to the existing sub-transmission and distribution lines, the Option 1 alignment would replace one existing 65-foot-tall wooden pole that has an existing 12-kV distribution line on it (located approximately 0.25 north of Patterson Road on the west side of McHenry Avenue) with one 65-foot-tall wooden pole to accommodate both the new double-circuit overhead sub-transmission line and the existing 12-kV distribution line. From that pole, the new sub-transmission and distribution line would span McHenry Avenue approximately 200 feet to a new 65-foot-tall 69-kV/12-kV wooden pole that would be located on the north side of the proposed MID switchyard. From that pole, a new 50-foot-long span of 69-kV double-circuit overhead electric sub-transmission line and 12-kV distribution line would be strung to a new 65-foot-tall double-circuit wooden pole located within the proposed MID switchyard. A total of three new poles would be required for this option.
Option 2: Approximately 1,500 feet of 69-kV double-circuit overhead electric sub-transmission line would be constructed approximately 0.25 mile north of Patterson Road on the west side of McHenry Avenue. This alignment would connect the proposed MID switchyard in a loop configuration, three conductors going in and three conductors coming out of the switching equipment in the new switchyard, to the existing Ladd-Clough 69-kV line on the west side of McHenry Avenue.
To connect to the existing sub-transmission and distribution lines, the Option 2 alignment would replace one existing 65-foot-tall wooden pole that has an existing 12-kV distribution line on it (located approximately 0.25 mile north of Patterson Road on the west side of

2. Project Description
McHenry Solar Farm 2-19 May 2011 Draft Environmental Impact Report
McHenry Avenue) with one 65-foot-tall wooden pole to accommodate both the new double-circuit overhead sub-transmission line and the existing 12-kV distribution line. From that pole, the sub-transmission and distribution line would span McHenry Avenue and would be strung approximately 1,450 feet on eight new 65-foot-tall wooden poles spaced 200 feet apart on the Project site. A 50-foot-long span of 69-kV double-circuit overhead electric sub-transmission line and 12-kV distribution line would be strung into MID’s proposed switchyard. A total of nine new poles would be required for this option.
Figure 2-6 illustrates the proposed sub-transmission line alignment, as well as the alignments of Options 1 and 2 and the proposed locations of the MID switchyard and Project substation corresponding to each transmission line alignment option.
2.5.9 New Fiber Optic Cable Approximately 7.5 miles of new fiber optic cable is proposed to enhance the reliability of communications on MID’s electric system. MID proposes to install approximately 1 mile of cable from the existing Ladd Substation to the proposed MID switchyard, approximately 3.5 miles of cable from MID’s Clough Substation to the proposed MID switchyard, and approximately 3 miles of cable from MID’s Claribel Substation to the proposed MID switchyard (Figure 2-7). The new fiber optic cable would be installed on existing poles approximately 5 feet above the existing telecommunications line or at an elevation of approximately 35 feet from the ground.
2.6 Construction
Project construction would occur over approximately 10 months. Activities would include site preparation, solar array construction, distribution line installation and conductoring, and construction of the substation, switchyard, and O&M building. The construction activities would overlap one another, with grading and access road construction preceding the installation of trackers and associated equipment within each array area. The anticipated construction schedule and workforce are described in Section 2.6.8.
2.6.1 Site Preparation
Staging and Other Temporary Work Areas
A central staging area would be delineated at the site. It would include the temporary office trailers, parking for the construction workers, and a materials delivery area (where some materials would be stored in the open or in containers). Most materials would be scheduled to arrive at the site at the time that they are needed, and would be sent out immediately to the area where they would be installed. Some materials may be staged near where they are needed for a short period, but the production would be fairly fast, and these temporary staging areas would move around the Project site with the construction. The central staging area would be approximately 1 acre in size.

Clough Avenue
ClaribelSubstation
LaddSubstation
CloughSubstation
Project Site
N
McHenry Solar Farm . 209517.01Figure 2-7
Proposed Fiber Optic Cable AlignmentSOURCE: SunPower, 2010
Proposed New Fiber Optic Cable
Interconnection Option 1
Proposed Interconnection
Interconnection Option 2
2-20

2. Project Description
McHenry Solar Farm 2-21 May 2011 Draft Environmental Impact Report
Access Roads Access roads would be developed for ingress and egress, and between the solar array rows to facilitate installation, maintenance, and cleaning of the solar panels, and decommissioning of the facility. Three types of access roads are proposed:
The proposed site entrance would be located on McHenry Avenue at the northern boundary of the site near the O&M building and substation. The entrance road would be asphalt-paved over several inches of aggregate base from the street entrance to the O&M building, and would surround the building and parking stalls. Approximately 4 to 8 inches of Class 2 aggregate base would be added and compacted, and then paved over with 3 inches of asphalt concrete.
Roads in the center of the arrays between the O&M building and the inverter equipment pads would be graveled. Approximately 4 to 8 inches of Class 2 aggregate base would be added and compacted.
Perimeter roads would be comprised of compacted earth. Typically, the ground would be grubbed (cleared of vegetation), scarified (loosened up), moisture conditioned, compacted, and graded with a crown in the center and a swale on the side.
Construction-related Grading and Vegetation Management The site is essentially flat with an approximate 3-foot elevation drop across the site measured from east to west. Consequently, minimal to no grading is expected to be required to level the areas where Project facilities and tracker arrays would be located.
Some light grubbing and minimal grading is expected to be required for targeted leveling and trenching, and fine grading would be required for the development of site access roads. No fill material would be imported or exported. Earthmoving within the site boundary for solar array and equipment foundations and trenching is expected to be approximately 5,200 cubic yards. Earthmoving within the site boundary for road construction is expected to involve approximately 21,000 cubic yards.
To help with post-construction dust control, a re-vegetation plan would be developed and implemented to repair temporary disturbance from installation activities, and to be compatible with long-term site vegetation management.
Erosion and Sediment Control and Pollution Prevention During Construction A Stormwater Pollution Prevention Plan (SWPPP) would be developed for the construction of the facility. The SWPPP would include a combination of measures to protect areas that are determined to be vulnerable to erosion. Additionally, measures would be proposed in the SWPPP to control the tracking of mud onto the roads by construction vehicles.
2. Project Description
McHenry Solar Farm 2-22 May 2011 Draft Environmental Impact Report
Construction Materials During construction, the Project would involve the transport of general construction materials (e.g., concrete, aggregate, wood, metal, and fuel), as well as the materials necessary to construct the proposed solar PV array. Construction waste that is generated at the Project site would be sorted to separate recyclable and non-recyclable materials. It would be stored in dumpsters that would be serviced by a licensed solid waste hauler in the county. Non-hazardous construction debris that would be generated would be disposed of in local landfills, located within approximately 10 miles of the project site, in accordance with applicable regulations.
2.6.2 Solar Array Construction Support posts up to 18 feet long would be installed by vibratory post driving, which would involve inserting a steel pipe into the ground using a hydraulic vibratory post driver. The pipe would be approximately 5 inches in diameter by 18 feet long. The posts would be set so that approximately 4.5 feet of the post would remain above grade. This would be the foundation for the trackers. No blasting or rock breaking is anticipated to occur during project construction. Small-truck mounted cranes or grade-all forklifts would move materials through the site and support tracker construction. Array construction would include small all-terrain vehicles (ATVs) to transport materials and workers on access roads and array aisles.
Solar PV panels would be manufactured off-site and shipped to the site ready for installation. Concrete pads for the drive motors would be poured using concrete from an off-site local batch plant, located within approximately 10 miles of project site, and electrical equipment for the array would be set in place.
2.6.3 O&M Building Construction The O&M Building area would be surveyed and staked. An approximate 2,000-square-foot concrete slab would be built, corresponding to the dimensions of the building. The prefabricated steel building structure would then be assembled. The exterior finishes would be constructed as the mechanical and electrical systems are being built inside. Interior finishing work would follow, and final fixtures and equipment would be installed.
2.6.4 Substation and Switchyard Construction
Project Substation
Construction work within the substation site would include site preparation and installation of substructures and electrical equipment. The site would be initially cleared and graded and security fenced for the duration of substation construction. Underground Service Alert would be contacted to mark the locations of existing buried utilities in the vicinity. Substation materials and equipment would be delivered to and stored at the substation site, as required, during construction.

2. Project Description
McHenry Solar Farm 2-23 May 2011 Draft Environmental Impact Report
The substation would be constructed with conventional grading and construction equipment. Grading would establish the desired site grade, and minor excavation would provide concrete footings for the substation equipment. The substation site would be graveled with crushed rock for grounding and employee safety purposes.
MID Switchyard
Construction work within the switchyard site would be performed by MID crews and sub-contractors, including site preparation and installation of substructures and electrical equipment. Switchyard construction would be staged from existing MID maintenance yards in the Modesto vicinity and the switchyard site. The site would be initially cleared and graded and security fenced for the duration of switchyard construction. Underground Service Alert would be contacted to mark the locations of existing buried utilities in the vicinity. Switchyard materials and equipment would be delivered to and stored at the switchyard site, as required, during construction.
The switchyard would be constructed with conventional grading and construction equipment. Grading would establish the desired site grade, and minor excavation would provide concrete footings for the switchyard equipment. The switchyard site would be graveled with crushed rock for grounding and employee safety purposes.
2.6.5 Sub-transmission and Distribution Line Installation MID would construct the sub-transmission and distribution line. The lines would be installed on wood poles between the proposed MID switchyard and the point of connection at the Ladd-Clough 69-kV line along McHenry Avenue. All new wood poles would be approximately 65 feet tall. The pole design for the three sub-transmission line options being considered is shown in Figure 2-8.
Construction and installation of the 69-kV sub-transmission line would be the same regardless of which option is selected, and would consist of equipment delivery, drilling holes for new poles, pole assembly and erection, replacement of poles, followed by conductor stringing. All pole holes would be approximately 30 inches in diameter and 8 to 9 feet deep. MID would confine the construction activities at each pole location within an area approximately 20 feet wide by 100 feet long. The work would require de-energizing the existing 69-kV line and also possibly the 12-kV distribution line along McHenry Avenue. In addition, any of the three options would require the removal of one pole, disposing of it in a suitable facility, and the installation of a new pole in the existing hole.
MID would deliver the 69-kV sub-transmission line poles, arms, conductors, and other equipment to individual pole locations. A staging area would be established on the Project site to store heavy construction equipment and supplies. MID would install the wooden poles along existing public rights-of-way and private easements. Four to five vehicles would need to access each pole location to set the poles. Augering the hole would last approximately 15 to 30 minutes at each pole location. Any native soil not used to backfill around each pole would be spread around the pole. For the proposed alignment the maximum total temporary soil disturbance would be approximately 10,000 square feet, and the total permanent disturbance would be approximately 23 square feet. For

Figure 3-8. Profile of Proposed Wooden Pole Structures
65’-
00” (
typ
.)8’-
00” (
typ
.)
15” dia. (typ.)
McHenry Solar Farm . 209517.01Figure 2-8
Profile of Proposed Wooden Pole StructuresSOURCE: SunPower, 2010
2-24

2. Project Description
McHenry Solar Farm 2-25 May 2011 Draft Environmental Impact Report
Option 1, the maximum total temporary soil disturbance would be approximately 4,000 square feet, and the total permanent disturbance would be approximately 15 square feet. For Option 2, the maximum total temporary soil disturbance would be approximately 18,000 square feet, and the total permanent disturbance would be approximately 42 square feet.
2.6.6 Conductoring
Project Substation
Power plant conductoring consists of the installation of the conductors (i.e., wires) to connect the electricity-producing panels to the grid where it would be distributed to customers. The conductors within the array would be above ground and routed in cable trays. The conductors would then be collected and transitioned from the cable tray to a below-ground trench approximately 3 feet deep. The trench would be directed from the tracker unit to the inverter assemblies where the conductors would then be above ground and enter the inverter and transformer equipment. From there, the conductors would be routed to the on-site substation in below-ground trenches approximately 3 feet deep. The conductor from the on-site substation would be carried aboveground on wooden pole structures to the adjacent MID switchyard.
Sub-transmission Line and Distribution Line
When all poles are installed, reels of conductor and pull rope would be set at staging locations along the alignment. MID would string the conductors via the pull rope through rollers located on the insulators and pulled into place. The conductor for the proposed alignment would not cross McHenry Avenue; whereas, the conductor for both Options 1 and 2 would span McHenry Avenue once. MID would install the new sub-transmission line at the point of connection with the Ladd-Clough 69-kV line in less than one day. MID would use traffic safety cones, construction signage, and/or safety flag personnel to alert drivers to the presence of workers and equipment.
2.6.7 New Fiber Optic Cable The fiber optic cable would be installed on existing wood poles that carry either MID sub-transmission or distribution lines. It is anticipated that two crews would install the new fiber optic cable with the use of two line trucks. It is expected that installation of the new fiber optic cable would not require de-energizing the existing MID sub-transmission or distribution lines. The total duration of the installation is estimated to be three months with the crews working eight-hour days, five days a week (Monday through Friday).
2.6.8 Construction Overview
Construction Schedule and Workforce
Construction of the entire Project would occur over 10 consecutive months, expected to begin in September 2011, with an expected completion by end of July 2012. Construction of the proposed MID switchyard, sub-transmission line, and fiber optic cable is expected to take 6 months, and

2. Project Description
McHenry Solar Farm 2-26 May 2011 Draft Environmental Impact Report
would occur within the 10-month overall Project construction timeframe. Commercial operation of the solar farm could begin as soon as the interconnection is completed (approximately month 6), As shown in Table 2-1, the construction phases are expected to overlap, and the total number of construction workers is expected to range between 28 and 140, with the peak number of workers (144) on-site during months 4, 5, and 6.
TABLE 2-1 PROPOSED CONSTRUCTION SCHEDULE AND WORKFORCE
Month Construction Activities Anticipated Number
of Workers
Month 1 Site Preparation and post installation, switchyard/sub-transmission and distribution line alignment preparation work, fiber optic cable installation
43
Month 2 Post installation, concrete foundation construction and medium voltage conductoring, O&M building and substation/switchyard/sub-transmission and distribution line construction, fiber optic cable installation
88
Month 3 Post installation, concrete foundation construction and medium voltage conductoring, array assembly and array electrical wiring, O&M building and substation/switchyard/sub-transmission and distribution line construction, fiber optic cable installation, PV installation
111
Month 4 Concrete foundation construction, medium voltage conductoring, array assembly and array electrical wiring, O&M building and substation/ switchyard/sub-transmission and distribution line construction, PV installation
144
Month 5 Concrete foundation construction, medium voltage conductoring, array assembly and array electrical wiring, PV installation, and switchyard/sub-transmission and distribution line construction
144
Month 6 Concrete foundation construction, array assembly, array electrical wiring, PV installation, electrical equipment installation, and switchyard/sub-transmission and distribution line construction; initial commercial operation
144
Month 7 Array assembly, array electrical wiring, electrical equipment installation 103
Month 8 Array assembly, array electrical wiring, electrical equipment installation 80
Month 9 Array assembly, array electrical wiring, electrical equipment installation 65
Month 10 Commissioning, testing and start up activities 28
Construction Equipment
During construction, a variety of equipment and vehicles would be operating on the site. Table 2-2 provides a list of the type and number of equipment and vehicles expected to be required to construct each of Project components.
Construction Hours
Construction equipment would operate between the hours of 7:00 a.m. and 7:00 p.m. Monday through Friday. Nighttime and weekend construction work is not expected to be required, but may occur on occasion, depending on schedule considerations. All construction work, including any nighttime or weekend work, would comply with the Stanislaus County noise ordinance.

2. Project Description
McHenry Solar Farm 2-27 May 2011 Draft Environmental Impact Report
TABLE 2-2 CONSTRUCTION EQUIPMENT BY CONSTRUCTION PHASE
Equipment
Construction Phases
Site Preparation
Construction of Solar Array
Installation of Gen-tie Line,
Poles Fiber Optic
Cable
Substation and O&M Building
Backhoes 1 2 1 1
Cranes 1 1 1 1
Vibratory Post Drivers 6
Fork Lifts 1 4 1 1 1
Dozers 1 1
Excavator 1 1
Grader 1 1
Loaders, Rubber Tired 1 2 1 1
Rollers 1 1
Scrapers 1
Trenchers 1
Dump Truck 4 1 1
Water Truck 1 2
Concrete Truck 1 2 1 2
Flatbed Truck 20 2 2 4
Light Weight Truck 6 20 4 4 8
ATV Gator Carts 6 20
Construction Traffic
Project construction traffic primarily would include the delivery of construction equipment, vehicles and materials, and daily construction worker trips. A majority of the equipment (e.g., solar PV panels, inverters, tracker steel, transmission poles, substation circuit breakers, and substation steel) would be delivered to the site in standard widths and lengths by vans or covered flatbed trailers. Substation equipment, inverter enclosures, and cranes would be delivered to the site on wide-load trailers. These trailers would require pilot cars and are expected to make up to two round trips during their installation period. The Applicant would facilitate materials delivery during off-peak traffic hours, and would comply with all Caltrans permitting requirements if these loads are oversize.
A majority of the solar array materials would be transported by truck from the Oakland area. Major highways to be used would include Interstate 5 (I-5), Interstate 580 (I-580), and State Route 99 (SR 99). Approximately 430 deliveries (160-mile round trip each) are expected to be required to deliver solar array components to the site over approximately six months (an average of approximately four truck deliveries per work day).
The majority of the construction materials (e.g., aggregate, concrete) would be procured locally, within an approximate 10-mile radius of the Project site. Approximately 460 deliveries (20-mile round trip each) are expected to be required to deliver construction materials to the site over approximately 10 months (an average of approximately two truck deliveries per work day).

2. Project Description
McHenry Solar Farm 2-28 May 2011 Draft Environmental Impact Report
The majority of the labor force would also be from Modesto and the surrounding communities. Construction worker traffic would vary according to the needed workforce indicated in Table 2-1, and would be an average of approximately 92 workers each day. Parking for the construction workers would be in designated areas on the Project site; parking along the shoulders of adjacent streets would not be allowed. Carpooling for the construction workers would be encouraged by the Applicant to reduce vehicle trips to the Project site.
2.7 Operation and Maintenance
2.7.1 Operation and Maintenance Workforce One permanent full-time plant manager and one full-time maintenance staff would work in the O&M building. Additional support personnel would be employed, as needed. The plant manager and maintenance staff would perform inspections, covering each portion of the array no less than once per month. Such inspections would be visual and at ground-level. Monthly visual inspections and annual (minimum) preventive maintenance would be performed. In accordance with OSHA safety regulations, at least two qualified personnel would be present during all energized electrical maintenance activities at the facility. The plant manager and one technician would be on-site when such activities are required. During normal business hours when the plant manager and maintenance staff would be on on-site, they would monitor the site to deter theft and vandalism. During all other times, security personnel would monitor the site and provide rapid response to any incidents. Panel washing crews would conduct panel washing two to four times per year (as described below).
2.7.2 Automated Facility Control and Monitoring System The proposed facility control and monitoring system would have two primary components: an on-site supervisory control and data acquisition (SCADA) system and the accompanying sensor network. The on-site SCADA system would offer near real-time readings of the monitored devices, as well as control capabilities for the devices where applicable. Off-site monitoring/data trending systems would collect historical data for remote monitoring and analysis at the SunPower Operations Center in Richmond, California. The plant manager would use both on-site (local) and off-site (remote) O&M personnel to monitor the facility.
Local O&M personnel would use the local SCADA and monitoring system to monitor operation and control the Project facilities. Remote personnel at the SunPower Operations Center located in Richmond, California, would provide continuous 24/7/365 monitoring coverage of the Project facilities and would respond to real-time alerts and system upsets using advanced monitoring applications that reside on the servers at the SunPower Operations Center.
2.7.3 Panel Washing Panel washing would occur approximately two to four times per year, as needed, to clean the active surface of solar panels to optimize transmission of solar light and energy production. Panel washing would require approximately 1 acre-foot of water per cleaning, and would be obtained from a groundwater well located on the Project site.

2. Project Description
McHenry Solar Farm 2-29 May 2011 Draft Environmental Impact Report
2.7.4 Site Maintenance The Applicant would provide landscape and related site maintenance throughout the life of the project. This would include plant and landscape maintenance, replacement of trees or shrubs as needed, grazing or mowing of groundcover under the arrays, and appropriate disposal of any organic and inorganic materials used in the maintenance of the property. Non-hazardous solid waste would be collected for disposal by a licensed waste hauler and disposed of at municipal county landfills.
The project may use professionally managed herds of sheep or goats for periodic control of native grasses (see Section 2.7.5, below). In some locations, or if grazing is not used, mowing would occur.
MID Sub-transmission/Distribution Line and Switchyard
The Large Generator Interconnection Agreement (LGIA) would govern the safe and reliable operation of the interconnection facilities for the Project. The proposed sub-transmission and distribution line and switchyard are planned to be energized in October 2011 and are expected to remain operational for the duration of the MID contract to purchase the power from the Project (25 years). Once energized, they would operate continuously. Sub-transmission and distribution line and switchyard maintenance (including routine inspections) would occur on a regular basis when MID is conducting its routine maintenance of all of its facilities in its service area. Equipment damaged by vandalism would be replaced, and tree trimming (if necessary) would be performed by the Applicant periodically to prevent interference with the lines.
2.7.5 Continued Agricultural Use as Grazing Land The height of the solar panel array provides sufficient clearance to allow small livestock (such as goats and sheep) to graze on grasses underneath and around the solar panel arrays. According to SunPower (Solar Star’s parent company), this practice is being used successfully for weed and grass control at other SunPower solar project sites. To the extent that the McHenry site will support suitable native grasses, grazing would be accommodated by contracting with professionally managed herds to feed on the native grass mixture on a semi-annual or quarterly basis.
2.8 Decommissioning and Site Reclamation
2.8.1 Decommissioning of Applicant Facilities The Power Purchase Agreement between the Applicant and MID has a term of 25 years. If no contract extension is available at the end of the contract term, and if no buyer of the energy or Project facilities emerges, the Project would cease operation. At that time, or such later time as the project ceases operation, the facilities would be decommissioned and dismantled and the site restored to its pre-existing use. Decommission activities are expected to require approximately 300 truck trips, a workforce of approximately 60 workers, and would take approximately 3 months to complete. Activities would consist of:

2. Project Description
McHenry Solar Farm 2-30 May 2011 Draft Environmental Impact Report
Dismantling and removal of all aboveground equipment (solar panels, tracker units, transformers, substation, O&M building, etc.)
Excavation and removal of all belowground cabling
Removal of posts
Removal of roads (both graveled and paved, including the aggregate base)
Break-up and removal of concrete pads and foundations
Removal of septic system and leach field
Scarification of compacted areas and re-grading the site to pre-project conditions
In January 2009, SunPower officially joined PV Cycle, the Brussels-based PV trade association dedicated to the development of PV product recycling standards. PV Cycle was founded to implement the PV industry’s commitment to set up a voluntary take-back and recycling program for end-of-life-panels and to take responsibility for PV panels throughout their entire value chain (PV Cycle, 2008).
The proposed PV panels are expected to have a useful life (i.e., be capable of producing electricity) for 40 years or more. The panels are warranted for 25 years.
Because it is expected that the proposed PV panels would continue to have a useful electricity-producing post-Project life, the Applicant proposes to reuse the panels when the Project is decommissioned and then to recycle them at the end of their useful life. Decommissioning and reuse would involve removal of the panels for sale into a secondary PV panel market.3 The majority of the remaining Project components would be recycled. Equipment, such as drive controllers, inverters, transformers, and switchgear, can be either re-used or their components recycled. Poured concrete pads would be removed and recycled or reused as clean fill.
Appropriate hazardous materials control and erosion control measures would be used throughout the decommissioning process. It is anticipated that such controls would be substantially similar to those implemented during construction.
Post-Project, it is expected that the site would continue in active agricultural use, which is the same as its pre-Project use and the same as current use of adjacent parcels.
3 The Applicant expects a robust global market for used PV panels based on the rise in global electricity demand,
increase in electricity prices, and anticipated acceleration of demand for solar energy for decades to come. Third world off-grid applications also are expected to boom as used PV panels become available at a fraction of the current cost.

2. Project Description
McHenry Solar Farm 2-31 May 2011 Draft Environmental Impact Report
2.8.2 MID Switchyard, Sub-transmission/Distribution Lines, and Control Building
MID would access its facilities on the proposed Project site pursuant to the terms of a sublease agreement negotiated with the Applicant. As mentioned previously, there is a Power Purchase Agreement between the Applicant and MID with a term of 25 years. If MID has no additional obligations or legal rights to maintain and operate its facilities on the Project site, MID would decommission and dismantle its own facilities and restore the site to its pre-existing use. MID’s decommissioning activities are expected to require a workforce of approximately four workers with a backhoe, dump truck, and flatbed truck, and would take approximately three weeks to complete. Activities would consist of:
Dismantling and removal of the switchyard equipment and control building
Break-up and removal of concrete pads and foundations
Removal of the sub-transmission, distribution, and fiber optic loop-in lines from the interconnection point to the switchyard
Removal of the wooden poles between the interconnection point and the switchyard, and backfilling the holes with on-site native soil
The approximately 7.5 miles of fiber optic line between MID’s Ladd, Clough, and Claribel Substations, installed as part of the Project, would remain in place.
_________________________
2.9 References California Energy Commission (CEC), 2008. Renewable Portfolio Standard: Eligibility
Guidebook. Publication #CEC300-2007-006-ED3-CMF, January 2008.
California Independent System Operator (CAISO), FAQ’s - Generation Interconnections to Transmission Facilities Under the ISO Operational Control, http://www.caiso.com/20a9/20a9c6c42fdc0.pdf, December 26, 2008.
Cooper Power Systems, 2005. Cooper Power Systems, Material Safety Data Sheet, Envirotemp® FR3™ Fluid, http://www.cooperpower.com/Library/pdf/98082.pdf, January 13, 2005.
Modesto Irrigation District (MID), 2010. Energizing Our Communities. September 2010.
PV Cycle, Making Photovoltaics “Double Green,” http://www.pvcycle.org/index.php?id=4, 2008.
Stanislaus County, 2008. 1994 Stanislaus County General Plan, rev. December 2008.
Stanislaus County Code, Title 21, Zoning, Chapter 21.20, General Agriculture District (A-2), and Chapter 21.42, Planned Industrial District (PI).
SunPower Corporation (SunPower), Possible Glare and Reflectance in PV Systems, April 4, 2008.

McHenry Solar Farm 3-1 May 2011 Draft Environmental Impact Report
CHAPTER 3 Description of Alternatives
3.1 Alternatives Overview
CEQA requires a lead agency to analyze a reasonable range of alternatives to the proposed project that could feasibly attain the basic objectives of the project while substantially reducing or eliminating significant environmental effects. CEQA also requires an EIR to evaluate a “no project” alternative to allow decision-makers to compare impacts of approving a project with the impacts of not approving it. This Chapter describes the process that was used to identify and screen alternative for consideration, provides the rationale for why some alternatives were eliminated from consideration, and describes those alternatives that were carried forward for analysis in this EIR. The potential environmental impacts of the alternatives carried forward are analyzed in comparison to the proposed Project in each of the 18 resource areas in Sections 4.1 through 4.18. The results of the comparative analysis of each of the 18 resource areas are summarized in Chapter 5, which compares the conclusions of the impact analyses for both alternatives against the conclusions for the Project.
3.2 Alternatives Development and Screening Process
To develop a range of alternatives for analysis, the following methodology was used:
1. Develop an understanding of the Project, identify the need for and basic objectives of the Project, and consider the significant adverse impacts that the Project may have;
2. Consider input received during the scoping process that relates to alternatives to the Project;
3. Identify and evaluate reasonable feasible alternative locations to the proposed site, if any;
4. Identify and evaluate other solar generation technology alternatives, if any, that have the potential to avoid or substantially lessen any of the significant effects of the Project;
5. Identify and evaluate whether alternative approaches, such as conservation and demand side management or distributed generation solar, could provide a reasonable feasible alternative to the Project; and
6. Consider the scenario of not constructing the Project, i.e., the No Project Alternative.

3. Description of Alternatives
McHenry Solar Farm 3-2 May 2011 Draft Environmental Impact Report
The McHenry Solar Farm Project is described in Chapter 2; the statement of Project Purpose and Need is provided in Section 2.3 and Project Objectives are presented in Section 2.4. The scoping report is provided in Appendix A. No alternative sites, technologies, or approaches were suggested during scoping. The process used to identify and screen alternatives to the proposed Project is described in the following sections.
3.2.1 Alternatives Screening Methodology The screening of alternatives to the proposed Project was completed using a process that consisted of three steps:
Step 1: Clarify the description of each alternative to allow comparative evaluation.
Step 2: Evaluate each alternative using CEQA criteria (defined below).
Step 3: Determine the suitability of each alternative for full analysis in the EIR. Infeasible alternatives and alternatives that clearly offered no potential for overall environmental advantage were removed from further analysis.
Following the three-step screening process, the advantages and disadvantages of the remaining alternatives were carefully weighed with respect to CEQA’s criteria for consideration of alternatives:
Does the alternative meet most basic project objectives?
Is the alternative feasible (legal, regulatory, technical)?
Does the alternative avoid or substantially lessen any significant effects of the proposed Project (including consideration of whether the alternative could create significant effects potentially greater than those of the proposed Project)?
3.2.2 Consistency with Project Objectives CEQA Guidelines require the consideration of alternatives capable of eliminating or reducing significant environmental effects even though they may “impede to some degree the attainment of project objectives” (§15126.6(b)). Therefore, it is not required that each alternative meet all of the Applicant’s objectives. The objectives of the proposed Project are discussed in Section 2.3.
3.2.3 Feasibility CEQA Guidelines (§15364) define feasibility as:
. . . capable of being accomplished in a successful manner within a reasonable period of time, taking into account economic, environmental, legal, social, and technological factors.
In addition, CEQA requires that the Lead Agency consider site suitability, economic viability, availability of infrastructure, general plan consistency, other regulatory limitations, jurisdictional boundaries, and proponent’s control over alternative sites in determining the range of alternatives

3. Description of Alternatives
McHenry Solar Farm 3-3 May 2011 Draft Environmental Impact Report
to be evaluated in the EIR (CEQA Guidelines §15126.6(f)). The three principal feasibility components evaluated in the screening analysis were:
Legal Feasibility: Does the alternative involve use of land with legal protections that may prohibit or substantially limit the feasibility of permitting a solar energy project and associated transmission facilities?
Regulatory Feasibility: Is the alternative subject to regulatory restrictions that may substantially limit the feasibility of, or permitting of, a solar energy project and associated transmission facilities within a reasonable period of time?
Technical Feasibility: Is the alternative feasible from a technological perspective, considering available technology?
For this screening analysis, the assessment of legal, technical, and regulatory feasibility of potential alternatives involved an evaluation of each potential alternative to determine if there was anything about the alternative that would be infeasible on technical, legal, or regulatory grounds. If an alternative was found not to meet one of those primary feasibility criteria, it was deemed infeasible without reviewing whether it met the other feasibility criteria. In assessing the reasonableness and feasibility of alternatives, the Applicant consulted with MID and the Applicant considered the following issues:
MID’s electric service jurisdictional boundaries, its electrical import capability and limitations at interties with the bulk electric system, and internal electric system reliability;
Site suitability, proximity to existing transmission infrastructure, available real estate space at existing substations; and
Consistency with land use requirements and other plans or regulatory limitations, economic viability, and whether the Applicant reasonably could acquire, control, or otherwise have access to an alternative site or pursue the alternative.
This screening analysis does not focus on relative economic factors or costs of the alternatives (as long as they are found to be potentially economically viable) because CEQA Guidelines require consideration of alternatives capable of eliminating or reducing significant environmental effects even though they may be more costly (CEQA Guidelines §15126.6(b)).
3.2.4 Potential to Eliminate Significant Environmental Effects CEQA requires that to be fully considered in an EIR, an alternative must have the potential to “avoid or substantially lessen any of the significant effects of the project” (CEQA Guidelines §15126.6(a)). At the screening stage, it is neither possible, nor legally required, to evaluate all of the impacts of the alternatives in comparison to the proposed Project with absolute certainty, nor is it possible to quantify impacts. However, it is possible to identify elements of an alternative that are likely to be the sources of impact and to relate them, to the extent possible, to general conditions in the Project area.

3. Description of Alternatives
McHenry Solar Farm 3-4 May 2011 Draft Environmental Impact Report
The potential significant environmental effects of the proposed Project are listed in Table 3-1. This impact summary was prepared using a liberal definition of “potentially significant” so as to avoid excluding alternatives that may provide some overall environmental benefit. Also, because this screening-level impact summary was developed prior to completion of the EIR analysis, it may identify more “potentially significant” impacts than were subsequently identified in the detailed analysis presented in Section 4 of this EIR.
TABLE 3-1 SUMMARY OF PRELIMINARY SIGNIFICANT ENVIRONMENTAL IMPACTS
OF THE McHENRY SOLAR FARM
Issue Area Impact
Aesthetics Degradation of the existing viewshed resulting from new sub-transmission poles for the generation tie (gen-tie) line
Degradation of the existing viewshed resulting from the proximity of solar panels to McHenry Avenue and Patterson Road
Agricultural Resources Potential for conversion of Prime Farmland to non-agricultural use
Air Quality Construction dust and/or equipment exhaust emissions exceeding local air district significance thresholds
Noise Construction-related short-term noise impacts on sensitive land uses
Based on this methodology, each potential alternative was evaluated for its ability to meet most of the basic Project objectives, its feasibility, and its ability to avoid or substantially lessen one or more of the potential significant effects of the Project and not create significant unmitigable impacts of its own.
3.3 Summary of Screening Results
Table 3-2 provides a composite list of the alternatives considered, and the results of the screening analysis with respect to the criteria findings for consistency with project objectives, feasibility and environmental effectiveness. Alternatives carried forward for full EIR analysis are listed below in Section 3.3.1. Alternatives eliminated from further consideration follow in Section 3.3.2.
3.3.1 Alternatives Evaluated in Detail in this EIR The alternatives listed below are those that have been selected through the alternative screening process for detailed EIR analysis; the No Project alternative is also included as required by CEQA. Each of the identified alternatives would substantially meet project objectives, would be feasible, and would avoid or reduce potential environmental effects of the proposed Project. The alternatives are briefly described in Table 3-2 as well as in greater detail in the paragraphs that follow.
Reduced Project Alternative
Non-Agriculture Site Alternative
No Project.

3. Description of Alternatives
McHenry Solar Farm 3-5 May 2011 Draft Environmental Impact Report
TABLE 3-2 SUMMARY OF ALTERNATIVES SCREENING ANALYSIS
McHENRY SOLAR FARM
Alternative Project Objectives Criteria Feasibility Criteria Environmental Criteria
Passes Screening
Reduced Project Alternative Increases setback from roadways to 300 feet Reduces solar array area by approximately 10% Reduces energy generating capacity of the site by
approximately 3 MW
Would generate 22 MW rather than 25 MW with the proposed Project. Meets most project objectives, but would be less effective than the proposed Project with assisting MID in meeting its Renewable Portfolio Standard and goals aimed at reducing greenhouse gas (GHG) emissions, and in furthering MID’s efforts to achieve its goals for renewable energy generating capacity within MID’s total energy portfolio.
No elimination factors were identified.
Meets environmental criteria. Aesthetics: would lessen potential visual impacts along McHenry Avenue and Patterson Road Air Quality: would slightly lessen construction air emissions Noise: would slightly lessen construction noise New Impacts: None likely
Non-Agriculture Site Alternative Former Shell Lab Site, approximately 29 acres Zoned Planned Industrial Existing buildings and structures would need to be
removed Approximately 5 MW solar energy output Approximately 1.25-mile sub-transmission line
Would generate 5 MW rather than 25 MW with the proposed Project. Meets most project objectives, but would be less effective than the proposed Project with assisting MID in meeting its Renewable Portfolio Standard and goals aimed at reducing greenhouse gas (GHG) emissions, and in furthering MID’s efforts to achieve its goals for renewable energy generating capacity within MID’s total energy portfolio.
No elimination factors were identified.
Meets environmental criteria, although some impacts may be similar to the proposed Project but would merely occur in a different location. Aesthetics: would avoid impacts along McHenry Avenue and Patterson Road Agricultural: would avoid potential conversion of Prime Farmland to non-agricultural use Air Quality: would lessen construction air emissions Noise: would lessen construction noise New Impacts: Demolition of existing structures would at least partially offset any reduction in construction air emissions and noise; aesthetic impact of 1.25-mile sub-transmission line could be greater that the proposed Project
Fails Screening
Alternative Site: Airport/Industrial Park In flood plain Biological habitat along Tuolumne River Prime Farmland
Meets most project objectives. No elimination factors were identified.
Fails environmental criteria. Potential impacts would be greater than the proposed Project because this alternative site is located in a flood plain, is designated Prime Farmland, and is very likely to have sensitive species and/or habitat due to its proximity to the Tuolumne River.
Alternative Site: Geer Road Landfill Ground settling Construction restrictions in landfill cap
Meets most project objectives. Fails. Site would not be suitable for a utility-scale solar project due to differential settling of the landfill and construction restrictions on the landfill cap.
Meets environmental criteria. This alternative site is not located on Prime Farmland and would be unlikely to have any new impacts.

3. Description of Alternatives
TABLE 3-2 (Continued) SUMMARY OF ALTERNATIVES SCREENING ANALYSIS
McHENRY SOLAR FARM
McHenry Solar Farm 3-6 May 2011 Draft Environmental Impact Report
Alternative Project Objectives Criteria Feasibility Criteria Environmental Criteria
Fails Screening (cont.)
Alternative Site: Fink Landfill No MID transmission infrastructure nearby Prime Farmland
Meets most project objectives. Fails. This site is located outside of MID’s electric system and the energy output may have to be scheduled through the California Independent System Operator. This would increase costs to deliver and would have line losses since the project would not be near MID transmission infrastructure. For this reason, it would also reduce MID’s import capability of external resources. In addition, an external resource does not provide internal capacity or internal electric system reliability benefits. System upgrades would be necessary to interconnect this project to MID’s electric system through a dedicated line and space is limited in MID’s existing Westley Substation.
Fails environmental criteria. Potential impacts would be essentially the same as the proposed Project.
Alternative Site: Warnerville Road, near Oakdale Tilled ag land Farmland of Statewide Importance Under Williamson Act PG&E transmission (not MID)
Meets most project objectives. Fails. This site is not located near MID transmission infrastructure.
Fails environmental criteria. Potential impacts would be essentially the same as the proposed Project. This alternative site is designated Farmland of Statewide Importance and is under Williamson Act contract.
Alternative Site: East Claribel Road Hilly topography Farmland of Local Importance Under Williamson Act
Meets most project objectives. No elimination factors were identified.
Fails environmental criteria. Potential impacts would be greater than the proposed Project because this alternative site is on hilly terrain and would require substantial site grading. This site is also under Williamson Act contract.
Alternative Site: Highway 132 (East) Hilly topography, wetlands, floodplain Under Williamson Act
Meets most project objectives. No elimination factors were identified.
Fails environmental criteria. Potential impacts would be greater than the proposed Project because this alternative site is on hilly terrain and would require substantial site grading. This site also has wetlands present, is in a floodplain, and is under Williamson Act contract.

3. Description of Alternatives
TABLE 3-2 (Continued) SUMMARY OF ALTERNATIVES SCREENING ANALYSIS
McHENRY SOLAR FARM
McHenry Solar Farm 3-7 May 2011 Draft Environmental Impact Report
Alternative Project Objectives Criteria Feasibility Criteria Environmental Criteria
Fails Screening (cont.)
Alternative Site: Escalon (multiple sites) Mostly tilled ag land Under Williamson Act PG&E transmission (not MID)
Meets most project objectives. Fails. The sites in the Escalon area are not located near MID transmission infrastructure.
Fails environmental criteria. Potential impacts for these alternative sites would be essentially the same as the proposed Project. These sites are also under Williamson Act contract.
Alternative Site: West Side, in MID Territory (multiple sites) Mostly tilled ag land Under Williamson Act No MID transmission infrastructure nearby
Meets most project objectives. Fails. The sites in the West Side area are not located near MID transmission infrastructure with sufficient capacity to accommodate additional energy.
Fails environmental criteria. Potential impacts for these alternative sites would be essentially the same as the proposed Project. These sites are also under Williamson Act contract.
Alternative Site: West Side, I-5 Corridor (multiple sites) Mostly tilled ag land Under Williamson Act No MID transmission infrastructure nearby
Meets most project objectives. Fails. These sites are located outside of MID’s electric system and the energy output may have to be scheduled through the California Independent System Operator. This would increase costs to deliver and would have line losses since the project would not be near MID transmission infrastructure. For this reason, it would also reduce MID’s import capability of external resources. In addition, an external resource does not provide internal capacity or internal electric system reliability benefits. System upgrades would be necessary to interconnect this project to MID’s electric system through a dedicated line and space is limited in MID’s existing Westley Substation.
Fails environmental criteria. Potential impacts for these alternative sites would be essentially the same as the proposed Project. These sites are also under Williamson Act contract.
Alternative Site: Ammo Plant (Riverbank) Contaminated site; clean-up in progress Major interconnection upgrades required to tie into
MID grid
Meets most project objectives. Fails. This site would require substantial transmission upgrades and site remediation that would render the project economically unviable.
Fails environmental criteria. Potential impacts would be essentially the same as the proposed Project for most resource areas, but new significant impacts could occur from possible exposure to subsurface contamination.
Alternative Interconnection Points Meets most project objectives. No elimination factors were identified.
Fails environmental criteria. Any alternative interconnection points for the sub-transmission line would be at a greater distance than proposed, so impacts would likely be greater.

3. Description of Alternatives
TABLE 3-2 (Continued) SUMMARY OF ALTERNATIVES SCREENING ANALYSIS
McHENRY SOLAR FARM
McHenry Solar Farm 3-8 May 2011 Draft Environmental Impact Report
Alternative Project Objectives Criteria Feasibility Criteria Environmental Criteria
Fails Screening (cont.)
Alternative Technology: Parabolic Trough Concentrated Solar
Meets most project objectives. No elimination factors were identified, although this technology is better suited for areas with higher solar insolation.
Fails environmental criteria. Would not avoid or substantially lessen any of the potentially significant impacts of the proposed Project. Would require substantially greater water use for cleaning the mirrors.
Alternative Technology: Power Tower Concentrated Solar Meets most project objectives. No elimination factors were identified, although this technology is better suited for areas with higher solar insolation.
Fails environmental criteria. Would not avoid or substantially lessen any of the potentially significant impacts of the proposed Project. Would require substantially greater water use for cleaning the mirrors.
Alternative Technology: Thin Film PV Meets most project objectives. No elimination factors were identified.
Fails environmental criteria. Would not avoid or substantially lessen any of the potentially significant impacts of the proposed Project.
Energy Conservation and Demand Side Management Replace need for solar power project through
implementation of energy conservation programs
Fails. Would not meet MID’s renewable energy goals and would not increase renewable energy generating capacity within MID’s total energy portfolio to meet State regulatory requirements and MID Board policies.
Fails. MID’s Energy Services Department has a conservation and demand side management program in place that provides information to the public regarding energy efficiency, free energy surveys, and cash rebate programs for residential, commercial, industrial, and agricultural customers. However, these programs are not feasible on a scale that would be suitable to replace the proposed Project within a reasonable period of time.
Meets environmental criteria. Complete avoidance of the proposed Project would eliminate the potential environmental impacts of the construction and operation of the solar power project, and no new significant impacts would be created.
Distributed Energy Provide multiple, smaller local sources of renewable
energy (e.g., rooftop solar) that would not require construction of a utility-scale solar power project
Fails. Would not meet MID’s renewable energy goals and would not sufficiently increase renewable energy generating capacity within MID’s total energy portfolio to meet State regulatory requirements and MID Board policies.
Fails. The Applicant does not own or have a right to use the many sites that would be required to generate a comparable amount of solar-generated energy as the Project.
Meets environmental criteria. Complete avoidance of the proposed Project would eliminate the potential environmental impacts of the construction and operation of the solar power project, and no new significant impacts would be likely from multiple smaller projects such as roof-mount solar on existing structures.

3. Description of Alternatives
McHenry Solar Farm 3-9 May 2011 Draft Environmental Impact Report
Reduced Project Alternative
Description The Reduced Project Alternative would be a smaller version of the proposed Project using the same PV technology, but with a greater setback distance from McHenry Avenue (along the west property line) and Patterson Road (along the south property line). The north and east property lines are bordered by existing orchards, so greater setbacks in those areas would not provide any additional screening.
The greater setbacks along McHenry Avenue and Patterson Road would place the solar panels farther from the edge of the roadways and would allow for more landscape planting, which in turn, would allow for denser screening of the solar panels from nearby residences, motorists, and other passers-by. The proposed Project would have an approximate 150-foot setback from the edge of McHenry Avenue and an approximate 80-foot setback from the edge of Patterson Road. For the Reduced Project Alternative, these setbacks would be increased to 300 feet.
Increasing the setback distance would reduce the area available for solar panel installation, and thus would decrease the amount of energy that could be produced. A 300-foot setback along McHenry Avenue and Patterson Road would reduce the solar panel area by about 10 percent, which would reduce the generating capacity of the site by at least 3 MW (the array layout is based on 1- and 1.5-MW power blocks, so the output loss would be in 1- or 1.5-MW increments).
Project Objectives The Reduced Project Alternative would meet most of the Project Objectives; however, the reduced energy output of the Reduced Project Alternative would lessen this alternative’s ability to meet the following two key objectives:
Assist MID in meeting its Renewable Portfolio Standard and goals aimed at reducing greenhouse gas (GHG) emissions.
Further MID’s efforts to achieve its goals for renewable energy generating capacity within MID’s total energy portfolio.
Feasibility No legal, regulatory, or technical feasibility issues were identified that would eliminate this alternative from consideration.
Lessen Significant Environmental Impacts The Reduced Project Alternative would lessen the potential visual impacts of the solar arrays along McHenry Avenue and Patterson Road. A slight (less than 10 percent) reduction in construction air quality emissions would also occur if this alternative was constructed (emissions related to solar array installation would be reduced by approximately 10 percent when compared

3. Description of Alternatives
McHenry Solar Farm 3-10 May 2011 Draft Environmental Impact Report
to the proposed Project, but there would be no reduction in emissions from construction of the other project facilities such as the sub-transmission line, substation, and O&M Building).
Potential New Impacts Created The Reduced Project Alternative would not be likely to create any new significant impacts.
Non-Agriculture Site Alternative
Description The Applicant identified and screened more than a dozen other possible sites for development of the proposed Project. A matrix of these sites and the rationale for why they were rejected from further consideration by the Applicant is provided in Table 3-2, and the alternative site screening process described below in Section 3.3.2, Alternatives Rejected from Detailed Consideration. However, because the Applicant’s proposed site along McHenry Avenue could have a potentially significant impact related to conversion of Prime Farmland to non-agricultural use (which the analysis in Section 4.2 of this Draft EIR ultimately concludes would not be a significant impact), the EIR team re-screened the Applicant’s matrix of candidate sites to identify any that could avoid or lessen the potential Farmland impact while still meeting the other CEQA screening criteria for consideration of alternatives. The Former Shell Lab Site passed the feasibility screening criteria, met most of the Project Objectives, and was not located on Prime Farmland, Unique Farmland, or Farmland of Statewide Importance and/or was not under Williamson Act contract. Therefore, the Former Shell Lab Site is considered here as the Non-Agriculture Site Alternative.
The Former Shell Lab Site is located in Stanislaus County approximately 4 miles southwest of the proposed Project site (see Figure 3-1) and is comprised of four parcels (APNs 136-032-025, -026, -027, and -028). The site is on approximately 29 acres of land zoned Planned Industrial and is designated mostly Urban and Built-Up Land with a small portion designated as Grazing Land according to the California Department of Conservation’s Farmland Mapping and Monitoring Program. The site is within the area covered by the Salida Community Plan, in which the site is designated as Planned Industrial (Stanislaus County, 2007).
A variety of buildings and other structures currently exist on-site. To prepare the site for installation of solar panels, these existing structures would need to be demolished and removed and the site graded. Because the site is already flat, grading would be limited to only that necessary to re-establish the existing grade subsequent to demolition and removal of the structures. Demolition plans for this site have not been engineered, so only a rough approximation of demolition workforce and duration is possible. A recent demolition project involving two large industrial buildings and a large office building completed by Universal Wrecking Corporation on a 20-acre site took approximately two months to complete (Universal Wrecking Corporation, 2011). The average crew size on that project was eight employees. The Former Shell Lab site consists of approximately 15 buildings, 5 times as many as the Universal project. It is reasonable to assume, then, that with the same size crew the demolition activities at the Former Shell Lab site would take approximately 10 months to complete (i.e., 5 times the 2-month duration of the Universal project).

Former Shell Lab Site
! ! !
!!
!!
!!
!!
!!
!!
!!
!!
!!
!!
!!
!!
!!
!!
!!
!!
!!
!!
!!
!!
!!
!!
!!
!!
!!
!!
!!
!!
!!
!!
!!
!!
!!
!!
!!
!!
!!
!!
!!
!!
!!
!!
!!
!!
!!
!!
!!
!!
!!
!!
!!
!!
!!
!!
!!
!!
!!
!!
!!
!!
!!
!!
!!
!!
!!
!!
!!
!!
!!
!!
!!
!!
!!
!!
!!
!!
!!
!!
!!
!!
!!!
Sub-TransmissionRoute
UV99
Sun Down Pl
UV219
Sis
k R
d
Sto
dd
ard
Rd
Ch
ap
ma
n R
d
Technology Dr
Qu
intu
rn L
n
En
terp
rise
Wa
y
Pirrone Rd
Su
n G
old
Dr
Nu
tcra
cke
r L
n
Sto
dd
ard
Rd
McHenry Solar Farm . 209517.01
Figure 3-1Non-Agriculture Site Alternative
SOURCE:Sunpower, 2010; Google Maps, 2011
0 1,000
Feet
Proposed Project
Former Shell Lab Site
UV99
UV219
UV108
0 4
Miles
3-11

3. Description of Alternatives
McHenry Solar Farm 3-12 May 2011 Draft Environmental Impact Report
Because the size of the Former Shell Lab site is only about 20 percent that of the proposed Project site (29 acres versus 154 acres), the energy output of the site would similarly be about 20 percent of the proposed Project – approximately 5 MW (the actual energy output could be slightly less or slightly more than this estimated amount depending on the final design configuration of modular power blocks on the site). Construction of the solar array would be identical to that described for the proposed Project (see Section 2.5, Project Facilities), except that the number of construction workers and material deliveries would be proportionately less than the proposed Project and construction would take approximately two to four months. Appurtenant facilities for this alternative site would be similar to the proposed Project, and would include an O&M building, switchyard, substation, and control room, although the size of these structures may be smaller for the alternative site due to the lower energy output.
A double circuit 69-kV sub-transmission line would be required to convey the energy produced at the site to the MID grid. The nearest existing MID transmission line is a 69-kV line approximately 1.25 miles to the south of the site that ties into the Stoddard Substation (also located about 1.25 miles south of the site). Therefore, the new sub-transmission line required for this alternative site would be approximately 1.25 miles long. However, there is an existing distribution circuit on the east side of Stoddard Road that could be upgraded to carry the 69-kV sub-transmission line south to the Stoddard Substation. Upgrading the distribution circuit to carry both distribution and the new 69-kV sub-transmission line would require removal of the existing distribution wood poles and replacement with taller wood poles, transferring the existing distribution circuit to the new structures, and stringing the new 69-kV conductor. Assuming one new pole for every 200 feet of sub-transmission line, at least 33 existing wood poles would need to be removed and 33 new wood poles installed to carry the new conductor; these new wood poles are assumed to be 65 feet in height, same as for the proposed Project.
It is also assumed that new fiber optic cable would be required to enhance the reliability of communications on MID’s electric system, and that 1.25 miles of this cable would be strung on the same new wood poles that would carry the new 69-kV sub-transmission line. It is unknown whether additional fiber optic cable would be required for communication between MID’s Stoddard Substation and other MID substations in the system. However, if required, it is assumed that the new fiber optic cable would be strung on existing transmission structures as described for the proposed Project.
The alternative site would also include site fencing for security and landscaping for visual screening. Operation and maintenance activities for this alternative site, including water use for panel washing, would be the same as, but proportionally less, than the proposed Project. Decommissioning and site reclamation would occur at the end of the PPA contract term, assumed to be approximately 25 years. Decommissioning activities for this alternative site would be similar to that described for the proposed Project, except that fewer workers and truck trips would be required and the duration would be proportionately less.

3. Description of Alternatives
McHenry Solar Farm 3-13 May 2011 Draft Environmental Impact Report
Project Objectives The Non-Agriculture Site Alternative would meet most of the Project Objectives, but would produce substantially less energy (5 MW) when compared to the proposed Project (25 MW). Because of the lower energy output, this alternative would only partially meet the following key objectives:
Assist MID in meeting its Renewable Portfolio Standard and goals aimed at reducing greenhouse gas (GHG) emissions.
Further MID’s efforts to achieve its goals for renewable energy generating capacity within MID’s total energy portfolio.
In addition, the smaller energy output could have a substantial effect on the Applicant’s ability to meet the following objective:
Ensure that the Project can be constructed in a technologically feasible manner and operated in a manner that allows power to be provided at a competitive price.
Feasibility No legal, regulatory, or technical feasibility issues were identified that would eliminate this alternative from consideration.
Lessen Significant Environmental Impacts The Non-Agriculture Site Alternative would avoid the possible conversion of Prime Farmland to non-agricultural use. This alternative would also avoid the potential visual impacts of the proposed Project, but would transfer similar impacts to the area surrounding the alternative site. Because of the smaller size of the alternative site compared to the proposed Project, impacts related to construction air emissions and noise from construction of the solar panels would be substantially reduced. However, this impact reduction would be partially offset by air emissions and noise from the demolition and removal of existing structures on this alternative site.
Potential New Impacts Created The Non-Agriculture Site Alternative would require approximately 1.25 miles of new double circuit sub-transmission line and replacement of approximately 33 existing distribution wood poles (estimated to be approximately 55 feet in height) with approximately 33 new 65-foot-tall wood poles, which would be likely to create greater visual impacts than would the proposed Project (which would have up to 9 new 65-foot-tall wood poles and up to 1,500 feet of new sub-transmission line). Construction air emissions and noise would potentially affect a greater number of sensitive receptors because of the longer length of the sub-transmission line over which construction activities would occur. Land use impacts could occur as a result of the site’s location within the Salida Community Plan.

3. Description of Alternatives
McHenry Solar Farm 3-14 May 2011 Draft Environmental Impact Report
No Project Alternative
CEQA Guidelines §15126.6(e) requires consideration of a No Project Alternative. This analysis discusses the existing conditions at the time the NOP was published (December 6, 2010), as well as what reasonably would be expected to occur in the foreseeable future if the Project were not approved, based on current plans and consistent with available infrastructure and community services.
Description If the No Project Alternative is implemented, the three parcels and part of the fourth parcel that comprise the Project site (APNs 074-002-029, -030, and -031, and APN 074-002-021, respectively) would continue to be used with the residential portion of APN 074-002-021, which is excluded from the Project site boundary. The Project site is designated Agriculture pursuant to the Stanislaus County General Plan (Stanislaus County, 2008). It is, therefore, expected that the property would continue to be used for an agricultural land use unless and until some other use was approved (consistent with applicable land use regulations and in accordance with available infrastructure and community services). The analysis of the No Project Alternative in this document focuses on a no-development/no Project scenario where the existing agricultural use is continued as it exists under pre-Project conditions.
Under a no-development scenario, the property would continue in agricultural use and the existing environmental setting would be maintained. Changes to that setting, including changes to the landscape (visual resources, habitat, and land use/agriculture); construction-related noise, traffic, and air emissions would not occur; and environmental benefits relating to renewable energy would not occur on the site. Available irrigation and other infrastructure would remain in place, and public and utility services would continue to be provided or available to the site and its occupants as they are now.
Project Objectives The No Project Alternative would not meet any of the Project Objectives, including the objectives of assisting MID in meeting State-adopted and MID Board Policy objectives regarding its Renewable Portfolio Standard goals. The goals include meeting future greenhouse gas emissions reduction targets and creating a diverse portfolio of resources.
Feasibility No legal, regulatory, or technical feasibility issues were identified that would eliminate the No Project Alternative from consideration.
Lessen Significant Environmental Impacts As a no-development alternative, the No Project Alternative would avoid all Project-related impacts.

3. Description of Alternatives
McHenry Solar Farm 3-15 May 2011 Draft Environmental Impact Report
Potential New Impacts Created The No Project Alternative would cause no new impacts on the physical environment; i.e., existing land uses would continue to affect environmental conditions as they are now.
3.3.2 Alternatives Rejected from Detailed Consideration As discussed in Section 3.2, alternatives were assessed for their feasibility, ability to achieve basic project objectives, and ability to reduce the significant environmental impacts of the proposed Project. Based on these screening criteria, the alternatives eliminated from further consideration are presented in Table 3-2 and are summarized as follows:
More than a dozen alternative locations to the proposed site (identified and discussed in Table 3-2;
Alternative sub-transmission line interconnection points for the proposed site;
Three alternative solar technologies: concentrated solar parabolic trough, concentrated solar “power tower,” and thin-film PV;
Two alternative approaches to the proposed generation of solar energy: conservation and demand side management and distributed generation solar.
Each of these alternatives is discussed below, including the rationale for not carrying it forward for more detailed environmental review.
Alternative Sites
During the initial phases of Project planning, the Applicant considered the suitability of more than a dozen candidate sites based on their solar insolation potential. The Applicant’s initial screening criteria included a preference for contiguous sites with generally flat topography that were large enough to accommodate a solar farm meeting the main Project Objectives, avoiding pristine or biologically sensitive areas. One of the main Project Objectives considered during this screening process was location within MID service territory, favoring proximity to existing transmission facilities with suitable interconnection locations, to increase transmission efficiency by limiting line losses. As described in Table 3-2, the failure to meet this main objective was a principal reason for eliminating the potential sites near the Fink Road landfill and other potential sites on the west side of the county, outside MID’s service area. The Applicant then determined whether candidate sites were available for sale or lease at a reasonable cost. Many sites clearly did not meet the Project Objectives, were technically infeasible, or would have presented significant environmental challenges. The Applicant eliminated these potential sites from further consideration before filing permit applications for the proposed site with Stanislaus County.
Table 3-2 identifies the candidate sites that were considered by the Applicant and describes the rationale for their elimination from further consideration. As discussed above in Section 3.3.1, Alternatives Evaluated in Detail in this EIR, the EIR team re-screened these candidate sites to identify any that could avoid or lessen the proposed site’s potential impact to Prime Farmland

3. Description of Alternatives
McHenry Solar Farm 3-16 May 2011 Draft Environmental Impact Report
(which the analysis in Section 4.2 of this Draft EIR ultimately concludes would not be a significant impact) while still meeting the other CEQA screening criteria for consideration of alternatives. One site, the Former Shell Lab Site, passed the legal, regulatory and technical feasibility screening criteria, met most of the Project Objectives, and was not located on Prime Farmland, Unique Farmland, or Farmland of Statewide Importance, and/or was not under Williamson Act contract. Therefore, the Former Shell Lab Site was carried forward as the Non-Agriculture Site Alternative (see Section 3.3.1, Alternatives Evaluated in Detail in this EIR).
Alternative Interconnection Points
As described in Section 2.5.8 of the Project Description, the Project would connect to the existing 69-kV sub-transmission line aligned on the west side of McHenry Avenue, adjacent to the proposed site. Any of three interconnection option alignments could be constructed if the Project is approved. As shown in Project Description Figure 2-6, Project construction would require the installation of between 300 feet and 1,500 feet of new 69-kV double-circuit overhead line, depending on which option ultimately is selected. Because other interconnection options would have been located at greater distances from the Project site, and therefore, would require additional construction (and may cause additional associated impacts), alternative interconnection alignments were not considered further.
Alternative Technologies
Concentrated solar power systems (parabolic trough or power tower) and thin-film PV were considered as alternatives to the Project. For the reasons discussed below, these technologies were not carried forward for detailed consideration.
Concentrated solar power systems, including Parabolic Trough and Power Tower, use reflective surfaces in large arrays to focus the sun’s energy on a fixed point to produce intense heat from which electricity can be generated. Parabolic troughs concentrate sunlight onto individual units, each of which is equipped with receiver tubes filled with a heat transfer fluid. Power towers focus sunlight onto a single receiver – the tower. For both of these concentrated solar technologies, the transfer fluid is super-heated before being pumped to heat exchangers that transfer the heat to boil water and run a conventional steam turbine to produce electricity. Although concentrated solar power systems can store heated fluids to deliver electricity even when the sun is not shining, these systems can cause environmental issues related to reflectivity and thermal plumes, and radar interference (FAA, 2010). In areas of high solar insolation potential (i.e., desert environments), the land required to develop a concentrated solar energy facility is comparable to that required for a PV project – approximately 5 acres per MW of installed capacity (NREL, 2010). Use of a concentrated solar technology would meet most of the basic Project Objectives; however, use of this technology would not avoid or substantially lessen any of the potential significant effects of the Project (Table 3-1). In addition, the Applicant is a developer and manufacturer of solar PV panels and systems and has proposed to use PV for the Project. In practice, MID would not require an Applicant to use a different technology than the one it proposes, therefore a concentrated solar power system alternative was not considered further.

3. Description of Alternatives
McHenry Solar Farm 3-17 May 2011 Draft Environmental Impact Report
There are two leading manufactured solar PV technologies in commercial use today: crystalline silicon and thin-film. As described in Project Description Section 2.5.1, the Applicant proposes to use high efficiency monocrystalline silicon. The Applicant considered whether thin film technology would be a reasonable feasible alternative to the proposed material. However, thin-film is less efficient than the proposed type of solar cells and less durable (FAA, 2010; Quantum, 2010). Although a thin-film alternative would be feasible and would meet most of the basic Project Objectives, it would not avoid or substantially lessen any of the potentially significant effects of the Project (Table 3-1), and so was rejected.
Alternative Approaches
MID considered whether conservation and demand side management and distributed generation solar could provide a reasonable feasible alternative to the Project. For the reasons discussed below, neither of these alternatives to the Project was carried forward for further consideration.
Conservation and demand side management consist of a variety of approaches to reduce electricity use. It includes increased energy efficiency and conservation, building and appliance standards, and load management. Implementation of conservation and demand side management techniques could result in a reduction in demand thus reducing the need for new generation within MID’s service area, and thereby serve the region’s growing demand for power. However, this alternative would not meet the Project Objectives. Unmet Project Objectives include: constructing a solar energy facility within MID’s electric service territory to meet renewable energy goals, increasing renewable energy generating capacity within MID’s total energy portfolio to meet State regulatory requirements and MID Board policies, and upgrading MID operational communications to enhance the reliability of MID’s electric system. The MID Energy Services Department has a conservation and demand side management program in place that provides information to the public regarding energy efficiency, free energy surveys, and cash rebate programs for residential, commercial, industrial, and agricultural customers (MID, 2010). In addition, jobs and population are projected to increase within Stanislaus County between 2010 to 2015 (US Census Bureau, 2010; Caltrans, 2010). Consequently, reliance on conservation and demand side management alone would be a technically infeasible alternative to the Project.
Distributed generation resources are “grid‐connected or stand‐alone electrical generation or storage systems that are connected to the distribution level of the transmission and distribution grid and are located at or very near the location where the energy is used” (CEC, 2009). Distributed solar facilities vary in size from tens of kilowatts to tens of megawatts. They generally do not require the construction of new transmission and distribution lines to deliver the energy generated to load centers or require the use of undeveloped “greenfield” sites. In 2010, Stanislaus County was estimated to have the technical potential for a total of 750 megawatts-peak (MWp) (555 MWp residential and 195 MWp commercial) of distributed rooftop solar PV (CEC, 2007). A distributed generation solar alternative could result in the installation of PV systems on public and private residential, commercial, or industrial rooftops; commercial and public parking facilities; and/or shade structures in playgrounds and parks in Salida, Modesto, Empire, Waterford, and other developed urban areas within MID’s service area. However, distributed solar energy generation would not meet Project Objectives relating to the location of solar plant facilities as near as possible to existing electrical sub-transmission and distribution facilities, upgrade of MID operational communications to enhance the

3. Description of Alternatives
McHenry Solar Farm 3-18 May 2011 Draft Environmental Impact Report
reliability of MID’s electric system. In addition, distributed solar would be an infeasible alternative to the Project because the Applicant does not own or have a right to use the many sites that would be required to generate a comparable amount of solar-generated energy as the Project. Distributed solar would be a technically infeasible alternative to the Project because the State’s electric distribution systems are not yet designed to easily accommodate randomly installed distributed generation resources at customer sites (CEC, 2007). In addition, Assembly Bill 920, adopted in the fall of 2009, stipulates that the owners of solar rooftop systems will be able to keep the renewable energy credits for the energy that is generated to meet their energy needs, thereby reducing the level of renewable energy that could be claimed by MID as part of its portfolio of renewable energy.
MID cannot meet its desired goals by using only these alternative approaches. Therefore, it is supplementing these methods and diversifying its energy resource pool by considering renewable energy resources during its planning for future energy needs.
_________________________
3.4 References California Energy Commission (CEC), 2009. Integrated Energy Policy Report, Final
Commission Report, December 2009, CEC -100-2009-003-CMF, pages cited: 8, 95.
CEC, 2007. CEC, California Rooftop Photovoltaic (PV) Resource Assessment and Growth Potential by County, CEC-500-2007-048, September 2007, http://www.energy.ca.gov/2007publications/CEC-500-2007-048/CEC-500-2007-048.PDF, Table B.1, Technical Potential by County (MWp), pages cited: 199.
Federal Aviation Administration (FAA) Office of Airport Planning and Programming, Technical Guidance for Evaluating Selected Solar Technologies on Airports, November 2010, pages cited: 4, 6, 7.
Universal Wrecking Corporation, 2011. Universal Wrecking Corp. Completes Demolition of Concrete Aggregate Plant in PA. Available online at: http://www.universalwrecking.com/ index.php?mod=Projects&op=read&id=17. Accessed May 2, 2011.
Modesto Irrigation District (MID), 2010. MID Fast Facts, http://www.mid.org/about/fastfacts.htm, 2010.
National Renewable Energy Laboratory (NREL), Department of Energy Office of Energy Efficiency and Renewable Energy, Concentrating Solar Power (CSP), http://solareis.anl.gov/documents/docs/NREL_CSP_1.pdf, retrieved December 14, 2010.
Quantum Solar Power Corp. (Quantum), 2010. Quantum, A Comparison of PV Technologies. http://quantumsp.com/solar-energy/a-comparison-of-pv-technologies/, 2010.
Stanislaus County, 2007. Salida Community Plan, Map Exhibit B-1, accessed online February 11, 2011, http://www.co.stanislaus.ca.us/planning/pl/tmp-proj/salida-community-plan/salida-community-plan.pdf
Stanislaus County, 2010. Stanislaus County, 1994 General Plan Land Use Element, updated March 18, 2008, Policy 2, pages cited: 1-2, 1-26.

McHenry Solar Farm 4-1 May 2011 Draft Environmental Impact Report
CHAPTER 4 Environmental Analysis
Introduction to Environmental Analysis
This chapter provides discussion and public disclosure of the environmental impacts of the proposed Project and alternatives, including the No Project Alternative. This chapter examines the potential environmental impacts associated with the proposed Project and alternatives as they relate to the following 18 areas of environmental analysis:
4.1 Aesthetics, Visual Quality, and Light and Glare 4.10 Hydrology and Water Quality
4.2 Agriculture and Forest Resources 4.11 Land Use and Planning
4.3 Air Quality 4.12 Mineral Resources
4.4 Biological Resources 4.13 Noise
4.5 Cultural and Paleontological Resources 4.14 Population and Housing
4.6 Energy Conservation 4.15 Public Services
4.7 Geology and Soils 4.16 Recreation
4.8 Greenhouse Gases 4.17 Transportation and Traffic
4.9 Hazards and Hazardous Materials 4.18 Utilities and Service Systems
Analysis within each issue area includes consideration of the following components of the proposed Project:
Proposed Solar Star facilities:
- Solar field comprised of a combination of 1- and 1.5-MW power blocks
- On-site substation
- Operation and Maintenance (O&M) building
- Other site improvements, including access roads, fencing, lighting, and landscaping
Proposed MID facilities:
- 69-kV electrical switchyard on the Project site
- Approximately 700-foot-long 69-kV double-circuit overhead electric sub-transmission line and 12-kV distribution line
- Approximately 7.5 miles of new overhead fiber optic cable to be installed on the poles of an existing distribution and 69-kV sub-transmission line system
- A control building.

4. Environmental Analysis
McHenry Solar Farm 4-2 May 2011 Draft Environmental Impact Report
Within each of the environmental areas listed above, the discussion of project impacts is provided in the following format:
Regional and Local Setting
Regulatory Setting (i.e., applicable regulations, plans, and standards)
Baseline (i.e., identification of the baseline conditions against which the significance of Project impacts are assessed)
Significance Criteria
Environmental Impacts and Mitigation Measures for the Proposed Project
Environmental Impacts and Mitigation Measures for the Alternatives including the No Project Alternative
In addition to the No Project Alternative, the following alternatives are fully analyzed in this EIR (refer to Chapter 3 for a description of each alternative):
Reduced Project Alternative
Non-Agriculture Site Alternative
Each environmental issue area analyzed in this document provides background information and describes the environmental setting (baseline conditions) to help the reader understand the threshold that would cause an impact to occur. In addition, each section describes how an impact is determined to be “significant” or “less than significant.” Finally, the individual sections recommend mitigation measures to reduce significant impacts. Throughout Chapter 4, both impacts and the corresponding mitigation measures are identified by a bold letter-number designation (e.g., Impact 4.1-1 and Mitigation Measure 4.1-1).
In performing the analysis for this EIR, the EIR preparers relied on available published studies and reports and conducted independent investigations as needed. Information provided by the Applicant was also considered in the EIR analysis after independent review and assessment by the EIR preparers. The specific documents considered and relied upon are cited for each issue area in Sections 4.1 through 4.18.
Environmental Assessment Methodology
Environmental Baseline The analysis of each issue area begins with a characterization of the existing physical environmental conditions (baseline conditions, pursuant to §15125(a) of the State CEQA Guidelines) that may be affected by the proposed Project and alternatives. The environmental setting is, therefore, the environmental conditions that existed in the Study Area in December 2010 at the time the Notice of Preparation was published.

4. Environmental Analysis
McHenry Solar Farm 4-3 May 2011 Draft Environmental Impact Report
The effects of the proposed Project and alternatives are defined as changes to the environmental setting that are attributable to project components or operation. The environmental setting is the baseline physical conditions by which MID, as Lead Agency, determines whether impacts associated with the proposed Project and alternatives are significant.
Impact Significance Criteria Significance criteria are identified for each environmental issue area in each resource section evaluation. For this Project, the significance criteria from CEQA Guidelines Appendix G were used. The significance criteria serve as benchmarks for determining if a component action would result in a significant adverse environmental impact when evaluated against the baseline. According to the State CEQA Guidelines §15382, a significant effect on the environment means “…a substantial, or potentially substantial, adverse change in any of the physical conditions within the area affected by the project…”
Impact Analysis This EIR evaluates the environmental consequences and potential impacts that the proposed Project and the alternatives would create. The impacts identified were compared with predetermined specific significance criteria, and were classified according to significance categories listed below. The same methodology was applied systematically to each alternative. A comparative analysis of the Proposed Project and the alternatives is provided in Chapter 5 of this document. The cumulative impacts of the proposed Project, when viewed in conjunction with past, current, and reasonably foreseeable future projects, are described in Chapter 6.
This EIR lists impacts numerically and sequentially. An impact statement precedes the discussion of each impact and provides a summary of the impact topic. Each impact is categorized as one of the following:
No Impact: would not cause any change in the environment, as measured by the applicable significance criterion; therefore, no mitigation would be required.
Less than Significant: would not cause a substantial adverse change in the environment, as measured by the applicable significance criterion; therefore, no mitigation would be required.
Less than Significant with Mitigation: would cause a substantial adverse change in the physical conditions of the environment; one or more feasible mitigation measures would reduce the environmental effects to less than significant levels.
Significant and Unavoidable: would cause a substantial adverse change in the physical conditions of the environment; there is either no feasible mitigation available, or even with implementation of feasible mitigation measures, the Project would cause a significant adverse effect on the environment.
When significant impacts were identified, feasible mitigation measures were formulated to eliminate or reduce the intensity of the impacts and focus on the protection of sensitive resources.

4. Environmental Analysis
McHenry Solar Farm 4-4 May 2011 Draft Environmental Impact Report
The effectiveness of a mitigation measure was subsequently determined by evaluating the impact remaining after its application. Those impacts meeting or exceeding the impact significance criteria after mitigation were considered residual impacts that remain significant and unavoidable. Implementation of more than one mitigation measure may be needed to reduce an impact below a level of significance. The mitigation measures recommended in this document are identified within each issue area section (Sections 4.1 through 4.18) and are presented in the Mitigation Monitoring, Reporting and Compliance Program in Chapter 10 of this document.
As described in Section 2.5.8, Sub-transmission/Distribution Line and Switchyard, of the Project Description, three options are being considered for the alignment and interconnection point of the sub-transmission line (the Proposed Interconnection, Option 1, and Option 2). The options differ primarily in the location of the proposed substation, switchyard, control room, and O&M building; the length of the proposed sub-transmission line; and the interconnection point where the proposed sub-transmission line would tie into the existing MID 69-kV line. Because the selection of the final alignment from among these options would depend upon final site design and other factors, this EIR evaluates the potential environmental impacts of the option that would result in the “worst case” or maximum impacts for each resource area. The potential environmental impacts of the other two options would be no greater than what is described and addressed in each resource section for the “worst case” option. For resource areas where there would be meaningful impact distinctions between the options, those differences are documented and described. For many resource areas, the impact differences between the options are immaterial and no distinctions are noted.
Table 4.0-1 identifies the alignment/interconnection option that was assessed as the “worst case” option for each resource area and provides the rationale for each selection. For those resource areas for which the impacts would be essentially the same regardless of the option, the table entry is shown as “No Difference.”
Impacts of Alternatives Each issue area section (Sections 4.1 through 4.18) presents the impact analysis for each alternative; Chapter 5 provides a summary of the impacts of each alternative in comparison with the impacts of the proposed Project.
Incorporation of MID Program EIR In November 2000, MID published and certified a Final EIR for the Modesto Irrigation District Electrical Expansion Program (MID, 2000; referred to herein as the 2000 PEIR). The 2000 PEIR addressed the potential environmental effects, mitigation measures, and alternatives associated with MID’s proposed 5,500-square mile electrical expansion program. In September 2006, MID published and adopted an Addendum to the 2000 PEIR (MID, 2006; referred to herein as the 2006 PEIR Update). The 2006 PEIR Update was prepared to update portions of the 2000 PEIR environmental impact analysis and to amend the project description to reflect the reduced geographic scope of potential electrical expansion activity. The 2006 PEIR Update stated that MID has proceeded with electrical expansion within its statutorily defined service area, using the

4. Environmental Analysis
McHenry Solar Farm 4-5 May 2011 Draft Environmental Impact Report
TABLE 4.0-1 ALIGNMENT/INTERCONNECTION OPTION PROVIDING A “WORST CASE” BY RESOURCE AREA
Resource Area “Worst Case” Option Rationale
Aesthetics, Visual Quality, and Light and Glare
Proposed Interconnection
Sub-transmission line and poles would be along the northern edge of the property (greatest visibility to the public)
Agriculture and Forest Resources
No Difference No material difference in impacts among the three options
Air Quality Option 2 Longest sub-transmission line and greatest number of new poles to be installed (greatest air emissions)
Biological Resources Option 2 Longest sub-transmission line and greatest number of new poles to be installed (greatest potential for avian collision)
Cultural and Paleontological Resources
Option 2 Greatest number of new poles to be installed (greatest potential for disturbing unknown cultural or paleontological resources)
Energy Conservation No Difference No material difference in impacts among the three options
Geology and Soils No Difference No material difference in impacts among the three options
Greenhouse Gas Emissions Option 2 Longest sub-transmission line and greatest number of new poles to be installed (greatest GHG emissions)
Hazards and Hazardous Materials
No Difference No material difference in impacts among the three options
Hydrology and Water Quality No Difference No material difference in impacts among the three options
Land Use and Planning No Difference No material difference in impacts among the three options
Mineral Resources No Difference No material difference in impacts among the three options
Noise Option 2 (for construction noise)
Longest sub-transmission line and greatest number of new poles to be installed (most construction activity)
Proposed Interconnection (for operation noise)
Closest substation location to the nearest residence
Population and Housing No Difference No material difference in impacts among the three options
Public Services No Difference No material difference in impacts among the three options
Recreation No Difference No material difference in impacts among the three options
Transportation/Traffic No Difference No material difference in impacts among the three options
Utilities and Service Systems No Difference No material difference in impacts among the three options
environmental analysis contained in the 2000 PEIR; likewise, MID continues to use the updated environmental analysis in the 2006 PEIR Update for electrical expansion within its service area, such as the MID activities associated with the 69-kV sub-transmission line, distribution line, and fiber optic cable for the McHenry Solar Farm Project.
The 2000 PEIR and 2006 PEIR Update are specifically intended to provide coverage of the environmental effects and mitigation measures for those effects at the “project” level for predictable project types. Included among the predictable project types covered in the analysis are construction of new 69-kV to 115-kV transmission lines to new substations and extension of transmission and/or distribution facilities (2006 PEIR Update, pp. 2-1 to 2-2). Although installation of fiber optic cable is not specifically mentioned in the 2000 PEIR or 2006 PEIR

4. Environmental Analysis
McHenry Solar Farm 4-6 May 2011 Draft Environmental Impact Report
Update, that activity is substantially the same as installation or extension of electrical transmission and distribution lines because the same physical changes to the environment would be made in the same locations whether the poles and lines being installed are used for electrical transmission, fiber optics, or both; therefore, installation of fiber optic cable is effectively covered by the environmental analysis in those documents. Thus, the MID activities associated with the 69-kV sub-transmission line, distribution line, and fiber optic cable for the McHenry Solar Farm Project are in all respects identical to the predictable project types analyzed in the 2000 PEIR and 2006 PEIR Update.
The 2006 PEIR Update describes how impacts from MID’s electrical expansion activities may be considered in project-specific CEQA documents. The CEQA document is to include specific consideration of the issues addressed in the PEIR, the mitigation measures that need to be implemented, and the degree to which those mitigation measures are found to be necessary will be implemented. Further, the CEQA document may, if appropriate, incorporate the PEIR by reference. The document will establish for the record MID’s implementation of, or commitment to implement, any mitigation actions identified in the PEIR which are applicable to the subject project, as well as any other mitigation measures which may be required to avoid or reduce significant environmental effects (2006 PEIR Update; P. 3-4).
In conducting the impact analysis for the McHenry Solar Farm Project, when a potentially significant impact was identified that was unique to the 69-kV sub-transmission line, distribution line, or fiber optic cable, the 2000 PEIR and 2006 PEIR Update were reviewed to identify assessment methodologies, impacts, and/or mitigation measures that would apply to or otherwise inform the analysis. If a mitigation measure from the 2000 PEIR or the 2006 PEIR Update was determined to be applicable to MID’s activities on the McHenry Solar Farm project, then that mitigation measure has been included in this EIR. Any PEIR mitigation measures included in that manner have been given a bold letter-number designation consistent with the numbering convention used in this EIR (e.g., Mitigation Measure 4.1-1). However, it is clearly noted in the text of the impact discussion which mitigation measures were adopted from the PEIR documents.
References Modesto Irrigation District (MID), 2000. Final Program Environmental Impact Report for the
M.I.D. Electrical Expansion Program in portions of Alameda, Calaveras, Contra Costa, Mariposa, Merced, San Joaquin, Stanislaus, and Tuolumne Counties. State Clearinghouse Number: 1999012033. November 14 15, 2000.
Modesto Irrigation District (MID), 2006. Addendum to Program Environmental Impact Report, M.I.D. Electrical Expansion Program in portions of San Joaquin, Stanislaus and Tuolumne Counties. State Clearinghouse Number: 1999012033. September 15, 2006.

4. Environmental Analysis
McHenry Solar Farm 4.1-1 May 2011 Draft Environmental Impact Report
4.1 Aesthetics, Visual Quality, and Light and Glare
This section identifies and evaluates issues related to aesthetics, visual quality, and light and glare (also referred to generally as visual resources) in the context of the Project and alternatives. Discussed are the physical and regulatory setting; the baseline for determining environmental impacts; the criteria used for determining the significance of environmental impacts; potential impacts associated with construction, operation, maintenance, and decommissioning of the Project; and mitigation measures to reduce or avoid environmental impacts determined to be potentially significant.
4.1.1 Setting The geographic area relevant to the analysis of impacts on visual resources encompasses the landscapes directly affected by, and the surrounding areas that would be within view of, Project-related facilities and activities (i.e., the Project’s viewshed).
4.1.1.1 Definition of Concepts and Terminology
Visual resources are generally defined as both the natural and built features of the landscape that contribute to the public’s experience and appreciation of the environment. Depending on the extent to which a project’s presence would alter the perceived visual character and quality of the environment, a visual impact may occur. The structure of the setting section reflects each of the following visual resource concepts:
Visual Character is a general description of the visual attributes of a particular land-use setting. The purpose of defining the visual character of an area is to provide the context within which the visual quality of a particular site or locale is most likely to be perceived by the viewing public.
Visual Quality is defined as the overall visual impression or attractiveness of a site or locale as determined by its visual qualities (such as color, variety, vividness, coherence, uniqueness, harmony, and pattern). For the purpose of this analysis, the visual quality of a site or locale is defined according to three levels:
Low – defined as lacking in natural or cultural visual resource amenities typical of the region. A site with low visual quality will have visual qualities that are relatively unappealing and perceptibly uncharacteristic of the surrounding area.
Moderate – defined as typical or characteristic of the region’s natural or cultural visual amenities. A site with moderate visual quality maintains the visual character of the surrounding area, with visual qualities that do not stand out as either contributing to or detracting from the visual character of an area.
High – defined as visual resources that are unique or exemplary of the region’s natural or cultural scenic amenities. A site with high visual quality is likely to stand out as particularly appealing with a strongly positive contribution to the visual character of an area.

4. Environmental Analysis Aesthetics, Visual Quality, and Light and Glare
McHenry Solar Farm 4.1-2 May 2011 Draft Environmental Impact Report
The identification of viewer types and volumes describes the type and quantity of potentially affected viewers within the Visual Study Area (defined below). Land uses that derive value from the quality of their settings are considered potentially sensitive to changes in visual conditions. When describing viewer types and volumes it is important to identify sensitive viewers, who have a strong stake or interest in the quality of the landscape and have a greater sensitivity to changes that degrade or detract from the visual character of an area.
Viewer Exposure addresses the variables that affect viewing conditions of a site. Viewer exposure considers some or all of the following factors: landscape visibility (the ability to see the landscape), viewing distance (i.e., the proximity of viewers to the project), viewing angle (whether the project would be viewed from a superior, inferior or from a level line of sight), extent of visibility (whether the line of sight is open and panoramic to the project area or restricted by terrain, vegetation and/or structures), and duration of view.
Visual Sensitivity is the overall measure of an existing site’s susceptibility to adverse visual changes. Visual sensitivity is characterized according to high, moderate, and low visual sensitivity ranges and is based on the combined factors of visual quality, viewer types and volumes, and visual exposure to a project.
4.1.1.2 Visual Study Area
The Visual Study Area for the proposed Project is the area from which the solar facility and/or associated transmission line and interconnection would come into view. Because the Project area is located on, and surrounded by, flat land, the Project area tends to quickly disappear from view. Based on site photographs from a number of locations and Google Street views, foreground views are largely confined to locations immediately adjacent to the site. Middleground or background views, where available, are limited to within 0.25 mile of the closest edge of the site due to the flatness of the valley floor (beyond 0.25 mile the Project site is either out of view or indistinguishable from the horizon line of the valley floor). However, middleground and background views of the Project site are scarce because intervening orchards or homesteads tend to quickly screen the site from view. The degree to which off-site agricultural uses screen views of the site depends on the type and maturity of the crop (i.e., height) and the season of the year (i.e., presence or absence of foliage).
The fiber optic cable route is not included in the visual study area because the cable would be strung along existing poles which already carry multiple sub-transmission and distribution lines, and so the fiber optic cable would result in negligible visual change.
4.1.1.3 Regional and Local Setting
Section 2.2, Project Location and Existing Land Use, provides detailed information about the Project’s regional and local setting. This section provides setting information specific to visual resources, including the existing visual character of the region and the Project site, followed by a discussion of the visual character of public viewpoints (i.e., locations from which the Project would be visible to the public). Figure 4.1-1 is a viewpoint map that depicts photograph numbers and

iÇ
i Ç
iÇ
iÇiÇ
iÇ
iÇi Ç
iÇiÇiÇ
Residence (notpart of project)
Project Site
910118
7
6 45
32
1
MC H
ENRY
AVE
LADD RD PATTERSON RDSK
ITTON
E RD
STEWART RD
BELTIS
DR
HARTLEY DR
DEL C
IELO
WY
SPY GLASS D R
SHER
RY LN
SOURCE: Stanislaus County GIS, 2010
Project Location
Merced County
Stanislaus County
San Joaquin County TuolumneCounty
§̈¦5
ST132
ST108ST99
"
McHenry Solar Farm. 209517.01
Figure 4.1-1Photograph Viewpoint Location Map
i Setting Location
i Simulation Location
0 500
Feet
4.1-3

4. Environmental Analysis Aesthetics, Visual Quality, and Light and Glare
McHenry Solar Farm 4.1-4 May 2011 Draft Environmental Impact Report
provides the location and direction from which photographs of the Project site and its surrounding area were taken. Photographs 1 through 8, presented in Figure 4.1-2a and Figure 4.1-2b were assigned numbers by order of mention in this section.
Visual Character The region of interest includes unincorporated areas of Stanislaus County bounded on the north by the Stanislaus River, on the south by the City of Modesto, on the east by the City of Riverbank and on the west by the City of Salida. The area consists primarily of flat, agricultural fields with scattered rural residences, commercial and agricultural buildings, and existing infrastructure, such as local roads, State Route (SR) 108, fences, and power lines. Many of the fields surrounding the site support orchards, which obscure middleground/ background views as well as views of the horizon from many of the surrounding rural roads. Agricultural fields that support low-growing crops or are absent of vegetation open up views to the background, horizon, and sky.
Visual Quality The current use of the Project site and associated sub-transmission line and fiber optic cable route is predominantly agricultural, including row crops (strawberries), agricultural facilities and equipment, and related roads (see Figure 4.1-2a, Photos 1, 2, 3). The Project site is bordered to the south by Patterson Road/SR 108, and a private residence (see Figure 4.1-2a, Photo 4 and Figure 4.1-2b, Photo 5). McHenry Avenue, a two-lane road, borders the site to the west. Croplands and agricultural access roads border the site to the north and east. West of the site across McHenry Avenue is an agricultural field supporting orchards (see Figure 4.1-2b, Photo 7). A retail store is located at the intersection of Patterson Road/ SR 108 and McHenry Avenue to the south of the Project site (see Figure 4.1-2a, Photo 4 and Figure 4.1-2b, Photo 6). A mid-sized residential neighborhood is located north of the northwestern corner of the Project site on the west side of McHenry Avenue (see Figure 4.1-2b, Photo 8).
The site has crops in a repeating parallel alignment that is in harmony with the visual pattern of other agricultural uses in the region. The tan/brown (exposed soil), green (vegetation) and blue (sky) colors evident in views of the site are likewise repeated in the surrounding area. The site has low growing crops that provide a more open view of the horizon and sky than surrounding areas that support orchards. The presence of power lines, irrigation lines, and agricultural equipment/structures introduce features in the scene that detract slightly from the vivid colors, soft-line edges, and repeating patterns which contribute positively to the region’s visual quality. Generally, the site maintains the visual character of the surrounding area and therefore, the site is considered to have a moderate visual quality.
Viewer Types and Visual Exposure
Motorists and Cyclists
Public viewer types include motorists, and possibly cyclists, traveling past the Project site on McHenry Avenue, Patterson Road/SR 108, and Ladd Road. McHenry Avenue and Patterson Road/SR 108 are designated to carry moderate to high traffic volumes in the vicinity of the Project (Stanislaus

McHenry Solar Farm . 209517.01Figure 4.1-2a
Setting PhotosSOURCE: ESA, 2011
Photo 1: View looking southwest from inside the southern boundary of the Project site toward Patterson Road. The Project site is in the foreground.
Photo 3: View looking north from inside the southern boundary of the Project site. This view shows the north-south agricultural access road that bisects the Project site approximately in the middle.
Photo 2: View looking northwest from inside the southern boundary of the Project site. The Project site is in the foreground.
Photo 4: View from the southwest corner of the Project site looking southeast. Patterson Road is in the foreground and commercial/retail buildings are shown on the south side of Patterson Road.
4.1-5

McHenry Solar Farm . 209517.01Figure 4.1-2b
Setting PhotosSOURCE: ESA, 2011
Photo 5: View from the southwest corner of the Project site looking east toward the landowner’s private residence. Patterson Road is on the left side of the photo.
Photo 7: View from the west side of McHenry Avenue looking west into an orchard.
Photo 6: View from the southwest corner of the Project site looking south toward the commercial/retail buildings on the south side of Patterson Road.
Photo 8: View from the west side of McHenry Avenue looking north toward the community of Del Rio, which is just behind the light-colored sound wall on the left side of the photo.
4.1-6
4. Environmental Analysis Aesthetics, Visual Quality, and Light and Glare
McHenry Solar Farm 4.1-7 May 2011 Draft Environmental Impact Report
County, 2008). The most recent data published by Caltrans indicates the Annual Average Daily Traffic (AADT) on SR 108 is approximately 16,100 vehicles, which would represent a moderate viewer volume (Caltrans, 2010a). Ladd Road is designated as a collector roadway, and traffic volumes are low to moderate (Stanislaus County, 2008). Based on the size of the site and maximum speed limits, the site would come into view for less than a minute for travelers on these roadways in either direction. Motorists are generally not considered to be sensitive viewers, unless the road is designated as scenic (which neither road is). While the roadways do not have designated bike lanes, cyclists could also use the road for their recreation or commute, and would likely be slightly more sensitive to visual changes in the area.
Residences
There are a few residences within the Del Rio community, a residential community northwest of the site that may have views of the Project site. As shown on the left side of Photo 8, the residences facing the site are enclosed by a sound wall that is approximately 8 feet tall and a line of trees which screens the site from view from backyards and first floor windows. A few residents, however, may have views of the site from south- and east-facing second floor windows. In addition, the site could be exposed to approximately three homesteads located within 1,000 feet of the southeastern corner of the Project site, two homesteads west of the site along Ladd Road, and one residence on the north side of Patterson Road immediately adjacent to the site. These residences would likewise be potentially exposed to the site from second story windows, but most views are screened by intervening trees or orchards. The length of time such residents would be exposed to the view and the value that they place in the view is subjective and dependent on the individual; however, the second floor windows are likely to be bedrooms, in which case such views would be less sensitive than a patio, garden, or living room. Except for the closest residence on the north side of Patterson Road where unobstructed views from second floor windows are available, the Project site would occupy an inferior portion of the field of view (i.e., views would also encompass neighboring fields, the horizon, and sky). For the residence immediately adjacent to the site, the project would occupy a large portion of the view. Given these factors, the overall viewer volume and exposure for residences is considered to be low.
Parks and Open Space
There are no recreational facilities or natural space areas within view of the proposed Project.
Visual Sensitivity Visual sensitivity is the overall measure of an existing site’s susceptibility to adverse visual changes based on the combined factors of visual quality, viewer types and volumes, and visual exposure to a project. Based on the low number of residences with views of the Project site, the brief period that motorists would view the site, and the site’s moderate visual quality, the visual sensitivity of the Project area is considered to be low-to-moderate.
4.1.1.4 Light and Glare
No lighting currently is installed at the Project site. Lighting in the surrounding vicinity includes lighting associated with the Del Rio community to the northwest (streetlamps and residences), the retail store at the intersection of Patterson Road and McHenry Ave, rural residences to the

4. Environmental Analysis Aesthetics, Visual Quality, and Light and Glare
McHenry Solar Farm 4.1-8 May 2011 Draft Environmental Impact Report
southeast, and vehicle headlights (when present) along roadways. Daytime glare is generally absent in the area, and is limited to reflective surfaces such as windows, cars, and other metallic surfaces.
4.1.1.5 Regulatory Setting
Federal Because the Project is located on unincorporated Stanislaus County land, no federal visual resource policies (e.g., Bureau of Land Management or U.S. Forest Service) apply to the proposed Project.
State of California
California Scenic Highway Program
In 1963, the California legislature created the Scenic Highway Program to protect scenic highway corridors from changes that would diminish the visual value of lands adjacent to the highways. The State regulations and guidelines governing the Scenic Highway Program are found in the Streets and Highways Code, Section 260 et seq. A highway may be designated as “scenic” depending on how much of the natural landscape can be seen by travelers, the scenic quality of the landscape, and the extent to which development intrudes upon the travelers’ enjoyment of the view. No portion of the Project would be visible from Interstate 5, which is the only designated scenic highway in Stanislaus County (Caltrans, 2010b).
Stanislaus County
General Plan
There are no Stanislaus County-designated scenic roads or highways listed in the Stanislaus County General Plan; however, the Conservation/Open Space Element of the Stanislaus County General Plan provides policies to encourage the protection and preservation of natural and scenic areas throughout the county. General Plan policies that protect scenic areas seek to maintain and protect open space, recreational areas, and areas of biological diversity including riparian habitats, vernal pools, rare plants, and oak woodlands (Stanislaus County, 2008).
Stanislaus County Code
The Stanislaus County Code establishes the following regulations relevant to the proposed Project. Title 21, Zoning, provides definitions of land zoning districts and provisions related to land uses and standards in specific zoning areas. Chapter 21.102, Landscaping Code, provides requirements for a landscaping plan to reduce water consumption in the landscape environment using conservation principles and would be relevant to the proposed Project.
4.1.1.6 Baseline
The environmental setting described above constitutes the baseline for determining the significance of potential impacts on visual resources. Baseline views include those described above in Section 4.1.2.1, Regional and Local Setting, and portrayed in Figure 4.1-2a and Figure 4.1-2b. In summary baseline conditions are as follows:

4. Environmental Analysis Aesthetics, Visual Quality, and Light and Glare
McHenry Solar Farm 4.1-9 May 2011 Draft Environmental Impact Report
The Project site is not visible from a scenic highway.
There are no recreational facilities from which the Project site would be visible.
The visual sensitivity of the site is low to moderate, based on the low number of residences with views of the Project site, the brief period that motorists would view the site, and the site’s moderate visual quality.
No lighting currently is installed at the Project site. Existing levels of light and glare surrounding the site are low.
4.1.2 Significance Criteria Based on CEQA Guidelines Appendix G, a project would cause a significant impact on visual
resources if it would:
a) Have a substantial adverse effect on a scenic vista
b) Substantially damage scenic resources, including, but not limited to, trees, rock outcroppings, and historic building within a state scenic highway
c) Substantially degrade the existing visual character or quality of the site and its surroundings.
d) Create a new source of substantial light or glare which would adversely affect day or nighttime views in the area
4.1.3 Discussion of Criteria with No Visual Resource Impacts Analysis of the setting and Project characteristics relative to the significance criteria show that the Project would have no impact on visual resources with respect to criteria a) and b). The reasoning supporting this conclusion follows.
a) The Project would not have a substantial adverse effect on a scenic vista.
There are no State or locally designated scenic vistas or natural/open space areas as defined by the Conservation/Open Space Element within the visual study area of the Project (Stanislaus County, 2008). Therefore, there would be no impacts to scenic vistas or sensitive areas from construction, operation and maintenance, and decommissioning of the proposed Project.
b) The Project would not substantially damage scenic resources, including, but not limited to, trees, rock outcroppings, or historic buildings within a State scenic highway.
There are no designated county or city scenic highways in Stanislaus County, nor are there any designated or eligible federal or state scenic highways or roads from which the Project site can be seen (Caltrans, 2010b; Stanislaus County, 2008). Further, there are no unique or scenic trees, rock outcroppings, or historic structures on the site. Therefore, the Project would have no impact on scenic resources within a state scenic highway corridor.

4. Environmental Analysis Aesthetics, Visual Quality, and Light and Glare
McHenry Solar Farm 4.1-10 May 2011 Draft Environmental Impact Report
4.1.4 Impacts and Mitigation Measures
c) Substantially degrade the existing visual character or quality of the site and its surroundings.
This significance criterion is applicable to all locations where the proposed Project would result in either temporary or permanent visual change. The Project is considered to “substantially degrade” the visual character or quality of a site if it would have a strongly negative influence on the public’s experience and appreciation of the visual environment. As such, visual changes are always considered in the context of a site or locale’s visual sensitivity (as described in the setting). Visual changes caused by the Project are evaluated in terms of their visual contrast with the area’s predominant landscape elements and features, their dominance in views relative to other existing features, and the degree to which they could block or obscure views of aesthetically pleasing landscape elements. The magnitude of visual change that would result in a significant impact (i.e., substantial degradation) is inversely related to the visual sensitivity of a site.
Impact 4.1-1: The Project could degrade the existing visual character or quality of the site and its surroundings. (Less than significant)
Construction/Decommissioning
As discussed in Chapter 3, Project Description, construction of the proposed solar facility would occur over approximately 10 months. Construction activities would involve site preparation, solar array construction, distribution line installation and conductoring, installation of fiber optic cable, and construction of a substation, switchyard, and O&M building. Installation of the fiber optic cable line would involve two crews using two line trucks to string the cable pole to pole along an existing power line route. Because this activity would likely occur for less than a day in any one place, and would not require clearing, grading, or other visual changes, the visual impacts of the fiber optic cable line installation would be less than significant.
Construction staging and site preparation for the solar array, substation, switchyard, O&M building, and sub-transmission line would be delineated within the confines of the Project site. Because the Project site is essentially flat, minimal to no grading is expected to be required for the construction of the solar array. However, light grubbing, grading, and trenching would be required for the development of site access roads and installation of utility lines. Construction-related impacts to the visual character and quality would result from the presence of exposed soil, construction-related vehicles, heavy equipment, building materials, and work crews at the Project site. Construction activity would occur in phases, and would not occupy the whole site at any one time, but would nevertheless represent a noticeable visual change from existing conditions. Construction-related clearing and grubbing would not be wholly out of character with plowing and field preparation activities that is typical of agricultural fields, but is likely to last longer, and would be accompanied by post driving and tracker installation activities. Construction materials and equipment would primarily be confined to staging areas, and the greatest degree of visual clutter associated with construction activities would occur at staging areas, the substation, switchyard, and O&M site, which occupy a small fraction of the site as a whole (i.e., less than

4. Environmental Analysis Aesthetics, Visual Quality, and Light and Glare
McHenry Solar Farm 4.1-11 May 2011 Draft Environmental Impact Report
one percent of the Project area). Given the fact that construction-related visual changes would not occur permanently (i.e., would be limited to a maximum of 10 months) and that the site has a low-to-moderate visual sensitivity, construction would have a less than significant impact on the existing visual character or quality of the site and its surroundings.
Upon the termination of the PPA, the Project would cease operation, the facilities would be decommissioned and dismantled and the site restored to its pre-existing agricultural use. The visual impact of decommissioning would be less than significant for the same reasons discussed above for construction of the Project. Decommissioning activities would be approximately three months in duration, substantially shorter than the constructions phase. Following decommissioning, the site would be restored to its pre-existing condition. Therefore, visual impacts from decommissioning activities would be less than significant.
Maintenance/Operation
Operational impacts associated with the Project would be viewed in the context of new structures at the Project site over a 25-year period. Figures 4.1-3 through 4.1-6 present simulated views of the Project with the sub-transmission line. Figure 4.1-3 and 4.1-4 shows the proposed Project and interconnection as viewed from the northwestern corner of the site looking toward the east and southeast, respectively. Figure 4.1-5 shows the same southeast view, except with Option 1 for the sub-transmission line route (which would join the existing Ladd-Clough 69-kv transmission line further south). Figure 4.1-6 shows the same southeast view, except with Option 2 for the sub-transmission line route (which would require a longer interconnection than Option 1).
The proposed Project would replace an agricultural field with a solar panel array, a substation, switchyard, O&M building, a 6- to 8-foot-high perimeter fence, and a new sub-transmission line. The landscape buffer would screen a majority of the Project from passing motorists (see Figure 4.1-3 through 4.1-6). Although the perimeter fence would provide a continuous visual barrier that is uncharacteristic of the rural region, the perimeter landscaping would provide a row of trees that mimics the rows of orchards found in the surrounding area. Considering the screening provided by the landscape buffer, the visual change associated with the presence of the Project would be readily noticed, but unlikely to be perceived negatively by motorists or cyclists. A few residences would have views of the Project area from their second floor windows, and may perceive the visual changes as unappealing; however, the number of affected residences is low. Given their elevated position, views would also encompass neighboring fields, the horizon, and sky, which would lessen any perceived negative influence caused by the proposed Project. Given the low to moderate visual sensitivity of the site, impacts from operation and maintenance of the solar array, substation, switchyard, and O&M building would be less than significant.
The residence on Patterson Road immediately adjacent to the Project site is owned and occupied by the landowner from whom the Applicant would be leasing the land for the Project. Views of the Project facilities from this residence would be substantially screened by existing intervening trees and shrubs, although unobstructed views of Project facilities may occur from second story windows. However, because the landowner is a willing participant in the Project, the visual sensitivity of the landowner is considered low. Therefore, visual impacts from operation and

McHenry Solar Farm . 209517.01Figure 4.1-3
Visual Simulation of Proposed InterconnectionSOURCE: ESA
a. Photos 9 and 10: Existing view from the west side of McHenry Avenue looking east though southeast. The Project site is the green area in the middle of the photo. The dirt road and gate on the left side of the photo are the northern boundary of the Project site.
b. Simulated view of Photos 9 and 10 showing the entrance gate to the solar farm and the landscape screening along the western boundary of the Project site; solar panels are not visible behind the landscape screening. The proposed interconnection sub-transmission, distribution, and fiber optic lines are shown on new poles along the northern boundary of the site, beginning at the interconnection pole in the foreground.
4.1-12

McHenry Solar Farm . 209517.01Figure 4.1-4
Visual Simulation of Western Project BoundarySOURCE: ESA
a. Photos 10 and 11: Existing view from the west side of McHenry Avenue looking southeast though south. The Project site is the green area in the left-middle of the photo. MID’s existing Ladd-Clough sub-transmission line is shown along the west side of McHenry Avenue on the right side of the photo.
b. Simulated view of Photos 10 and 11 showing the landscape screening and fence along the western boundary of the Project site; solar panels are not visible behind the landscape screening. The interconnection pole is shown in the foreground.
4.1-13

McHenry Solar Farm . 209517.01Figure 4.1-5
Visual Simulation of Interconnection Option 1SOURCE: ESA
a. Photos 10 and 11: Existing view from the west side of McHenry Avenue looking southeast though south. The Project site is the green area in the left-middle of the photo. MID’s existing Ladd-Clough sub-transmission line is shown along the west side of McHenry Avenue on the right side of the photo.
b. Simulated view of Photos 10 and 11 showing the landscape screening and fence along the western boundary of the Project site; solar panels are not visible behind the landscape screening. The Option 1 interconnection poles are visible in the distance near the right-middle of the photo.
4.1-14

McHenry Solar Farm . 209517.01Figure 4.1-6
Visual Simulation of Interconnection Option 2SOURCE: ESA
a. Photos 10 and 11: Existing view from the west side of McHenry Avenue looking southeast though south. The Project site is the green area in the left-middle of the photo. MID’s existing Ladd-Clough sub-transmission line is shown along the west side of McHenry Avenue on the right side of the photo.
b. Simulated view of Photos 10 and 11 showing the landscape screening and fence along the western boundary of the Project site; solar panels are not visible behind the landscape screening. The Option 2 interconnection poles are visible in the distance from the middle to the right-middle of the photo.
4.1-15

4. Environmental Analysis Aesthetics, Visual Quality, and Light and Glare
McHenry Solar Farm 4.1-16 May 2011 Draft Environmental Impact Report
maintenance of the solar array, substation, switchyard, and O&M building would be less than significant for this nearest residence.
The proposed sub-transmission line would involve the installation of several poles, with the exact number of poles (and corresponding length of the sub-transmission line) depending on the option chosen for the interconnection (see Figure 2-6). The proposed interconnection would be 700 feet long involving four new poles and replacement of one existing pole (shown in Figure 4.1-3). Compared to other options, this alignment places the sub-transmission line closest to the Del Rio community. The shortest interconnection option (Option 1) would be 300 feet long and require two new poles and replacement of one existing pole (shown in Figure 4.1-5). The longest option (Option 2) would be 1,500 feet long and would require eight new poles and replacement of one existing pole (shown in Figure 4.1-6.) Given the height of the new poles would be 65 feet, and electrical wires would be strung pole to pole as shown in the simulations, the sub-transmission line would introduce a noticeable and adverse visual element to the site that would not be screened by the perimeter landscaping. Due to the proximity and angle of the proposed interconnection in relation to the residences which may have views of the Project, it would likely have a greater adverse visual effect on views of the site than Options 1 or 2. For both motorists and residences, the shortest option (Option 1) would have the least adverse visual effect. The other residences described in the setting could have distant views of the sub-transmission line that would constitute a minor fraction of the whole of their view.
Although the new poles would represent an incremental increase in the perception of industrial features in an otherwise agricultural area; given the small number of poles, the low-to-moderate visual sensitivity of the site, and the existing presence of Ladd-Clough 69-kv transmission line (and other distribution lines in the area), the new poles for any of the three options would result in a less than significant impact on the visual character and quality of the Project site.
The new fiber optic cable would be installed on existing poles and would parallel existing electrical lines; therefore changes to the visual character along that alignment would be negligible.
d) Create a new source of substantial light or glare which would adversely affect day or nighttime views in the area
Impact 4.1-2: The Project would create a new source of light or glare which could adversely affect daytime or nighttime views in the area. (Less than significant with mitigation)
Construction/Decommissioning
Construction and decommissioning activities for all facilities would be scheduled during daylight hours (7:00 am to 7:00 pm), minimizing the need for construction lighting and the potential for lighting-related impacts on nighttime views in the area. However, nighttime work may occur on occasion, depending on schedule considerations. In such cases, temporary artificial illumination would be required to protect the safety of the construction workers, and could temporarily increase ambient light to surrounding areas. If improperly shielded, nighttime lighting could

4. Environmental Analysis Aesthetics, Visual Quality, and Light and Glare
McHenry Solar Farm 4.1-17 May 2011 Draft Environmental Impact Report
present a nuisance to nearby residents. This would be a potentially significant impact despite the expected infrequent need for nighttime construction and the low number of residences affected. This impact would be reduced to a less than significant level with the implementation of Mitigation Measure 4.1-2.
Mitigation Measure 4.1-2: Nighttime Construction Lighting. Nighttime construction lighting, if required, shall be shielded and oriented downward to minimize effects on any nearby receptors. Lighting shall be directed toward active construction areas only, and shall have the minimum brightness necessary to ensure worker safety.
Maintenance/Operation
The Project would be configured as a solar panel array comprised of solar photovoltaic panels made of high efficiency monocrystalline silicon with anti-reflective glass. Daytime glare would be controlled by the solar PV panels’ anti-reflective glass, resulting in approximately half the reflectance of standard residential and commercial glass (SunPower, 2008). Due to the limited rotation angles, the solar PV panels have no potential for reflecting the sun’s rays upon a ground-based observer. Furthermore, planned landscaping as part of the Project would block motorist’s views of the PV panels (see Figures 4.1-3 though 4.1-6). While the perimeter landscaping may not shield the PV array for a few residents with second floor views, the glare would be half the reflectance of glass, and would be short-lived. For these reasons potential impacts from daylight glare would be a less than significant.
Nighttime lighting for the main entrance, the O&M building, the substation, and the switchyard would be required from dusk till dawn for safety and security. The exterior lighting would be shielded or directed downward to reduce nighttime light spillover onto adjacent properties. The potential for operation of the Project to result in lighting impacts by increasing ambient light to surrounding areas and reducing sky or star visibility would be negligible. The perimeter landscape would shield adjacent motorists from facility lighting. As discussed in the setting, existing sources of light exist from surrounding homesteads and vehicles on local roadways. The number of residents potentially affected by facility lighting would be low, and the effect of facility lighting for residents would be minimal because it would be shielded, directed downward, and not highly out of character with surrounding land uses. As such, because the Project would not create a new source of substantial light or glare which would adversely affect nighttime views in the area, impacts would be less than significant.
The proposed electrical interconnection (all options) and the fiber optic cable do not require lighting along their alignments. Therefore, no new sources of light would occur from their presence. Also, the new poles for the interconnection would be made of wood material, which would not be a source of glare. However, conductors and insulators could be potentially reflective, which could cause glare. This effect could result in the sub-transmission components to be briefly noticed by affected viewers. However, the magnitude of such an increase in glare is not anticipated to be substantial given the size of the conductor cable, the angle from which viewers would be exposed to the conductor, and the short duration of exposure. View duration for motorists would be relatively short, although longer for affected residents. Finally, the conductor is expected to oxidize to a dull finish in approximately 9 to 24 months, which would minimize

4. Environmental Analysis Aesthetics, Visual Quality, and Light and Glare
McHenry Solar Farm 4.1-18 May 2011 Draft Environmental Impact Report
glare (SunPower, 2008). Therefore, temporary and permanent impacts to daytime glare in the area would be less than significant.
4.1.5 Alternatives
4.1.5.1 Reduced Project
The Reduced Project Alternative would represent an incremental change to the visual character or quality of views toward the Project site that are currently experienced by the public; however, it would have fewer visual impacts than that of the Project. Analysis of the Project (Section 4.1.4) determined that construction/decommissioning-related impacts would be less than significant. The construction-related impacts of this alternative would be similar to or the same as those of the Project because construction activities would be the same and would involve a similar degree of soil disturbance. It is noted that, although the size of the PV array would be reduced, the same land area would be disturbed with this alternative as for the proposed Project – either from solar PV facilities or from new landscaping installed in a buffer around the solar facilities.
Analysis of the Project (Section 4.1.4) determined that visual impacts during maintenance/operation would be less than significant because site landscaping would sufficiently screen the Project site such that it would not be substantially out of character with the surrounding area. Additionally, daytime glare and nighttime lighting would be controlled by design specifications of the PV panels and exteriors lights. Site landscaping would further shield viewers from glare and lighting such that the Project would not impact daytime or nighttime views. Compared to the Project, the Reduced Project Alternative would increase the setback distance of the proposed PV panels to 300 feet from McHenry Avenue and Patterson Road. This would allow for more landscape planting and would provide a denser screening of on-site facilities from motorists and other passers-by, which would further lessen the potential visual impact of the solar arrays along McHenry Avenue and Patterson Road. Therefore, the Reduced Project Alternative, during operation, would result in less of a visual impact than that of the Project.
Construction, operation, maintenance, and decommissioning of the Reduced Project Alternative would result in less of an impact to visual resources than that of the Project. As such the visual impact from the Reduced Project Alternative would be less than significant.
4.1.5.2 Non-Agriculture Site
The Non-Agriculture Site Alternative would result in impacts to visual resources that are reduced, when compared to the Project. The Non-Agriculture site is located approximately 4 miles southwest of the Project site. Viewers in the vicinity of the Non-Agriculture Site would include staff/students of the Joseph Gregori High School off of Pirrone Road, immediately southeast of the site; workers in private agricultural fields; staff/patrons of a commercial restaurant on Stoddard Road; and motorists on Stoddard Road and Pirrone Road. While there are no public recreational facilities in the vicinity of the alternative site with views of proposed facilities, several athletic facilities at Joseph Gregori High School may have distant, low-angle views of the site.

4. Environmental Analysis Aesthetics, Visual Quality, and Light and Glare
McHenry Solar Farm 4.1-19 May 2011 Draft Environmental Impact Report
The 29-acre alternative site is located between Sisk and Stoddard Roads in the community of Salida in unincorporated Stanislaus County. The site has existing buildings and structures, and is representative of a built-up industrial or urban building site. Construction activities would be similar to those discussed for the Project; however, demolition of the existing buildings on the site would be required as part of the site preparation. Demolition of the existing structures would have a greater visual impact than the Project, because the Project would not require the demolition of any existing buildings or structures on-site. Additionally, 1.25 miles of transmission lines upgrades, including the replacement 33 existing wooden poles with 33 new 65-foot-tall wooden poles, would be required to transmit electricity to the MID grid; whereas, the Project would require between 3 to 9 new wooden poles. Given the temporary and relatively short duration of construction, as well as the presence of existing buildings at the alternative site, demolition and construction would not substantially degrade the existing visual character or quality of the site and its surroundings (i.e., the construction-related impacts would be less than significant). However, the visual impacts from construction for the Non-Agriculture Site would be greater than those of the Project.
Operation of the Non-Agricultural Site Alternative would result in less of a visual impact than that of the Project, because the alternative site would reduce the height and intensity of development currently present, and the project resulting from the Non-Agricultural Site Alternative would have a smaller footprint than the Project (29 acres versus 154 acres). This site is representative of a built-up industrial or urban building site, which is uncommon in the immediate surroundings and somewhat out of character with the predominantly agricultural uses in the vicinity. The site is designated as Planned Industrial by the Stanislaus County General Plan, and is not a designated scenic area. From the perspective of a passing motorist, this alternative would replace an industrial building center with a solar panel array, a substation, switchyard, O&M building, a 6- to 8-foot-high perimeter fence, perimeter landscaping, and a new 1.25-mile-long sub-transmission line. The reduced height of development for the solar facility compared to the site’s existing use would generally increase the compatibility of the development with the surrounding agricultural land. The solar fields would be low-profile compared to the existing cluster of buildings, and would open up views of the sky, and the perimeter landscape would be similar in appearance existing landscaping. Lighting requirements would be similar or reduced compared to the Project because the size of appurtenant facilities may be smaller for the alternative site due to the lower energy output. Because the sub-transmission line would be longer than that of the Project, visual impacts of that project component during construction would be greater than that of the Project. However, the Non-Agricultural Site Alternative, taken as a whole, would result in less than significant impact, and less of a visual impact than the Project.
4.1.5.3 No Project
If the No Project Alternative is implemented, construction, operation, and decommissioning of the proposed Project would not occur. Therefore, there would be no change in existing visual resources, resulting in no impact.

4. Environmental Analysis Aesthetics, Visual Quality, and Light and Glare
McHenry Solar Farm 4.1-20 May 2011 Draft Environmental Impact Report
References – Aesthetics, Visual Quality, and Light and Glare California Department of Transportation (Caltrans), 2010a. 2009 Traffic Volumes on California
State Highways, available online at http://traffic-counts.dot.ca.gov/index.htm; accessed December 20, 2010.
California Department of Transportation (Caltrans), 2010b. California Scenic Highway Mapping System: Stanislaus County, available online at http://www.dot.ca.gov/hq/LandArch/scenic_highways/index.htm; accessed December 15, 2010.
Stanislaus County, 2008. 1994 Stanislaus County General Plan, rev. December 2008.
SunPower Corporation (SunPower), Possible Glare and Reflectance in PV Systems, April 4, 2008.

4. Environmental Analysis
McHenry Solar Farm 4.2-1 May 2011 Draft Environmental Impact Report
4.2 Agriculture and Forest Resources
This section identifies and evaluates issues related to Agriculture and Forest Resources in the context of the Project and alternatives. Discussed are the physical and regulatory setting; the baseline for determining environmental impacts; and the criteria used for determining the significance of environmental impacts. Potential impacts associated with construction, operation, maintenance, and decommissioning of the Project and mitigation measures to reduce or avoid environmental impacts determined to be potentially significant are also discussed.
4.2.1 Setting
4.2.1.1 Regional and Local Setting
Section 2.2, Project Location and Existing Land Use, provides general information about the regional and local setting. This section 4.2.1 provides setting information specific to Agriculture and Forest Resources.
The Project site is designated for agricultural use in the Stanislaus County General Plan, and is zoned General Agriculture with a 40-acre minimum parcel size (A-2-40) pursuant to the County Code (Stanislaus County, 2011b). Current land use within the Project site is agricultural, and includes row cropping (strawberries) and related access roads. Surrounding land uses also are zoned for agricultural use and mostly consist of orchards growing crops such as almonds, peaches, nectarines, and apricots. An existing residence and associated buildings located on Patterson Road near the intersection with McHenry Avenue are not part of the Project site. This is the closest residence to the Project site. A furniture store is located south of the Project site at the intersection of Ladd Road/Patterson Road and McHenry Avenue. Del Rio, an unincorporated community of primarily single-family homes and the Del Rio Golf and Country Club, is located northwest of the Project site. There are no areas of forest land or timberland located in the Project area.
4.2.1.2 Regulatory Setting
State of California
California Important Farmland Inventory System and Farmland Mapping and Monitoring Program The California Department of Conservation, Division of Land Resource Protection, maintains the Farmland Mapping and Monitoring Program (FMMP) and monitors the conversion of farmland to and from agricultural use through its Important Farmland Inventory System. Farmlands are divided into the following categories based on their suitability for agriculture:
Prime Farmland. Land that has the best combination of physical and chemical characteristics for crop production. When treated and managed, its soil quality, growing season, and irrigation supply produce sustained high crop yields.

4. Environmental Analysis Agriculture and Forest Resources
McHenry Solar Farm 4.2-2 May 2011 Draft Environmental Impact Report
Farmland of Statewide Importance. Land other than Prime Farmland that has a good combination of physical and chemical characteristics, including irrigation, for crop production.
Unique Farmland. Land that does not meet the criteria for Prime Farmland or Farmland of Statewide Importance, but has produced specific crops with high economic value.
Farmland of Local Importance. Land that is either currently producing crops or has the capability to produce, but does not meet the criteria of the categories above.
Grazing Land. Land whose vegetation is suitable for grazing livestock.
Other Lands. Land that does not meet the criteria of any of the other categories.
Urban and Built-up Land. Land occupied by structures with a building density of at least one unit to 1.5 acres, or approximately six structures to a 10-acre parcel.
Water. Perennial water bodies with an extent of at least 40 acres.
The mapping system uses a minimum mapping unit size of 10 acres (DOC, 2011).
FMMP classifications are based on soil quality and irrigation status. They differ from general plan designations and zoning because they are used to evaluate the type and amount of farmlands, rather than to designate appropriate sites for particular land uses and regulate development and use. Instead, the FMMP uses these designations as part of its neutral reporting program that classifies land based on its suitability for agriculture. The FMMP also produces a biannual report on the amount of land converted from agricultural to nonagricultural use.
California Public Resource Code
The California Public Resources Code governs forestry, forests, and forest resources, as well as range and forage lands, within the state. “Forest land” is defined by Public Resources Code Section 12220(g) as “land that can support 10 percent native tree cover of any species, including hardwoods, under natural conditions, and that allows for management of one or more forest resources, including timber, aesthetics, fish and wildlife, biodiversity, water quality, recreation, and other public benefits.” Relatedly, “timberland” is defined by Public Resources Code Section 4526 as, “land, other than land owned by the federal government..., which is available for, and capable of, growing a crop of trees of any commercial species used to produce lumber and other forest products, including Christmas trees.”
California Government Code
Chapter 6.7 of the California Government Code (Sections 51100-51155) regulates timberlands within the state. “Timberland production zone” is defined in Section 51104(g) as an area that has been zoned pursuant to Government Code Section 51112 or 51113 and is devoted to and used for growing and harvesting timber, or for growing and harvesting timber and compatible uses. In this context, “compatible uses” include any use that “does not significantly detract from the use of the property for, or inhibit, growing and harvesting timber” (Government Code Section 51104(h)).

4. Environmental Analysis Agriculture and Forest Resources
McHenry Solar Farm 4.2-3 May 2011 Draft Environmental Impact Report
Watershed management, grazing, and the erection, construction, alteration, or maintenance of electric transmission facilities are examples of compatible uses.
California Land Conservation Act of 1965 – “Williamson Act”
The California Land Conservation Act of 1965 (Williamson Act) authorizes local governments to enter into contracts with private landowners to restrict specific parcels of land to agricultural or related open space use for a rolling 10-year period (see, Government Code Section 51200 et seq.). In return, landowners’ property taxes are assessed at a much lower than normal rate, because they are based upon farming and open space uses as opposed to full market value. Local governments receive an annual subvention of forgone property tax revenues from the state via the Open Space Subvention Act of 1971. Pursuant to Government Code Section 51238 (a)1, “the erection, construction or maintenance of…electric (facilities)…are hereby determined to be compatible uses within any agricultural preserve.”
Stanislaus County
General Plan
The Stanislaus County General Plan contains goals, policies, and implementation measures that could be applicable to the Proposed Project. For example, the Land Use Element contains policies that describe the allowed uses of agricultural land and the compatibility of adjacent land with agricultural practices (e.g., Policies 2 and 14). Policy 10 in the Conservation/Open Space Element discourages dividing agricultural land if it results in ceasing agricultural uses. The Agricultural Element policies include those that relate to strengthening and preserving agricultural land uses, minimizing conflicts with non-agricultural land uses, and mitigating the impacts of farmland conversion (e.g., Policies 1.10, 2.3, 2.7, 2.14 and 2.15). Policy 2.15 requires the replacement of agricultural land at a 1:1 ratio to mitigate the conversion of agricultural land resulting from a discretionary project requiring a General Plan or Community Plan amendment changing the land use designation from agriculture to a residential designation. Appendix A of the Agricultural Element includes buffer and setback guidelines designed to minimize conflicts between agricultural and non-agricultural uses (Stanislaus County, 2008).
Zoning Ordinance
The Project site is zoned General Agriculture with a 40-acre minimum parcel size (A-2-40) (Stanislaus County, 2011b). Chapter 21.20.030 of the County Code describes uses requiring a permit in the A-2 District. Section C (Tier Three) uses are those that are not directly related to agriculture, but may be necessary to serve the A-2 District or may be difficult to locate in an urban area. Facilities for public utilities are included as a Tier Three use. Tier Three uses may be allowed in the A-2-40 zone without a zoning change when the Planning Commission makes findings that the use will not be substantially detrimental to or in conflict with agricultural uses in the vicinity. The subject parcel must also not be located in one of the county’s “most productive agricultural areas,” as the term is used in the Agricultural Element of the General Plan, or the character of the requested use is such that the land may be reasonably returned to agricultural use in the future.

4. Environmental Analysis Agriculture and Forest Resources
McHenry Solar Farm 4.2-4 May 2011 Draft Environmental Impact Report
Besides the possible extension of proposed sub-transmission and distribution line across McHenry Avenue if Option 1 or 2 are implemented, the only other component of the Proposed Project that would extend off-site is the approximately 7.5 miles of fiber optic cable. The connection of sub-transmission and distribution lines and installation of fiber optic cable would be via existing lines and right-of-way.
Right-to-Farm Ordinance
Title 9, Chapter 9.32, Agricultural Land Policies, limits the circumstances under which agricultural operations may be deemed to constitute a nuisance and also provides for notification of the county’s recognition and support of the “right to farm.” The Right-to-Farm ordinance is designed to protect farmland by requiring disclosure to purchasers and users of property next to or near agricultural operations of the inherent potential problems associated with living near actively farmed land. Such concerns may include, but are not limited to, noise, odors, flies, fumes, dust, operation of machinery of any kind (including aircraft), storage and disposal of manure, and application by spraying or otherwise of chemical fertilizers, soil amendments, herbicides, and pesticides. It is intended that, through mandatory disclosures, purchasers and users will better understand the impact of living near agricultural operations and be prepared to accept attendant conditions as the natural result of living in or near rural areas (Stanislaus County, 2011a).
4.2.1.3 Baseline
Important Farmland within the Project Site Figure 4.2-1 shows the California Department of Conservation’s Farmland Mapping and Monitoring Program (FMMP) classifications for land in the Project vicinity. Figure 4.11-1 in Section 4.11, Land Use and Planning, shows the Stanislaus County General Plan’s land use classifications for the properties within the Project site and Project area.
As shown in Figure 4.2-1, the Project site is classified as Prime Farmland pursuant to the FMMP. Most of the adjacent area also is classified as Prime Farmland, with the exception of the Del Rio area, which is classified as Urban and Built-Up Land. As shown in Figure 4.11-1, the entire Project site is designated for agricultural use by the Stanislaus County General Plan. All of the surrounding parcels also are designated as agricultural land except for the Del Rio area, which includes Low Density Residential and Planned Development designations. Figure 4.2-1 also shows lands subject to a Williamson Act contract. The Project site is not subject to a Williamson Act contract. There are some parcels that have Williamson Act contracts in the vicinity of the site to the northeast, southeast, and south.
Table 4.2-1 summarizes changes to agricultural land within Stanislaus County as of 2008. The county experienced a net loss of 2,840 acres of agricultural land between 2006 and 2008. The most significant net loss was in Grazing Land; 440 acres of Prime Farmland also were converted.

Residence (notpart of project)
Project Site
MC H
ENRY
AVE
LADD RD PATTERSON RDSK
ITTON
E RD
STEWART RD
BELTIS
DR
HARTLEY DR
DEL C
IELO
WY
SPY GLASS D R
SHER
RY LN
SOURCE: DOC, 2006, 2008
Project Location
Merced County
Stanislaus County
San Joaquin County TuolumneCounty
§̈¦5
ST132
ST108ST99
"
McHenry Solar Farm. 209517.01
Figure 4.2-1Important Farmland and Williamson Act
Contracted Land within the Project Vicinity
Williamson Act Contracted Land
Prime Farmland
Farmland of Statewide Importance
Unique Farmland
Urban and Built-Up Land
0 500
Feet
4.2-5

4. Environmental Analysis Agriculture and Forest Resources
McHenry Solar Farm 4.2-6 May 2011 Draft Environmental Impact Report
TABLE 4.2-1 RECENT FARMLAND CONVERSIONS IN STANISLAUS COUNTY
Land Use Category
Total Acres Inventoried 2006–2008 Acreage Changes
2006 2008 Acres Lost Acres Gained Net Change
Prime Farmland 256,605 256,165 3,663 3,223 -440 Farmland of Statewide Importance 29,925 31,448 546 2,069 1,523 Unique Farmland 75,444 81,368 2,426 8,350 5,924 Farmland of Local Importance 33,706 31,159 3,756 1,209 -2,547 Grazing Land 441,436 434,136 8,684 1,384 -7,300
Agricultural Land Subtotal 837,116 834,276 19,075 16,235 -2,840
SOURCE: California Department of Conservation, Division of Land Resource Protection, 2010.
4.2.2 Significance Criteria Based on CEQA Guidelines Appendix G, a project would cause a significant impact on
agriculture and forest resources if it would:
a) Convert Prime Farmland, Unique Farmland, or Farmland of Statewide Importance (Farmland), as shown on the maps prepared pursuant to the Farmland Mapping and Monitoring Program of the California Resources Agency, to non-agricultural use;
b) Conflict with existing zoning for agricultural use, or a Williamson Act Contract;
c) Conflict with existing zoning for, or cause rezoning of, forest land (as defined in Public Resources Code section 12220(g), timberland (as defined by Public Resources Code section 4526), or timberland zoned Timberland Production (as defined by Government Code section 51104(g));
d) Result in the loss of forest land or conversion of forest land to non-forest use; or
e) Involve other changes in the existing environment, which due to their location or nature, could result in conversion of Farmland, to non-agricultural use or conversion of forest land to non-forest use.
4.2.3 Discussion of Criteria with No Agriculture and Forest Resources Impacts
Analysis of the setting and Project characteristics relative to the significance criteria show that the Proposed Project would have no impact on agriculture and forest resources with respect to criteria b), c), d), or e). The reasoning supporting this conclusion follows.
b) The Project would not conflict with existing zoning for agricultural use or a Williamson Act contract.
The Project site is zoned General Agriculture with a 40-acre minimum parcel size (A-2-40). Chapter 21.20.030 of the County Code describes uses requiring a permit in the A-2 District.

4. Environmental Analysis Agriculture and Forest Resources
McHenry Solar Farm 4.2-7 May 2011 Draft Environmental Impact Report
Tier Three uses are those that are not directly related to agriculture but may be necessary to serve the A-2 District, or may be difficult to locate in an urban area. Facilities for public utilities are included as a Tier Three conditionally permitted use.
Tier Three uses may be allowed when the Planning Commission makes findings that the use will not be substantially detrimental to or in conflict with agricultural uses in the vicinity, and the subject parcel is not located in one of the county’s “most productive agricultural areas,” as the term is used in the Agricultural Element of the General Plan; or the character of the use is such that the land may be reasonably returned to agricultural use in the future.
The Project site would be returned to use for row crops upon decommissioning. Therefore, the Project would not conflict with agricultural zoning with issuance of a Use Permit and so would have no impact related to conflict with existing zoning for agricultural use.
Appendix A of the county’s General Plan Agricultural Element includes buffer and setback guidelines designed to minimize conflicts between agricultural and non-agricultural uses as a consequence of new or expanding non-agricultural uses approved in or adjacent to the A-2 District. Buffer design standards for new non-agricultural uses, such as the proposed Project, require a minimum 150-foot wide buffer with vegetative screening consisting of two staggered rows of drought-tolerant trees and shrubs at least six feet tall at the time of installation.
The Applicant has proposed the following alternate buffers:
45-foot-wide buffer on the northern property line;
110-foot-wide buffer on the eastern property line;
180-foot-wide buffer on the western property line1;
135-foot-wide buffer on the southern property line2, beginning at the southeast corner of the Project site and extending approximately 1,300 feet westward to the eastern property boundary of the existing off-site residence located near the intersection with McHenry Avenue; and
115-foot-wide buffer on the southern property line2, beginning at the southwest corner of the Project site and extending approximately 510 feet eastward to the western property boundary of the off-site residence.
Vegetative landscaping is proposed along the southern and western boundaries with a six-foot-high fence around the entire site perimeter. The western and southern boundaries would include a 30-foot-wide landscape buffer and a 24-foot-wide perimeter access road inside the fenceline. The northern and eastern boundaries would also include 24-foot-wide perimeter access roads.
The buffers proposed by the Applicant would not be consistent with the county’s buffer and setback guidelines described in Appendix A of the Agricultural Element. However, alternative
1 Buffer width is measured from the centerline of McHenry Avenue, in accordance with county methodology. 2 Buffer width is measured from the centerline of Patterson Road, in accordance with county methodology.

4. Environmental Analysis Agriculture and Forest Resources
McHenry Solar Farm 4.2-8 May 2011 Draft Environmental Impact Report
buffer and setback designs are allowed upon review and support of the Stanislaus County’s Agricultural Advisory Board prior to consideration by the County Planning Department. The Applicant has submitted a request for approval of the alternate buffers described above, which are consistent with alternate buffers that have been approved by the county for other projects such as the Fink Road Solar farm (Stanislaus County, 2010a). Therefore, upon approval of the alternative buffers proposed by the Applicant, the Project would not conflict with the buffer and setback requirements of the A-2 District.
In addition, no farmland on the Project site is subject to a Williamson Act contract. Therefore, there would be no impact related to a conflict with a Williamson Act contract.
c) The Project would not conflict with existing zoning for, or cause rezoning of, forest land or timberland.
The Project would not be located on land zoned specifically as either forest land or timberland. The Project would be located primarily on land zoned for agricultural production. Although timber production is an allowable activity within an agricultural zone, the Project site is not used for timber production, nor is it forested. Furthermore, crops grown at the Project site are irrigated because of the arid climate. It is unlikely that the land could support 10 percent native tree cover under natural (i.e., non-irrigated) conditions. Therefore, the Project site does not meet the definition of “forest land.” The same land is not considered timberland because the land is not zoned Timberland Production Zone (TPZ). Moreover, the Project site is currently used to grow strawberries, and therefore, is not available for growing a crop of trees. No impact to forest land would occur.
d) The Project would not result in the conversion of forest land to non-forest use.
See response to criterion c). None of the land within the Project boundary meets the definition of forest land. Therefore, the Project would not convert any forest land to non-forest use, and no impact would occur.
e) The Project would not involve another change in the existing environment which, due to its location or nature, could result in conversion of Farmland to non-agricultural use.
Project implementation would not involve conversion of Farmland to non-agricultural use at any off-site location. This is because the electrical connection tie-in on McHenry Avenue, associated with Options 1 and 2, would occur at an existing pole location (i.e., replacement of existing pole). In addition, the fiber optic cable would be installed on existing poles. Therefore, there would be no impact with respect to criterion e).

4. Environmental Analysis Agriculture and Forest Resources
McHenry Solar Farm 4.2-9 May 2011 Draft Environmental Impact Report
4.2.4 Impacts and Mitigation Measures a) Convert Prime Farmland, Unique Farmland, or Farmland of Statewide Importance
(Farmland), as shown on the maps prepared pursuant to the Farmland Mapping and Monitoring Program of the California Resources Agency, to non-agricultural use;
Impact 4.2-1: The Project would temporarily discontinue the current exclusive agricultural use (row crops) of Prime Farmland to a mix of agricultural use (grazing) and non-agricultural use. (Less than significant)
Project construction (lasting approximately 10 months) and decommissioning (lasting approximately 3 months) would result in a temporary disturbance to approximately 154 acres of land designated as Prime Farmland. Because the site is essentially level with an approximate 3-foot gradual elevation drop across the site, no fill imported material would be required and no site soil would be exported, thus preserving the existing topsoil. On-site soils would further be protected from erosion by implementation of a Stormwater Pollution Prevention Plan (SWPPP).
During operation of the Project as a solar facility (approximately 25 years), use of the site for row crops would not continue. The height of the proposed solar panel arrays would provide sufficient clearance to allow small livestock (such as goats and sheep) to graze underneath and around the solar panel arrays. According to SunPower (Solar Star’s parent company), this practice is being used successfully for weed and grass control at other SunPower solar project sites. To the extent that the McHenry site will support suitable native grasses, grazing would be accommodated by contracting with professionally managed herds to feed on the native grass mixture on a semi-annual or quarterly basis.
It is expected that the site would be returned to exclusive agricultural use similar to existing conditions upon decommissioning of the Project when the Power Purchase Agreement between the Applicant and MID expires. None of the alterations to the site made by installing the solar array would permanently impair the ability of the land to be used to grow row crops after the solar array is decommissioned. No topsoil would be removed from the site in the course of installing, operating, or decommissioning the Project. The temporary nature of the project is memorialized in the lease terms between the Applicant and the famer who owns the site; the lease requires the Applicant to return the site to a condition suitable for its pre-existing agricultural use at the end of the lease term. In its Notice of Intent to Adopt the Initial Study and Mitigated Negative Declaration for the Fink Road Solar Farm (Use Permit 2010-03) dated December 1, 2010, the Stanislaus County Planning and Community Development Department determined that a similar temporary use of farmland for a solar farm was a less than significant impact, finding that because the land would be returned agricultural use at the end of the useful life of the solar equipment, the solar farm was “not a permanent conversion” (Stanislaus County, 2010b). Therefore, the temporary conversion of Farmland on the Project site would be less than significant.

4. Environmental Analysis Agriculture and Forest Resources
McHenry Solar Farm 4.2-10 May 2011 Draft Environmental Impact Report
4.2.5 Alternatives
4.2.5.1 Reduced Project
Similar to the Project, this alternative (construction, operating, and decommissioning) would not conflict with existing zoning for, or cause rezoning of forest land or timberland, or result in the conversion of forest land to non-forest use. This alternative would also be consistent with the existing zoning for agricultural use. A similar acreage of Prime Farmland (154 acres) would be converted from exclusive agricultural use (row crops) to a mix of agricultural use (grazing) and non-agricultural use, as the increased setbacks would also convert farmland. No conflict with a Williamson Act contract would result if this alternative is implemented because the site does not have a Williamson Act Contract.
4.2.5.2 Non-Agriculture Site
The Non-Agriculture Site Alternative is currently developed with buildings, structures, and paved parking areas. The site is designated as Planned Industrial by the Salida Community Plan and also zoned as Planned Industrial. Therefore, similar to the Project site, this alternative (construction, operation, and decommissioning) would not conflict with existing zoning for, or cause rezoning of forest land or timberland, or result in the conversion of forest land to non-forest use. This site does not contain Prime Farmland; therefore, this alternative would not result in an impact regarding conversion of Prime Farmland to non-agricultural use. In addition, this site is not zoned agriculture or forest land, so development of the Non-Agriculture Site into a solar farm would not conflict with existing county zoning designations or regulations regarding agriculture or forest land.
4.2.5.3 No Project
If the No Project Alternative is implemented, construction, operation, and decommissioning of the Proposed Project would not occur. Therefore, there would be no impact related to Agriculture and Forest Resources. Existing agricultural practices at the site are expected to continue to occur, and the site is not considered to be, nor is it zoned, as forestland.
References – Agriculture and Forest Resources California Department of Conservation (DOC), 2011. Farmland Mapping and Monitoring
Program, www.consrv.ca.gov/DLRP/FMMP/Pages/Index.aspx, accessed April 25, 2011.
Stanislaus County, 2008. 1994 Stanislaus County General Plan, rev. December 2008.
Stanislaus County, 2010a. Use Permit No. 2010-03, Fink Road Solar Farm - Alternative Agricultural Buffer and Setbacks. Memo to Agricultural Advisory Committee. April 26, 2010.
Stanislaus County, 2010b. Initial Study/Proposed Mitigated Negative Declaration, Fink Road Solar Farm Project. November 18, 2010.

4. Environmental Analysis Agriculture and Forest Resources
McHenry Solar Farm 4.2-11 May 2011 Draft Environmental Impact Report
Stanislaus County Code, 2011a, Title 9, Health and Safety, Chapter 9.32, Agricultural Land Policies.
Stanislaus County Code, 2011b, Title 21, Zoning, Chapter 21.20, General Agriculture District (A-2).

4. Environmental Analysis
McHenry Solar Farm 4.3-1 May 2011 Draft Environmental Impact Report
4.3 Air Quality
This section identifies and evaluates the potential impacts on regional and local air quality that would result from sources of air emissions during construction and maintenance, operation, and decommissioning of the Project. Discussed are the physical and regulatory setting; the baseline for determining environmental impacts; the criteria used for determining the significance of environmental impacts; the potential impacts; and mitigation measures to reduce or avoid environmental impacts determined to be potentially significant.
This section is based on a review of existing documentation of air quality conditions in the region, air quality management plans, and air quality regulations from the U.S. Environmental Protection Agency (USEPA), the California Air Resources Board (CARB), and the San Joaquin Valley Air Pollution Control District (SJVAPCD).
4.3.1 Setting
4.3.1.1 Regional and Local Setting
Section 2.2, Project Location and Existing Land Use, provides general information about the regional and local setting. This section 4.3.1 provides setting information specific to Air Quality.
Air quality is a function of both the rate and location of pollutant emissions that are influenced by meteorological conditions and topographic features that affect pollutant movement and dispersal. Atmospheric conditions, such as wind speed, wind direction, atmospheric stability, and air temperature gradients, interact with the physical features of the landscape to determine the movement and dispersal of air pollutants. The Project is located within the San Joaquin Valley Air Basin (SJVAB), which falls under the jurisdiction of the SJVAPCD.
Regional Topography, Meteorology, and Climate Topography and meteorology greatly influence air quality. Factors such as wind, sunlight, temperature, humidity, rainfall, and topography all affect the accumulation and/or dispersion of pollutants.
The Study Area, which includes the Project and alternatives sites, is located in the San Joaquin Valley, in Stanislaus County, California. The Study Area is located at the base of the Sierra Nevada in the SJVAB. The San Joaquin Valley is shaped like a bowl, bound by the Sierra Nevada to the east, the Coastal Ranges to the west, and the Tehachapi mountains to the south. Air movement is generally restricted by the region’s topographic features, thereby making the region highly susceptible to accumulation of air pollutants (SJVAPCD, 2002).
The SJVAB has a Mediterranean climate and is characterized by long, hot, dry summers and short, foggy winters. Meteorological data collected in Modesto generally are representative of the Study Area. Average maximum and minimum winter (i.e., January) temperatures in Modesto are of

4. Environmental Analysis Air Quality
McHenry Solar Farm 4.3-2 May 2011 Draft Environmental Impact Report
54.6 degrees Fahrenheit (ºF) and 38.4 ºF, respectively, and average summer (i.e., July) maximum and minimum temperatures in Modesto are 95.0 ºF and 63.5 ºF, respectively (WRCC, 2010).
The presence and intensity of sunlight exacerbate air pollution impacts. Typically, ozone is formed at higher temperatures. In the presence of ultraviolet sunlight and warm temperatures, air pollutants, such as reactive organic gases (ROGs) and nitrogen oxides (NOx), react to form secondary photochemical pollutants, including ozone. The potential for ozone formation in the Study Area is high due, in part, to an average of over 260 sunny days per year in the SJVAB.
The wind in the Study Area blows predominantly from the north and west. There are two main strong wind patterns. One of the patterns is wind blowing into the Study Area from the north. This wind blows into the SJVAB through the Sacramento-San Joaquin River Delta. The other wind pattern is wind coming over the Coast Range from the Pacific Ocean (CARB, 2010a). Precipitation in the Study Area averages approximately twelve inches per year (WRCC, 2010).
Existing Air Quality SJVAPCD operates a regional monitoring network that measures the ambient concentrations of criteria pollutants. Existing air quality in the Study Area can generally be inferred from ambient air quality measurements conducted by SJVAPCD at its stations closest to the Study Area: the Modesto – 14th Street station and the Stockton-Hazelton station. The Modesto monitoring station is approximately six miles south of the Study Area and the Stockton-Hazelton station is approximately 21 miles northwest of the Study Area. The Modesto station monitors ozone and particulate matter equal to or less than 2.5 microns in diameter (PM2.5). The Stockton-Hazelton station monitors particulate matter equal to or less than 10 microns in diameter (PM10) and nitrogen dioxide (NO2).
Background ambient concentrations of pollutants are determined by pollutant emissions in a given area as well as wind patterns and meteorological conditions for that area. As a result, background concentrations can vary among different locations within an area. However, areas located close together and exposed to similar wind conditions can be expected to have similar background pollutant concentrations. Table 4.3-1 shows a three-year (2007 through 2009) summary of monitoring data collected at Modesto and Stockton monitoring stations. The PM10 and NO2 data are from the Stockton station and the PM2.5 and ozone data are from the Modesto station. The data are compared with the California Ambient Air Quality Standards (CAAQS) and National Ambient Air Quality Standards (NAAQS).
As indicated in Table 4.3-1, the state one-hour ozone standard was exceeded each year between 2 and 21 times and the national and state eight-hour ozone standards were exceeded between 5 and 30 times, and between 13 and 53 times, respectively, during the three-year study period. The state ozone annual average standard was exceeded each year during the study period. The state 24-hour PM10 standard is estimated to have been exceeded each of the study period years between four and eight times. There were no exceedances of the PM10 24-hour national standard during the three-year study period. The national 24-hour PM2.5 standard is estimated to have been exceeded each year between 16 and 35 times, and the state annual average standard was exceeded each year during the study period. There were no violations of the NO2 standards during the three-year study period.

4. Environmental Analysis Air Quality
McHenry Solar Farm 4.3-3 May 2011 Draft Environmental Impact Report
TABLE 4.3-1 AIR QUALITY DATA SUMMARY (2007–2009) FOR THE STUDY AREA
Pollutant Standard
Monitoring Data by Year
2007 2008 2009
Ozone Highest 1 Hour Average (ppm) 0.101 0.138 0.125
Days over 1 Hour State Standard 0.09 2 21 8
Highest State 8 Hour Average (ppm) 0.089 0.130 0.103
Days over 8 Hour National Standard 0.075 5 30 18
Days over 8 Hour State Standard 0.070 13 53 34
Particulate Matter (PM10):
Highest State 24 Hour Average (µg/m3) 75.0 105.0 58.8
Days over State Standarda 50 4 8 3
Days over National Standarda 150 0 0 0
Annual Average (µg/m3) 27.7 31.1 23.6
Exceed State Standard? 20 Yes Yes Yes
Particulate Matter (PM2.5)
Highest State 24 Hour Average (µg/m3) 107.1 118.8 61.5
Days over National Standarda 35 16 23 35
Annual Average (μg/m3) 15 16 16.1
Exceed State Standard? 12 Yes Yes Yes
Nitrogen Dioxide (NO2)
Highest 1 Hour Average (ppm) 0.070 0.076 0.068
Days over 1 Hour State Standard 0.18 0 0 0
Annual Average 0.016 0.017 0.015
Exceed State Standard? 0.030 No No No ppm = parts per million; μg/m3 = micrograms per cubic meter
a Measurements are usually collected every six days. Days over the standard represent the estimated number of days that the standard would have been exceeded if sampling was conducted every day.
SOURCE: CARB, 2010b.
Based on ambient conditions, the SJVAB is a nonattainment area for state and federal ozone and PM2.5 standards and the state PM10 standards. Table 4.3-2 lists the current attainment status of the SJVAB. Following the table are summary descriptions of the criteria pollutants.
Ozone
Ozone is a respiratory irritant and an oxidant that increases susceptibility to respiratory infections and that can cause substantial damage to vegetation and other materials. Ozone is not emitted directly into the atmosphere, but is a secondary air pollutant produced in the atmosphere through a complex series of photochemical reactions involving ROG and NOx. ROG and NOx are known as precursor compounds for ozone. Significant ozone production generally requires ozone precursors to be present in a stable atmosphere with strong sunlight for approximately three hours.

4. Environmental Analysis Air Quality
McHenry Solar Farm 4.3-4 May 2011 Draft Environmental Impact Report
TABLE 4.3-2 SAN JOAQUIN VALLEY AIR BASIN ATTAINMENT STATUS
Pollutant Federal State
Ozone (one-hour standard) ---a Nonattainment
Ozone (eight-hour standard) Nonattainment Nonattainment
Carbon Monoxide (CO) Unclassified/Attainment Unclassified/Attainment
Nitrogen Dioxides (NO2) Unclassified/Attainment Attainment
Inhalable Particulates (PM10) Attainment Nonattainment
Fine Particulates (PM2.5) Nonattainment Nonattainment a The federal one-hour standard was revoked on June 15, 2005. SOURCE: SJVAPCD, 2010a.
Ozone is a regional air pollutant because it is not emitted directly by sources, but is formed downwind of sources of ROG and NOx under the influence of wind and sunlight. Ozone concentrations tend to be higher in the late spring, summer, and fall, when the long sunny days combine with regional subsidence inversions to create conditions conducive to the formation and accumulation of secondary photochemical compounds like ozone.
Particulate Matter
PM10 and PM2.5 represent fractions of particulate matter that can be inhaled into air passages and the lungs and can cause adverse health effects. Particulate matter in the atmosphere results from many kinds of dust- and fume-producing industrial and agricultural operations, fuel combustion, and atmospheric photochemical reactions. Some sources of particulate matter, such as demolition and construction activities, are more local in nature, while others, such as vehicular traffic, have a more regional effect. Very small particles of certain substances (e.g., sulfates and nitrates) can cause lung damage directly, or can contain absorbed gases (e.g., chlorides or ammonium) that may be injurious to health. Particulate matter can also damage materials and reduce visibility.
Other Criteria Pollutants
Carbon monoxide (CO) is a non-reactive pollutant that is a product of incomplete combustion and is mostly associated with motor vehicle traffic. High CO concentrations develop primarily during winter when periods of light winds combine with the formation of ground level temperature inversions (typically from the evening through early morning). These conditions result in reduced dispersion of vehicle emissions. Motor vehicles also exhibit increased CO emission rates at low air temperatures. When inhaled at high concentrations, CO combines with hemoglobin in the blood and reduces the oxygen-carrying capacity of the blood. This results in reduced oxygen reaching the brain, heart, and other body tissues. This condition is especially critical for people with cardiovascular diseases, chronic lung disease, or anemia.
Sulfur dioxide (SO2) is produced through combustion of sulfur or sulfur-containing fuels, such as coal. SO2 is also a precursor to the formation of atmospheric sulfate and particulate matter (both

4. Environmental Analysis Air Quality
McHenry Solar Farm 4.3-5 May 2011 Draft Environmental Impact Report
PM10 and PM2.5) and contributes to potential atmospheric sulfuric acid formation that could precipitate downwind as acid rain.
Lead has a range of adverse neurotoxin health effects, and formerly was released into the atmosphere primarily via leaded gasoline. The phase-out of leaded gasoline has resulted in decreasing levels of atmospheric lead.
Sensitive Receptors For the purposes of air quality and public health and safety, sensitive receptors generally are defined as land uses with population concentrations that would be particularly susceptible to disturbance from dust and air pollutant concentrations, or other disruptions associated with project construction and/or operation. Sensitive receptor land uses generally include schools, day care centers, hospitals, residential areas, and parks. Some sensitive receptors are considered to be more sensitive than others to air pollutants. The reasons for greater-than-average sensitivity include pre-existing health problems, proximity to emission sources, or duration of exposure to air pollutants. Schools, hospitals, and convalescent homes are considered to be relatively sensitive to poor air quality because children, elderly people, and the infirm are more susceptible to respiratory distress and other air quality-related health problems than the general public. Residential areas are considered sensitive to poor air quality because people usually stay home for extended periods of time, with associated greater exposure to ambient air quality. Recreational uses also are considered sensitive because vigorous exercise associated with recreation places a high demand on the human respiratory system.
Sensitive receptors in the Study Area are rural residences. The closest residence to the Project boundary is adjacent to the site along Ladd Road. As shown in Figure 2-1, this residence is not part of the Project site. The next nearest residences are as close as 100 feet from the northwest corner of the site in the Del Rio community across McHenry Road.
4.3.1.2 Regulatory Setting
Air quality within the SJVAB is addressed through the efforts of various federal, state, and local government agencies. These agencies work jointly, as well as individually, to improve air quality through legislation, regulations, planning, policy-making, education, and a variety of programs. The air pollutants of concern and agencies primarily responsible for improving the air quality within the SJVAB and the pertinent regulations are discussed below.
Criteria Air Pollutants Regulation of air pollution is achieved through both national and state ambient air quality standards and emission limits for individual sources of air pollutants. As required by the federal Clean Air Act, the USEPA has identified criteria pollutants and has established NAAQS to protect public health and welfare. NAAQS have been established for ozone, CO, NO2, SO2, PM10, PM2.5, and lead. These pollutants are called “criteria” air pollutants because standards have been established for each of them to meet specific public health and welfare criteria. To protect human health and

4. Environmental Analysis Air Quality
McHenry Solar Farm 4.3-6 May 2011 Draft Environmental Impact Report
the environment, the USEPA has set “primary” and “secondary” maximum ambient thresholds for all seven criteria pollutants. Primary thresholds were set to protect human health, particularly for sensitive receptors such as children, the elderly, and individuals suffering from chronic lung conditions such as asthma and emphysema. Secondary standards were set to protect public welfare and prevent damage to visibility, animals, crops, vegetation, and buildings.
The NAAQS are defined as the maximum acceptable concentration that may be reached, but not exceeded, more than once per year. California has adopted more stringent ambient air quality standards for most of the criteria air pollutants. Table 4.3-3 presents both sets of ambient air quality standards (i.e., national and state). California has also established state ambient air quality standards for sulfates, hydrogen sulfide, and vinyl chloride; however, air emissions of these pollutants would not be expected if the Project is implemented. Thus, there is no further mention of these pollutants in this EIR.
TABLE 4.3-3 STATE AND NATIONAL CRITERIA AIR POLLUTANT STANDARDS
Pollutant Averaging Time State Standard National Standard
Ozone 1-Hour 8-Hour
0.09 ppm 0.070 ppm
– 0.075 ppm
Carbon Monoxide 1-Hour 8-Hour
20 ppm 9.0 ppm
35 ppm 9 ppm
Nitrogen Dioxide 1-Hour Annual
0.18 ppm 0.030 ppm
0.100 ppma 0.053 ppm
Sulfur Dioxide
1-Hour 3-Hour
24-Hour Annual
0.25 ppm –
0.04 ppm –
0.075 ppm 0.5 ppm
-- --
Respirable Particulate Matter (PM10) 24-Hour Annual
50 µg/m3 20 µg/m3
150 µg/m3 –
Fine Particulate Matter (PM2.5) 24-Hour Annual
– 12 µg/m3
35 µg/m3 15.0 µg/m3
Lead Monthly
Quarterly 1.5 µg/m3
– –
1.5 µg/m3
ppm = parts per million µg/m3 = micrograms per cubic meter a To attain this standard, the three-year average of the 98th percentile of the daily maximum one-hour average at each monitor within an
area must not exceed 0.100 ppm (effective January 22, 2010). SOURCE: CARB, 2010d.
Toxic Air Contaminants Toxic Air Contaminants (TACs) are airborne substances that are capable of causing short-term (acute) and/or long-term (chronic or carcinogenic, i.e., cancer-causing) adverse human health effects (i.e., injury or illness). TACs include both organic and inorganic chemical substances. They may be emitted from a variety of common sources including gasoline stations, automobiles, dry cleaners, industrial operations, and painting operations. The current California list of TACs

4. Environmental Analysis Air Quality
McHenry Solar Farm 4.3-7 May 2011 Draft Environmental Impact Report
includes approximately 200 compounds, including particulate emissions from diesel-fueled engines (CARB, 2011).
Federal and State Regulations USEPA is responsible for implementing programs established pursuant to the federal Clean Air Act, such as establishing and reviewing the NAAQS and judging the adequacy of state Implementation Plans (SIPs), and has delegated the authority to implement many of the federal programs to the states while retaining an oversight role to ensure that the programs continue to be implemented.
CARB is responsible for establishing and reviewing the state standards, compiling the California SIP and securing approval of that plan from USEPA, conducting research and planning, and identifying TACs. CARB also regulates mobile sources of emissions in California, such as construction equipment, trucks, and automobiles, and oversees the activities of California’s air quality management districts, which are organized at the county or regional level.
Regulations for Mobile Sources of Air Pollutants
The following air quality regulations apply to mobile sources and are directly relevant to the Project. On-road vehicles with a gross vehicular weight rating of 10,000 pounds or greater shall not idle for longer than five minutes at any location as required by Section 2485 of Title 13, Division 3, Chapter 10, Article 1 of the California Code of Regulations. This restriction does not apply when vehicles remain motionless during traffic or when vehicles are queuing. Off-road equipment engines shall not idle for longer than five minutes per Section 2449(d)(3) of Title 13, Division 3, Chapter 9, Article 4.8 of the California Code of Regulations. Exceptions to this rule include the following: idling when queuing; idling to verify that the vehicle is in safe operating condition; idling for testing, servicing, repairing or diagnostic purposes; idling necessary to accomplish work for which the vehicle was designed (such as operating a crane); idling required to bring the machine to operating temperature as specified by the manufacturer; and idling necessary to ensure safe operation of the vehicle.
In addition, as part of California’s Diesel Risk Reduction Plan, CARB has passed numerous regulations to reduce diesel emissions from vehicles and equipment that are already in use. Combining these retrofit regulations with new engine standards for diesel fueled vehicles and equipment, by 2020 CARB intends to reduce diesel particulate matter (PM) emissions by 85 percent from year 2000 levels. California Diesel Fuel Regulations (13 Cal. Code Regs. §§ 2281-2285; 17 Cal. Code Regs. § 93114) provide standards for motor vehicle fuels and diesel fuel.
Local Regulations and Plans
San Joaquin Valley Air Pollution Control District
The Project would be located within the jurisdiction of the SJVAPCD. The SJVAPCD regulates air pollutant emissions for all sources throughout the SJVAB other than motor vehicles. The SJVAPCD enforces regulations and administers permits governing stationary sources. The following rules, regulations, and plans would apply to the Project.

4. Environmental Analysis Air Quality
McHenry Solar Farm 4.3-8 May 2011 Draft Environmental Impact Report
Regulation VIII (Fugitive PM10 Prohibitions). Regulation VIII contains rules developed pursuant to USEPA guidance for serious PM10 nonattainment areas. Rules included under this regulation limit fugitive PM10 emissions from the following sources: construction, demolition, excavation, extraction and other earth moving activities, bulk materials handling, carryout and track-out, open areas, paved and unpaved roads, unpaved vehicle/equipment traffic areas, and agricultural sources. Table 4.3-4 contains control measures that the Applicant would be required to implement during Project construction activities pursuant to Rule 8021, Construction, Demolition, Excavation, Extraction, and Other Earthmoving Activities.
Rule 4102 (Nuisance). Rule 4102 prohibits the discharge of air contaminants or other materials in quantities that may cause injury, detriment, nuisance, or annoyance to any considerable number of persons or to the public or which endanger the comfort, repose, health, or safety of any such person or the public.
Rule 9510 (Indirect Source Review). Rule 9510 requires certain development projects to mitigate exhaust emissions from construction equipment greater than 50 horsepower to 20 percent below statewide average NOx emissions and 45 percent below statewide average PM10 exhaust emissions. This rule also requires applicants to reduce baseline emissions of NOx and PM10 emissions associated with operations by 33.3 percent and 50 percent respectively over a period of 10 years.
Air Quality Management Plans. As required by the federal Clean Air Act and the California Clean Air Act, air basins or portions thereof have been classified as either “attainment” or “nonattainment” for each criteria air pollutant, based on whether or not the standards have been achieved. Jurisdictions of nonattainment areas also are required to prepare an air quality management plan (AQMP) that includes strategies for achieving attainment. The SJVAPCD’s most recent AQMP for ozone attainment is the 1-hour Extreme Ozone Attainment Demonstration Plan, which was adopted by the SJVAPCD in October 2004 and amended in October 2005. The purpose of this plan is to set forth emission reduction goals and a timeline for attaining the federal one-hour ozone ambient air quality standards in the SJVAB by November 15, 2010. On March 8, 2010, the USEPA approved the 2004 Extreme Ozone Attainment Plan for 1-hour ozone.
In April 2007, the SJVAPCD Board adopted the 2007 Ozone Plan and CARB approved the plan on June 14, 2007. The 2007 Ozone Plan includes a comprehensive list of regulatory and incentive based measures to reduce emissions of ozone and particulate matter precursors throughout the SJVAB. Additionally, this plan calls for major advancements in pollution control technologies for mobile and stationary sources of air pollution, and an increase in state and federal funding for incentive-based measures to create adequate reductions in emissions to bring the entire SJVAB into attainment with the federal 8-hour ozone standard (CARB, 2007).
In June 2007, the SJVAPCD Board adopted the 2007 PM10 Maintenance Plan and Request for Redesignation. This plan demonstrates how PM10 attainment in the SJVAB will be maintained in the future. On September 25, 2008, USEPA redesignated the SJVAB to attainment for the PM10 NAAQS and approved the PM10 Maintenance Plan (SJVAPCD, 2010c). In April 2008, The SJVAPCD Board adopted the 2008 PM2.5 Plan and approved amendments to Chapter 6 of the

4. Environmental Analysis Air Quality
McHenry Solar Farm 4.3-9 May 2011 Draft Environmental Impact Report
TABLE 4.3-4 SJVAPCD RULE 8021 MEASURES APPLICABLE TO THE PROJECT
No. Measure
A1 Pre-water site sufficient to limit visible dust emissions (VDE) to 20 percent opacity
A2 Phase work to reduce the amount of disturbed surface area at any one time
B1 Apply water or chemical/organic stabilizers/suppressants sufficient to limit VDE to 20 percent opacity; or
B2 Construct and maintain wind barriers sufficient to limit VDE to 20 percent opacity. If using wind barriers, control measure B1 above shall also be implemented.
B3 Apply water or chemical/organic stabilizers/suppressants to unpaved haul/access roads and unpaved vehicle/equipment traffic areas sufficient to limit VDE to 20 percent opacity and meet the conditions of a stabilized unpaved road surface.
C.1 Restrict vehicular access to the area; and
C.2 Apply water or chemical/organic stabilizers/suppressants, sufficient to comply with the conditions of a stabilized surface. If an area having 0.5 acre or more of disturbed surface area remains unused for seven or more days, the area must comply with the conditions for a stabilized surface area as defined in section 3.58 of Rule 8011.
5.3.1 An owner/operator shall limit the speed of vehicles traveling on uncontrolled unpaved access/haul roads within construction sites to a maximum of 15 miles per hour.
5.3.2 An owner/operator shall post speed limit signs that meet state and federal Department of Transportation standards at each construction site’s uncontrolled unpaved access/haul road entrance. At a minimum, speed limit signs shall also be posted at least every 500 feet and shall be readable in both directions of travel along uncontrolled unpaved access/haul roads.
5.4.1 Cease outdoor construction, excavation, extraction, and other earthmoving activities that disturb the soil whenever VDE exceeds 20 percent opacity. Indoor activities such as electrical, plumbing, dry wall installation, painting, and any other activity that does not cause any disturbances to the soil are not subject to this requirement.
5.4.2 Continue operation of water trucks/devices when outdoor construction excavation, extraction, and other earthmoving activities cease, unless unsafe to do so.
6.3.1 An owner/operator shall submit a Dust Control Plan to the Air Pollution Control Officer (APCO) prior to the start of any construction activity on any site that will include 10 acres or more of disturbed surface area for residential developments, or 5 acres or more of disturbed surface area for non-residential development, or will include moving, depositing, or relocating more than 2,500 cubic yards per day of bulk materials on at least three days. Construction activities shall not commence until the APCO has approved or conditionally approved the Dust Control Plan. An owner/operator shall provide written notification to the APCO within 10 days prior to the commencement of earthmoving activities via fax or mail. The requirement to submit a dust control plan shall apply to all such activities conducted for residential and non-residential (e.g., commercial, industrial, or institutional) purposes or conducted by any governmental entity.
6.3.3 The Dust Control Plan shall describe all fugitive dust control measures to be implemented before, during, and after any dust generating activity.
6.3.4 A Dust Control Plan shall contain all the [administrative] information described in Section 6.3.6 of this rule. The APCO shall approve, disapprove, or conditionally approve the Dust Control Plan within 30 days of plan submittal. A Dust Control Plan is deemed automatically approved if, after 30 days following receipt by the District, the District does not provide any comments to the owner/operator regarding the Dust Control Plan.
SOURCE: SJVAPCD, 2010b.

4. Environmental Analysis Air Quality
McHenry Solar Farm 4.3-10 May 2011 Draft Environmental Impact Report
2008 PM2.5 Plan on June 17, 2010. This plan was designed to attain the federal and state PM2.5 standards in the SJVAB as soon as possible (SJVAPCD, 2010c).
Stanislaus County
Stanislaus County does not have General Plan or other air quality goals, policies, or implementation measures that could be applicable to the Project.
4.3.1.3 Baseline
Baseline conditions for this analysis reflect pre-Project conditions of air quality in the vicinity of the existing site. Baseline conditions at the site include operation of the existing agricultural fields. The applicable air quality plans are SJVAPCD’s 1-hour Extreme Ozone Attainment Demonstration Plan, 2007 PM10 Maintenance Plan and Request for Redesignation, and the 2008 PM2.5 Plan. The Project baseline includes the area classified as non-attainment for ozone, PM10, and PM2.5 standards, and the closest sensitive receptor is a residence located immediately south of the Project boundary and residences located as close as 100 feet to the northwest boundary of the Project.
4.3.2 Significance Criteria Based on CEQA Guidelines Appendix G, a project would cause a significant impact on air quality if it would:
a) Conflict with or obstruct implementation of the applicable air quality plan;
b) Violate any air quality standard or contribute substantially to an existing or projected air quality violation;
c) Result in a cumulatively considerable net increase of any criteria pollutant for which the project region is non-attainment under an applicable federal or state ambient air quality standard (including releasing emissions which exceed quantitative thresholds for ozone precursors);
d) Expose sensitive receptors to substantial pollutant concentrations; or
e) Create objectionable odors affecting a substantial number of people.
4.3.3 Discussion of Criteria with No Air Quality Impacts Analysis of the setting and Project characteristics relative to the significance criteria show that the Project would have no impact on air quality with respect to criteria a) and e). The reasoning supporting these conclusions follows.
a) The Project would not conflict with or obstruct implementation of the applicable air quality plan.
Construction, operation, maintenance, and decommissioning of the Project would result in emissions of criteria pollutants including ozone precursors such as ROG and NOx, as well as particulate matter. The SJVAPCD’s 1-hour Extreme Ozone Attainment Demonstration Plan,

4. Environmental Analysis Air Quality
McHenry Solar Farm 4.3-11 May 2011 Draft Environmental Impact Report
2007 PM10 Maintenance Plan and Request for Redesignation, and the 2008 PM2.5 Plan outline several control strategies to help the SJVAPCD reach attainment for the federal one-hour ozone standard, the 24-hour PM10 standard, and the federal and state PM2.5 standards, respectively. The SJVAB is in attainment for CO, SO2, and lead, so there are no attainment or maintenance plans for those pollutants.
Control measures outlined in the Ozone Plan focus primarily on control of stationary sources and indirect sources such as housing and commercial developments that may generate substantial vehicle trips during operations. The primary source of criteria pollutant emissions generated by the Project would be associated with construction activities; operation of the Project would generate a very small number of vehicle trips associated with two commuting workers and other workers that would periodically clean the panels. Therefore, operation of the Project would not create a permanent substantial source of ozone precursor emissions, and would not obstruct implementation of the SJVAPCD’s ozone attainment plan.
The PM10 maintenance plan focuses on how the SJVAPCD will maintain attainment of the federal 24-hour PM10 standard, which includes continued implementation of the Amended 2003 PM10 Plan. The 2003 Plan focuses on implementing rules that limit PM10 emissions from various industrial sources as well as fugitive dust emissions. It is required by regulation that construction of the Project would be conducted in compliance with SJVAPCD’s Regulation VIII, Fugitive PM10 Prohibitions; therefore, the Project would not obstruct implementation of the PM10 maintenance plan. Operational activities may periodically generate PM10 emissions from travel on unpaved access roads; however, these activities would also be subject to rules set forth in Regulation VIII. Therefore, the Project would be regulated by applicable SJVAPCD rules and would not obstruct implementation of the PM10 Maintenance Plan.
The 2008 PM2.5 Plan is the SJVAPCD’s first plan to focus specifically on PM2.5, although the control strategies from previous PM10 plans (particularly those related to fugitive dust control) have already improved the SJVAB’s ambient PM2.5 levels. Therefore, because fugitive dust controls continue to be addressed in the PM10 Plan, the 2008 PM2.5 Plan contains a comprehensive list of strict regulatory and incentive-based measures to reduce directly-emitted PM2.5 and precursor emissions. However, the Project would result in negligible PM2.5 emissions from those types of sources (see discussion under criterion b), below), with the vast majority of PM2.5 emissions associated with the Project arising from the PM2.5 component of fugitive dust. Nevertheless, the Project would be regulated by applicable SJVAPCD rules, which would ensure compliance with the 2008 PM2.5 Plan, and therefore, would not obstruct implementation of the PM2.5 Plan.
e) The Project would not create objectionable odors affecting a substantial number of people.
Construction, operation, and decommissioning of the Project would not create odorous emissions that would affect a substantial number of people; therefore, no impact would occur.

4. Environmental Analysis Air Quality
McHenry Solar Farm 4.3-12 May 2011 Draft Environmental Impact Report
4.3.4 Impacts and Mitigation Measures
b) Violate any air quality standard or contribute substantially to an existing or projected air quality violation.
Impact 4.3-1: Construction and decommissioning activities would generate emissions of criteria pollutants, including suspended and inhalable particulate matter and equipment exhaust emissions. (Less than significant with mitigation)
The SJVAPCD has identified PM10 as the pollutant of greatest concern for construction-related emissions. In the Guide for Assessing and Mitigating Air Quality Impacts, the SJVAPCD recommends that construction PM10 impacts be evaluated based on implementation of effective and comprehensive dust control measures rather than detailed quantification of emissions in comparison to quantitative thresholds (SJVAPCD, 2002). It should be noted that the Guide for Assessing and Mitigating Air Quality Impacts does not include recommendations regarding how to address PM2.5 emissions or particulate matter (both PM10 and PM2.5) emissions from engine exhaust. However, the SJVAPCD has requested that Project construction-related PM10 emissions be quantified and considered significant if above 15 tons per year (see Appendix A; SJVAPCD Scoping Letter dated December 29, 2010). Therefore, significance of PM10 and PM2.5 is assessed relative to implementation of effective and comprehensive dust control mitigation measures and whether PM10 emissions would exceed 15 tons per year.
The SJVAPCD also considers ozone precursors (i.e., NOx and ROG) to be pollutants of concern related to construction emissions. Although SJVAPCD has not established quantitative CEQA significance thresholds for ozone precursors associated with construction activities, it has established quantitative CEQA significance thresholds for ozone precursors associated with operational activities. Therefore, in lieu of CEQA significance thresholds for construction emissions of ozone precursors, estimated emissions of the Project are compared to the SJVAPCD’s operational CEQA thresholds of 10 tons per year for both NOx and ROG.
Construction of the Project would take approximately 10 months to complete. Although construction activities would occur during two calendar years, the combined total estimated emissions for all construction activities were used to represent annual emissions. Exhaust emissions would be associated with use of heavy-duty equipment, on-road automobile and truck trips, and paving-related activities that would occur during various overlapping construction phases. Fugitive dust emissions in the form of PM10 and PM2.5 would occur associated with ground disturbance activities and vehicle travel. The total exhaust emissions associated with construction of the Project was estimated using emission factors derived from CARB’s EMFAC2007 and OFFROAD emissions models, and fugitive dust emissions were estimated using approaches recommended by CARB and USEPA (see Appendix B for details). Total Project construction emissions estimates are presented in Table 4.3-5.
For the purposes of this air quality assessment, Project construction activities include: site preparation; installation of the solar array, installation of the gen-tie line and poles, installation of the fiber optic cable, installation of the operation and maintenance building, and access road paving.

4. Environmental Analysis Air Quality
McHenry Solar Farm 4.3-13 May 2011 Draft Environmental Impact Report
TABLE 4.3-5 PROJECT CONSTRUCTION EMISSIONS ESTIMATES
Estimated Emissions
Estimated Emissions (tons)
ROG NOx CO PM10 PM2.5
On-site Construction Equipment 0.28 2.32 1.09 0.12 0.11
Light-Duty and Heavy-Duty Trucks 0.24 1.02 3.75 0.06 0.05
Fugitive Dust --- --- --- 5.81 0.93
Total (tons/year) 0.52 3.34 4.84 5.99 1.09
SJVAPCD Thresholds (tons per year) 10 10 NA 15* NA
Significant Impact? No No No No No NOTES: NA = No threshold is applicable. See Appendix B for details for all assumptions and emission factors. * The Guide for Assessing and Mitigating Air Quality Impacts does not include recommendations on how to address PM10 engine exhaust
emissions; however, the SJVAPCD has requested that Project construction-related PM10 emissions be quantified and considered significant if above 15 tons per year (see Appendix A; SJVAPCD Scoping Letter dated December 29, 2010).
Table 2-2 in Chapter 2, Project Description, identifies all of the construction equipment that would be required during the 10-month construction period; Appendix B identifies the proposed construction equipment inventory for the Project in terms of total hours for each piece of equipment for each construction phase. In addition, it is expected that an average of 92 construction workers would generate approximately 115 light-duty truck round trips each workday and equipment and material deliveries would generate a total of 890 heavy-duty truck roundtrips that would be accompanied by 1,720 light-duty pilot truck trips (see Section 4.17, Transportation/Traffic). There would also be light-duty truck emissions that would be generated at the Project site during the construction period. Approximately 97 percent of the PM10 emissions and 15 percent of the PM2.5 emissions would be associated with fugitive dust that would be generated primarily related to soil disturbance and handling, and vehicle travel on unpaved roads. Refer to Appendix B for the assumptions used to estimate construction-related emissions.
As shown in Table 4.3-5, estimated construction emissions would not exceed the annual SJVAPCD CEQA thresholds. Therefore, construction emissions would not have the potential to contribute substantially to existing violations of ozone or PM10 standards and impacts would be less than significant.
The Project would be subject to the NOx provisions of the SJVAPCD’s Rule 9510, Indirect Source Review (SJVAPCD, 2005). This rule requires project applicants for projects that emit more than 2 tons per year of NOx and/or PM10 to reduce exhaust emissions from construction equipment greater than 50 horsepower by 20 percent below statewide average NOx emissions and 45 percent below statewide average PM10 emissions. This may be achieved through on-site reductions, such as using add-on controls, cleaner fuels, newer low emitting equipment, or by purchasing off-site credits from the SJVAPCD (SJVAPCD, 2005).
Impacts of PM10 and PM2.5 emissions are also assessed relative to implementation of effective dust control measures. Implementation of Mitigation Measure 4.3-1 (below) would require the Applicant and MID to implement dust control measures recommended by SJVAPCD. The dust

4. Environmental Analysis Air Quality
McHenry Solar Farm 4.3-14 May 2011 Draft Environmental Impact Report
control requirements in Mitigation Measure 4.3-1 are consistent with MID’s construction emission dust control requirements in the 2006 PEIR Update (2006 PEIR Update; pp. 6-6 to 6-7). Implementation of this mitigation measure would ensure that construction impacts related to PM10 and PM2.5 emissions would be less than significant.
Regarding construction emissions of CO and SO2, the SJVAPCD has not developed quantitative thresholds for these pollutants. However, Project construction-related emissions of these pollutants would not contribute substantially to a new violation because the ambient levels for these pollutants in the Study Area are well below state and federal ambient air quality standards, and the emission of CO and SO2 from construction of the Project would be negligible and of short duration, and would result in less-than-significant impacts.
Decommissioning of the Project would require the use of substantially fewer pieces of heavy construction equipment over the three-month decommissioning period and would require fewer truck and vehicle trips compared to what would be required to construct the Project. Implementation of Mitigation Measure 4.3-1 would also ensure that Project-related decommissioning activities would be less than significant.
Mitigation Measure 4.3-1: Implement Dust Control Measures. The Applicant shall submit a Dust Control Plan to the APCO for approval prior to start of construction (and, subsequently, decommissioning) activities. The Plan shall cover both Applicant and MID activities, and shall require implementation of the following dust control measures.
All disturbed areas, including storage piles that are not being actively used for construction purposes, shall be effectively stabilized of dust emissions using water, chemical stabilizer/suppressant, covered with a tarp or other suitable cover, or vegetative ground cover.
All on-site unpaved roads and off-site unpaved access roads shall be effectively stabilized of dust emissions using water or chemical stabilizer/suppressant.
All land clearing, grubbing, scraping, excavation, land leveling, grading, cut and fill, and demolition activities shall be effectively controlled of fugitive dust emissions using application of water or by presoaking.
When materials are transported off-site, all material shall be covered or effectively wetted to limit visible dust emissions, and at least six inches of freeboard space from the top of the container shall be maintained.
Limit or expeditiously remove trackout (i.e., accumulation of mud or dirt from Project-related vehicle tires) from adjacent public streets near the Project access points. Trackout shall be immediately removed from public streets when it extends 50 or more feet from the Project access points; otherwise trackout shall be removed at the end of each workday. (The use of dry rotary brushes is expressly prohibited except where preceded or accompanied by sufficient wetting to limit the visible dust emissions.)(Use of blower devices is expressly forbidden).
Following the addition of materials to, or removal of materials from, the surface of outdoor storage piles, said piles shall be effectively stabilized of fugitive dust emissions using sufficient water or chemical stabilizer/suppressant.

4. Environmental Analysis Air Quality
McHenry Solar Farm 4.3-15 May 2011 Draft Environmental Impact Report
Limit traffic speed on unpaved on-site roads to 15 mph.
Install sandbags or other erosion control measures to prevent silt runoff to public roadways from sites with a slope greater than one percent.
Install windbreaks at windward side(s) of construction areas.
Suspend excavation and grading activity when winds exceed 20 mph.
Significance after Mitigation: Less than Significant.
Impact 4.3-2: Operation of the Project would generate exhaust emissions of criteria pollutants from routine operation. (Less than significant)
Implementation of the Project would result in a renewable energy resource that would generate no direct emissions of air pollutants. On-site emissions of criteria pollutants associated with Project operation would be generated as a result of maintenance and periodic panel washing activities. It is anticipated that periodic maintenance and panel washing activities would generate emissions similar to those that are currently generated at the site associated with its agricultural use. Off-site emissions would be generated due to the commute of two full-time employees each day. Off-site employee commutes are expected to generate approximately 521 roundtrips per year, which would generate less than 0.01 ton per year of ROG, NOx, and PM10 (See Appendix B for details). These emissions would be well below the SJVAPCD CEQA significance thresholds. Exhaust emissions of PM2.5, CO, and SO2 would be negligible for ongoing operation of the Project. Therefore, operational exhaust emissions impacts would be less than significant.
Mitigation: None required.
Impact 4.3-3: The Project could result in permanently disturbed land that would serve as a source of fugitive dust emissions. (Less than significant)
The Project would disturb approximately 154 acres of land. Approximately 150 acres of strawberry fields would be replaced with a solar array under which a seed mix would be planted for post-construction dust control and to support managed grazing by small livestock (e.g., goats or sheep). The Project would include several acres of crushed rock or asphalt concrete associated with the proposed switchyard, substation, O&M Building, and access/interior roads. SJVAPCD Rule 8501 requires property owners of any open area three acres or larger in size with at least 1,000 square feet of disturbed surface area to implement appropriate control measures (SJVAPCD, 2004). Because the vast majority of the Project’s disturbed areas would either be planted with a seed mix or covered with crushed rock or asphalt, the site is not likely to serve as a significant source of fugitive dust. Perimeter road areas would not be paved or covered with crushed rock, but would be comprised of compacted earth (see Section 2.6.1, Site Preparation) and would not likely be a significant source

4. Environmental Analysis Air Quality
McHenry Solar Farm 4.3-16 May 2011 Draft Environmental Impact Report
of wind-blown fugitive dust. Therefore, fugitive PM10 and PM2.5 emissions from open areas would be controlled and associated impacts would be less than significant.
Mitigation: None required.
c) Result in a cumulatively considerable net increase of any criteria pollutant for which the project region is non-attainment under an applicable federal or state ambient air quality standard (including releasing emissions which exceed quantitative thresholds for ozone precursors).
Impact 4.3-4: Construction and decommissioning emissions associated with the Project could result in emissions of ozone precursors and particulate matter that would be cumulatively considerable. (Less than significant with mitigation)
The SJVAB is designated as a non-attainment area for ozone standards because of cumulative emissions from numerous sources throughout the SJVAB, as well as the transport of pollutants from regions outside of the SJVAB. Most sources emit ROG and NOx in quantities that are too small to have a measurable effect on ambient ozone concentrations by themselves; however, when they are considered in a cumulative sense, these emissions result in severe problems to the ambient air quality throughout the SJVAB. In response to this issue, the SJVAPCD has developed an annual project-related emissions threshold of 10 tons for both ROG and NOx to limit the individual contribution of discrete projects, thereby reducing the cumulative impacts of many smaller scale projects. Emissions during construction of the Project would not exceed the threshold of 10 tons per year for ROG or NOx and would, therefore, not contribute to a cumulatively considerable net increase in ozone precursor emissions. Hence, cumulative impacts would be less than significant.
PM10 and PM2.5 have similar cumulative regional emphasis because particles can be entrained in the atmosphere and contribute to unhealthful levels over time. However, at a local scale, PM10 and PM2.5 also have the potential to cause significant impacts if several grading or earth moving projects are underway simultaneously at nearby sites. As discussed in Chapter 6, Cumulative Impacts, there are several projects that are proposed in the vicinity of the Project site. These projects include development associated with two specific plans and eight California Department of Transportation (Caltrans) road improvement and widening, signal, and landscaping projects. If grading and earth moving activities associated with any of these projects would overlap with activities associated with construction of the Project, cumulative local impacts to PM10 and PM2.5 levels would be potentially significant.
The SJVAPCD recommends that, if it appears that the local cumulative PM10 impacts would be significant, the Lead Agency should require the project applicant to implement enhanced dust control measures. For the purposes of this review, this approach to defining the significance of cumulative PM10 impacts is also applicable for emissions of PM2.5. Enhanced dust control measures include limiting traffic speeds on unpaved roads to 15 miles per hour and installing sandbags and other erosion control measures to prevent silt runoff to public roadways from sites

4. Environmental Analysis Air Quality
McHenry Solar Farm 4.3-17 May 2011 Draft Environmental Impact Report
with slopes greater than one percent. These measures have been included as part of Mitigation Measure 4.3-1; therefore, construction and decommissioning of the Project would not result in a cumulatively considerable contribution to a PM10- or PM2.5-related cumulative impact.
Mitigation Measure 4.3-4: Implement Mitigation Measure 4.3-1.
Significance after Mitigation: Less than Significant.
Impact 4.3-5: Operation and maintenance of the Project could generate emissions of criteria pollutants that would be cumulatively considerable. (Less than significant)
Operation of the Project would not be expected to generate a net increase in emissions compared to baseline, and off-site Project-related vehicle trips would generate less than 0.01 ton of exhaust emissions per year for each criteria pollutant, including CO. These emissions would not exceed the annual thresholds for ozone precursors set by the SJVAPCD for individual projects. Because the thresholds of 10 tons per year of ROG and NOx were set by the SJVAPCD to reduce each project’s individual contribution to cumulative air quality impacts, if a project does not exceed these thresholds its individual contribution would be less than significant. Therefore, when added to impacts from operation and maintenance of other projects in the SJVAB, the Project’s incremental contribution to ozone precursor emissions would be less than cumulatively considerable. Operational exhaust emissions of PM2.5, CO, and SO2 would be negligible and would also be less than cumulatively considerable.
The SJVAPCD recommends that a project’s cumulative contribution to PM10 emissions be evaluated based on the potential for earth disturbing activities associated with the project to overlap with earth disturbing activities associated with other nearby projects. If it appears that the level of activity may cause an adverse impact, then appropriate dust control measures should be implemented. As described above in Impact 4.3-3, fugitive dust emissions from the site during operation and maintenance would be less than significant. Therefore the Project would not have a cumulatively significant contribution to PM10 levels.
Mitigation: None required.
d) Expose sensitive receptors to substantial pollutant concentrations.
Impact 4.3-6: The Project would generate emissions of criteria pollutants, potentially exposing sensitive receptors to harmful pollutant concentrations. (Less than significant with mitigation)
The closest sensitive receptor to the Project site is a residence immediately adjacent to the south side of the site along Patterson Road and residences as close as 100 feet from the northwest corner

4. Environmental Analysis Air Quality
McHenry Solar Farm 4.3-18 May 2011 Draft Environmental Impact Report
of the site in the Del Rio community across McHenry Avenue. Construction activities would generate emissions of criteria pollutants, including fugitive dust as well as equipment exhaust emissions. Due to the dispersed nature of the Project over an area of 154 acres, nearby residences would not be exposed to substantial concentrations of criteria air pollutants. Furthermore, Mitigation Measure 4.3-1 would reduce impacts from construction fugitive dust. The Project would not be a significant source of criteria pollutant emissions or fugitive dust during operation and maintenance. With implementation of this measure, impacts to sensitive receptors would be less than significant during construction, operation and maintenance, and decommissioning.
Mitigation Measure 4.3-6: Implement Mitigation Measure 4.3-1.
Significance after Mitigation: Less than Significant.
Impact 4.3-7: The Project would generate emissions of TACs, potentially exposing sensitive receptors to harmful pollutant concentrations. (Less than significant)
Construction and decommissioning of the proposed Project would result in temporary and short-term diesel exhaust emissions from on-site heavy duty equipment and from material deliveries or removal. Particulate exhaust emissions from diesel-fueled engines (diesel PM) were identified as a TAC by the CARB in 1998. Construction and decommissioning of the proposed Project would result in the short-term generation of diesel PM emissions from the use of off-road diesel equipment required for site grading and excavation and other construction/decommissioning activities, and from construction material deliveries and decommissioning material removal using on-road heavy-duty trucks. There would be no long-term mobile or stationary sources of diesel PM emissions associated with the proposed Project.
The dose to which receptors are exposed is the primary factor affecting health risk from TACs. Dose is a function of the concentration of a substance or substances in the environment and the duration of exposure to the substance. According to the Office of Environmental Health Hazard Assessment (OEHHA), health risk assessments, which determine the exposure of sensitive receptors to TAC emissions, should be based on a 70-year exposure period when assessing TACs (such as diesel PM) that have only cancer or chronic non-cancer health effects (OEHHA, 2003; p. 7-1). However, such health risk assessments should be limited to the duration of the emission-producing activities associated with the project. For the proposed Project, diesel PM emissions would occur only over the 10-month construction period and 3-month decommissioning period.
Table 4.3-5 (above) shows that the total PM2.5 emissions from on-site equipment and from light- and heavy-duty trucks would be 0.16 ton over the 10-month construction period.1 Because decommissioning would involve fewer vehicles and on-site equipment over a much shorter (3-month) period, PM2.5 emissions from decommissioning would be considerably less than during construction. Because these emissions are minor and would occur over a total of
1 PM2.5 exhaust emissions are conservatively used here as a surrogate for diesel PM.

4. Environmental Analysis Air Quality
McHenry Solar Farm 4.3-19 May 2011 Draft Environmental Impact Report
only 13 months compared to the 70-year exposure used in health risk assessments, the health risk from those short-term diesel PM emissions would be negligible, and this impact would be less than significant.
Mitigation: None required.
4.3.5 Alternatives
4.3.5.1 Reduced Project Alternative
If the Reduced Project Alternative is implemented, short-term construction and decommissioning activities, as well as long-term operation, would result in less than 10 percent fewer criteria pollutant emissions compared to the construction/decommissioning and operational emissions that would result from the proposed Project. Therefore, activities associated with this alterative would also result in less-than-significant impacts associated with short-term and long-term generation of criteria pollutants and TACs. Similar to the proposed Project, the Reduced Project Alternative would not conflict with the applicable SJVAPCD air quality plans.
4.3.5.2 Non-Agriculture Site Alternative
Because this alternative site is located within the same air basin and only about 4 miles from the location of the proposed Project site, the air quality setting described above in Section 4.3.1, Setting, is also applicable to this alternative site, with the exception of sensitive receptor locations. Sensitive receptors in the vicinity of the Non-Agriculture Site Alternative consist of three rural residences along Stoddard Road between approximately 70 feet and 200 feet from the site boundary, and the outdoor activity area associated with Joseph Gregori High School, which is approximately 100 feet from the site boundary.
If the Non-Agriculture Site Alternative is implemented, short-term solar farm construction and decommissioning activities, as well as long-term operation, would result in approximately 20 percent of the criteria pollutant emissions compared to the construction, operation, and decommissioning emissions that would result from the proposed Project. However, existing buildings and other facilities at this site would need to be demolished and removed from the site prior to construction, and approximately 1.25 miles of existing distribution circuit poles would be removed and replaced with taller poles. Air emissions associated with demolition and construction activities at this site can be estimated qualitatively on the basis that demolition activities would be expected to take approximately 10 months to complete, after which construction of the solar farm would take approximately 2 to 4 months to complete. This total duration would be 2 to 4 months longer than the 10-month construction schedule for the proposed Project site. Because site activities would be measurably longer for the Non-Agriculture Site Alternative compared to the proposed Project, it is reasonable to conclude that construction-related air emissions would be at least as great and possibly slightly greater for this alternative. Decommissioning-related emissions, however, would be less than for the proposed Project due to the much reduced size of the solar farm that

4. Environmental Analysis Air Quality
McHenry Solar Farm 4.3-20 May 2011 Draft Environmental Impact Report
would be decommissioned at the alternative site. Operation and maintenance-related emissions would be essentially the same as for the proposed Project, because the same number of full time employees and part time maintenance visits would be expected. Therefore, air emissions associated with this alterative would not be substantially different than for the proposed Project and so would result in similar less-than-significant impacts associated with short-term and long-term generation of criteria pollutants and TACs. Similar to the proposed Project, the Non-Agriculture Site Alternative also would not conflict with the applicable SJVAPCD air quality plans.
4.3.5.3 No Project Alternative
If the No Project Alternative is implemented, short-term construction and decommissioning activities and long-term operation activities that would occur if the Project was implemented would not occur and the associated emissions would not be generated. The No Project Alternative would avoid the Project-specific adverse impacts discussed in Section 4.3.4. Instead, the emissions that are currently generated at the Project site would be expected to continue.
_________________________
References – Air Quality Bay Area Air Quality Management District (BAAQMD). 2010. Adopted Air Quality CEQA
Thresholds of Significance. June 2, 2010. Available at http://www.baaqmd.gov/~/media/Files/Planning%20and%20Research/CEQA/Adopted%20Thresholds%20Table_December%202010.ashx
CARB, 2007, 2007 Ozone Plan. Available at: (http://www.valleyair.org/Air_Quality_Plans/AQ_Final_Adopted_Ozone2007.htm) Accessed April 22, 2011.
CARB, 2010a. “San Joaquin Valley Air Basin (San Joaquin Valley APCD).” Available at: (http://www.arb.ca.gov/pm/pmmeasures/pmch05/sjv05.pdf.) Accessed December 28, 2010.
CARB, 2010b. Top 4 Measurements and Days above the Standard. Available at: (http://www.arb.ca.gov/adam/topfour/topfourdisplay.php). Accessed 12/17/2010.
CARB, 2010c. “Ambient Air Quality Standards.” Available at: (http://www.arb.ca.gov/research/aaqs/aaqs2.pdf.) Accessed December 28, 2010.
CARB. 2011, “Toxic Air Contaminant Identification List.” Available at: (http://www.arb.ca.gov/toxics/id/taclist.htm) Accessed April 22, 2011.
Office of Environmental Health Hazard Assessment (OEHHA). 2003. Air Toxics Hot Spots Program Risk Assessment Guidelines: The Air Toxics Hot Spots Program Guidance Manual for Preparation of Health Risk Assessments. August, 2003. Available at <www.oehha.ca.gov/air/hot_spots/HRAguidefinal.html>.
SJVAPCD, 2002. Guide for Assessing and Mitigating Air Quality Impacts, updated January 10, 2002.

4. Environmental Analysis Air Quality
McHenry Solar Farm 4.3-21 May 2011 Draft Environmental Impact Report
SJVAPCD, 2004. Rule 8051, Open Areas, adopted November 1, 2001, amended August 19, 2004.
SJVAPCD, 2005. Rule 9510, Indirect Source Review, adopted December 15, 2005.
SJVAPCD, 2010a.”Ambient Air Quality Standards & Valley Attainment Status. Available at: (http://www.valleyair.org/aqinfo/attainment.htm) Accessed December 28, 2010.
SJVAPCD, 2010b. “San Joaquin Valley Air Pollution Control District Regulation VIII – Fugitive PM10 Prohibitions Dust Control Plan.” Available at: (http://www.valleyair.org/busind/comply/pm10/forms/dcp-form.doc.) Accessed December 28, 2010.
SJVAPCD, 2010c. Particulate Matter Plans website. Available at: (http://www.valleyair.org/Air_Quality_Plans/PM_Plans.htm) Accessed December 28, 2010.
Western Regional Climate Center (WRCC), 2010. Modesto Climatological Summary. Available at: (http://www.wrcc.dri.edu/summary/mod.ca.html.) Accessed 12/17/2010.

4. Environmental Analysis
McHenry Solar Farm 4.4-1 May 2011 Draft Environmental Impact Report
4.4 Biological Resources
This section identifies and evaluates issues related to Biological Resources in the context of the Project and alternatives. Discussed are the physical and regulatory setting; the baseline for determining environmental impacts; the criteria used for determining the significance of environmental impacts; potential impacts associated with construction, operation, maintenance, and decommissioning of the Project; and mitigation measures to reduce or avoid environmental impacts determined to be potentially significant.
4.4.1 Setting
4.4.1.1 Regional and Local Setting
Section 2.2, Project Location and Existing Land Use, provides general information about the regional and local setting. This section 4.4.1 provides setting information specific to Biological Resources.
Data Sources / Methodology Biological resources within the Project site were identified through field reconnaissance conducted on June 17, 2010. The site was subsequently visited in early 2011 and no material changes to the site characteristics were noted. Therefore, the June 2010 surveys are considered representative of the environmental conditions that existed in the Study Area in December 2010 at the time the Notice of Preparation was published. Prior to the reconnaissance survey, a review of pertinent literature and database queries were conducted for the Project site and surrounding area, including the Non-Agricultural Site Alternative. The reconnaissance survey consisted of a pedestrian survey of the Project site in its entirety. The primary sources of data referenced for this study include the following:
Federal endangered and threatened Species that may be Affected by Projects in the Riverbank and Salida California 7.5-Minute Topographic Quadrangles” (United States Fish and Wildlife Service [USFWS], 2010);
California Natural Diversity Database (CNDDB), Rarefind computer program (California Department of Fish and Game [CDFG], 2010);
California Native Plant Society’s (CNPS) Inventory of Rare and Endangered Plants (CNPS, 2010).
A list of special-status species with potential to occur on the Project site was compiled from these sources and from information collected during the field reconnaissance.
Regional Ecology The Project area is located in Stanislaus County in the northern San Joaquin Valley within basin-type physiography. Basins are common in the San Joaquin Valley, and are commonly associated with hardpans and high clay content. Stanislaus County is located in the central region of the

4. Environmental Analysis Biological Resources
McHenry Solar Farm 4.4-2 May 2011 Draft Environmental Impact Report
Central Valley. Historically, this region supported extensive grasslands intermixed with a variety of vegetative communities including oak woodland, wetland, and riparian woodland. Intensive agricultural and urban development has resulted in large losses and conversion of these habitats. The remaining native vegetative communities exist as isolated remnant patches within urban and agricultural landscapes, or in areas where varied topography has made urban and/or agricultural development difficult.
Site Description The entire Project site consists of flat land. At the time of the field visit on June 17, 2010, the eastern half of the site was in strawberry production and the western half was annual grassland (Figure 4.1-1). The majority of the land surrounding the Project site on the north and east sides consist of deciduous orchards. There are patches of urban, ruderal, alfalfa, annual grassland, and fallow agriculture interspersed at the site.
Wildlife Habitats and Vegetation Communities The Study Area, which includes the Project site and a 500-foot buffer around it, is occupied by six upland habitat types: Annual Grassland; Deciduous Orchard; Fallow Agriculture; Irrigated Row Crop; Ruderal; and Urban (Figure 4.4-1). Table 4.4-1 provides a breakdown of the habitat types for the 154-acre Project site. Habitat mapping and descriptions are based on the reconnaissance survey, as well as the California Wildlife Habitat Relationships System (Mayer and Laudenslayer, 1988).
TABLE 4.4-1 PROJECT SITE HABITATS/VEGETATION COMMUNITIES
Habitat Type Approximate Acres
Irrigated Row Crop (Strawberries) 79
Fallow Agriculture 71
Ruderal 4
Total 154 SOURCE: ESA, 2011
Annual Grassland
Annual grassland is generally found in open areas in valleys and foothills throughout coastal and interior California. It typically occurs on soils consisting of fine-textured loams or clays that are somewhat poorly drained. This vegetation type is dominated by non-native annual grasses and weedy annual and perennial forbs, primarily of Mediterranean origin, that have replaced native perennial grasslands, scrub, and woodland as a result of human disturbance. Small, scattered patches of disturbed annual grasslands are present on the fringe of active and fallow agricultural areas on the Project site.

Residence (notpart of project)
Project Site
MC H
ENRY
AVE
LADD RD PATTERSON RDSK
ITTON
E RD
STEWART RD
BELTIS
DR
HARTLEY DR
DEL C
IELO
WY
SHER
RY LN
Project Location
Merced County
Stanislaus County
San Joaquin County
§̈¦5
ST132
ST108ST99
"Project Site
Study Area
Fallow Agriculture
Deciduous Orchard
Irrigated Row Crop
Urban
Ruderal
0 500
Feet
McHenry Solar Farm . 209517.01
Figure 4.4-1Vegetative Habitats within the Project Study Area
SOURCE: ESA, June, 2010
4.4-3

4. Environmental Analysis Biological Resources
McHenry Solar Farm 4.4-4 May 2011 Draft Environmental Impact Report
Deciduous Orchard
Deciduous orchards are typically open single species tree-dominated habitats. Orchards are usually low and bushy with an open understory to facilitate harvest. They are planted in uniform patterns and intensely managed. Deciduous orchards within the Study Area include almonds, nectarines, apricots, walnuts, and peaches. This habitat type occurs within the 500-foot buffer around the Project site but does not occur on the Project site.
Fallow Agriculture
Fallow agriculture is the prominent habitat type on the western half of the Project site. During the June 2010 site visit, such habitat varied from sparsely vegetated non-native grasses and herbs to areas that were barren and void of any vegetation. Strawberry crops on the Project site had been recently removed and the farmed areas were tilled. Fallow agriculture within the Study Area may provide low quality foraging habitat for raptors and other species.
Irrigated Row Crops
Irrigated row crops are characterized by open areas of low growing plants cultivated in rows. Row crops may provide suitable foraging habitat and cover for some wildlife, depending on the type of crops that are grown. The eastern half of the Project site was in strawberry production at the time of the June 2010 reconnaissance survey, and supported a monoculture of strawberry plants.
Ruderal
Ruderal habitat occurs in areas such as along roadsides, trails, and parking lots. These communities are subjected to ongoing or past disturbances (e.g., vehicle activities or mowing). Ruderal habitat in these disturbed areas supports a diverse weedy flora, primarily composed of non-native invasive species.
Dominant species included introduced common annual weedy forbs such as bur-clover (Medicago polymorpha), red-stem filaree (Erodium cicutarium), wild radish (Raphanus sativus), black mustard (Brassica nigra), field bindweed (Convolvulus arvensis), and milk thistle (Silybum marianum) Non-native grasses are also represented, including ripgut brome (Bromus diandrus), Italian wildrye (Lolium multiflorum), and wild oat (Avena sp.).
Urban
Although urban is not a true habitat type, it is discussed because it occurs in the Study Area. This “habitat type” is subject to ongoing disturbance and traffic that keeps the vegetation sparse and short. Plant species common to this habitat include ornamental species and turf grasses, as well as mustards (Brassica spp.), bindweed (Calystegia sp.), wood groundsel (Senecio sylvaticus), storksbill (Erodium sp.), English plantain (Plantago lanceolata), sowthistle (Sonchus sp.), cocklebur (Xanthium strumarium), knotweed (Polygonum sp.), and grasses (Bromus diandrus, Bromus carinatus, Cynosurus echinatus, Cynodon dactylon, Deschampsia danthonioides, Festuca sp., and Poa annua). These areas provide limited opportunities for wildlife, but may be used on occasion by species such as California ground squirrel (Spermophilus beecheyi) and Audubon’s cottontail (Sylvilagus audubonii) foraging raptors.

4. Environmental Analysis Biological Resources
McHenry Solar Farm 4.4-5 May 2011 Draft Environmental Impact Report
Special-Status Species Special-status species are plants and animals that are legally protected pursuant to state and federal endangered species acts or other regulations and species that are considered sufficiently rare by the scientific community to qualify for such listing. These species are in the following categories:
Plants or animals listed or proposed for listing as threatened or endangered pursuant to the Federal Endangered Species Act (ESA) (50 Code of Federal Regulations CFR 17.12 listed plants, 17.11 listed animals and various notices in the Federal Register FR proposed species).
Plants or animals that are candidates for possible future listing as threatened or endangered pursuant to the federal ESA (61 FR 40, February 28, 1996);
Plants or animals listed or proposed for listing by the State of California as threatened or endangered pursuant to the California ESA (14 California Code of Regulations CCR 670.5);
Plants listed as rare or endangered pursuant to the California Native Plant Protection Act (California Fish and Game Code, Section 1900 et seq.);
Plants that meet the definitions of rare and endangered pursuant to CEQA. CEQA Section 15380 provides that a plant or animal species may be treated as “rare or endangered” even if not on one of the official lists (State CEQA Guidelines, §15380);
Plants considered by CNPS to be “rare, threatened or endangered in California” (Lists 1A, 1B, and 2 in CNPS 2008);
Plants listed by CNPS as plants about which more information is needed to determine their status and plants of limited distribution (Lists 3 and 4 in CNPS 2008), which may be included as special-status species on the basis of local significance or recent biological information;
Animal species of special concern to CDFG; and
Animals fully protected in California (California Fish and Game Code, Sections 3511 birds, 4700 mammals, and 5050 reptiles and amphibians).
A list of special-status plant and animal species that have the potential to occur within the vicinity of the Project site was compiled based on data in California Natural Diversity Database [CNDDB, (CDFG, 2010)], CNPS Inventory of Rare and Endangered Plants (CNPS, 2010), and the USFWS List of Federal Endangered and Threatened Species that may be affected by Projects in the Salida, Avena, Escalon, Oakdale, Waterford, Denair, Ceres, and Brush Lake USGS 7.5-minute topographic quadrangles (USFWS, 2010). Conclusions regarding habitat suitability and species occurrence are based on the analysis of existing literature and databases described previously. Critical habitat does not occur on the Project site.
The “Potential for Project to Impact” category is defined as follows:

4. Environmental Analysis Biological Resources
McHenry Solar Farm 4.4-6 May 2011 Draft Environmental Impact Report
Unlikely: The Project site and/or immediate area do not support suitable habitat for a particular species. The Project site is outside of the species known range.
Low Potential: The Project site and/or immediate area provide limited habitat for a particular species. In addition, the known range for a particular species may be outside of the immediate Project site.
Moderate Potential: The Project site and/or immediate area provide suitable habitat for a particular species, and habitat for the species may be impacted.
High Potential: The Project site and/or immediate area provide ideal habitat conditions for a particular species and/or known populations occur in immediate area or within the potential area of impact.
Table 4.4-2 lists special-status plants and animals with the potential to occur within the Project Site. Figure 4.4-2 identifies the locations of CNDDB occurrences within five miles of the Project Site.
Special-status species with a moderate to high potential to occur on the Project site are discussed in detail below. Those with a low to unlikely potential to occur on the Project site are omitted from further discussion because the site is out of their range, devoid of suitable habitat, and/or the chances of occurrence are limited, based upon specific Project site conditions.
Burrowing Owl
Burrowing owl, a California Species of Concern, is a small diurnal owl that nests underground in the burrows of small mammals, especially those of ground squirrels. Culverts and other human-made structures may also be suitable habitat for the burrowing owl. Often a burrowing owl will occupy several burrows in an area. In the Central Valley, the burrowing owl is a year-round resident of open spaces such as grasslands, agricultural fields, air fields, and levees. Vegetation must be very short or very sparse to be suitable habitat for burrowing owl. Breeding peaks from April to May, but can occur from March to August. The burrowing owl forages on insects and small mammals and will also consume reptiles, birds, and carrion.
The Project site may provide suitable foraging habitat for burrowing owls; however, nesting habitat is considered limited due to current and historic agricultural uses. Strawberry production has eliminated small mammals and non-agricultural vegetation from the actively farmed eastern half of the site. The west half of the site was recently in strawberry production and provides only potential foraging habitat for burrowing owls. If breeding owls were present on-site, they would make use of the few areas that are not cultivated, for example, non-tilled areas near irrigation standpipes, or in equipment storage areas. No burrowing owl or signs of burrowing owl were observed during the site visit.
Swainson’s Hawk
Swainson’s hawks, a Federal Species of Concern and listed by CDFG as threatened in 1983, are medium-sized hawks that are opportunistic predators, feeding on rodents, rabbits, bats, large arthropods, amphibians, reptiles, birds, and, rarely, fish (Woodbridge, 1998; Zeiner et al., 1988-1990). In the Central Valley, the majority of their diet is composed of California voles

4. Environmental Analysis Biological Resources
McHenry Solar Farm 4.4-7 May 2011 Draft Environmental Impact Report
TABLE 4.4-2 SPECIAL-STATUS SPECIES POTENTIALLY OCCURRING ON THE PROJECT SITE
Scientific Name Common Name
Listing Status:Federal/State/
CNPS General Habitat Potential to Occur on the Project Site
Invertebrates Branchinecta lynchi
vernal pool fairy shrimp FT/--/-- Found in ephemeral freshwater habitats including alkaline pools, clay
flats, vernal pools, vernal lakes, vernal swales, and other types of seasonal wetlands.
Unlikely. Project site is within species’ known range, but provides no suitable habitat.
Desmocerus californicus dimorphus valley elderberry longhorn beetle
FT/--/-- Breeds and forages exclusively on elderberry shrubs (Sambucus mexicana) typically associated with riparian forests, riparian woodlands, elderberry savannas, and other Central Valley habitats. Occurs only in the Central Valley of California. Prefers to lay eggs in elderberries 2 to 8 inches in diameter; some preference shown for “stressed” elderberries.
Unlikely. Project site is within species’ known range, but provides no suitable habitat.
Lepidurus packardi vernal pool tadpole shrimp
FE/--/-- Found in ephemeral freshwater habitats including alkaline pools, clay flats, vernal pools, vernal lakes, vernal swales, and other types of seasonal wetlands.
Unlikely. Project site is within species’ known range, but provides no suitable habitat.
Fish Hypomesus transpacificus
Delta smelt FT/ST/-- Open surface waters in the Sacramento/San Joaquin Delta. Seasonally
in Suisun Bay, Carquinez Strait, and San Pablo Bay. Found in Delta estuaries with dense aquatic vegetation and low occurrence of predators. May be affected by downstream sedimentation.
Unlikely. No suitable habitat is present on the Project site.
Mylopharodon conocephalus hardhead
--/CSC/-- Found in small to large streams in a low- to mid-elevation environments. May also inhabit lakes or reservoirs. Known to the San Joaquin River and its tributaries upstream of the Friant Dam.
Unlikely. No suitable habitat is present on the Project site.
Oncorhynchus mykiss Steelhead - Central Valley Evolutionarily Significant Units (ESU)
FT/--/-- This ESU enters the Sacramento and San Joaquin rivers and their tributaries from July to May; spawning from December to April. Young move to rearing areas in and through the Sacramento and San Joaquin rivers, Delta, and San Pablo and San Francisco bays.
Unlikely. No suitable habitat is present on the Project site.
Oncorhynchus tshawytscha Central Valley spring-run chinook salmon
FT/CT/-- This ESU enters the Sacramento and San Joaquin rivers and tributaries March to July, spawning from late August to early October. Young move to rearing areas in and through the Sacramento and San Joaquin rivers, Delta, and San Pablo and San Francisco bays.
Unlikely. No suitable habitat is present on the Project site.
Amphibians Ambystoma californiense
California tiger salamander (central population)
FT/CT/-- Annual grassland and grassy understory of valley-foothill hardwood habitats in central and northern California. Needs underground refuges and vernal pools or other seasonal water sources.
Unlikely. Project site is within species’ known range, but provides no suitable habitat.
Rana draytonii California red-legged frog
FT/CSC/-- Breeds in slow-moving streams, ponds, and marshes with emergent vegetation; forages in nearby uplands within approximately 200 feet of said aquatic habitat.
Unlikely. Project site is within species’ known range, but provides no suitable habitat.

4. Environmental Analysis Biological Resources
McHenry Solar Farm 4.4-8 May 2011 Draft Environmental Impact Report
TABLE 4.4-2 (Continued)SPECIAL-STATUS SPECIES POTENTIALLY OCCURRING ON THE PROJECT SITE
Scientific Name Common Name
Listing Status:Federal/State/
CNPS General Habitat Potential to Occur on the Project Site
Reptiles Actinemys marmorata
western pond turtle --/CSC/-- Ponds, marshes, rivers, streams, and irrigation ditches with aquatic
vegetation. Requires basking sites and suitable upland habitat for egg-laying. Nest sites most often characterized as having gentle slopes (<15 percent) with little vegetation or sandy banks.
Unlikely. Project site is within species’ known range, but provides no suitable habitat.
Thamnophis gigas giant garter snake
FT/CT/-- Found primarily in marshes, sloughs, drainage canals, and irrigation ditches, especially around rice fields, and occasionally in slow-moving creeks in California’s interior.
Unlikely. Project site is within species’ known range, but provides no suitable habitat.
Birds Agelaius tricolor
tricolored blackbird --/CSC/-- Largely endemic to California, most numerous in the Central Valley and
nearby vicinity. Typically requires open water, protected nesting substrate, and foraging grounds within the vicinity of the nesting colony. Nests in dense thickets of cattails, tules, willow, blackberry, wild rose, and other tall herbs near fresh water. Also nests in agricultural crops (e.g., silage), where colonies are threatened during harvest.
Unlikely. Project site is within species’ known range, but provides no suitable habitat.
Ardea herodias great blue heron
--/--/-- Found near water including wetlands, marshes, swamps, streams, rivers, ponds, lakes, tide flats, canals, flooded fields, and sea coasts.
Unlikely. Project site is within species’ known range, but provides no suitable habitat.
Athene cunicularia burrowing owl
--/CSC/-- Found in open grasslands with low vegetation, golf courses, and disturbed/ruderal habitat in urban areas.
Low – Moderate. The Project site and immediate vicinity provide suitable foraging habitat; nesting habitat is considered limited due to high intensity agricultural uses.
Branta hutchinsii leucopareia cackling goose
--/--/-- Found near waterways in open and grassy habitats, chaparral, golf courses, agricultural land, airports, and parks.
Unlikely. Project site is within species’ known range, but provides no suitable habitat.
Buteo swainsonii Swainson’s hawk
--/ST/-- Forages in open and agricultural fields (i.e., low-growing row or field crops) and nests in mature trees usually in riparian corridors.
Low – Moderate. Project site and immediate vicinity provides foraging habitat in fallow agricultural areas.
Egretta thula snowy egret
--/--/-- Found in wetlands including marshes, swamps, streams, rivers, ponds, lakes, tide flats, canals, and flooded fields.
Unlikely. Project site is within species’ known range, but provides no suitable habitat.
Icteria virens yellow-breasted chat
--/CSC/-- Typically breeds in dense thickets and brush, often with thorns, streamside tangles, and dry brushy hillsides.
Unlikely. Project site is within species’ known range, but provides no suitable habitat.
Melospiza melodia maxillaries Suisun song sparrow
--/CSC/-- Found in intermixed stands of bulrush, cattail, and other emergent vegetation in Suisun Bay.
Unlikely. Project site is within species’ known range, but provides no suitable habitat.

4. Environmental Analysis Biological Resources
McHenry Solar Farm 4.4-9 May 2011 Draft Environmental Impact Report
TABLE 4.4-2 (Continued)SPECIAL-STATUS SPECIES POTENTIALLY OCCURRING ON THE PROJECT SITE
Scientific Name Common Name
Listing Status:Federal/State/
CNPS General Habitat Potential to Occur on the Project Site
Mammals Eumops perotis californicus
Western mastiff bat --/CSC/-- Typically found in rocky cliff and canyon areas. Roosts in crevices and
occasionally buildings, caves, tunnels, and hollow trees. Unlikely. Project site is within species’ known range, but provides no suitable habitat.
Lasiurus blossevillii Western red bat
--/CSC/-- Typically found in trees, hedgerows, and forest edges. Roosts in foliage in summer.
Unlikely. Project site is within species’ known range, but provides no suitable Habitat.
Lasiurus cinereus hoary bat
--/CSC/-- Typically found in both deciduous and coniferous forests, as well as desert canyons. Generally roosts in dense foliage of medium to large trees.
Unlikely. Project site is within species’ known range, but provides no suitable habitat.
Myotis yumanensis Yuma myotis
--/--/-- Typically found in areas near ponds, streams, or lakes. Roosts under sidings or shingles by day and often in buildings at night. Maternity colonies are found in caves, mines, buildings, tree cavities, rock crevices, or under bridges or the bark of trees.
Unlikely. Project site is within species’ known range, but provides no suitable habitat.
Plants Blepharizonia plumosa
big tarplant --/--/1B.1 Annual herb found in valley and foothill grasslands. Blooms July through
October. Elevation: 98 to 1,657 feet mean sea level (msl). Low. Project site provides poor quality and limited habitat.
Clarkia rostrata beaked clarkia
--/--/1B.3 Annual herb found in cismontane woodland and valley and foothill grasslands. Blooms April through May. Elevation: 197 to 1,640 feet msl.
Low. Project site provides poor quality and limited habitat.
Legenere limosa Legenere
--/--/1B.1 Annual herb found in vernal pools. Blooms April through June. Elevation: 3 to 2,890 feet msl.
Unlikely. Project site is within species’ known range, but provides no suitable habitat.
Neostapfia colusana Colusa grass
FT/CE/1B.1 Annual herb found in large deep vernal pools with adobe soil. Blooms May through August. Elevation: 16 to 656 feet msl.
Unlikely. Project site is within species’ known range, but provides no suitable habitat.
Orcuttia inaequalis San Joaquin Valley Orcutt grass
FT/CE/1B.1 Annual herb found in vernal pools. Blooms April through September. Elevation: 32 to 2,477 feet msl.
Unlikely. Project site is within species’ known range, but provides no suitable habitat.
Tuctoria greenei Greene’s tuctoria
FE/CR/1B.1 Annual herb found in vernal pools. Blooms May through July (sometimes extending into September). Elevation: 98 to 3,510 feet msl.
Unlikely. Project site is within species’ known range, but provides no suitable habitat.
Natural Communities Northern Hardpan Vernal Pool --/--/-- Low, amphibious, herbaceous community dominated by annual herbs.
Found primarily on alluvial terraces on the east side of the Great Valley in CA.
Unlikely. Vernal pool habitat is absent from the Project site.
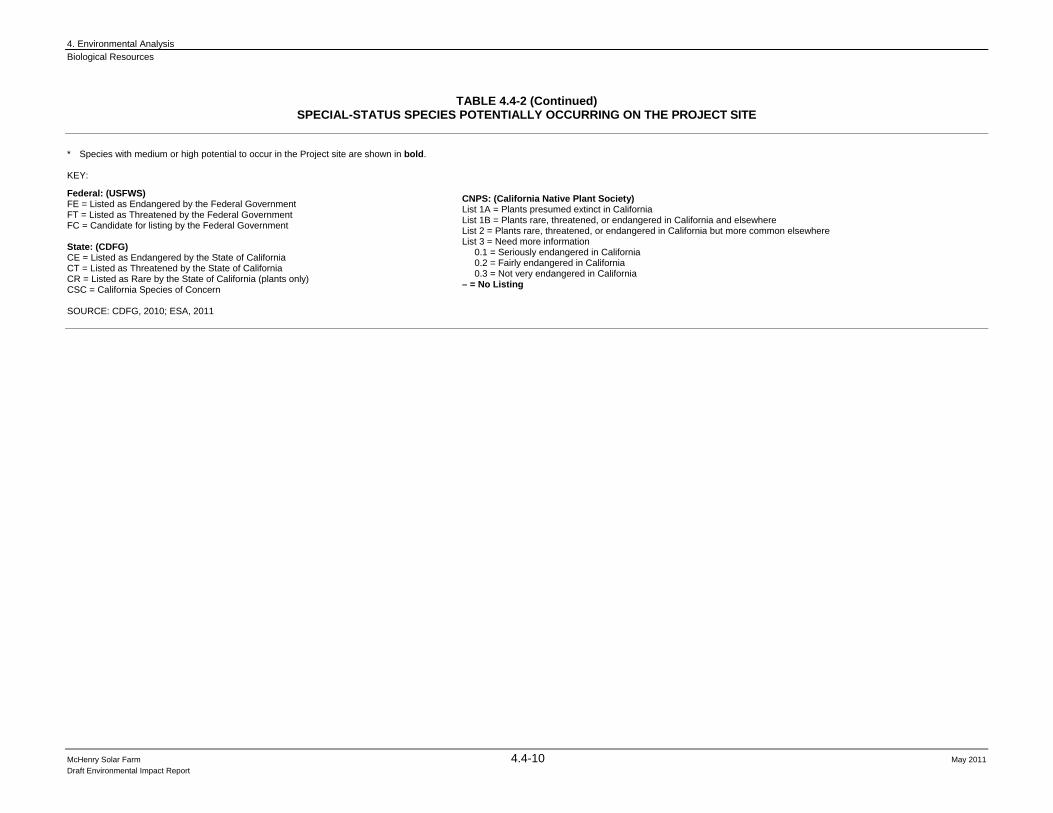
4. Environmental Analysis Biological Resources
McHenry Solar Farm 4.4-10 May 2011 Draft Environmental Impact Report
TABLE 4.4-2 (Continued) SPECIAL-STATUS SPECIES POTENTIALLY OCCURRING ON THE PROJECT SITE
* Species with medium or high potential to occur in the Project site are shown in bold. KEY:
SOURCE: CDFG, 2010; ESA, 2011
Federal: (USFWS) FE = Listed as Endangered by the Federal Government FT = Listed as Threatened by the Federal Government FC = Candidate for listing by the Federal Government State: (CDFG) CE = Listed as Endangered by the State of California CT = Listed as Threatened by the State of California CR = Listed as Rare by the State of California (plants only) CSC = California Species of Concern
CNPS: (California Native Plant Society) List 1A = Plants presumed extinct in California List 1B = Plants rare, threatened, or endangered in California and elsewhere List 2 = Plants rare, threatened, or endangered in California but more common elsewhere List 3 = Need more information 0.1 = Seriously endangered in California 0.2 = Fairly endangered in California 0.3 = Not very endangered in California – = No Listing

Proposed Project
UV108
UV219
RiverT
ully
Cla
us
Claribel
Orangeburg
Mch
en
ry
Bangs
Snyder
Da
le
Briggsmore
Milnes
He
nry
Bre
nn
an
River
Cla
us
Scenic
Parker
McHenry Solar Farm . 209517.01
Figure 4.4-2Special-Status Species within the Project Vicinity
SOURCE:CDFG, 2011
0 1
Miles
Species Occurrencemolestan blister beetle
Suisun song sparrow
California tiger salamander
Greene's tuctoria
Swainson's hawk
big tarplant
burrowing owl
Valley elderberry longhorn beetle
vernal pool fairy shrimp/vernal pool tadpole shrimp
4.4-11

4. Environmental Analysis Biological Resources
McHenry Solar Farm 4.4-12 May 2011 Draft Environmental Impact Report
(CDFG, 2000). Swainson’s hawks begin arriving in California in late February and depart for their wintering grounds in early September (Woodbridge, 1998). Nests are usually placed in a tree, bush, or on a utility pole and are comprised of a platform of sticks, bark, and fresh leaves. Eggs are laid from late March to late August, peaking late May through July (Zeiner et al., 1988-1990).
Swainson’s hawks reside in a wide variety of open habitats, from prairie and shrub steppe to deserts and intensive agricultural matrices (Woodbridge, 1998). Nests are usually constructed in habitats with scattered trees or along riparian corridors adjacent to agricultural fields or pastures (Zeiner et al., 1988-1990).
Historically, Swainson’s hawks were found throughout the lowlands of California, absent only from the Sierra Nevada, north Coast Ranges and Klamath Mountains, and portions of the southern California deserts. Currently, they are only found in portions of the Central Valley and Great Basin regions where suitable habitat is still present (CDFG, 2000). The highest density currently is located in the Central Valley, between Sacramento and Modesto, and in the northern San Joaquin Valley (Woodbridge, 1988).
Threats to Swainson’s hawk include the loss and conversion of grassland habitat and agricultural lands, habitat deterioration in South American wintering grounds, and human disturbance at nesting sites (CDFG, 2000).
Swainson’s hawks nest at two locations near the Stanislaus River, 1.5 miles north of the Project site and 2.3 miles northeast of the site. Numerous ornamental trees occur just outside the Project site within the 500-foot buffer; however, they are not large enough to support Swainson’s hawk nesting. The Project site provides poor quality foraging habitat due to the intensity of agricultural activities related to strawberry production.
4.4.1.2 Regulatory Setting
Federal
U.S. Fish and Wildlife Service
The USFWS administers the Federal ESA (16 United States Code [USC] 153 et seq.), the Migratory Bird Treaty Act (16 USC 703–711), and the Bald and Golden Eagle Protection Act (16 USC 668), among other programs discussed below.
Federal Endangered Species Act
Pursuant to the Federal ESA, the Secretary of the Interior and the Secretary of Commerce have joint authority to list a species as threatened or endangered (16 USC 1533[c]). Two federal agencies oversee the Federal ESA: the USFWS has jurisdiction over plants, wildlife, and resident fish, and the NOAA Fisheries Service has jurisdiction over anadromous and marine fish, as well as mammals. Section 7 of Federal ESA mandates that all federal agencies consult with the USFWS and NMFS to ensure that federal agency actions do not jeopardize the continued existence of a listed species or destroy or adversely modify critical habitat for listed species. The Federal ESA prohibits the

4. Environmental Analysis Biological Resources
McHenry Solar Farm 4.4-13 May 2011 Draft Environmental Impact Report
“take”1 of any fish or wildlife species listed as threatened or endangered, including the destruction of habitat that could hinder species recovery.
Section 10 of the Federal ESA requires the issuance of an incidental take permit before any public or private action may be taken that could harm, harass, injure, kill, capture, collect, or otherwise hurt any individual of an endangered or threatened species. The permit requires preparation and implementation of a habitat conservation plan that provides specific measures to offset project impacts on endangered or threatened species.
The USFWS also publishes a list of candidate species. Species on this list receive “special attention” from federal agencies during environmental review, although they are not protected otherwise pursuant to the Federal ESA. The candidate species are those for which the USFWS has sufficient biological information to support a proposal to list as endangered or threatened. Project impacts on such species would be considered significant in this EIR. Species of Concern is an informal term, not defined in the Federal ESA. The Sacramento Office of the USFWS no longer maintains a Federal Species of Concern list.
Pursuant to the requirements of the Federal ESA, a federal or state agency reviewing a proposed project within its jurisdiction must determine whether any federally listed threatened or endangered species could be present in a project area and whether the project action would have a potentially significant impact on such species. In addition, the agency is required to determine whether the project action is likely to jeopardize the continued existence of any species proposed to be listed pursuant to the Federal ESA or result in the destruction or adverse modification of critical habitat proposed to be designated for such species (16 USC 1536[3], [4]).
Migratory Bird Treaty Act
The Migratory Bird Treaty Act (16 USC 703, Supp. I, 1989) prohibits the killing, possessing, or trading of migratory birds, bird parts, eggs, and nests, except in accordance with regulations prescribed by the Secretary of the Interior.
Bald and Golden Eagle Protection Act
Pursuant to the Bald and Golden Eagle Protection Act (16 USC 668), it is illegal to import, export, take (which includes molest or disturb), sell, purchase, or barter any bald eagle or golden eagle or part thereof.
State of California
California Department of Fish and Game
CDFG administers a number of laws and programs, discussed below, designed to protect state listed fish and wildlife resources.
1 “Take” is defined as harassing, harming, pursuing, hunting, shooting, wounding, killing, trapping, capturing,
collecting, or attempting to engage in any such conduct.

4. Environmental Analysis Biological Resources
McHenry Solar Farm 4.4-14 May 2011 Draft Environmental Impact Report
California Endangered Species Act
The California Endangered Species Act of 1984 – Fish and Game Code Section 2050 et seq. – regulates the listing and “take” of state endangered and threatened species. “Take” in the context of the California ESA means to hunt, pursue, kill, or capture a listed species, as well as any other actions that may result in adverse impacts when attempting to take individuals of a listed species. A “take” of such a species may be permitted by CDFG through issuance of permits pursuant to Fish and Game Code Section 2081, except for designed “fully protected” species (see subsection below).
Fully Protected Species
Prior to enactment of the California ESA, the designation of “Fully Protected” was used by CDFG to identify species that had been given special protection by the California Legislature by a series of statutes in the California Fish and Game Code. Many Fully Protected species have also been listed as threatened or endangered species pursuant to the more recent endangered species laws and regulations; however, the original statutes have not been repealed, and the legal protection they give the species identified within them remains in place. Fully Protected species may not be taken or possessed at any time, and no licenses or permits may be issued for their take except for collecting these species for necessary scientific research and relocation of the bird species for the protection of livestock. Because the “take” of endangered or threatened species can be permitted for development purposes with the issuance of a permit by CDFG, Fully Protected species actually receive a greater level of legal protection than listed species.
Protection of Nesting Birds
Section 3503.5 of the California Fish and Game Code states that it is “unlawful to take, possess, or destroy the nests or eggs of any such bird of prey (i.e., species in the orders Falconiformes and Strigiformes) except otherwise provided by this code or any other regulation adopted hereto.” Active nests of all other birds (except English sparrow (Passer domesticus) and European starling (Sturnus vulgaris)) are similarly protected pursuant to Section 3503 of the California Fish and Game Code, as well as birds designated in the International Migratory Bird Treaty Action pursuant to Section 3513 of the California Fish and Game Code. Disturbance that causes nest abandonment and/or reproductive failure is considered a take by the CDFG. This statute does not provide for the issuance of an incidental take permit.
Species of Special Concern
CDFG also designates California Species of Special Concern (CSC), which are species of limited distribution, declining populations, diminishing habitat, or unusual scientific, recreational, or educational value. These species do not have the same legal protection as listed species or fully protected species but may be added to official lists in the future. The CSC list is intended by CDFG as a management tool for consideration in future land use decisions. Pursuant to the CDFG policy, CSCs are not subject to the same consultation requirements as endangered or threatened species, but the agency encourages informal consultation for CSCs that may become officially listed before completion of the CEQA process.

4. Environmental Analysis Biological Resources
McHenry Solar Farm 4.4-15 May 2011 Draft Environmental Impact Report
Native Plant Protection Act
California Fish and Game Code Sections 1900–1913, also known as the Native Plant Protection Act, is intended to preserve, protect, and enhance endangered or rare native plants in California. The Act directs the CDFG to establish criteria for determining what native plants are rare or endangered. Pursuant to Section 1901, a species is endangered when its prospects for survival and reproduction are in immediate jeopardy from one or more cause. A species is rare when, although not threatened with immediate extinction, it is in such small numbers throughout its range that it may become endangered if its present environment worsens. The Act also directs the California Fish and Game Commission to adopt regulations governing the taking, possessing, propagation, or sale of any endangered or rare native plant.
California Native Plant Society
Vascular plants listed as rare or endangered by the CNPS (CNPS, 2010), but which may have no designated status or protection pursuant to federal or state endangered species legislation, are defined as follows:
List 1A: Plants presumed extinct in California.
List 1B: Plants rare, threatened, or endangered in California and elsewhere.
List 2: Plants rare, threatened, or endangered in California, but more numerous elsewhere.
List 3: Plants about which more information is needed (a review list).
List 4: Plants of limited distribution (a watch list).
In general, plants appearing on CNPS Lists 1A, 1B, or 2 are considered to meet the criteria of CEQA Guidelines §15380, and effects to these species are considered significant in this EIR. Additionally, plants listed on CNPS Lists 1A, 1B, or 2 meet the definition of Section 1901, Chapter 10 (Native Plant Protection Act) and Sections 2062 and 2067 (California Endangered Species Act) of the California Fish and Game Code.
Lake and Streambed Alteration Program
The CDFG is authorized pursuant to the California Fish and Game Code Sections 1600-1607 to develop mitigation measures and enter into Lake and Streambed Alteration Agreements with Applicants who propose projects that would obstruct the flow of, or alter the bed, channel, or bank of a river or stream in which there is a fish or wildlife resource, including intermittent and ephemeral streams.
Stanislaus County
General Plan
The 1994 Stanislaus County General Plan is a comprehensive long-range plan for the physical development of the county, and of any land outside its boundaries which in the planning agency’s judgment bears relation to its planning. The Conservation/Open Space Element of the Stanislaus County General Plan emphasizes the conservation and management of natural resources and the preservation of open space lands.

4. Environmental Analysis Biological Resources
McHenry Solar Farm 4.4-16 May 2011 Draft Environmental Impact Report
The General Plan has adopted the following Conservation /Open Space goals, policies, and implementation measures to protect natural resources within the county. Below are the Goals, Policies, and Implementation Measures that are applicable to natural resources for the Project.
Goal One: Encourage the protection and preservation of natural and scenic areas throughout the County.
Policy Three: Areas of sensitive wildlife habitat and plant life (e.g., vernal pools, riparian habitats, flyways and other waterfowl habitats, etc.) including those habitats and plant species listed in the General Plan Support Document or by state or federal agencies shall be protected by development.
Implementation Measure 1 is designed to support Goal One and Policy Three and is relevant to the proposed Project:
Implementation Measure 1: Review all development requests to ensure that sensitive areas(e.g. riparian habitats, vernal pools, rare plants, flyways, etc.) are left undisturbed or that mitigation measures acceptable to appropriate state and federal agencies are included in the project.
Goal Ten: Protect fish and wildlife species of the County.
Policy Thirty: Habitats of rare and endangered fish and wildlife species shall be protected. Information on rare and endangered species and habitats is constantly being updated in response to a 1982 state law by the California State Department of Fish and Game through various sources which include the Stanislaus Audubon Society, California Native Plant Society, and the Sierra Club.
Implementation Measures 1 and 3 are designed to support Goal Ten and Policy Thirty and are relevant to the Project:
Implementation Measure 1: The County shall utilize the California Environmental Quality Act (CEQA) process to ensure that development does not occur that would be detrimental to fish, plant life, or wildlife species.
Implementation Measure 3: The County shall protect sensitive wildlife habitat and plant life through the strategies identified under Policy Three of this element.
4.4.2 Significance Criteria Based on CEQA Guidelines Appendix G, a project would cause a significant impact on biological
resources if it would:
a) Have a substantial adverse effect, either directly or through habitat modifications, on any species identified as a candidate, sensitive, or special status species in local or regional plans, policies, or regulations, or by the California Department of Fish and Game or U.S. Fish and Wildlife Service;
b) Have a substantial adverse effect on any riparian habitat or other sensitive natural community identified in local or regional plans, policies, regulations, or by the California Department of Fish and Game or U.S. Fish and Wildlife Service;

4. Environmental Analysis Biological Resources
McHenry Solar Farm 4.4-17 May 2011 Draft Environmental Impact Report
c) Have a substantial adverse effect on federally protected wetlands as defined by Section 404 of the Clean Water Act (including but not limited to, marsh, vernal pool, coastal, etc.) through direct removal, filling, hydrological interruption, or other means;
d) Interfere substantially with the movement of any native resident or migratory fish or wildlife species or with established native resident or migratory wildlife corridors, or impede the use of native wildlife nursery sites;
e) Conflict with any local policies or ordinances protecting biological resources, such as tree preservation policy or ordinance; or
f) Conflict with the provisions of an adopted Habitat Conservation Plan, Natural Community Conservation Plan, or other approved local, regional, or state habitat conservation plan.
In conducting the following impact analysis, three principal components of the Guidelines outlined above were considered:
Magnitude of the impact (e.g., substantial/not substantial); Uniqueness of the affected resource (i.e., rarity of the resource); and Susceptibility of the affected resource to perturbation (i.e., sensitivity of the resource).
The evaluation of the significance of the following impacts considered the interrelationship of these three components. For example, a relatively small magnitude impact to a state or federally listed species would be considered significant because the species is very rare and is believed to be very susceptible to disturbance. Conversely, a plant community, such as California annual grassland, is not necessarily rare or sensitive to disturbance. Therefore, a much larger magnitude of impact would be required to be classified as significant.
This impact analysis focuses on foreseeable changes to the baseline condition in the context of the significance criteria presented above. Impacts of the Project in relation to these issues were assessed.
4.4.3 Discussion of Criteria with No Biological Resources Impacts
Analysis of the setting and Project characteristics relative to the significance criteria shows that the Proposed Project would have no impact on Biological Resources with respect to criteria b) through f). The reasoning supporting this conclusion follows.
b) The Project would have no adverse effect on any riparian habitat or other sensitive natural community identified in local or regional plans, policies, regulations, or by the California Department of Fish and Game or U.S. Fish and Wildlife Service.
The site is actively farmed row crops, and there is no riparian habitat within the Project site. Therefore, the Project would have no impact on any riparian habitat or other sensitive natural community.

4. Environmental Analysis Biological Resources
McHenry Solar Farm 4.4-18 May 2011 Draft Environmental Impact Report
c) The Project would have no adverse effect on federally protected wetlands as defined by Section 404 of the Clean Water Act.
There are no federally protected wetlands as defined by Section 404 of the Clean Water Act (CWA), within the Project site. Therefore, the Project would have no impact on federally protected wetlands.
d) The Project would not interfere with the movement of any native resident or migratory fish or wildlife species or with established native resident or migratory wildlife corridors, or impede the use of native wildlife nursery sites.
The Project site is not located within a wildlife movement corridor, dispersal area, or within a migration path. Therefore, construction of the Project would not interfere with the movement of any native or migratory fish or wildlife species, established wildlife corridors, or impede the use of native wildlife nursery sites, and the Project would have no impact.
e) The Project would not conflict with any local policies or ordinances protecting biological resources.
There are no local policies or ordinances, such as tree preservation policies, with which the Project could be in conflict. Therefore, the Project would have no impact with respect to policies or ordinances protecting biological resources.
f) The Project would not conflict with the provisions of an adopted Habitat Conservation Plan, Natural Community Conservation Plan, or other approved local, regional, or state habitat conservation plan.
The Project is not located within an adopted Habitat Conservation Plan or Natural Community Conservation Plan. Therefore, the Project would have no impact since it would not conflict with the provisions of an approved local, regional, or state habitat conservation plan.
4.4.4 Impacts and Mitigation Measures a) Have a substantial adverse effect, either directly or through habitat modifications, on
any species identified as a candidate, sensitive, or special-status species in local or regional plans, policies, or regulations, or by the California Department of Fish and Game or U.S. Fish and Wildlife Service.
Impact 4.4-1: Applicant Project activities could result in potential disturbance or loss of Swainson’s hawk and their habitat. (Less than significant with mitigation)
There are two CNDDB occurrences of Swainson’s hawk: one approximately 1.5 miles to the northeast and the other 2.3 miles to the north of the Project site. Based on the small stature of trees in the Project Study Area, the Swainson’s hawk is not expected to nest on or near the Project site. Higher quality nesting and foraging habitat is widely distributed north and east of the Project site, in association with the Stanislaus River and nearby annual grasslands and agricultural lands. Row crops can provide important foraging habitat for Swainson’s hawks, particularly during and after harvesting; however, strawberry plants on the Project site are managed as a perennial crop

4. Environmental Analysis Biological Resources
McHenry Solar Farm 4.4-19 May 2011 Draft Environmental Impact Report
that precludes the presence of small mammal and most invertebrates. Consequently, fallow portions of the Project site are considered to provide low quality natural habitat that supports low densities of Swainson’s hawk forage species. Permanent losses of low quality foraging habitat could occur in areas where permanent facilities are placed including structures or roads. Given the presence of low quality habitat on the Project site, impacts to Swainson’s hawk foraging habitat would be negligible. In addition, no Swainson’s hawk nests were observed at the site or in ornamental tress outside the project site during the biological reconnaissance survey conducted in June 2010. Nonetheless, preconstruction surveys are required to determine what, if any, actions need to be taken to avoid disturbance or loss of Swainson’s hawk.
Mitigation Measure 4.4-1a: Preconstruction Surveys for Swainson’s Hawk. If Project-related construction or decommissioning activities are planned to occur during the nesting period (March 1 to September 15), the Applicant shall engage a qualified biologist to conduct preconstruction surveys for Swainson’s hawk and their nests no more than 14 days before the start of construction or decommissioning activities within 0.25 mile of the Project site where access is available. Survey results shall be submitted to CDFG at least three days prior to the start of construction or decommissioning activities. If active nests are not identified, no further action is required and construction/decommissioning may proceed. If active nests are identified, the Applicant shall consult with CDFG to develop and implement suitable avoidance measures, consistent with the Staff Report Regarding Mitigation for Impacts to Swainson’s Hawks in the Central Valley of California (CDFG, 1994). To avoid impacting breeding efforts, no construction or decommissioning activities shall occur between March 1 and September 15 within 500 feet of an active nest that could cause nest abandonment or forced fledging. These buffers may be reduced in consultation with CDFG.
Depending on conditions specific to each active nest, and the relative location and rate of construction or decommissioning activities, it may be feasible for such activities to occur as planned within the buffer without impacting the breeding effort. In this case (to be determined in consultation with CDFG), the nest(s) shall be monitored by a qualified biologist during construction or decommissioning within the buffer. The monitor shall have “stop work” authority. If, in the professional opinion of the monitor Project activities are negatively affecting the nesting behavior of the bird, the monitor shall stop all such activities within the designated buffer. Construction or decommissioning activities shall not resume until either the monitor has determined that the young have fledged the nest or as otherwise approved by CDFG.
With CDFG concurrence, construction activities that are initiated outside the nesting season may continue even if raptors choose to nest within 500 feet of work activities. Thus, work may continue without delay if surveys verify the local absence of nesting raptors, or if construction begins outside the nesting period (September 16 to February 28).
Mitigation Measure 4.4-1b: Reduce Construction Noise Levels. If it appears that noise or vibration from vibratory post driving associated with Project construction (or other similar noise-generating construction or decommissioning activity) could affect nesting Swainson’s hawks that arrive after the start of construction, specific measures, including but not limited to use of noise dissipaters, shall be implemented to reduce noise levels. During post driving, a noise level of no greater than 85 decibels (measured at the nest) shall be used as general guidance for nests that are established after construction.

4. Environmental Analysis Biological Resources
McHenry Solar Farm 4.4-20 May 2011 Draft Environmental Impact Report
Impact 4.4-2: MID activities could result in potential disturbance or loss of Swainson’s hawk and their habitat. (Less than significant with mitigation)
MID’s 2006 PEIR Update requires pre-construction surveys for Swainson’s hawk only where tree trimming or removal is necessary (2006 PEIR Update; p. 7-16). There are no trees currently present in either the proposed or the two optional interconnection alignments for the sub-transmission and distribution lines. The fiber optic cable is proposed to be installed entirely on existing poles in existing ROW, so tree trimming or removal is not expected to be necessary for installation of the fiber optic cable. Accordingly, impacts to Swainson’s hawk would not be significant for these Project activities and no mitigation is necessary.
Installation of new fiber optic cable as underbuild on existing poles would not result in an increased risk of avian electrocution or collision. However, once installed, operation of the new overhead 69-kV sub-transmission line would increase the risk of avian electrocution or collision. Therefore, implementation of the Project has the potential to result in significant impacts to Swainson’s hawk. According to MID’s 2006 PEIR Update, transmission line designs will be in conformance with the criteria identified in Avian Power Line Interaction Committee (APLIC, 1996) (2006 PEIR Update; p. 7-15). To ensure that collision and electrocution impacts to Swainson’s hawk would be avoided or reduced, MID shall implement the following mitigation measure consistent with the 2006 PEIR Update:
Mitigation Measure 4.4-2: Avian-safe Transmission Line (MID). Transmission poles should be designed using criteria identified in Avian Power Line Interaction Committee (APLIC, 2006).
Significance after Mitigation: Less than Significant.
Impact 4.4-3: Project activities could impact other tree-nesting raptors and/or protected nesting migratory birds. (Less than significant with mitigation)
The same activities associated with construction and decommissioning of the Project that could potentially impact Swainson’s hawk could affect other tree-nesting raptors and/or protected nesting migratory birds. In addition, removal of landscaping during decommissioning could affect tree-nesting raptors and/or protected nesting migratory birds that may have established nests in the landscaping over the life of the Project. Implementation of Mitigation Measure 4.4-3 would reduce potential impacts to other tree-nesting raptors and/or protected nesting migratory birds to a less than significant level.
MID’s 2006 PEIR Update requires pre-construction surveys for raptors only where tree trimming or removal is necessary (2006 PEIR Update; p. 7-14). There are no trees currently present in either the proposed or the two optional interconnection alignments for the sub-transmission and distribution lines. The fiber optic cable is proposed to be installed entirely on existing poles in existing ROW, so tree trimming or removal is not expected to be necessary for installation of the

4. Environmental Analysis Biological Resources
McHenry Solar Farm 4.4-21 May 2011 Draft Environmental Impact Report
fiber optic cable. Accordingly, impacts to raptors would not be significant for these Project activities and no mitigation is necessary.
Mitigation Measure 4.4-3: Preconstruction Raptor Surveys (Applicant). If Project-related construction and/or decommissioning activities are to occur during the breeding period for nesting raptors and/or protected nesting migratory birds (February 1 through August 31), the Applicant shall engage a qualified biologist to conduct preconstruction surveys of all potential habitat within 500 feet of the Project site no more than 14 days prior to the start of construction or decommissioning activities. If active nests are not identified, no further action is necessary. If active nests are identified during preconstruction surveys, a no-disturbance buffer shall be created around active raptor nests and nests of other special-status birds during the breeding season, or until it is determined by the qualified biologist that all young have fledged. Typical buffers are 500 feet for raptors and 250 feet for other nesting birds (e.g., waterfowl, and passerine birds). The size of these buffer zones and types of construction or decommissioning activities allowed in these areas could be further modified in coordination with CDFG and shall be based on existing noise and disturbance levels in the Project area.
Significance after Mitigation: Less than Significant.
Impact 4.4-4: Project activities could result in potential disturbance or loss of burrowing owls and their habitat. (Less than significant with mitigation)
Small, undisturbed patches on the fringe of the Project site that are not subject to agricultural uses may provide suitable breeding habitat for burrowing owls. These areas could be temporarily or permanently disturbed during Project construction activities, and could affect nesting or non-nesting burrowing owls, if present. Due to the potential for direct mortality during Project construction and decommissioning, the Project has the potential to result in significant impacts to this species. Implementation of the following mitigation measure would reduce this impact to less than significant.
Mitigation Measure 4.4-4a: Preconstruction Burrowing Owl Surveys (Applicant). The Applicant shall engage a qualified biologist to conduct preconstruction surveys for burrowing owls 14 to 30 days prior to the start of construction or decommissioning, using the most current CDFG protocol. Surveys shall cover grassland areas within a 500-foot buffer from all Project construction/decommissioning activities that are within suitable grasslands habitat, including checking for adult and juvenile burrowing owls and owl nests. If owls are detected during surveys, occupied burrows shall not be disturbed.
Construction/decommissioning exclusion areas (e.g., orange exclusion fence or signage) shall be established around the occupied burrows, where no disturbance shall be allowed. During the nonbreeding season (September 1 through January 31), the exclusion zone shall extend 160 feet around occupied burrows. During the breeding season (February 1 through August 31), exclusion areas shall extend 250 feet around occupied burrows.

4. Environmental Analysis Biological Resources
McHenry Solar Farm 4.4-22 May 2011 Draft Environmental Impact Report
If the above requirements cannot be met, passive relocation of on-site owls may be implemented as an alternative, but only during the nonbreeding season and only with prior CDFG approval. Passive relocation shall be accomplished by installing one-way doors on the entrances of burrows located within 160 feet of the Project area. The one-way doors shall be left in place for 48 hours to ensure the owls have left the burrow. The burrows shall then be excavated with a qualified biologist present. Construction/decommissioning shall not proceed until the Project area is deemed free of owls by the qualified biologist.
Small, undisturbed patches on the sides of the roads where the sub-transmission and distribution line interconnection point and the fiber optic cable are proposed to be installed may provide suitable breeding habitat for burrowing owls. These areas could be temporarily or permanently disturbed during Project construction activities, and could affect nesting or non-nesting burrowing owls, if present. Due to the potential for direct mortality during MID’s sub-transmission and distribution line interconnection point and fiber optic cable construction activities, the Project has the potential to result in significant impacts to this species. Consistent with MID’s 2006 PEIR Update (2006 PEIR Update; p. 7-17), implementation of the following mitigation measure would reduce this impact to less than significant.
Mitigation Measure 4.4-4b: Preconstruction Burrowing Owl Surveys (MID). Prior to construction, MID shall conduct pre-construction surveys for burrowing owl for the sub-transmission/distribution line and fiber optic cable alignment. These surveys shall be conducted using the most up-to-date CDFG published protocols (e.g., CDFG's 1995 Staff Report on Burrowing Owl Mitigation). If owls are detected during surveys, occupied burrows shall not be disturbed.
Significance after Mitigation: Less than Significant.
4.4.5 Alternatives
4.4.5.1 Reduced Project
As described for the Project, the Study Area is predominantly comprised of agricultural habitats and disturbed areas. Two special-status species, Swainson’s hawk and burrowing owl, as well as other protected nesting migratory birds, have the potential to occur within and in the vicinity of the Project site habitats. The Reduced Project alternative would result in impacts to biological resources that are similar to or slightly less than those associated with the Project because this alternative would result in approximately 10 percent less potential habitat being impacted.
4.4.5.2 Non-Agriculture Site
The results of the CNDDB records search described above for the Project site also encompassed the area of the Non-Agriculture Site Alternative; no additional special-status species have been recorded in the vicinity of this alternative site. Biological surveys have not been conducted on the Non-Agriculture Site. Instead, recent aerial photographs were examined to determine potential habitat types on the site. The majority of the alternative site is developed industrial land. As a

4. Environmental Analysis Biological Resources
McHenry Solar Farm 4.4-23 May 2011 Draft Environmental Impact Report
result, the potential for this site to support sensitive biological resources is extremely limited. However, the site has several ornamental trees that could provide suitable nesting sites for a variety of bird species. Foraging habitat in the immediate vicinity is abundant. The site also contains a vacant, undeveloped lot in its southeast corner that could potentially provide habitat for burrowing owl. The size of the site, however, is only about 20 percent that of the proposed Project site, so overall there is less potential habitat that could be disturbed. Therefore, potential impacts to biological resources for this alternative would be similar to or less than the Project.
4.4.5.3 No Project
The potential for on-site impacts to biological resources if the No Project Alternative is implemented would be less than those associated with the Proposed Project due to the lack of physical changes to the site. On-going agricultural activities would not be expected to result in significant impacts to Swainson’s hawk and burrowing owl.
References – Biological Resources Avian Power Line Interaction Committee (APLIC). 1996. Suggested Practices for Raptor
Protection on Power Lines: The State of the Art in 1996. Edison Electric Institute/Raptor Research Foundation. Washington D.C.
California Department of Fish and Game (CDFG). 1994. Staff Report Regarding Mitigation for Impacts to Swainson’s Hawks (Buteo swainsoni) in the Central Valley of California. November 8, 1994.
California Department of Fish and Game (CDFG). 1995. Staff Report on Burrowing Owl Mitigation. October 17, 1995.
CDFG. 2010. California Natural Diversity Database (CNDDB) Rarefind Program for the Riverbank, Salida, Avena, Escalon, Oakdale, Waterford, Denair, Ceres, and Brush Lake USGS 7.5-minute topographic quadrangles. Access on July 12, 2011.
CDFG, 1994. Staff Report Regarding Mitigation for Impacts to Swainson’s Hawks in the Central Valley of California. November 1, 1994.
California Native Plant Society (CNPS). 2010. Inventory of Rare and Endangered Plants - Online, v7-10a 1-19-10. Search of the Riverbank, Salida, Avena, Escalon, Oakdale, Waterford, Denair, Ceres, and Brush Lake USGS 7.5-minute topographic quadrangles. California Native Plant Society. Sacramento, CA. Site accessed at: http://cnps.web.aplus.net/cgi-bin/inv/inventory.cgi/Home on July 12, 2010.
Mayer, Kenneth E. and William F. Laudenslayer, Jr. 1988. A Guide to Wildlife Habitats of California. California Department of Fish and Game. Sacramento, CA.
Modesto Irrigation District (MID), 2006. Addendum to Program Environmental Impact Report, M.I.D. Electrical Expansion Program in portions of San Joaquin, Stanislaus and Tuolumne Counties. State Clearinghouse Number: 1999012033. September 15, 2006. pgs. 7-15, 7-17.

4. Environmental Analysis Biological Resources
McHenry Solar Farm 4.4-24 May 2011 Draft Environmental Impact Report
Miles, S,R. and C.B. Goudey. 1997. Ecological Subregions of California: Section and Subsection Descriptions. USDA Forest Service, Pacific Southwest Region Publication R5-EM-TP-005. San Francisco, CA.
Sawyer, John O. and Todd Keeler-Wolf. 1995. A Manual of California Vegetation. California Native Plant Society. Sacramento, California.
Stanislaus County, 2008. 1994 Stanislaus County General Plan, rev. December 2008.
USFWS. 1998. Recovery Plan for Upland Species of the San Joaquin Valley. USFWS Region 1. Portland, Oregon. Electronic document accessed at http://ecos.fws.gov/docs/recovery_plans/1998/980930a.pdf
USFWS. 2010. Federal Endangered and Threatened Species List for Riverbank and Salida USGS 7.5-minute topographic quadrangles. Site accessed at: http://www.fws.gov/sacramento/es/spp_list.htm on July 12, 2010.

4. Environmental Analysis
McHenry Solar Farm 4.5-1 May 2011 Draft Environmental Impact Report
4.5 Cultural and Paleontological Resources
This section identifies and evaluates issues related to Cultural and Paleontological Resources in the context of the proposed Project and alternatives. Cultural resources include architectural/structural resources of the built environment, prehistoric and historic-period archaeological resources, and human remains. Paleontological resources – fossils – are the fossilized evidence of past life found in the geologic record. Discussed below are: the physical and regulatory setting; the baseline for determining environmental impacts; the criteria used for determining the significance of environmental impacts; potential impacts associated with construction, operation, maintenance, and decommissioning of the Project; and mitigation measures to reduce or avoid environmental impacts determined to be potentially significant.
4.5.1 Setting
4.5.1.1 Regional and Local Setting
Section 2.2, Project Location and Existing Land Use, provides general information about the regional and local setting. This section provides setting information specific to Cultural and Paleontological Resources.
Natural Setting The Project site is located in Stanislaus County in the northern San Joaquin Valley within basin-type physiography. Stanislaus County is located in the central region of the Central Valley. Historically, this region supported extensive grasslands intermixed with a variety of vegetative communities including oak woodland, wetland, and riparian woodland. Intensive agricultural and urban development has resulted in large losses and conversion of these habitats. The Project site is situated on the valley floor consisting of flat terrain at an elevation approximately 250 feet above mean sea level. At the time of the archaeological survey on June 10, 2010, the eastern half of the Project site was in strawberry production and the western half was annual grassland. The majority of the land surrounding the Project site, on the north and east sides, consists of deciduous orchards.
The nearest natural watercourse is the Lower Stanislaus River located approximately 1 mile northwest of the Project site. The Lower Stanislaus River drains the west slopes of the Sierra Nevada, eventually meeting the San Joaquin River to the west. The Modesto Main Canal is located east and south of the Project site, crossing Patterson Road, Skittone Road, and McHenry Avenue (See Figure 2-1 in Chapter 2, Project Description). Ables Drain is aligned east from the Modesto Main Canal and across McHenry Avenue. Both pass as close as 500 to 1000 feet south of the Project site. The Modesto Main Canal and Ables Drain are constructed water conveyance features that bring water from the Tuolumne River to the Modesto area for agricultural irrigation and drainage. There are no rivers, creeks, canals, wetlands, or riparian habitats within the Project site.

4. Environmental Analysis Cultural and Paleontological Resources
McHenry Solar Farm 4.5-2 May 2011 Draft Environmental Impact Report
Geologic Setting The Project site and the surrounding vicinity is underlain by the Upper Modesto Formation, consisting of early-Holocene and Pleistocene-aged alluvium locally topped by Holocene-aged wind-blown sand dunes (USGS, 2004; p. 13). The Modesto Formation was formed during and immediately after the last ice-age when the major rivers draining the Sierra Nevada, including the Stanislaus River, were discharging much greater volumes of sediment-laden water (Weissmann et al., 2005; p. 169). During this period, a thick package of stream sediments accumulated on the western side of the San Joaquin Valley causing a build-up of the valley floor and the formation of alluvial fans. This continued until around 10,000 years ago (i.e. end of the Pleistocene epoch), when a shift in climate drastically reduced the sediment supply delivered by rivers draining the Sierra Nevada. Since then, the Stanislaus River has been down-cutting into the Modesto Formation, abandoning previous flood plains (Weissmann et al., 2005; p. 169). Northeast of the Project site, the Stanislaus River has carved out a flood plain which is 30-40 feet lower in elevation than the surrounding area.
Because of the age of the Upper Modesto Formation, these deposits have a potential to contain paleontological resources and have little potential to contain archaeological resources. Archaeological resources are more likely to occur in the more recent Holocene alluvial deposits because they were formed contemporaneously with human occupation of the area.
The Project area has a long history of agricultural use, which means that the natural soil profiles within the Project site have been disturbed, reworked, or amended by plowing and discing for at least the first 2 feet of soil below the ground surface. As such any cultural or paleontological resources that may be associated with approximately the upper 2 feet of soil within the Project site are likely to have been severely disturbed and their original context damaged.
Prehistoric Setting In 9000 B.C., large pluvial lakes and marshes covered much of the California interior—the largest of which included Buena Vista and Tulare lakes. Although an archaeological sequence was not defined based on the early findings near pluvial lakes, the material discovered included a wide variation in time and occupation commonly referred to as the “Western Pluvial Lakes Tradition.” This tradition shared a common toolkit: leaf-shaped projectile knives and points (fluted) and milling stones for exploiting the rich resource base located around the pluvial lakes and marshes (Moratto, 1984; p.93). By 6500 B.C. a global warming trend called the Altithermal brought about the decline of the ancient lakes. This period of climate change and the cultural adaptations to these dryer and hotter conditions is poorly understood.
A three-part cultural chronological sequence, the Central California Taxonomic System (CCTS), was developed by archaeologists to explain local and regional cultural change in prehistoric central California from approximately 4,500 years ago to the time of European contact (Moratto, 1984; pp. 181-185). The Windmiller Pattern was the earliest comprehensive view of the region, from the Paleo-Indian Period to Lower Archaic (~6000 B.C. to ~3000 B.C.). This cultural horizon reflected a people well adapted to riverine and marshland environments. The subsequent Berkeley Pattern or Cosumnes culture (~2000 B.C. to A.D. 300), comparable to the emerging Archaic Period in California prehistory (3000 B.C. to A.D. 1000), reflected a change in socioeconomic

4. Environmental Analysis Cultural and Paleontological Resources
McHenry Solar Farm 4.5-3 May 2011 Draft Environmental Impact Report
complexity and settlement patterns. Out of the Cosumnes Tradition came the Hotchkiss Tradition (or “Late Horizon”) by the Emergent Period, or approximately 500 A.D. The peoples of the Hotchkiss Tradition were likely flourishing in the Stockton and Delta region up to contact with Europeans.
Ethnographic Setting At the time of European contact, the Project area was inhabited by the Northern Valley Yokuts. Because of the early decimation of the aboriginal populations in the San Joaquin Valley, most information regarding the Northern Valley Yokuts is gleaned from translated accounts by the Spanish military and missionaries. A summary of these sources has been compiled by W.J. Wallace (1978; pp. 462-470), and it is upon this work that this ethnographic setting is based.
Northern Valley Yokuts territory is defined roughly by the crest of the Diablo Range on the west, and the foothills of the Sierra Nevada on the east. The southern boundary is located approximately where the San Joaquin River bends northward, and the northern boundary is roughly half way between the Calaveras and Mokelumne rivers. The Yokuts may have been fairly recent arrivals in the San Joaquin Valley, perhaps being pushed out of the foothills approximately 500 years ago.
Population estimates for the Northern Valley Yokuts vary from 11,000 to more than 31,000 individuals. Populations were concentrated along waterways and on the more hospitable east side of the San Joaquin River. Villages, or clusters of villages, made up “miniature tribes” (tribelets) lead by headmen. The number of tribelets is estimated at 30 to 40; each tribe spoke its own dialect of the Yokuts language. Combined with the Southern Valley Yokuts and the Foothill Yokuts dialects, these tongues formed the Yokutsan linguistic family of the Penutian Stock (Shipley, 1978; p. 83).
Principal settlements were located on the tops of low mounds, on or near the banks of the larger watercourses. Settlements were composed of single-family dwellings, sweathouses, and ceremonial assembly chambers. Dwellings were small and lightly constructed, semi-subterranean, and oval. The public structures were large and earth covered. Northern Valley Yokut settlements tended to remain in place for long periods of time due to the abundance of riverine resources in the area.
Subsistence among the Northern Valley Yokuts revolved around the waterways and marshes of the lower San Joaquin Valley. Fishing with dragnets, harpoons, and hook and line yielded salmon, white sturgeon, river perch, and other species of edible fish. Waterfowl and small game attracted to the water also provided a source of protein. The contribution of big game to the diet was probably minimal. Vegetal staples included acorns, tule roots, and seeds.
Goods not available locally were obtained through trade. Paiute and Shoshone groups on the eastern side of the Sierra were suppliers of obsidian (volcanic glass used for tools). Shell beads and mussels were obtained from Salinan and Coastanoan groups. Trading relations with Miwok groups yielded baskets and bows and arrows. Overland transport was facilitated by a network of trails, and tule rafts were used for water transport.

4. Environmental Analysis Cultural and Paleontological Resources
McHenry Solar Farm 4.5-4 May 2011 Draft Environmental Impact Report
Most Northern Valley Yokuts groups had their first contact with Europeans in the early 1800s, when the Spanish began exploring the Delta. The gradual erosion of Yokuts culture began during the mission period. Epidemics of European diseases played a large role in the decimation of the native population. With the secularization of the mission and the release of neophytes, tribal and territorial adjustments were set in motion. People returned to other groups, and a number of polyglot “tribes” were formed. The final blow to the aboriginal population came with the Gold Rush and its aftermath. In the rush to the southern mines, native populations were pushed out of the way, and out of their existing territories. Ex-miners settling in the fertile valley applied further pressure to the native groups, and altered the landforms and waterways of the valley. Many Yokuts resorted to wage labor on farms and ranches. Others were settled on land set aside for them on the Fresno and Tule river reserves.
Historic Setting Lieutenant Gabriel Moraga left the Mission San Jose September 21, 1806 and was the first European to enter the San Joaquin Valley to explore the Californian interior in search of suitable locations for missions. During his exploration, Moraga named the Stanislaus River, which was later used to designate the county.
In 1827, Euro-American trappers, including Jedediah Strong Smith, began to enter the region to hunt the fur-bearing animals that inhabited the Central Valley. Settlement of the valley was aided by the issuing of land grants, with Spanish, and later Mexican, governors giving settlers large sections of land to use for farming and raising cattle. Prior to the Gold Rush, the San Joaquin Valley was devoted to grazing and hunting, as immense herds of cattle and some horses roamed the valley (Hoover, 2002; p.517).
With the resulting influx of population resulting from the discovery of gold in 1848, the produc-tion of food was needed to support the miners, and the San Joaquin Valley was developed to become an agricultural resource. Some of the miners, disappointed in the search for gold, turned to farming in the fertile swamp lands in the San Joaquin Valley. Stanislaus County was created in 1854 from portions of Tuolumne County.
Riverbank was founded in 1911 when the Santa Fe Railroad established a new terminal and division point south of Burneyville and named it Riverbank for its location on the Stanislaus River. The older settlement, now on the edge of Riverbank, had been named for Major James Burney, an early settler and the first sheriff of Mariposa County (Gudde, 1998; p.318). Major Burney established Burneyville in 1867 and operated a ferry crossing the Stanislaus River. He died in 1901 (Hoover, 2002; p. 521).
Originally known as Farmington Road, McHenry Avenue has been in use since at least the 1870s. Farmington was a major town in southeast San Joaquin County prior to the establishment of Escalon, and Farmington Road connected the community with the Stanislaus River to the north and River Road to the south. In the early 20th century, Farmington Road became an important regional route, and by 1930, the road had been paved along its entire length. In the 1920s, Farmington road became known as Escalon Road, and in the 1930s, the name changed again to

4. Environmental Analysis Cultural and Paleontological Resources
McHenry Solar Farm 4.5-5 May 2011 Draft Environmental Impact Report
the Escalon-Bellota Road. Since the 1960s, the stretch of road south of SR 120, adjacent to the Project site, has been referred to as McHenry Road (Corbett and Minor, 1996; p. 8).
The 1853/54 General Land Office plat shows a road crossing the Project site. The road is not shown on later maps. No buildings/structures or features are shown on the 1916 USGS Riverbank topographic quadrangle. Two small buildings are shown on the west/central section of the Project site on the 1953 USGS Riverbank topographic quadrangle. Two buildings are also shown outside of but adjacent to the Project site. The remainder of the Project site appears to have been used for agriculture, including orchards.
4.5.2 Methodology and Results
4.5.2.1 Archival Research
A records search of all pertinent survey and site data was conducted at the Central California Information Center at California State University, Stanislaus on October 5, 2009 (File No. 7525N). Records were accessed by using the Riverbank and Salida, California U.S. Geological Survey 7.5-minute topographic quadrangle maps. The review included the Project site including all Project components and a 0.5-mile radius. The records search included a review of the Directory of Properties in the Historic Property Data File for Stanislaus County for information on sites of recognized historic significance in the National Register of Historic Places, the California Register of Historical Resources, the California Inventory of Historic Resources (1976), the California Historical Landmarks (1996), the California Points of Historical Interest (1992), the Caltrans State and Local Bridge Survey (1989), and the Survey of Surveys (1989). The 1853/54 General Land Office Plat and the 1916, 1941, and 1953 USGS 15-minute topographic quadrangles were also reviewed.
The records search revealed that only one previous cultural resources investigation had been conducted within 0.5-mile radius of the Project site. This investigation took place adjacent the Project site on McHenry Avenue (Davis-King, 2008). The Project site itself has never been subject to cultural resources study. The records search further indicated that no previously- recorded cultural resources are mapped within the Project site, nor have any archaeological sites been previously-recorded within the 0.5-mile radius. The records search did, however, indicate that four historic-period built environment resources had been previously recorded within the 0.5-mile records search radius (Table 4.5-1). The proposed new fiber optic cable, which would be installed on existing poles at an elevation of approximately 35 feet above the ground, will cross the Tidewater Southern Railway line (CA-STA-425H). The other three previously-recorded historic-period resources are located more than 400 feet from the Project site.
The standard-gauge Tidewater Southern Railway was originally constructed in 1912 and served between Stockton and Modesto. The segment of railroad that traverses below the proposed overhead fiber optic cable line is currently decommissioned. Another segment of the Tidewater Southern Railway to the north of the Project site has been recommended not eligible for listing in the National Register of Historic Places (National Register) (Daly, 2009).

4. Environmental Analysis Cultural and Paleontological Resources
McHenry Solar Farm 4.5-6 May 2011 Draft Environmental Impact Report
TABLE 4.5-1 PREVIOUSLY RECORDED CULTURAL RESOURCES WITHIN
0.5-MILE RADIUS OF THE PROJECT SITE
Identifier/Trinomial # Description Distance from Project and Component
MID Modesto Main Canal
Segment of a historic irrigation canal. Originally constructed in 1903, and concrete lined in 1930. Separate segment recorded elsewhere in the county by Carey & Co in 2007 (P-50-2002)
440 feet southeast from Project site
Bridge #38-13 Bridge crossing the MID Main Canal at SR 108. Continuous reinforced concrete slab on reinforced concrete wall piers. Built by the county in 1915 and widened in 1962 by the state.
1,650 feet east from Project site
Bridge #38C-164 1952 bridge crossing the MID Main Canal at Skittone Road.
530 feet southeast from Project site
CA-STA-425H Tidewater Southern Railway line Railroad crosses below proposed overhead fiber optic cable line
SOURCE: CCIC, 2009
Additional archival research was conducted at the Stanislaus County Assessor/Recorder’s Office, the Stanislaus County Planning Department, the Special Collections Room of the Modesto Branch of the Stanislaus County Library, and the McHenry Museum. The county’s files were reviewed for information on the construction or alteration of the residence at 221 Patterson Road (described more fully in the Historic Architectural Resources Survey discussion). The files, materials, and historic photographs maintained at the library and Museum were reviewed for information on the residence as well.
Geologic maps indicate that the Project site is underlain by the Upper Modesto Formation and that the age and origin of this formation makes it potentially fossil yielding. A search of the University of California Museum of Paleontology collections database indicates that there have been six vertebrate fossil finds within the Modesto Formation (UCMP, 2011). Additionally, correspondence with a local professional paleontologist indicates the formation has recently yielded unique and significant fossils in several locations in the San Joaquin Valley (Dundas, 2010).
4.5.2.2 Native American Contact
The Native American Heritage Commission (NAHC) was contacted on December 15, 2009 to request a search of its Sacred Lands File and to provide a list of Native Americans that should be contacted regarding the Project. The NAHC responded on December 21, 2009 that a search of the sacred lands file did not indicate the presence of Native American cultural resources in the area, but cautioned that the absence of specific site information in the sacred lands file does not indicate the absence of cultural resources in the Project area. The NAHC response also included three contacts who have expressed an interest in this area. A letter was sent to each individual or organization on June 7, 2010. No responses have been received as of this writing (April 2011).

4. Environmental Analysis Cultural and Paleontological Resources
McHenry Solar Farm 4.5-7 May 2011 Draft Environmental Impact Report
Complete copies of contact letters are included in the Cultural Resource Survey Report completed in support of the proposed Project (ESA, 2011).
4.5.2.3 Field Survey
Archaeological Survey An intensive archaeological survey of the Project site was conducted on June 10, 2010. The on-foot surface survey consisted of the 154-acre parcel that includes the proposed solar field, substation, O&M building, on-site improvements, switchyard, and control building. A windshield survey was completed for the proposed overhead fiber optic cable line.
The western half of the Project site was systematically surveyed in 15 to 20 meter-wide transects. The eastern half of the Project site was more cursorily surveyed due to that portion of the site being cultivated with strawberries. Both sections of the Project site had been historically and recently graded for horticultural activities. Soils throughout the Project site were homogenous (light brown, fine-grained sandy alluvium). Visibility was good. There was no evidence of the two former buildings/structures shown in the west/central section of the Project site on the 1953 USGS Riverbank topographic quadrangle. Modern dirt access roads separated the northern and southern halves of the western portion of the Project site as well as the western and eastern portions of the Project site. The access roads were between 2 to 4 feet higher in elevation than the interior fields. No surface evidence of archaeological resources was encountered during the survey.
Historic Architectural Survey A historic architectural survey was conducted of the Project site and immediate vicinity on May 2, 2011. The survey identified one historic-period building located immediately adjacent to the project site at 221 Patterson Road that had not been previously recorded. The building was photographed and documented on Department of Parks and Recreation (DPR) 523 forms as part of the survey effort.
The building located at 221 Patterson Road is a 1926 single family residence. The residence is a 1,278 square-foot, two-story building with a rectangular footprint and a composite shingle, cross gable roof. The building has a raised concrete foundation, and concrete stairs lead up to both the primary and secondary entrances. The exterior walls of the building are covered with vinyl siding, and a brick chimney is located on the eastern façade that has been altered so that it no longer extends past the roof line. Windows are a mix of modern aluminum frame sliding windows and wood frame single hung windows. Additionally, fixed, wood frame windows flank both sides of the chimney.
The original primary entrance is currently an enclosed porch located on the southern façade of the building. A concrete path originally led from Patterson Road to the door; however, the concrete is broken and large trees and shrubs block access to Patterson Road. The enclosed front porch is covered by vinyl siding and bricks, with vinyl frame picture windows and a vinyl shade overhang on the eastern, southern, and western façades. The current primary entrance is located on the

4. Environmental Analysis Cultural and Paleontological Resources
McHenry Solar Farm 4.5-8 May 2011 Draft Environmental Impact Report
northern end of the eastern façade, and a wooden slat overhang shades the door and windows on the eastern and northern exposures.
The residence is surrounded by numerous mature trees, tall hedges, and other landscaping, which shields it from view on all sides. Ancillary buildings include a historic-period barn and two modern barns located north of the residence. The historic period barn is a wood frame single story structure with a side gable metal roof and vertical wooden siding. The barn measures approximately 40 feet in width and 85 feet in length, and two modern additions possessing shed-style roofs are located on the western and northern façades. The western addition is a wood frame structure with vertical wood siding and extends out 10 feet and then continuing along the length of the original barn. The second addition is larger, extending out on the northern façade 25 feet and continuing the length of the original barn. Three large doors, two sliding and one swinging hinge style, are located on the southern exposure.
The two modern barns are wood frame buildings with metal siding and roofs, and each structure possesses an open side with three open bays divided by wooden posts. These barns are used to store tractors and RVs.
Evaluation of 221 Patterson Road
Archival research at the Stanislaus County Assessor Recorder’s office, Stanislaus County Planning Department, Modesto Branch of the Stanislaus Library, and McHenry Museum. County Assessor/Recorder data indicates that the residence was constructed in 1926. County building permits maintained by the Planning Department show that the building was re-roofed in 1997; however, no additional construction permits are on file. The 1953 Riverbank USGS Quadrangle map identifies the house and barn on the property.
1978 Stanislaus County Agricultural Maps indicate that the parcel was part of a larger property owned by the Sbragia family (who still own the property), and Stanislaus County Planning Department indicate that the larger parcel was split into several smaller parcels, although the County did not provide a specific date (Stanislaus County, 1978; p. 21; Stanislaus County Permits Department, Doc No 91-87388). County Directories and burial records maintained at the Special Collections Room of the Modesto Branch of the Stanislaus Library show that the Sbragia family resided in the area north of Modesto as early as 1925; however, changes in street names and address numbers prevent research from determining if the family resided at 221 Patterson Road prior to the 1970s (Polk, 1925; p 215).
While the Sbragia family appears to have owned the property including 221 Patterson Road for decades, no definite association with known historical events or significant persons have been identified (Criteria 1/A and 2/B). As a typical farm house, the residence possesses no distinguishing design or artistic values or architectural significance (Criterion 3/C) nor does it possess important scientific data potential (Criterion 4/D).
Age. According to County Assessor records, the residence dates to 1926 and is 85 years old as of 2011. The residence meets the typical age 45-year age threshold for eligibility for listing in the

4. Environmental Analysis Cultural and Paleontological Resources
McHenry Solar Farm 4.5-9 May 2011 Draft Environmental Impact Report
California Register of Historical Resources (California Register) and the 50-year threshold for eligibility for listing in the National Register.
Integrity. The residence is a simple building that appears to have been altered from its original construction, with the introduction of modern windows, siding, and the enclosure of the front porch and subsequent reorientation of the house impacting the integrity of the materials and workmanship. The house is in its original location, continues to be used as a farm house associated with the surrounding fields, and the rural agricultural setting of the vicinity has remaining predominantly the same as the time of the 1926 construction. As such, the property appears to retain sufficient physical integrity.
While the residence meets the criteria for age and integrity, archival research indicates that the building does not appear to meet any of the aforementioned National Register/California Register Criteria 1/A through 4/D. As such, the building does not appear to qualify as a historic property eligible for listing in the National Register nor does it qualify as a historical resource eligible for listing in the California Register.
Paleontological Survey Due to a lack of any exposed rock outcroppings in the Project site and the usage of the site for agricultural purposes over the past decades, a paleontological survey was not conducted.
4.5.3 Regulatory Setting
4.5.3.1 Federal
National Historic Preservation Act Archaeological resources are protected through the National Historic Preservation Act (NHPA) of 1966, as amended (16 USC 470f), and its implementing regulations. Prior to implementing an “undertaking” (e.g., issuing federal funding), Section 106 of the NHPA requires federal agencies to consider the effects of the undertaking on historic properties and to afford the Advisory Council on Historic Preservation a reasonable opportunity to comment on any undertaking that would adversely affect properties listed or eligible for listing in the National Register of Historic Places (National Register). Pursuant to the NHPA, a find is considered significant if it meets the National Register listing criteria at 36 CFR 60.4, as stated below:
The quality of significance in American history, architecture, archaeology, engineering, and culture is present in districts, sites, buildings, structures, and objects that possess integrity of location, design, setting, materials, workmanship, feeling, and association and
a) That are associated with events that have made a significant contribution to the broad patterns of our history, or
b) That are associated with the lives of persons significant in our past, or

4. Environmental Analysis Cultural and Paleontological Resources
McHenry Solar Farm 4.5-10 May 2011 Draft Environmental Impact Report
c) That embody the distinctive characteristics of a type, period, or method of construction, or that represent the work of a master, or that possess high artistic values, or that represent a significant and distinguishable entity whose components may lack individual distinction, or
d) That have yielded, or may be likely to yield, information important in prehistory or history.
In addition to meeting the criteria of significance, a property must have integrity. Integrity is defined as “the ability of a property to convey its significance” (U.S. Department of the Interior, 2002). The National Register recognizes seven qualities that, in various combinations, define integrity. To retain historic integrity, a property must possess several, and usually most, of these seven aspects. Thus, the retention of the specific aspects of integrity is paramount for a property to convey its significance. The seven factors that define integrity are location, design, setting, materials, workmanship, feeling, and association.
4.5.3.2 State of California
California Environmental Quality Act
Historical and Archeological Resources
CEQA, as codified in Public Resources Code (PRC) Sections 21000 et seq., is the principal statute governing the environmental review of projects in California. CEQA requires lead agencies to determine if a proposed project would have a significant effect on historical resources, including archaeological resources. The CEQA Guidelines define a historical resource as: (1) a resource in the California Register; (2) a resource included in a local register of historical resources, as defined in PRC Section 5020.1(k) or identified as significant in a historical resource survey meeting the requirements of PRC Section 5024.1(g); or (3) any object, building, structure, site, area, place, record, or manuscript that a lead agency determines to be historically significant or significant in the architectural, engineering, scientific, economic, agricultural, educational, social, political, military, or cultural annals of California, provided the lead agency’s determination is supported by substantial evidence in light of the whole record.
If a lead agency determines that an archaeological site is a historical resource, the provisions of PRC Section 21084.1 and CEQA Guidelines Section 15064.5 would apply. If an archaeological site does not meet the CEQA Guidelines criteria for a historical resource, then the site may meet the threshold of PRC Section 21083 regarding unique archaeological resources. A unique archaeological resource is “an archaeological artifact, object, or site about which it can be clearly demonstrated that, without merely adding to the current body of knowledge, there is a high probability that it meets any of the following criteria:
Contains information needed to answer important scientific research questions and that there is a demonstrable public interest in that information.
Has a special and particular quality, such as being the oldest of its type or the best available example of its type.

4. Environmental Analysis Cultural and Paleontological Resources
McHenry Solar Farm 4.5-11 May 2011 Draft Environmental Impact Report
Is directly associated with a scientifically recognized important prehistoric or historic event or person” (PRC Section 21083.2 [g]).
The CEQA Guidelines note that if a resource is neither a unique archaeological resource nor a historical resource, the effects of the project on that resource shall not be considered a significant effect on the environment (CEQA Guidelines Section 15064[c][4]).
Paleontological Resources
Paleontological resources—fossils—are the fossilized evidence of past life found in the geologic record, including vertebrates (animals with backbones), invertebrates (e.g., starfish, clams, ammonites, and marine coral), and fossils of microscopic plants and animals (microfossils). The age and abundance of fossils depend on the location, topographic setting, and particular geologic formation in which they are found. Fossil discoveries not only provide a historical record of past plant and animal life but can assist geologists in dating rock formations. In addition, fossil discoveries can expand our understanding of the time periods and the geographic range of existing and extinct flora or fauna.
Paleontological resources are explicitly afforded protection by CEQA, specifically in Section V(c) of Appendix G, the “Environmental Checklist Form”, which addresses the potential for adverse impacts to “unique paleontological resource[s] or site[s] or … unique geological feature[s]”. This provision covers fossils of signal importance – remains of species or genera new to science, for example, or fossils exhibiting features not previously recognized for a given animal group – as well as localities that yield fossils significant in their abundance, diversity, preservation, and so forth. Further, CEQA provides that generally, a resource shall be considered “historically significant” if it has yielded or may be likely to yield information important in prehistory (PRC §15064.5 [a][3][D]). Paleontological resources would fall within this category. The PRC, Chapter 1.7, sections 5097.5 and 30244 also regulates removal of paleontological resources from state lands, defines unauthorized removal of fossil resources as a misdemeanor, and requires mitigation of disturbed sites.
Paleontological Assessment Standards
The Society of Vertebrate Paleontology (SVP) has established guidelines for the identification, assessment, and mitigation of adverse impacts on nonrenewable paleontological resources (SVP, 1995; 1996). Practicing paleontologists in the nation adhere to the SVP’s assessment, mitigation, and monitoring requirements as outlined in these guidelines, which were approved through a consensus of professional paleontologists. The SVP has helped define the value of paleontological resources and in particular, states the following:
Vertebrate fossils and fossiliferous deposits are considered significant nonrenewable paleontological resources, and are afforded protection by federal, state, and local environmental laws and guidelines.
A paleontological resource is considered to be older than recorded history or 5,000 years before present and should not be confused with archaeological resource sites.

4. Environmental Analysis Cultural and Paleontological Resources
McHenry Solar Farm 4.5-12 May 2011 Draft Environmental Impact Report
Invertebrate fossils are not significant paleontological resources, unless they are present with an assemblage of vertebrate fossils or they provide undiscovered information on the origin and character of the plant species, past climatic conditions or the age of the rock unit itself.
Certain plant or invertebrate fossils may be designated as significant by a project paleontologist, special interest group, lead agency or local government.
With these principles, the SVP (1995) has outlined criteria for screening the paleontological potential1 of rock units and established assessment and mitigation procedures tailored to such potential. Table 4.5-2 lists the criteria for high-potential, undetermined, and low-potential rock units.
TABLE 4.5-2 PALEONTOLOGICAL POTENTIAL CRITERIA
Paleontological Potential
Description
High Geologic units from which vertebrate or significant invertebrate or plant fossils have been recovered in the past, or rock formations that would be lithologically and temporally suitable for the preservation of fossils. Only invertebrate fossils that provide new information on existing flora or fauna or on the age of a rock unit would be considered significant.
Undetermined Geologic units for which little to no information is available.
Low Geologic units that are not known to have produced a substantial body of significant paleontological material, as demonstrated by paleontological literature and prior field surveys, and which are poorly represented in institutional collections.
SOURCE: SVP, 1995.
It is important to note that while paleontological potential as defined above can provide a rough idea of whether subsurface fossils may exist, it prescribes a very low threshold for identifying a rock unit as high potential. It would include most sedimentary rock units older than recent, and any other rock type (i.e., igneous or metamorphic) that have yielded a vertebrate or significant invertebrate or plant fossils anywhere within their geographic extents. This low threshold is reasonable; however, because as largely buried resources, the uniqueness or significance of a fossil locality is unknown until it is identified to a reasonably precise level (Scott and Springer, 2003; p. 5). As such, any fossil discovery should be treated as potentially unique or significant until determined otherwise by a professional paleontologist.
4.5.3.3 California Register of Historical Resources
The California Register of Historical Resources (California Register) is “an authoritative listing and guide to be used by state and local agencies, private groups, and citizens in identifying the existing historical resources of the state and to indicate which resources deserve to be protected, to the extent prudent and feasible, from substantial adverse change” (PRC Section 5024.1[a]). The criteria for
1 Paleontological potential refers to the likelihood that a rock unit will yield a unique or significant paleontological
resource.

4. Environmental Analysis Cultural and Paleontological Resources
McHenry Solar Farm 4.5-13 May 2011 Draft Environmental Impact Report
eligibility to the California Register are based on National Register of Historic Places criteria (PRC Section 5024.1[b]). Certain resources are determined by the statute to be automatically included in the California Register, including California properties formally determined eligible for or listed in the National Register.
To be eligible for the California Register a historical resource must be significant at the local, state, and/or federal level under one or more of the following criteria:
1) Is associated with events that have made a significant contribution to the broad patterns of California’s history and cultural heritage;
2) Is associated with the lives of persons important in our past;
3) Embodies the distinctive characteristics of a type, period, region, or method of construction, or represents the work of an important creative individual, or possesses high artistic values; or,
4) Has yielded, or may be likely to yield, information important in prehistory or history (PRC Section 5024.1[c]).
For a resource to be eligible for the California Register, it must also retain enough integrity to be recognizable as a historical resource and to convey its significance. A resource that does not retain sufficient integrity to meet the National Register criteria may still be eligible for listing in the California Register.
4.5.3.4 Stanislaus County
General Plan The Stanislaus County General Plan contains goals, policies, and implementation measures that could be applicable to the proposed Project. In the Conservation and Open Space Element of the Stanislaus General Plan, Goal 8, “Preserve areas of national, state, regional and local historical importance,” states the following guiding policies: “The County will support the preservation of Stanislaus County’s cultural legacy of historical and archaeological resources for future generations” and “‘Qualified Historical Buildings’ as defined by the State Building Code shall be preserved” (Stanislaus County, 2008). There are no goals or policies that address paleontological resources in the General Plan.
4.5.4 Significance Criteria Based on CEQA Guidelines Section 15064.5 and Appendix G, a project would cause a significant impact on cultural resources or paleontological resources if it would:
a) Cause a substantial adverse change in the significance of a historical resource as defined in §15064.5;
b) Cause a substantial adverse change in the significance of a unique archaeological resource pursuant to §15064.5;
4. Environmental Analysis Cultural and Paleontological Resources
McHenry Solar Farm 4.5-14 May 2011 Draft Environmental Impact Report
c) Directly or indirectly destroy a unique paleontological resource or site or unique geologic feature; or
d) Disturb any human remains, including those interred outside of formal cemeteries.
4.5.5 Discussion of Criteria with No Cultural Resources Impacts
Analysis of the setting and Project characteristics relative to the significance criteria show that the proposed Project would have no impact on Cultural Resources with respect to criterion a). The reasoning supporting this conclusion is as follows:
a) The proposed Project would not cause a substantial adverse change in the significance of a historical resource as defined in §15064.5.
One previously-recorded historic-period built environment resource, the Tidewater Southern Railway Line (CA-STA-425H) intersects a portion of the Project where fiber optic cable would be placed on existing poles at an elevation of approximately 35 feet above the ground. Because this Project component is limited to the installation of cable above the resource and would be suspended from existing poles, no Project-related direct or indirect impacts to the resource would be anticipated.
One historic-period resource, identified as a residence and barn located at 221 Patterson Road (constructed circa. 1926), is located immediately adjacent to the Project site. Although the resource will not be directly impacted by the Project, its close proximity to the Project site could reasonably subject it to indirect Project impacts. For this reason the resource was evaluated for eligibility to the National Register and the California Register. The resource was determined not eligible. For these reasons, no Project-related impacts, direct or indirect, are anticipated to historical resources as defined in §15064.5.
4.5.6 Impacts and Mitigation Measures
b) Cause a substantial adverse change in the significance of a unique archaeological resource pursuant to §15064.5.
Impact 4.5-1: The proposed Project could potentially cause an adverse change in the significance of a unique archaeological resource pursuant to §15064.5. (Less than significant with mitigation)
No surface evidence of archaeological resources was encountered at the Project site during the archaeological survey. No evidence of the two buildings that appeared on the 1953 topographic quadrangle was encountered. Because of its age and origin, the geologic formation underlying the Project site, the Upper Modesto Formation, is considered to have a low sensitivity for containing archaeological resources. The Upper Modesto Formation, however, is overlain by Holocene-age alluvium, of unknown depth, deposited contemporaneously with human occupation of this area and therefore does possess potential to contain archaeological resources. Due to years of agricultural

4. Environmental Analysis Cultural and Paleontological Resources
McHenry Solar Farm 4.5-15 May 2011 Draft Environmental Impact Report
activity within the Project site, it is anticipated that up to at least 2 feet of soil below the ground surface has likely been subject to severe disturbance due to plowing and discing. The likelihood of encountering intact resources within the upper 2 feet is therefore highly unlikely.
Because of the shallow nature of the majority of the Project components and with the majority of the work occurring within what are likely disturbed soils, the potential to encounter archaeological resources, although possible, is fairly low. Excavation associated with deeper Project components, such as for the installation of the solar panels (driving 5-inch-wide posts to 14 feet deep) and for the installation of up to nine 30-inch diameter new poles for the sub-transmission and distribution line (8 to 9 feet deep), are limited in their area of anticipated disturbance. Installation of the fiber optic line would not involve any ground disturbance. Considering these factors, while it does not appear likely, the possibility of accidentally discovering archaeological resources during construction of the various components, operation, and/or decommissioning at the Project site cannot be entirely discounted. If an unanticipated archaeological discovery occurs, the implementation of the following mitigation measure would reduce impacts to a less-than-significant level. This measure is consistent with MID’s 2006 PEIR Update (2006 PEIR Update; p. 15-10).
Mitigation Measure 4.5-1: If Cultural Resources are Discovered During Ground-Disturbing Activities, Suspend Work until Resource is Evaluated. Prior to the initiation of site preparation or start of construction (and, subsequently, decommissioning), the Applicant shall retain a qualified professional archaeologist to complete an archaeological resources training program for construction workers involved in grading and excavation activities. Training shall include awareness and recognition of archaeological materials and the procedures to follow if construction crews encounter such materials in the course of earthwork, excavation, or grading. If archaeological resources are encountered, all activity within 50 feet of the find shall cease until it can be evaluated by a qualified archaeologist. Prehistoric archaeological materials could include obsidian and chert flaked-stone tools (e.g., projectile points, knives, scrapers) or toolmaking debris; culturally darkened soil (“midden”) containing heat-affected rocks, artifacts, or shellfish remains; and stone milling equipment (e.g., mortars, pestles, handstones, or milling slabs); and battered stone tools, such as hammerstones and pitted stones. Historic-period materials could include stone, concrete, or adobe footings and walls; filled wells or privies; and deposits of metal, glass, and/or ceramic refuse. The archaeologist shall notify the Applicant and MID if the resource may be significant. An appropriate treatment plan for the resources shall then be developed by the Applicant for approval by MID. The archaeologist shall consult with Native American representatives in determining appropriate treatment for prehistoric or Native American cultural resources, if discovered.
In considering any suggested mitigation proposed by the archaeologist, the Applicant and MID shall determine whether avoidance is feasible in light of factors such as the nature of the find, project design, costs, and other considerations. If avoidance is not feasible, other appropriate measures (e.g., data recovery) shall be instituted. Work may proceed in other parts of the Project site while mitigation for cultural resources in other areas of the site is being carried out.
Significance after Mitigation: Less than Significant.

4. Environmental Analysis Cultural and Paleontological Resources
McHenry Solar Farm 4.5-16 May 2011 Draft Environmental Impact Report
c) Directly or indirectly destroy a unique paleontological resource or site or unique geologic feature.
Impact 4.5-2: The proposed Project could potentially destroy a unique paleontological resource or site or unique geologic feature. (Less than significant with mitigation)
Installation of the fiber optic line would not involve any ground disturbance, so potential impacts to paleontological resources would not occur from that activity. The Project site is underlain by the Upper Modesto Formation, a unit of high paleontological potential. This formation is overlain by Holocene-age alluvium that largely lacks potential for paleontological resources. Due to a combination of the majority of the Project components involving shallow (less than 3 feet deep) ground disturbance and the fact that shallow soils within the Project site have been disturbed by agricultural activities, the overall potential to encounter fossils, particularly those considered unique or significant, is low.
While it does not appear likely, the possibility of accidentally discovering paleontological resources during construction of the various components, operation, and/or decommissioning at the Project site cannot be entirely discounted. If an unanticipated paleontological discovery occurs during Project construction, the implementation of the following mitigation measure would reduce impacts to a less-than-significant level.
Mitigation Measure 4.5-2: If Paleontological Resources are Discovered During Ground-Disturbing Activities, Suspend Work until Resource is Evaluated. Prior to the initiation of site preparation or start of construction (and, subsequently, decommissioning), the Applicant shall retain a qualified professional paleontologist or a California Registered Professional Geologist (California RPG) with appropriate paleontological expertise, as defined by the Society of Vertebrate Paleontology’s Conformable Impact Mitigation Guidelines Committee (SVP 1995 Guidelines), to carry out a paleontological resources training program for construction workers involved in grading and excavation activities. Training shall include awareness and recognition of potential fossil materials and the procedures to follow if construction crews encounter fossil materials in the course of earthwork, excavation, or grading. If construction crews discover potential fossils, all earthwork or other types of ground disturbance within 50 feet of the find shall stop immediately until the qualified professional paleontologist can assess the nature and importance of the find. Based on the scientific value or uniqueness of the find, the monitor may record the find and allow work to continue, or recommend salvage and recovery of the fossil. The Applicant shall require the paleontologist to be “on-call” throughout the duration of ground-disturbing activities.
Significance after Mitigation: Less than Significant.

4. Environmental Analysis Cultural and Paleontological Resources
McHenry Solar Farm 4.5-17 May 2011 Draft Environmental Impact Report
d) Disturb any human remains, including those interred outside of formal cemeteries.
Impact 4.5-3: The proposed Project could potentially disturb human remains, including those interred outside of formal cemeteries. (Less than significant with mitigation)
Installation of the fiber optic line would not involve any ground disturbance, so potential impacts to human remains would not occur from that activity. Based on information gathered from the archival research and field survey, there is no evidence that the Project site has ever been used for the burial of human remains. However, this possibility cannot be entirely discounted. Project personnel should be alerted to the possibility of encountering human remains during construction, and apprised of the proper procedures to follow if they are found. The following mitigation measure would reduce impacts to a less-than-significant level. This measure is consistent with MID’s 2006 PEIR Update (2006 PEIR Update; p. 15-10).
Mitigation Measure 4.5-3: Halt Work if Human Remains are Identified During Construction. If human remains are uncovered during Project construction (and, subsequently, decommissioning), work shall immediately halt within 100 feet of the find. The Applicant shall contact the Stanislaus County Coroner to evaluate the remains and shall follow the procedures and protocols set forth in §15064.5(e)(1) of the CEQA Guidelines. If the County Coroner determines that the remains are Native American, the Applicant shall contact the Native American Heritage Commission, in accordance with Health and Safety Code Section 7050.5, subdivision (c), and Public Resources Code 5097.98 (as amended by AB 2641). The Native American Heritage Commission will then designate a Most Likely Descendent, who will provide recommendations as to the future disposition of the remains.
Significance after Mitigation: Less than Significant.
4.5.7 Alternatives
4.5.7.1 Reduced Project
Because the Reduced Project Alternative would occur on the same site as the Project, but would disturb approximately 10 percent less area, the Reduced Project Alternative would result in impacts to archaeological, paleontological resources, and human remains that are similar to the proposed Project during construction and decommissioning (i.e., there is the possibility for accidental discovery of archaeological, paleontological resources, and human remains during earth moving activities). The destruction or disturbance of these resources would result in a significant impact; however, implementation of Mitigation Measures 4.5-1, 4.5-2, and 4.5-3 would result in a less-than-significant impact for this alternative.
4.5.7.2 Non-Agriculture Site
Development of this site as a solar farm would require the completion of a new cultural resources study and survey, including an archival review of records kept at the Central California Information Center at Stanislaus State University, a field survey, NAHC contact program, and

4. Environmental Analysis Cultural and Paleontological Resources
McHenry Solar Farm 4.5-18 May 2011 Draft Environmental Impact Report
analysis and mitigation of potential impacts to cultural resources. Development at this site would require the demolition and removal of existing buildings and structures, including subsurface utilities expected to be at depths greater than 3 feet. The 1.25-mile sub-transmission line would require removal of approximately 33 wood poles and replacement with a similar number of taller wood poles, which would involve ground disturbance along that 1.25-mile alignment. As a result of this deeper and more extensive ground disturbance compared with the proposed Project site, the Non-Agriculture Site Alternative would have a greater potential for encountering known or unknown archaeological sites, historic-period architectural resources, paleontological resources, and/or human remains within the site and the sub-transmission line route. For this reason, additional cultural resources impact mitigation would be required to reduce impacts to less than significant.
4.5.7.3 No Project
The No Project alternative would result in the continuation of agricultural activities at the Project site. Any impacts to cultural or paleontological resources that may be occurring now at the Project site (if they are) would be expected to continue.
References – Cultural and Paleontological Resources Corbett & Minor, 1996. State Route 120 Project, City of Escalon, San Joaquin County. California
Department of Transportation District 10. 10-SJO-120, K.P. 26.63-27.89. Historic Architectural Survey Report. For Basin Research Associates, Inc and EIP Associates, Inc. On file at Central California Information, California State University Stanislaus, Turlock, California.
Daly, Pamela. 2009. Tidewater Southern Railway (P-50-0083) Site Record. On file at the Central California Information Center, California State University Stanislaus.
Dundas, Robert, Ph.D., Asst. Professor of Vertebrate Paleontology, Department of Earth & Environmental Sciences, California State University, Fresno, email communication, March 16, 2010.
ESA, 2011. SunPower Solar PV Modesto Project, Riverbank, Stanislaus County, California. Cultural Resources Survey Report. Prepared for SunPower Solar. May 2011.
Gudde, Erwin G. 1998. California Place Names: The Origin and Etymology of Current Geographical Names. Berkeley: University of California Press.
Hoover, Mildred Brooke, Hero Eugene Rensch, Ethel Grace Rensch, William N. Abeloe, 1990. Historic. Spots in California. Revised by Douglas E. Kyle. Stanford University Press: Stanford, CA.
Moratto, M. 1984. California archaeology. Academic Press, Orlando, CA.

4. Environmental Analysis Cultural and Paleontological Resources
McHenry Solar Farm 4.5-19 May 2011 Draft Environmental Impact Report
Polk, RL, & co., pub., 1925. Stanislaus County Directory. On file at Modesto Branch of Stanislaus County Library.
Scott, Eric and Springer, Kathleen, CEQA and Fossil Preservation in California, Association of Environmental Professionals, Environmental Monitor, Quarterly Publication, Fall 2003.
Shipley, William F. “Native Languages of California” Handbook of North American Indians California Robert F. Heizer, Ed. Washington D.C.: Smithsonian Institution, 1978.
Stanislaus County, 1978. Agri-Land Property Ownership Maps: Plat Book and Guide. On file at Modesto Branch of Stanislaus County Library.
Stanislaus County, 2008. 1994 Stanislaus County General Plan, rev. December 2008.
Stanislaus County Planning Department, nd. Doc No 91-87388. On file at Stanislaus County Planning Department
U.S. Department of Interior, 2002. “How to Apply National Register Criteria for Evaluation,” National Register Bulletin. By staff of the National Register of Historic Places, finalized by Patrick Andrus, edited by Rebecca Shrimpton. U.S. Department of the Interior, National Park Service, 1990. Revised 1991, 1995, 1997, 2002.
University of California Museum of Paleontology (UCMP), Collections Database - Paleontological Locality Search for Vertebrate Fossils in the Modesto Formation, Accessed, 1/10/2011.
U.S. Geological Survey (USGS), 2004, Hydrogeologic Characterization of the Modesto Area, San Joaquin Valley, California, by Karen R. Burow, Jennifer L. Shelton, Joseph A. Hevesi, and Gary S. Weissmann, Scientific Investigations Report 2004-5232, 2004.
Wallace, William J. 1978. “Southern Valley Yokuts”. In California, edited by Robert F. Heizer, pp. 448-469. Handbook of North American Indians, William C. Sturtevant, general editor, vol. 8. Smithsonian Institution, Washington, D.C.
Weissmann et al., Factors controlling sequence development on Quaternary fluvial fans, San Joaquin Basin, California, USA, Department of Geological Sciences, Michigan State University, 2005.

4. Environmental Analysis
McHenry Solar Farm 4.6-1 May 2011 Draft Environmental Impact Report
4.6 Energy Conservation
This section identifies and evaluates issues related to Energy Conservation in the context of the Project and alternatives. Discussed are the physical and regulatory setting; the baseline for determining environmental impacts; the criteria used for determining the significance of environmental impacts; potential impacts associated with construction, operation and maintenance, and decommissioning of the Project; and mitigation measures to reduce or avoid environmental impacts determined to be potentially significant.
4.6.1 Setting
4.6.1.1 Regional and Local Setting
Section 2.2, Project Location and Existing Land Use, provides general information about the regional and local setting. This section 4.6.1 provides setting information specific to energy conservation.
California’s energy system includes electricity, natural gas, and crude oil. California provides 73.2 percent of the electricity used within the state as well as 12.9 percent of the natural gas and 38.12 percent of the petroleum. The rest of the state’s energy is imported. Natural gas comes from the Southwest (40.8 percent), the Rocky Mountain states (24.2 percent) and Canada (22.1 percent). Crude oil is imported into the state from foreign sources (48.6 percent) and Alaska (13.41 percent) (CEC, 2010b). Electricity imported into California comes from the Pacific Northwest (8.4 percent) and the Southwestern states (18.4 percent) (CEC, 2010b).
The production of electricity requires the consumption or conversion of energy resources, including water, wind, oil, gas, coal, solar, geothermal, and nuclear sources. Of the electricity produced in California in 2009, more than half was from natural gas (56.7 percent), with nuclear (15.3 percent) and renewable sources (13.9 percent) providing the next largest contributions to electric power. The electricity generated is distributed via a network of transmission and distribution lines commonly called the power grid. Solar energy provided approximately 846 gigawatt hours of electric power in 2009 (about 0.4 percent of the total power generated in the state) (CEC, 2010a).
The proposed site is located in northern unincorporated Stanislaus County between the City of Riverbank and community of Del Rio, along Patterson Road near the intersection with McHenry Avenue. An existing 69-kV sub-transmission line is aligned along on the west side of McHenry Avenue in the vicinity of the Project site. This sub-transmission line crosses to the east side of McHenry Avenue at the northwest corner of the site.
4. Environmental Analysis Energy Conservation
McHenry Solar Farm 4.6-2 May 2011 Draft Environmental Impact Report
4.6.1.2 Regulatory Setting
Federal Regulations
Energy Policy and Conservation Act
The Energy Policy Act of 1975 was established in response to the oil crisis of 1973, which increased oil prices due to a shortage of reserves. The Act required that all vehicles sold in the U.S. meet certain fuel economy goals. Since 1990, the fuel economy standard for new passenger cars has been 27.5 miles per gallon. Since 1996, the fuel economy standard for new light trucks (gross vehicle weight of 8,500 pounds or less) has been 20.7 miles per gallon. Heavy-duty vehicles (i.e., vehicles and trucks over 8,500 pounds gross vehicle weight) are not subject to fuel economy standards (Bamberger, 2002 and Joskow, 2003).
Energy Policy Act of 2005
The Energy Policy Act of 2005 seeks to reduce reliance on non-renewable energy resources and provide incentives to reduce current demand on these resources. For example, pursuant to the Act, consumers and businesses can attain federal tax credits for purchasing fuel-efficient appliances and products, buying hybrid vehicles, building energy-efficient buildings, and improving the energy efficiency of commercial buildings. Additionally, tax credits are available for the installation of qualified fuel cells, stationary microturbine power plants, and solar power equipment.
State of California
State of California Integrated Energy Policy
In 2002, the Legislature passed Senate Bill 1389 which required the California Energy Commission (CEC) to biannually develop an integrated energy plan for electricity, natural gas, and transportation fuels, for the California Energy Report. The Plan calls for the state to assist in the transformation of the transportation system to improve air quality, reduce congestion, and increase the efficient use of fuel supplies with the least environmental and energy costs. To further this policy, the plan identifies several strategies, including assistance to public agencies and fleet operators in implementing incentive programs for Zero Emission Vehicles and their infrastructure needs, and encouragement of urban designs that reduce vehicle miles traveled and accommodate pedestrian and bicycle access.
The 2009 Integrated Energy Policy Report was adopted by the CEC on December 16, 2009. This update focuses on anticipated operational and physical changes to California’s electric system through 2020, how the state’s energy efficiency goals interact with electrical and natural gas demand forecasting methods, recommended changes to electricity procurement, vulnerability of the state’s nuclear plants to major seismic events, and other energy issues.
SB 1078 – California Renewables Portfolio Standard Program
This bill requires retail sellers of electricity to increase procurement of electricity from renewable energy sources by at least 1 percent of retail sales per year until their portfolio of renewable energy increases to 20 percent. The deadline for reaching the threshold is 2017. Municipal utilities are required to implement and enforce their own such program.

4. Environmental Analysis Energy Conservation
McHenry Solar Farm 4.6-3 May 2011 Draft Environmental Impact Report
Executive Order #S-14-08
On November 17, 2008, Governor Arnold Schwarzenegger signed Executive Order No. S-14-08, which raised California’s renewable energy goals to 33 percent by 2020 and improved the processes for licensing renewable projects. The Executive Order is intended to advance California’s transition into a clean energy economy and directs state agencies to create comprehensive plans to prioritize regional renewable projects based on an area’s renewable resource potential and the level of protection for plant and animal habitat. To implement and track the progress of the Executive Order, the CEC and CDFG signed a Memorandum of Understanding formalizing a Renewable Energy Action Team. The 33 percent goal was enacted into law by Governor Brown on April 12, 2011 with his signing of Senate Bill 1X-2.
California’s Diesel Risk Reduction Plan / Diesel Fuel Regulations
As part of California’s Diesel Risk Reduction Plan, CARB passed numerous regulations to reduce diesel emissions from vehicles and equipment that are already in use. Combining these retrofit regulations with new engine standards for diesel fueled vehicles and equipment, CARB intends to reduce diesel particulate matter (PM) emissions by 85 percent from year 2000 levels by 2020.
California Diesel Fuel Regulations, promulgated in Title 13, California Code of Regulations, Sections 2281-2285 and Title 17, California Code of Regulations, Section 93114, provide standards for motor vehicle fuels and diesel fuel.
Title 24 Building Energy Efficiency Standards
Title 24, Part 6, of the California Code of Regulations is the California Building Code governing all aspects of building construction. Included in Part 6 of the Code are standards mandating energy efficiency measures in new construction. Since its establishment in 1977, the building efficiency standards (along with standards for energy efficiency in appliances) have contributed to a reduction in electricity and natural gas usage and costs in California. The standards are updated every three years to incorporate new energy efficiency technologies. The latest update to the Title 24 standards became effective on August 1, 2009, and reflect the California Building Standards Commission approved 2008 Building Energy Efficiency Standards. The standards regulate energy consumed in buildings for heating, cooling, ventilation, water heating, and lighting. Title 24 is implemented through the local planning and permit process.
Stanislaus County The Conservation/Open Space Element and the Housing Element of the Stanislaus County General Plan contain local policies relevant to energy conservation. For example, Conservation/Open Space Element Goal 11 (p. 3-23) encourages the conservation of resources through promotion of alternative energy sources. In turn, Implementation Measure 3 of Conservation/Open Space Element Policy 21 (p. 3-15) encourages the use of low-emission equipment for new commercial construction. Similarly, Housing Element Program 1-10 (p. A3-146) encourages building and design standards that conserve energy and use alternative energy sources.

4. Environmental Analysis Energy Conservation
McHenry Solar Farm 4.6-4 May 2011 Draft Environmental Impact Report
The Housing Element of the General Plan describes multiple opportunities for active and passive energy conservation (p. 6-21 et seq.). Although most of the opportunities (predictably) relate to residential uses and so would not be applicable to the Project, the county explains in the Housing Element that focusing growth where services are available maximizes the conservation of energy resources (p. 6-22). As stated on page 6-23, “Stanislaus County realizes the importance for continued programs in the planning, creation, and implementation of new policies to meet new innovations in energy-saving technology and to promote environmental sustainability. The County will continue to. . . promote energy conservation programs offered by utility companies. . . .”
Stanislaus County Code provisions also relate to energy conservation and promotion of renewable energy sources. For example, Section 16.65.010 of the County Code adopts and incorporates by reference the California Energy Code (i.e., Title 24 Building Energy Efficiency Standards, summarized above), and Section 21.100.050 would allow wind-generated power in the A-2 Zoning District with staff approval.
4.6.1.3 Baseline
The environmental setting described above constitutes the baseline for determining the significance of potential impacts on energy conservation. It consists of the actual pre-Project physical environmental conditions, which is the operation of the existing on-site agricultural fields, including the periodic use of a few vehicles and machinery associated with maintenance and picking activities, and the use of the on-site electric pumps to access approximately 49 acre-feet (approximately 16 million gallons) of water per year to irrigate the existing strawberry fields. Water and energy use factors obtained from the CEC (CEC, 2005) indicate that approximately four megawatt hours (MWh) per year of electricity are required to irrigate the existing on-site agricultural fields. All energy that would be consumed and generated by the Project is compared to this baseline.
4.6.2 Significance Criteria Appendix F of the CEQA Guidelines provides guidance for assessing energy impacts of projects. The appendix provides three goals:
Decreasing overall per capita energy consumption Decreasing reliance on natural gas and oil Increasing reliance on renewable energy sources
Consistent with Appendix F, environmental impacts evaluated in this analysis include:
a) The Project’s energy requirements by amount and fuel type for each stage of the Project including construction, operation and maintenance, and decommissioning;
b) The effects of the Project on local and regional energy supplies and on requirements for additional capacity;

4. Environmental Analysis Energy Conservation
McHenry Solar Farm 4.6-5 May 2011 Draft Environmental Impact Report
c) The effects of the Project on peak and base period demands for electricity and other forms of energy;
d) The degree to which the Project complies with existing energy standards;
e) The effects of the Project on energy resources; and
f) The Project’s projected transportation energy use requirements and its overall use of efficient transportation alternatives.
4.6.3 Discussion of Criteria with No Energy Conservation Impacts
Analysis of the setting and Project characteristics relative to the significance criteria show that the proposed Project would have no impact on Energy Conservation with respect to criteria b), c), d) or e). The reasoning supporting this conclusion follows.
b) The Project would not cause an adverse effect on local and regional energy supplies or requirements for additional capacity.
The Project would be located within MID’s service territory and its operation would transmit energy from the site to the regional power grid. By replacing an agricultural field with PV panels, the Project would contribute approximately 25 MW of power to the grid. In addition, when the sun shines and electricity is generated by a solar farm, the real-time output typically required from fossil fuel peaking plants would be reduced by the amount of renewable generation going into the electrical grid to maintain the balance between the supply and demand for electricity. Consequently, the Project would have a beneficial effect on local and regional energy supplies, and would not require additional capacity. No adverse impact on local or regional energy supplies or capacity would result from operation and maintenance of the Project. Construction and decommissioning of the Project are addressed under criterion a).
c) The Project would not have an adverse effect on peak and base period demands for electricity and other forms of energy.
Project operation would generate and provide electrical energy to the grid whenever the sun shines, regardless of whether it is a peak or off-peak period. Whenever solar energy is being generated, the Project would be reducing the real-time output required from fossil fuel plants (particularly peaking plants) and other sources of energy, regardless of the level of demand. When the solar panels are not generating electricity (e.g., at night and on cloudy or foggy days), there would be very little net electrical demand from the power grid to serve the O&M Building, provide exterior security lighting, and other on-site uses.1 This maintenance load would occur “off-peak” and would not be a substantial draw on the existing electrical supply. Operation and maintenance of the project would not require the use of other utility-based forms of energy, such as natural gas, etc. Consequently, operation and maintenance of the Project would not cause an adverse impact on demands for electricity or other forms of energy, but would, in fact, be 1 The Applicant estimates that the total electrical usage of the solar farm (called the parasitic load) would be
approximately 0.2 percent of the Project’s annual energy output.

4. Environmental Analysis Energy Conservation
McHenry Solar Farm 4.6-6 May 2011 Draft Environmental Impact Report
contributing to the creation of electrical energy. Construction and decommissioning of the Project are addressed under criterion a).
d) The Project would more than comply with existing energy standards; it would directly support and further efforts toward achieving existing energy standards.
Project operation would consist of a proven and available solar PV technology that qualifies as an Eligible Renewable Energy Resource pursuant to Public Utilities Code Section 399.12, Public Resources Code Section 25741, and CEC’s “Renewable Portfolio Standard: Eligibility Guidebook” (CEC, 2011, p.14). Electricity from the Project would be fed into the California energy grid for the duration of the MID contract pursuant to a power purchase agreement with MID for purchase of the power from the Project (25 years). Consequently, the Project would contribute toward meeting the California Renewable Portfolio Standard and the goals of legislation aimed at reducing greenhouse gas (GHG) emissions, and would help displace energy from fossil fuel (high carbon) sources, especially during peak energy demand periods. Further, the proposed location of a renewable energy generation source in proximity to MID’s customer base would be consistent with the goals and policies of the Housing Element of the Stanislaus County General Plan. Thus, the Project would comply with, directly support, and further efforts toward achieving existing energy standards. No adverse impact on efforts to achieve existing energy standards would result from operation and maintenance of the Project. Construction and decommissioning of the Project are addressed under criterion a).
e) The Project would not have an adverse effect on energy resources.
When the Project is operating, it would generate electricity from the sun, and thus, it would not have an adverse effect on energy resources, but would be beneficial providing a source of renewable energy. Construction and decommissioning of the Project are addressed under criterion a).
4.6.4 Impacts and Mitigation Measures
a) Evaluate the Project’s energy requirements by amount and fuel type for each stage of the Project including construction, operation and maintenance, and decommissioning
Impact 4.6-1: The construction, operation and maintenance, and decommissioning of the Project could result in consumption of energy. (Less than significant)
Energy would be consumed during the construction period, which includes site preparation, solar array construction, sub-transmission and distribution line installation, fiber optic cable installation, and construction of the substation, switchyard, and O&M building, and during the decommissioning period. Construction and decommissioning energy expenditures would include both direct and indirect uses of energy in the form of fuel (typically diesel fuel and gasoline) and electricity. Indirect energy use typically represents about three-quarters of total construction energy, and direct energy represents about one-quarter of total construction energy (Hannon et al., 1978). Direct energy use would include the consumption of petroleum for operation of construction vehicles and the use of electricity for construction equipment, such as welding

4. Environmental Analysis Energy Conservation
McHenry Solar Farm 4.6-7 May 2011 Draft Environmental Impact Report
machines and power tools. Energy consumed by construction and decommissioning power equipment would be relatively minimal, as would construction and decommissioning energy required for lighting and operation of ancillary electrical equipment. Indirect energy use would include the extraction of raw materials, manufacturing, and transportation and manufacturing of the materials used in construction of the Project.
The precise amount of energy that would be required to construct and decommission the Project is uncertain. Even so, the energy consumption for Project construction and decommissioning would not result in the long-term depletion of non-renewable energy resources and would not permanently increase reliance on energy resources that are not renewable. Instead, construction and decommissioning activities would be short-term, lasting approximately 10 months and 3 months, respectively. Construction and decommissioning activities would not be expected to reduce or interrupt existing electrical or natural gas services due to insufficient supply. Because construction and decommissioning would not interrupt existing local MID service, and because Project-specific construction- and decommissioning-related energy demands would not be expected to have a significant adverse effect on local or regional energy resources, energy consumption by construction and decommissioning activities would be less than significant.
According to the Applicant, the Project would generate approximately 60,076 MWh per year in its first year of operation. The Applicant also estimates that the total electrical usage of the facility (parasitic load)2 would be approximately 120 MWh per year, or approximately 0.2 percent of the Project’s annual output. The Applicant expects to draw electricity for this parasitic load directly from the MID grid. Compared to the electricity that would be generated by operation of the Project, the parasitic load would be negligible. When compared to baseline conditions, the Project would result in a substantial net increase in electricity to the MID grid. In addition, the fuel usage required for Project operations associated with the two commuting workers and periodic visits by inspection and maintenance vehicles on-site would be negligible. Impacts from operation and maintenance of the Project on the consumption of energy would therefore be less than significant.
Mitigation: None required.
Impact 4.6-2: Construction, operation and maintenance, and decommissioning of the Project would require use of transportation energy. (Less than significant)
Project construction, operation and maintenance, and decommissioning would consume energy (primarily though fuel usage) during transportation of labor and materials to and from the Project site and the fiber optic cable route. This transportation-related energy usage would be the greatest during construction and decommissioning activities, which are expected to last approximately 10 months and 3 months, respectively. During Project operation and maintenance, transportation-related energy usage may be slightly elevated compared to baseline conditions; however, given the minor amount of transportation-related energy usage that would be associated with the
2 Parasitic load is the electrical energy required to power the drive units, tracker controller, security lighting, data
acquisition system, substation equipment, and the O&M building.

4. Environmental Analysis Energy Conservation
McHenry Solar Farm 4.6-8 May 2011 Draft Environmental Impact Report
Project, the increase would be considered negligible. For the reasons discussed above, construction, operation, and maintenance, and decommissioning-related transportation energy use would be less than significant.
Mitigation: None required.
f) Evaluate the Project’s projected transportation energy use requirements and its overall use of efficient transportation alternatives.
Impact 4.6-3: The Project’s overall use of efficient transportation alternatives would be limited. (Less than significant)
The Project is in a rural area that is not supported by alternative means of transportation, such as public transit. The closest bus stop to the Project site is located at McHenry Avenue and Kiernan Avenue, approximately 1.5 miles south of the site. Transportation alternatives for Project workers during operation of the Project are not a concern; however, because of the Project’s location and the specific needs during construction and decommissioning to transport labor, materials, and large pieces of equipment to and from the site and the fiber optic cable route in a timely manner, the use of transportation alternatives would be limited to labor force ride-sharing and minimizing unnecessary trips. Although opportunities for using efficient transportation alternatives during Project construction and decommissioning would be limited, the Project would not impede the use of efficient transportation alternatives by others. When the relatively short duration of the construction period (10 months) and the decommissioning period (3 months) and the relatively small size of the construction workforce (between 28 and 144) and decommissioning workforce (approximately 60) are considered, the impact would be less than significant.
Mitigation: None required.
4.6.5 Alternatives
4.6.5.1 Reduced Project
The Reduced Project Alternative would have slightly reduced impacts compared to the proposed Project with regard to energy conservation. The Reduced Project Alternative would be a smaller version of the proposed Project at the same site. Similar to the proposed Project, the Reduced Project Alternative’s energy requirements by amount and fuel type for construction, O&M, and decommissioning of the Project, as well as the Project’s projected transportation energy use requirements and its overall use of efficient transportation alternatives, would be less than significant. However, these impacts would be slightly less due to the decreased size of the Reduced Project Alternative. The smaller size would require less energy needed for construction and decommissioning, and would require essentially the same amount of transportation energy as the proposed Project to operate and maintain this alternative. Energy requirements for construction and

4. Environmental Analysis Energy Conservation
McHenry Solar Farm 4.6-9 May 2011 Draft Environmental Impact Report
decommissioning of the sub-transmission and distribution line and construction of the fiber optic cable would be no different than for the proposed Project. The Reduced Project would provide about 10 percent less energy to the MID grid, but the parasitic load would not be materially different than the proposed Project (while there would be about 10 percent fewer drive units and tracker controllers, all other sources of parasitic load would be the same as for the proposed Project). Overall, energy conservation impacts related to the use of transportation energy would be slightly less for this alternative compared to the Project, while the benefits of providing additional energy to the MID grid would be slightly less.
4.6.5.2 Non-Agriculture Site
Because this alternative site is located within the same utility district (i.e., MID) service area as the proposed Project site, the energy conservation setting described above in Section 4.6.1, Setting, is also applicable to this alternative site.
Before construction of solar facilities could occur on the Non-Agriculture Site Alternative, the existing buildings and structures would have to be demolished and removed, which would require the use of transportation fuel. Similar activities would not be required for the proposed Project site. However, the Non-Agriculture Site Alternative would require substantially less transportation energy for construction and decommissioning of the solar facilities because of its considerably smaller size compared to the proposed Project. Energy requirements for construction and decommissioning of the sub-transmission and distribution line and construction of the fiber optic cable would likely be greater than for the proposed Project because of the greater length of the sub-transmission line for this alternative (approximately 1.25 miles compared to a maximum of 1,500 feet for the Project). The Non-Agriculture Site Alternative would provide only about 20 percent of the energy to the MID grid compared to the Project, but the parasitic load would not reduced by the same proportion (while there would be about 80 percent fewer drive units and tracker controllers, all other sources of parasitic load would be the same as for the proposed Project). Overall, energy conservation impacts related to the use of transportation energy would be greater for this alternative compared to the Project, while the benefits of providing additional energy to the MID grid would be considerably less.
4.6.5.3 No Project
If the No Project Alternative is implemented, the proposed Project would not be constructed, operated, or decommissioned. Therefore, there would be no change in existing energy use at the Project site, and no change in effect on existing local, regional, or federal standards, supplies, demand, and resources would occur. However, the state would not be moving closer to meeting its renewable portfolio goals, and its reliance on fossil fuels would continue.

4. Environmental Analysis Energy Conservation
McHenry Solar Farm 4.6-10 May 2011 Draft Environmental Impact Report
References – Energy Conservation Bamberger, Robert, 2002. Automobile and Light Truck Fuel Economy: The CAFE Standards.
Congressional Research Service, Updated September 25, 2002
California Energy Commission (CEC), 2011. Commission Guidebook: Renewables Portfolio Standard Eligibility (4th ed., Jan. 2011).
CEC, 2010a, 2009 Total Electricity System Power, http://www.energyalmanac.ca.gov/electricity/total_system_power.html. Site accessed December 29, 2010.
CEC, 2010b. California’s Major Sources of Energy. http://energyalmanac.ca.gov/overview/energy_sources.html, April 2009. Site accessed December 29, 2010.
CEC, 2005. California's Water – Energy Relationship Prepared in Support of the 2005 Integrated Energy Policy Report Proceeding, Final Staff Report, November 2005 (CEC-700-2005-011-SF) Table C-6, page 118.
Hannon et al., 1978. “Energy and Labor in the Construction Sector,” Science Magazine, Vol. 202, No. 4370, November 24, 1978.
Stanislaus County, 2008. 1994 Stanislaus County General Plan, rev. December 2008.
Joskow, Paul L., 2003. Energy Policies and Their Consequences After 25 Years, The Energy Journal, Vol. 24, No. 4. Copyright © 2003 by the IAEE. All rights reserved.

4. Environmental Analysis
McHenry Solar Farm 4.7-1 May 2011 Draft Environmental Impact Report
4.7 Geology and Soils
This section identifies and evaluates issues related to Geology and Soils in the context of the Project and alternatives. Discussed are the physical and regulatory setting; the baseline for determining environmental impacts; the criteria used for determining the significance of environmental impacts; potential impacts associated with construction, operation, maintenance, and decommissioning of the Project; and mitigation measures to reduce or avoid environmental impacts determined to be potentially significant.
4.7.1 Setting
4.7.1.1 Regional and Local Setting
Section 2.2, Project Location and Existing Land Use, provides general information about the regional and local setting. This section provides setting information specific to Geology and Soils.
Physiography The Project area is located in the southern portion of the Great Central Valley geomorphic province of California. This geomorphic province is characterized as a northwestward-trending trough that formed between the Coast Range Mountains to the west and the Sierra Nevada Mountains to the east. The Central Valley is approximately 50 miles wide and extends for 400 miles through the center of California. The northern and southern portions of the Great Valley are referred to as the Sacramento Valley and San Joaquin Valley, respectively; with the Sacramento River draining areas to the north and the San Joaquin River draining areas to the south. The Project site is in the central portion of the San Joaquin Valley. The topography of the San Joaquin Valley is relatively level, with elevations ranging from a few feet to a few hundred feet above mean sea level (msl). The Project site is situated on the valley floor consisting of flat terrain at an elevation approximately 250 feet above msl.
Geology, Soils, and Geologic Hazards
Local Geology
The surface of the San Joaquin Valley in the vicinity of the Project site is underlain by the Upper Modesto Formation consisting of Pleistocene and more recent alluvium originating from the igneous and metamorphic rock of the Sierra Nevada Mountains located to the east. During the past 200 million years, the Central Valley has accumulated over 20,000 feet of sedimentary material originating primarily from the Sierra Nevada, and carried to the valley by drainages conveying vast amounts of water. The upper Modesto Formation represents the upper and most recently deposited material. The upper Modesto Formation consists of alluvial fan deposits composed primarily of sandy soil, interlayered with overbank silt deposits and locally containing gravel (USGS, 1978, pp.1-2).

4. Environmental Analysis Geology and Soils
McHenry Solar Farm 4.7-2 May 2011 Draft Environmental Impact Report
Site Topography
The Project site is essentially flat with a 3-foot elevation drop across the site, measured from east to west. Minor topographical variations are associated with agricultural uses (such as plowing), roads, and shallow roadside ditches that rim the fields to contain agricultural and/or stormwater runoff.
Soils
Overlying the alluvial parent material described above are immature1 soils mapped by the Natural Resource Conservation Service (NRCS) as Hanford sandy loam2 (center of the Project site), Tujunga loamy sand (northern and southeastern portions of the Project site), and Tujunga sand (northeastern corner of the Project site) (NRCS, 2010). On-site soils are well drained with very low runoff and typically no annual flooding or ponding. The soils are free of a restrictive feature that impedes downward infiltration. Generally, soil at the Project site has been disturbed, reworked, or amended within several feet of the surface due to agricultural use. As such, naturally-developed soil horizons have likely been removed and the whole soil has been altered to some degree through application of fertilizer and repeated plowing and irrigation.
Geologic/Geotechnical Hazards
Geologic and geotechnical hazards and their potential presence on the Project site are described below.
Accelerated Erosion. Because the Handford and Tujunga soil series are well drained and the Project site is relatively flat, accelerated erosion at the site is not a major issue under normal conditions. Soil survey data indicate the hazard of soil loss from unsurfaced roads and trails is slight to moderate. In addition, the hazard of soil loss from off-road and off-trail areas is also slight to moderate (NRCS, 2010). These ratings are based on the soil erosion factor K, slope, and content of rock fragments, and assumes that the soil is clear of vegetation. When thoroughly wet, denuded of vegetation, and under precipitation from long-duration storms, runoff and erosion potential stay relatively low. The Handford sandy loam belongs to hydrologic group B, and the Tujunga soil series belongs to hydrologic group A. These groups indicate that on-site soil would have a moderate to high infiltration and low runoff potential. A hydrogeological characterization of the Modesto region likewise indicates that soils in the Project area have a rapid (5 to 10 inches/hour) to very rapid (greater than 10 inches/hour) percolation rate (USGS, 2004).
Although runoff and erosion behavior can be estimated from the mapped soil series, the actual susceptibility to erosion would vary based on site-specific conditions, and how stormwater runoff is managed. The possibility of substantial and accelerated erosion is further discussed in Section 4.7.4, Impacts and Mitigation Measures as well as Chapter 4.10, Hydrology and Water Quality.
1 The “maturity” of a soil refers to its age and degree of profile development. Mature soils typically have many soil
horizons reflecting a prolonged period of downward movement of soluble minerals. Immature soils may exhibit only slight differences with its parent material (such as an organic-rich surface layer.)
2 Loam is soil comprised of sand, silt, and clay in relatively even concentration (about 40-40-20 percent concentration, respectively). The term is often qualified to indicate a relative abundance of one constituent over others (e.g., a “sandy loam” is a loam, but where sand is more abundant than silt and clay).

4. Environmental Analysis Geology and Soils
McHenry Solar Farm 4.7-3 May 2011 Draft Environmental Impact Report
Expansive Soils. Expansive soils are characterized by their ability to undergo significant volume change (i.e., to shrink and swell) due to variations in moisture content. Changes in soil moisture can result from rainfall, landscape irrigation, utility leakage, roof drainage, and/or perched groundwater.3 Expansive soils are typically very fine grained and have a high to very high percentage of clay. Expansion and contraction of expansive soils in response to changes in moisture content can lead to differential and cyclical movements that can cause damage and/or distress to structures and equipment. Because the soils on-site have low clay content and low linear expansivity, expansive potential is low (NRCS, 2010).
Corrosive Soils. The corrosivity of soils is commonly related to several key parameters, including soil resistivity, the presence of chlorides and sulfates, oxygen content, and pH. Typically, the most corrosive soils are those with the lowest pH and highest concentration of chlorides and sulfates. Wet/dry conditions can result in a concentration of chlorides and sulfates as well as movement in the soil, both of which tend to break down the protective corrosion films and coatings on the surfaces of building materials. High-sulfate soils are also corrosive to concrete and may prevent complete curing, reducing its strength considerably. Low pH and/or low-resistivity soils can corrode buried or partially buried metal structures. Depending on the degree of corrosivity of the subsurface soils, building materials such as concrete, reinforcing steel in concrete structures, and bare-metal structures exposed to these soils can deteriorate, eventually leading to structural failures. The soils on-site have a moderate corrosion potential for steel, and a low corrosion potential for concrete (NRCS, 2010).
Collapsible Soils. Soil collapse, or hydro-consolidation, occurs when soils undergo a rearrangement of their grains and a loss of cementation, resulting in substantial and rapid settlement under relatively low loads. This phenomenon typically occurs in recently deposited Holocene soils in a dry or semiarid environment, including eolian (wind blown) sands and alluvial fan and mudflow sediments deposited during flash floods. The combination of weight from structures, and an increase in surface water infiltration (such as from irrigation or a rise in the groundwater table), can initiate settlement and cause structural foundations and walls to crack. The Project site is unlikely to be underlain by collapsible soils because the Modesto Formation is pre-Holocene in age (i.e., not recently deposited).
Land Subsidence. Although land subsidence historically has been a problem in the San Joaquin Valley due to excessive groundwater withdrawal, the rate has slowed substantially since the 1960s with the increased use of surface water for crop irrigation. The Project site is located in a part of the San Joaquin Valley that is not considered a major subsidence area (USGS, 1999, p.31).
Landslides. Slope failures, commonly referred to as landslides, include many phenomena that involve the downslope displacement and movement of material, either triggered by static (i.e., gravity) or dynamic (i.e., earthquake) forces. Rock slopes exposed to either air or water can undergo rockfalls, rockslides, or rock avalanches, while soil slopes experience shallow soil slides, rapid debris
3 Perched groundwater is a local saturated zone above the water table that typically exists above an impervious layer
(such as clay) of limited extent.

4. Environmental Analysis Geology and Soils
McHenry Solar Farm 4.7-4 May 2011 Draft Environmental Impact Report
flows, and/or deep-seated rotational slides. The Project site and the vicinity is flat lying, which precludes the presence or occurrence of landslides.
Regional Faulting and Seismic Hazards This section characterizes the region’s existing faults, describes historic earthquakes, evaluates the likelihood of future earthquakes, and describes probable ground-shaking effects.
Seismic Context
No faults in the vicinity of the Project site are recognized as active by the State of California and zoned pursuant to the Alquist-Priolo Earthquake Fault Zoning Act (Hart and Bryant, 1997, p.4), nor is the Project site traversed by any faults recognized by the Uniform Building Code (UBC) as active (International Conference of Building Officials, 1997).
The Greenville fault, located approximately 30 miles west of Modesto in Alameda and Santa Clara counties, is the closest active fault to the Project site. The Greenville fault is likely capable of generating earthquakes with a Richter scale magnitude of 6.9. The recurrence interval for large magnitude events on the Greenville is inferred to be approximately 623 years. The only notable earthquake on the fault was a swarm of small quakes in 1980, which included a magnitude 5.5 and a magnitude 5.7 event (Anderson, 1982). The UBC characterizes the Greenville fault as a Type B seismic source. The UBC evaluates the risk associated with active faults based on their potential to generate large earthquakes (measured as the moment magnitude for the largest earthquake anticipated on the fault) and their degree of seismic activity (measured as average annual slip rate). Under this system, a Type B seismic source is associated with smaller maximum events and/or is less active but still constitutes a substantial seismic threat (International Conference of Building Officials, 1997). It is not known to experience fault creep.
The only active fault reported in Stanislaus County is the Tesla-Ortigalita fault, which is located approximately 35 miles southwest of the Project area. Based on geomorphic evidence and results of trench studies, the Telsa-Ortigalita fault is believed to experience right-lateral strike-slipmotion and is likely capable of generating earthquakes with a Richter scale magnitude of 6.5 to 6.75. The recurrence interval for large magnitude events on the Ortigalita fault is inferred to be 2,000 to 5,000 years on the fault as a whole and 10,000 to 25,000 years on individual fault segments (Anderson et al., 1982). The UBC characterizes the Ortigalita fault as a Type B seismic source.
Other active faults in the surrounding region include the Calaveras and Concord faults, both located approximately 50 miles west of Modesto; the Hayward fault, located approximately 60 miles west of Modesto; and the San Andreas fault, at approximately 75 miles west of Modesto.
Seismic Hazards
Surface Fault Rupture4. The threat of surface fault rupture would be negligible to non-existent at the Project site because there are no faults within or in the vicinity of the Project site.
4 Fault rupture is displacement at the earth’s surface resulting from fault movement associated with an earthquake.

4. Environmental Analysis Geology and Soils
McHenry Solar Farm 4.7-5 May 2011 Draft Environmental Impact Report
Seismic Ground Shaking. Strong ground shaking from earthquakes generated by active faults is a hazard to the Project site because a moderate to severe earthquake could cause strong ground shaking within the Project vicinity. Ground shaking intensity is related to the size (i.e., magnitude) of an earthquake, the distance from the epicenter to the Project’s location, and the response of the geologic materials that underlie the site. The greater the earthquake magnitude and the closer the fault rupture to the site, the greater the intensity of ground shaking. Violent shaking is generally expected at and near the epicenter of a large earthquake, although studies of recent earthquakes, such as those conducted after the 1992 Landers earthquake, indicate that directional ground motion along a fault can cause strong ground shaking farther away from the epicenter. Seismic hazards due to ground shaking can cause the greatest damage to structures, utilities, and unsecured equipment.
The primary tool that seismologists use to describe ground-shaking hazard is a probabilistic seismic hazard assessment (PSHA). The PSHA for the State of California considers the range of possible earthquake sources and estimates their characteristic magnitudes to generate a probability map for ground-shaking. The PSHA maps depict values of peak ground acceleration (PGA) that have a 10 percent probability of being exceeded in 50 years. Use of this probability level allows engineers to design structures to withstand ground motions that have a 90 percent chance of not occurring in the next 50 years, making buildings safer than if they were merely designed for the most probable events. The PSHA indicates that, at the Project site, there is a 10 percent chance of exceeding PGA values of approximately 0.23g over the next 50 years (CGS, 2010). This PGA is equivalent to an average PGA for earthquakes of VII on the Modified Mercalli Intensity Scale5. Based on this scale, damage would be negligible in buildings of good construction and design, slight to moderate in well-built ordinary structures, and considerable in poorly built or badly designed structures (ABAG, 2003).
Liquefaction. Liquefaction is the sudden temporary loss of shear strength in saturated, loose to medium dense, granular sediments subjected to ground shaking. Liquefaction generally occurs when seismically-induced ground shaking causes pore water pressure to increase to a point equal to the overburden pressure. Liquefaction can cause foundation failure of buildings and other facilities due to the reduction of foundation bearing strength. The potential for liquefaction depends on the duration and intensity of earthquake shaking, particle size distribution of the soil, density of the soil, and elevation of the groundwater. Areas at risk due to the effects of liquefaction are typified by a high groundwater table and underlying loose to medium-dense, granular sediments, particularly younger alluvium and artificial fill. The site estimated to have a low potential for liquefaction because it is underlain by older alluvium, it has deep groundwater levels, and it is unlikely to experience strong ground shaking.
5 The Modified Mercalli Intensity Scale (I – XII) assigns an intensity value based on the observed effects of ground-
shaking produced by an earthquake.

4. Environmental Analysis Geology and Soils
McHenry Solar Farm 4.7-6 May 2011 Draft Environmental Impact Report
4.7.1.2 Regulatory Setting
Federal There are no applicable federal regulations that pertain to geology, soils, and seismic hazards.
State of California The statewide minimum public safety standard for mitigation of earthquake hazards (as established through the California Building Code (CBC), Alquist-Priolo Earthquake Fault Zoning Act, and the Seismic Hazards Mapping Act) is that the minimum level of mitigation for a project should reduce the risk of ground failure during an earthquake to a level that does not cause the collapse of buildings for human occupancy, but in most cases, is not required to prevent or avoid the ground failure itself. It is not feasible to design all structures to completely avoid damage in worst-case earthquake scenarios. Accordingly, regulatory agencies have generally defined an "acceptable level" of risk as that which provides reasonable protection of the public safety; although it does not necessarily ensure continued structural integrity and functionality of a project [California Code of Regulations (CCR) Title 14, Section 3721(a)]. Nothing in these acts, however, precludes lead agencies from enacting more stringent requirements, requiring a higher level of performance, or applying these requirements to developments other than those that meet the acts’ definitions of “project.”
California Building Code
The CBC has been codified in the CCR as Title 24, Part 2. Title 24 is administered by the California Building Standards Commission, which, by law, is responsible for coordinating all building standards. Pursuant to State law, all building standards must be centralized in Title 24 or they are not enforceable. The purpose of the CBC is to establish minimum standards to safeguard the public health, safety, and general welfare through structural strength, means of egress facilities, and general stability by regulating and controlling the design, construction, quality of materials, use and occupancy, location, and maintenance of all building and structures within its jurisdiction. The 2010 edition of the CBC is based on the 2009 International Building Code (IBC) published by the International Code Conference. The 2010 CBC contains California amendments based on the American Society of Civil Engineers (ASCE) Minimum Design Standards 7-05. ASCE 7-05 provides requirements for general structural design and includes means for determining earthquake loads as well as other loads (e.g., flood, snow, wind) for inclusion into building codes. The provisions of the CBC apply to the construction, alteration, movement, replacement, and demolition of every building or structure or any appurtenances connected or attached to such buildings or structures throughout California.
Stanislaus County
General Plan
The Stanislaus County General Plan, Safety Element contains goals, policies and implementation measures that could be applicable to the Project as follows:

4. Environmental Analysis Geology and Soils
McHenry Solar Farm 4.7-7 May 2011 Draft Environmental Impact Report
Safety Goal One: Prevent loss of life and reduce property damage as a result of natural disasters.
Safety Policy One: The County will adopt (and implement as necessary) plans inclusive of the Multi-Jurisdictional Hazard Mitigation Plan, to minimize the impacts of natural and man-made disasters.
Safety Implementation Measure 1.2: The County will follow the policies included in the adopted emergency plan. New development shall not conflict with policies included in that document. Responsible Department: Emergency Services
Safety Policy Three: Development should not be allowed in areas that are particularly susceptible to seismic hazard.
Safety Implementation Measure 3.1: The County shall enforce the Alquist-Priolo Earthquake Fault Zoning Act. Responsible Departments: Building Inspections, Planning Department, Planning Commission, Board of Supervisors
Safety Implementation Measure 3.2: Development in areas of geologic hazard shall be considered for approval only where the development includes an acceptable evacuation route. Responsible Departments: Sheriff, Fire Safety, Emergency Services, Public Works, Planning Department, Planning Commission, Board of Supervisors
Safety Goal Two: Minimize the effects of hazardous conditions that might cause loss of life and property.
Safety Policy Six: All new development shall be designed to reduce safety and health hazards.
Safety Implementation Measure 6.3: Development standards shall be imposed to provide street lighting, storm drainage, setbacks, fire walls. Responsible Departments: Public Works, Planning Department, Fire Safety, Planning Commission, Board of Supervisors
Stanislaus County Code
The Stanislaus County Code establishes the following regulations relevant to the Project. Title 16, Buildings and Construction, provides minimum standards to safeguard life, health, property, and the public welfare. The county building and construction code regulates and controls the design, construction, quality of materials, use and occupancy, location, and maintenance of all buildings and structures within the unincorporated areas of the county; encourages and instructs people to build safely and economically, rather than to discourage building; and provides a minimum of restrictive enforcement and a maximum of good building information and encouragement (Ord. CS 625 §2 (part), 1996). Chapter 16.05 of the Building Code provides building standards for new and existing structures. Chapter 16.10 of the Plumbing Code provides requirements for installation of a septic system, including not having a septic system within 50 feet of a private well and requiring the owner of septic systems to follow operation and maintenance guidelines provided by the manufacturer for all septic systems.

4. Environmental Analysis Geology and Soils
McHenry Solar Farm 4.7-8 May 2011 Draft Environmental Impact Report
4.7.1.3 Baseline
The environmental setting described above constitutes the baseline for determining the significance of potential impacts on geology and soils. It consists of the actual pre-project physical environmental conditions of the Project site. On-site soil series are generally well drained (high infiltration) with very low runoff and typically no annual flooding or ponding. Generally soils in the Project site have been disturbed, reworked, or amended within several feet of the surface due to agricultural use. The Project site is approximately 30 miles from the Greenville fault and 35 miles from the Tesla-Ortigalita fault. It is estimated that the Project site could experience strong (MMI VII) shaking intensities during a low-probability earthquake event (i.e., equivalent to a 10 percent chance of exceeding a PGA of 0.23g over the course of 50 years).
4.7.2 Significance Criteria Based on CEQA Guidelines Appendix G, a project would cause a significant impact on geology
and soils if it would:
a) Expose people or structures to potential substantial adverse effects, including risk of loss, injury, or death involving:
a. Rupture of a known earthquake fault, as delineated on the most recent Alquist-Priolo Earthquake Fault Zoning Map issued by the State Geologist for the area or based on other substantial evidence of a known fault;
b. Strong seismic ground-shaking;
c. Seismic-related ground failure, including liquefaction; and/or
d. Landslides;
b) Result in substantial soil erosion or the loss of topsoil;
c) Be located on a geologic unit or soil that is unstable, or that would become unstable as a result of the Project, and potentially result in on- or off-site landslide, lateral spreading, subsidence, liquefaction, or collapse;
d) Be located on expansive soil, as defined in Table 18-1-B of the Uniform Building Code, creating substantial risks to life or property; or
e) Have soils incapable of adequately supporting the use of septic tanks or alternative wastewater disposal systems where sewers are not available for the disposal of wastewater.
4.7.3 Discussion of Criteria with No Geology and Soils Impacts Analysis of the setting and Project characteristics relative to the significance criteria show that the Project would have no impact on Geology and Soils with respect to criteria a) a, a) d, and c). The reasoning supporting this conclusion follows.

4. Environmental Analysis Geology and Soils
McHenry Solar Farm 4.7-9 May 2011 Draft Environmental Impact Report
a) a. The Project would not expose people or structures to potential substantial adverse effects, including the risk of loss, injury, or death involving rupture of a known earthquake fault, as delineated on the most recent Alquist-Priolo Earthquake Fault Zoning Map issued by the State Geologist for the area or based on other substantial evidence of a known fault.
The Project would not be located on or near an active or potentially active fault line. Therefore, there would be no impact involving rupture of a known earthquake fault.
a) d. The Project would not expose people or structures to potential substantial adverse effects, including the risk of loss, injury, or death involving landslides.
The Project site is flat and the potential for downslope movement of materials triggered by gravity or by earthquake ground shaking is negligible. In addition, surface grading for placement of Project structures would be minimal and there would be no import or export of engineered fills, precluding any substantial fill slopes that could be subject to failure. Therefore, there would be no impact involving landslides.
c) The Project would not be located on a geologic unit or soil that is unstable, or that would become unstable as a result of the Project, and potentially result in on- or off-site landslide, lateral spreading, subsidence, liquefaction, or collapse.
The Project site is flat with stable well-drained soils, low runoff potential, and little potential for subsidence or collapse. Therefore, except for liquefaction during an earthquake, the Project would not be threatened by landslides or an otherwise unstable geologic unit or soil. Further, there is no characteristic of the Project that would create or worsen the potential for landslides or other soil instability. The potential for liquefaction and lateral spread (earthquake-induced ground failure) to affect the site are addressed in the Impact 4.7-1 discussion.
4.7.4 Impacts and Mitigation Measures
a) b. Expose people or structures to potential substantial adverse effects, including risk of loss, injury, or death involving strong seismic ground shaking; and
a) c. Expose people or structures to potential substantial adverse effects, including risk of loss, injury, or death involving seismic-related ground failure, including liquefaction.
Impact 4.7-1: The Project could expose people or structures to potential adverse effects, including the risk of loss, injury, or death involving strong seismic ground shaking and earthquake-induced ground failure (such as liquefaction and lateral spreading). (Less than significant)
The nearest active fault system (the Greenville fault) is relatively distant from the Project site (30 miles), and ground shaking from a major earthquake would be attenuated by the distance to the fault. The PSHA indicates that, at the Project site, there is a 10 percent chance of exceeding PGA values of approximately 0.23g over the next 50 years (CGS, 2010). Locations that have experienced similar ground accelerations (i.e., 0.23 g) in the past have reported strong ground shaking that was widely felt and caused non-structural damage, such as moving or toppling of

4. Environmental Analysis Geology and Soils
McHenry Solar Farm 4.7-10 May 2011 Draft Environmental Impact Report
unanchored objects, cracks in weak plaster and masonry, and damage to weak chimneys. However, damage from such an earthquake would be negligible in buildings of good construction and design. As required by the CBC and in conjunction with application for a County Building Permit, the Applicant would determine the occupancy category and site soil class of the Project site, as well as determine the seismic design criteria that should be applied to the Project. These actions are standard practice in California and are required by law through the CBC. Project facilities are not expected to affect seismic ground-shaking and earthquake-induced ground failure at the Project site if it were to occur. In addition, complying with standard engineering practices that include the CBC and seismic design criteria would reduce the potential for seismic ground-shaking and earthquake-induced ground failure at the Project site to affect Project facilities, resulting in a less-than-significant impact. Further, seismic-related ground failure, such as liquefaction and lateral spreading, are unlikely to occur at the Project site.
The conditions necessary to produce liquefaction and lateral spreading are the presence of saturated soils with a low clay content (primarily silts and sands), a shallow groundwater table (i.e., deeper than 40 feet below the ground surface), and (for lateral spreading) large exposed soil-faces. Sufficient information presently exists to determine that the liquefaction potential at the Project site is not a concern. A well approximately 1000 feet south of the Project site shows that groundwater levels have fluctuated between 40 and 60 feet below the ground surface since the mid-1960s (DWR, 2010). Also, soil surveys of the area have indicated that the soil is sandy and well-drained with percolation rates estimated to be rapid (5 to 10 inches/hour) to very rapid (greater than 10 inches/hour) (USGS, 2004; NRCS, 2010). The most severe level of ground-shaking expected at the site would rate as strong. Given that the soils on-site lack the required conditions, liquefaction is not expected to occur even during a worst-case shaking scenario. Lateral spreading would not occur because the groundwater table near the site is deep and there would be no exposed soil faces beyond shallow drainage structures. Because the risk of seismic-related ground failure is low, and because structures would be designed according to the CBC, this impact is considered less than significant.
Mitigation: None required.
b) Result in substantial soil erosion or the loss of topsoil.
Impact 4.7-2: The Project could result in soil erosion or loss of topsoil. (Less than significant)
There is a certain rate of soil erosion that occurs naturally in the environment; however, the preliminary stage of construction, especially initial site grubbing, grading, and soil stockpiles leaves loose soil exposed to the erosive forces of rainfall and high winds. Generally, excessive soil erosion can cause sedimentation problems in storm drain systems; and rapid stormwater runoff can initiate or increase the size of shallow channels and/or gullies, and potentially undermine engineered soils beneath foundations and paved surfaces. However, the Project is not expected to created or worsen issues related to soil erosion. Section 4.10, Hydrology and Water Quality concludes that soil erosion from a water quality perspective would be less than

4. Environmental Analysis Geology and Soils
McHenry Solar Farm 4.7-11 May 2011 Draft Environmental Impact Report
significant, based largely on the fact that: 1) the site is flat and well drained and the Project would result in minimal changes with respect to stormwater flow and percolation, 2) there would be no import or export of soil for construction or operation of the Project, and 3) a SWPPP would be implemented during Project construction to control potential erosion of temporarily disturbed areas. For these reasons, impacts related to soil erosion would be less than significant.
Mitigation: None required.
d) Be located on expansive soil, as defined in Table 18-1-B of the Uniform Building Code, creating substantial risks to life or property.
Impact 4.7-3: The Project could be located on expansive soil, as defined in Table 18-1-B of the Uniform Building Code (1994), creating risks to life or property. (Less than significant)
The soils beneath the Project site are well-drained sandy soils with low clay content, and therefore, have a low expansion potential (NRCS, 2010). If in the process of application for a County Building Permit, the Building Official determines that expansive soil may be present, in accordance with Sections 1803.5.3, and 1808.6 of the 2010 CBC, a preliminary soil report would be required, including allowable soil bearing value, expansion index tests, and foundation design recommendations. Although unlikely, if on-site soils are found to be expansive, such recommendations would likely involve standard engineering practices, such as designing structural foundations and utilities to accommodate expected soil movements, or placing them within non-expansive imported sand, gravel, or other backfill material. For these reasons, the impact would be less than significant.
Mitigation: None required.
e) Have soils incapable of adequately supporting the use of septic tanks or alternative wastewater disposal systems where sewers are not available for the disposal of wastewater.
Impact 4.7-4: The Project site could have soils incapable of adequately supporting the use of septic tanks or alternative wastewater disposal systems where sewers are not available for the disposal of wastewater. (Less than significant)
The Project would include construction of a private septic system to serve restroom facilities in the O&M building. The Project would need to comply with Title 16.10 (Plumbing Code) of the Stanislaus County Municipal Code and the Stanislaus County Guidelines for Septic System Design, which regulates the installation of septic tanks (Stanislaus County, 2011). The Applicant would be required to demonstrate to the Stanislaus County Department of Environmental Management that soil conditions would be adequate to support the proposed septic systems. If soil conditions were inadequate to support a standard septic system, special designs would be required or the system

4. Environmental Analysis Geology and Soils
McHenry Solar Farm 4.7-12 May 2011 Draft Environmental Impact Report
would not be permitted. Although the County Code requires owners of septic systems to follow O&M guidelines provided by the manufacturer for all septic systems, current standards for new septic systems protect water quality as well. For these reasons, the impact would be less than significant.
Mitigation: None required.
4.7.5 Alternatives
4.7.5.1 Reduced Project
The Reduced Project Alternative would generally have impacts to geology and soil that are similar to, or the same as, the proposed Project. During construction, the amount of soil disturbances would be similar to, or the same as, the Project. The increased setbacks would decrease the size of the PV array; however, some level of site clearing and shallow grading would still be required for the perimeter landscape. State and County requirements discussed in the analysis of the Project would remain applicable to the Reduced Project Alternative. This alternative would include the same facilities described for the proposed Project. Seismic-related hazards, although possible due to the location of the nearest active fault system relative to this site, would be unlikely at the Project site because all structures would be designed according to the CBC and thus made to withstand design peak ground accelerations. Actions required by law through the CBC would reduce the risks of seismic ground-shaking hazards, and would ensure that all impacts related to seismic ground shaking would be less than significant. Additionally, seismic ground failure, such as liquefaction and lateral spreading are unlikely to occur at this site. The character of on-site soils and the depth of the groundwater table make the potential for liquefaction or lateral spread very low; therefore, seismic-related ground failure would be a less-than-significant impact. Geology and soils properties are site-specific; therefore, impacts would remain similar to the Project, and impacts would be less than significant.
4.7.5.2 Non-Agriculture Site
The Non-Agriculture Site Alternative would generally have impacts to geology and soils that are similar or reduced in intensity as those of the Project. The site is located approximately 4 miles southwest of the Project site and the nearest active fault system is 30 miles away from the non-agriculture site. Therefore, seismic-related hazards and ground failure are unlikely. Actions required by law through the CBC, would reduce the risks of seismic ground-shaking hazards, and would ensure that all impacts related to seismic ground shaking would be less than significant. Site conditions are generally similar to the Project site in terms of topography and soil type. The alternative site is generally flat and soil surveys of the area have indicated that the soil (Hanford sandy loam) is well-drained (NRCS, 2011). Given that the geologic unit on-site is pre-Holocene in age, and the groundwater table is likely deeper than 40 feet, liquefaction and lateral spreading are not expected to occur even during a worst-case shaking scenario. Due to the greatly reduced size of the non-agricultural site alternative, impacts from soil disturbances are likely to be

4. Environmental Analysis Geology and Soils
McHenry Solar Farm 4.7-13 May 2011 Draft Environmental Impact Report
reduced by an equal amount in intensity. Demolition work would be required to remove existing pavement and structures, which could increase soil erosion of the alternative site; however, a Stormwater Pollution Prevention Plan (SWPPP) would be required to be implemented during construction to control erosion of temporarily disturbed areas. Because the Non-Agriculture Site Alternative is located near a developed area, it is possible that there is a sewer connection available for the O&M building, so a septic tank would not be required. Overall, impacts would remain similar to those of the Project, and would be less than significant.
4.7.5.3 No Project
Implementation of the No Project Alternative would result in a continuation of existing land uses. The site is expected to continue to be used in its current capacity and condition. No change in geology or soils conditions would occur with this alternative.
References – Geology and Soils Anderson, L. W., M. H. Anders, and D. A. Ostenaa. 1982. Late Quaternary Faulting and Seismic
Hazard Potential, Eastern Diablo Range, California. Pages 197–206 in E. W. Hart, S. E. Hirschfeld, and S. S. Schulz (eds.), Proceedings, Conference on Earthquake Hazards in the Eastern San Francisco Bay Area. (Special Publication 62.) Sacramento, CA: California Division of Mines and Geology.
Association of Bay Area Government (ABAG), 2003, Modified Mercalli Intensity Scale, http://www.abag.ca.gov/bayarea/eqmaps/doc/mmi.html, accessed on December 29, 2010.
California Geologic Survey (CGS), 2010 Probabilistic Seismic Hazards Mapping Ground Motion Page. http://redirect.conservation.ca.gov/cgs/rghm/pshamap/pshamap.asp?Longitude=-120.995 Accessed Dec 29, 2010.
Department of Water Resources (DWR). Groundwater Level Data by Basin. Available at http://www.water.ca.gov/waterdatalibrary/groundwater/download/ index.cfm, Accessed 12/22/2010.
Hart, E. W. and W. A. Bryant. 1997. Fault-Rupture Hazard Zones in California: Alquist-Priolo Earthquake Fault Zoning Act with index to Earthquake Fault Zone Maps. (Special Publication 42) California Division of Mines and Geology. Sacramento, CA.
International Conference of Building Officials. 1997. Uniform Building Code. Whittier, CA.
Natural Resources Conservation Service (NRCS), United States Department of Agriculture. Web Soil Survey. Available online at http://websoilsurvey.nrcs.usda.gov/app/WebSoilSurvey.aspx. Accessed December 28, 2010.
Natural Resources Conservation Service (NRCS), United States Department of Agriculture. Web Soil Survey. Available online at http://websoilsurvey.nrcs.usda.gov/app/WebSoilSurvey.aspx Accessed February 17, 2011.

4. Environmental Analysis Geology and Soils
McHenry Solar Farm 4.7-14 May 2011 Draft Environmental Impact Report
Stanislaus County. 1987. Stanislaus County General Plan Support Documentation. Chapter V: Safety. Adopted: June. California.
Stanislaus County, 2008. 1994 Stanislaus County General Plan, rev. December 2008.
Stanislaus County, 2010. Stanislaus County Code - §16.10.30, adopted October 2010; available at http://www.qcode.us/codes/stanislauscounty/; accessed February 28, 2011.
U.S. Geological Survey (USGS), Preliminary geologic maps showing Quaternary deposits of the lower Tuolumne and Stanislaus alluvial fans and along the lower San Joaquin River, Stanislaus County, California, (Westley, Brush Lake, Ripon, and Salida 7 1/2' quadrangles), USGS Open-File Report OF-78-656, Map Scale: 1:24,000, 1978.
U.S. Geological Survey (USGS), 2004, Hydrogeologic Characterization of the Modesto Area, San Joaquin Valley, California, by Karen R. Burow, Jennifer L. Shelton, Joseph A. Hevesi, and Gary S. Weissmann, Scientific Investigations Report 2004-5232, 2004.

4. Environmental Analysis
McHenry Solar Farm 4.8-1 May 2011 Draft Environmental Impact Report
4.8 Greenhouse Gas Emissions
This section analyzes the Project’s relationship to greenhouse gas (GHG) emissions. Discussed are the physical and regulatory setting; the baseline for determining environmental impacts; the criteria used for determining the significance of environmental impacts; potential impacts associated with the Project; and mitigation measures to reduce or avoid environmental impacts determined to be potentially significant.
4.8.1 Setting
4.8.1.1 Regional and Local Setting
Section 2.2, Project Location and Existing Land Use, provides general information about the regional and local setting. This section provides setting information specific to GHG emissions.
Background on Greenhouse Gases and Climate Change Gases that trap heat in the atmosphere are called GHGs. The major concern with GHGs is that increases in their concentrations are causing global climate change. Global climate change is a change in the average weather on Earth that can be measured by wind patterns, storms, precipitation, and temperature. Although there is disagreement as to the rate of global climate change and the extent of the impacts attributable to human activities, most in the scientific community agree that there is a direct link between increased emissions of GHGs and long-term global temperature increases. What GHGs have in common with each other is that they allow sunlight to enter the atmosphere, but trap a portion of the outward-bound infrared radiation, which causes the air near the earth to warm. The process is similar to the effect greenhouses have in raising the internal temperature of a room, hence the name GHGs. Both natural processes and human activities emit GHGs. The accumulation of GHGs in the atmosphere affects the Earth’s temperature; however, emissions from human activities, such as fossil fuel-based electricity production and the use of motor vehicles, have elevated the concentration of GHGs in the atmosphere. It is generally believed that this accumulation of GHGs is contributing to global climate change.
The principal GHGs are carbon dioxide (CO2), methane (CH4), nitrous oxide (N2O), sulfur hexafluoride (SF6), perfluorocarbons (PFCs), and hydrofluorocarbons (HFCs). Because the different GHGs have different warming potential and CO2 is the most common reference gas for climate change, GHG emissions are often quantified and reported as CO2 equivalents (CO2e). For example, SF6 is a GHG commonly used in the utility industry as an insulating gas in circuit breakers and other electronic equipment. SF6, although comprising a small fraction of the total GHGs emitted annually world-wide, is a much more potent GHG, having 23,900 times the global warming potential as CO2. Therefore, an emission of one metric ton of SF6 could be reported as an emission of 23,900 metric tons CO2e. Large emission sources are reported in million metric tons of CO2e.1
1 A metric ton is 1,000 kilograms; it is equal to approximately 1.1 U.S. tons and approximately 2,204.6 pounds.

4. Environmental Analysis Greenhouse Gas Emissions
McHenry Solar Farm 4.8-2 May 2011 Draft Environmental Impact Report
Some of the potential effects in California of global climate change may include loss of snow pack, sea level rise, more extreme heat days per year, more high ozone days, more large forest fires, and more drought years (CARB, 2009). Globally, climate change has the potential to impact numerous environmental resources through potential, although uncertain, impacts related to future air temperatures and precipitation patterns. The projected effects of global climate change on weather and climate are likely to vary regionally, but are expected to include the following direct effects (IPCC, 2001):
a) Higher maximum temperatures and more hot days over nearly all land areas; b) Higher minimum temperatures and fewer cold days and frost days over nearly all land
areas; c) Reduced diurnal temperature range over most land areas; d) Increase of heat index over land areas; and e) More intense precipitation events.
Also, there are many secondary effects that are projected to result from global climate change, including global rise in sea level, impacts to agriculture, changes in disease vectors, and changes in habitat and biodiversity. Although the possible outcomes and the feedback mechanisms involved are not fully understood and much research remains to be done, the potential for substantial environmental, social, and economic consequences over the long-term may be great.
The California Air Resources Board (CARB) estimated that in 2006, California produced 484 million gross metric tons of CO2e emissions (CARB, 2009, p.11). CARB found that transportation was the source of 38 percent of the State’s GHG emissions, followed by electricity generation at 22 percent and industrial sources at 21 percent.
4.8.1.2 Regulatory Setting
Federal The federal Clean Air Act (CAA) requires the U.S. Environmental Protection Agency (USEPA) to define national standards to protect national public health and welfare. The federal CAA does not specifically regulate GHG emissions; however, the U.S. Supreme Court has determined that GHGs are pollutants that can be regulated pursuant to the federal CAA. There are currently no federal regulations that set ambient air quality standards for GHGs.
Federal Mandatory Reporting of Greenhouse Gases (40 CFR Parts 86, 87, 89 et. al)
The USEPA promulgated this rule on October 30, 2009, to require mandatory reporting of GHG from large GHG emissions sources within 31 source categories. In general, the threshold for reporting is 25,000 metric tons or more of CO2e. Reporting is at the facility level, except that certain suppliers of fossil fuels and industrial GHGs, along with vehicle and engine manufacturers, will report at the corporate level. Facilities and suppliers began collecting data on January 1, 2010. The due date for the first emissions reports for emissions during 2010 is September 30, 2011. Manufacturers of vehicles and engines outside of the light-duty sector will

4. Environmental Analysis Greenhouse Gas Emissions
McHenry Solar Farm 4.8-3 May 2011 Draft Environmental Impact Report
begin reporting CO2e for model year 2011, and other GHGs in subsequent model years as part of existing USEPA certification programs. This rule does not currently require reporting SF6 emissions from electrical equipment (USEPA, 2009).
State of California
Executive Order S-3-05
In 2005, in recognition of California’s vulnerability to the effects of climate change, Governor Schwarzenegger established Executive Order S-3-05, which set forth a series of target dates by which statewide emissions of GHGs would be progressively reduced, as follows:
By 2010, reduce GHG emissions to 2000 levels;
By 2020, reduce GHG emissions to 1990 levels; and
By 2050, reduce GHG emissions to 80 percent below 1990 levels.
Assembly Bill 32 – California Global Warming Solutions Act
California Assembly Bill 32 (AB 32), the Global Warming Solutions Act of 2006, requires CARB to establish a statewide GHG emissions cap for 2020, based on 1990 emission levels. AB 32 required CARB to adopt regulations by January 1, 2008 that identify and require selected sectors or categories of emitters of GHGs to report and verify their statewide GHG emissions, and CARB is authorized to enforce compliance with the program. Pursuant to AB 32, by January 1, 2008, CARB was also required to adopt a statewide GHG emissions limit, equivalent to the statewide GHG emissions levels in 1990, which must be achieved by 2020. CARB established this limit, in December 2007, at 427 million metric tons of CO2e. This is approximately 30 percent below forecasted “business-as-usual” emissions of 596 million metric tons of CO2e, and approximately 10 percent below average annual GHG emissions during the period of 2002 through 2004 (CARB, 2009, p.12).
CARB is required to adopt rules and regulations (which shall become operative January 1, 2012), to achieve the maximum technologically feasible and cost-effective GHG emission reductions. AB 32 permits the use of market-based compliance mechanisms to achieve those reductions. AB 32 also requires CARB to monitor compliance with and enforce any rule, regulation, order, emission limitation, emissions reduction measure, or market-based compliance mechanism that it adopts.
In June 2007, CARB directed staff to pursue 37 early strategies for reducing GHG emissions pursuant to AB 32. The broad spectrum of strategies that were developed, including a Low Carbon Fuel Standard, regulations for refrigerants with high global warming potential, guidance and protocols for local governments to facilitate GHG reductions, and green ports, reflect that the serious threat of climate change requires action as soon as possible.
In addition to approving the 37 GHG reduction strategies, CARB directed staff to further evaluate early action recommendations made at its June 2007 meeting, and to report back within six months. The general sentiment of CARB suggested a desire to try to pursue greater GHG

4. Environmental Analysis Greenhouse Gas Emissions
McHenry Solar Farm 4.8-4 May 2011 Draft Environmental Impact Report
emissions reductions in California in the near-term. Since the June 2007 CARB hearing, CARB staff has evaluated all 48 recommendations submitted by stakeholders and several internally-generated staff ideas, and published the Expanded List of Early Action Measures To Reduce Greenhouse Gas Emissions In California Recommended For Board Consideration in September 2007 (CARB, 2007). CARB adopted nine Early Action Measures for implementation, including Ship Electrification at Ports, Reduction of High Global-Warming-Potential Gases in Consumer Products, Heavy-Duty Vehicle Greenhouse Gas Emission Reduction (Aerodynamic Efficiency), Reduction of Perfluorocarbons from Semiconductor Manufacturing, Improved Landfill Gas Capture, Reduction of Hydroflourocarbon-134a from Do-It-Yourself Motor Vehicle Servicing, Sulfur Hexaflouride Reductions from the Non-Electric Sector, a Tire Inflation Program, and a Low Carbon Fuel Standard.
Climate Change Scoping Plan
In December 2008, CARB approved the AB 32 Scoping Plan outlining the State’s strategy to achieve the 2020 GHG emissions limit (CARB, 2009, p. 5). This Scoping Plan, developed by CARB in coordination with the Climate Action Team (CAT), proposes a comprehensive set of actions designed to reduce overall GHG emissions in California, improve the environment, reduce dependence on oil, diversify California’s energy sources, save energy, create new jobs, and enhance public health. The measures in the Scoping Plan will be developed over the next year and be in place by 2012.
The Scoping Plan expands the list of the nine Early Action Measures into a list of 39 Recommended Actions contained in Appendices C and E of the Scoping Plan. These measures are presented in Table 4.8-1.
In addition, the Scoping Plan identifies challenges to meeting future electrical demand, including building transmission lines for renewable energy and modernizing electricity infrastructure. The Plan states:
“Population growth in hot areas and the need to reach remote renewable generation regions both require adding electricity transmission capability. Without new transmission lines, a 33 percent target for the Renewable Portfolio Standard (RPS) is unlikely to be met. Equally important to building transmission is modernizing the transmission and electricity distribution system. Advanced control, communications, and metering technologies, as well as improvements in control of both conventional and renewable generation, can create a more reliable and resilient grid.” (CARB, 2009)
CEQA Guidelines Revisions
In 2007, the State Legislature passed SB 97, which required amendment of the State CEQA Guidelines to incorporate analysis of, and mitigation for, GHG emissions from projects subject to CEQA. The California Natural Resources Agency adopted these amendments on December 30, 2009, and they took effect March 18, 2010. The Guidelines revisions include a new section (Sec. 15064.4) that specifically addresses the potential significance of GHG emissions. Section 15064.4 calls for a “good-faith effort” to “describe, calculate, or estimate” GHG emissions. It further states that the analysis of the significance of any GHG impacts should include

4. Environmental Analysis Greenhouse Gas Emissions
McHenry Solar Farm 4.8-5 May 2011 Draft Environmental Impact Report
TABLE 4.8-1 RECOMMENDED ACTIONS OF CLIMATE CHANGE SCOPING PLAN
ID # Sector Strategy Name
T-1 Transportation Pavley I and II – Light-Duty Vehicle GHG Standards
T-2 Transportation Low Carbon Fuel Standard (Discrete Earl Action)
T-3 Transportation Regional Transportation-Related GHG Targets
T-4 Transportation Vehicle Efficiency Measures
T-5 Transportation Ship Electrification at Ports (Discrete Early Action)
T-6 Transportation Goods-movement Efficiency Measures
T-7 Transportation Heavy Duty Vehicle Greenhouse Gas Emission Reduction Measure –Aerodynamic Efficiency (Discrete Early Action)
T-8 Transportation Medium and Heavy-Duty Vehicle Hybridization
T-9 Transportation High Speed Rail
E-1 Electricity and Natural Gas Increased Utility Energy efficiency programs ; More stringent Building and Appliance Standards
E-2 Electricity and Natural Gas Increase Combined Heat and Power Use by 30,000 GWh
E-3 Electricity and Natural Gas Renewables Portfolio Standard
E-4 Electricity and Natural Gas Million Solar Roofs
CR-1 Electricity and Natural Gas Energy Efficiency
CR-2 Electricity and Natural Gas Solar Water Heating
GB-1 Green Buildings Green Buildings
W-1 Water Water Use Efficiency
W-2 Water Water Recycling
W-3 Water Water System Energy Efficiency
W-4 Water Reuse Urban Runoff
W-5 Water Increase Renewable Energy Production
W-6 Water Public Goods Charge (Water)
I-1 Industry Energy Efficiency and Co-benefits Audits for Large Industrial Sources
I-2 Industry Oil and Gas Extraction GHG Emission Reduction
I-3 Industry GHG Leak Reduction from Oil and Gas Transmission
I-4 Industry Refinery Flare Recovery Process Improvements
I-5 Industry Removal of Methane Exemption from Existing Refinery Regulations
RW-1 Recycling and Waste Management Landfill Methane Control (Discrete Early Action)
RW-2 Recycling and Waste Management Additional Reductions in Landfill Methane – Capture Improvements
RW-3 Recycling and Waste Management High Recycling/Zero Waste
F-1 Forestry Sustainable Forest Target
H-1 High Global Warming Potential Gases Motor Vehicle Air Conditioning Systems (Discrete Early Action)
H-2 High Global Warming Potential Gases SF6 Limits in Non-Utility and Non-Semiconductor Applications (Discrete Early Action)
H-3 High Global Warming Potential Gases Reduction in Perfluorocarbons in Semiconductor Manufacturing (Discrete Early Action)
H-4 High Global Warming Potential Gases Limit High GWP Use in Consumer Products (Discrete Early Action, Adopted June 2008)
H-5 High Global Warming Potential Gases High GWP Reductions from Mobile Sources
H-6 High Global Warming Potential Gases High GWP Reductions from Stationary Sources
H-7 High Global Warming Potential Gases Mitigation Fee on High GWP Gases
A-1 Agriculture Methane Capture at Large Dairies SOURCE: CARB, 2009.

4. Environmental Analysis Greenhouse Gas Emissions
McHenry Solar Farm 4.8-6 May 2011 Draft Environmental Impact Report
consideration of the extent to which the project would increase or reduce GHG emissions; exceed a locally applicable threshold of significance; and comply with “regulations or requirements adopted to implement a statewide, regional, or local plan for the reduction or mitigation of greenhouse gas emissions.” The new Guidelines also state that a project may be found to have a less-than-significant impact on GHG emissions if it complies with an adopted plan that includes specific measures to sufficiently reduce GHG emissions (Sec. 15064(h)(3)). Importantly, however, the Guidelines do not require or recommend a specific analytical methodology or provide quantitative criteria for determining the significance of GHG emissions.
San Joaquin Valley Air Pollution Control District In August 2008, the San Joaquin Valley Air Pollution Control District (SJVAPCD)’s Governing Board adopted the Climate Change Action Plan (CCAP). The CCAP directed the SJVAPCD Air Pollution Control Officer to develop guidance to assist lead agencies, project proponents, permit applicants, and interested parties in assessing and reducing the impacts of project-specific GHG emissions on global climate change.
On December 17, 2009, the SJVAPCD adopted the guidance: Guidance for Valley Land-use Agencies in Addressing GHG Emission Impacts for New Projects under CEQA, and the policy: District Policy – Addressing GHG Emission Impacts for Stationary Source Projects Under CEQA When Serving as the Lead Agency. The guidance and policy rely on the use of performance based standards, otherwise known as Best Performance Standards (BPS), to assess significance of project-specific GHG emissions on global climate change during the environmental review process, as required by CEQA.
Use of BPS is a method of streamlining the CEQA process of determining significance and is not a required emission reduction measure. Projects implementing BPS would be determined to have a less than cumulatively significant impact. Otherwise, demonstration of a 29 percent reduction in GHG emissions, from business-as-usual, is required to determine that a project would have a less than cumulatively significant impact. The guidance does not limit a lead agency’s authority in establishing its own process and guidance for determining significance of project-related impacts on global climate change (SJVAPCD, 2011).
Stanislaus County Stanislaus County does not have adopted GHG emissions plans, goals, policies, or implementation measures that would be applicable to the proposed Project.
4.8.1.3 Baseline
Baseline conditions for this analysis reflect pre-Project conditions. Baseline conditions at the site include operation of the existing agricultural fields, which includes the periodic use of a few vehicles and machinery associated with maintenance and picking activities, and the use of approximately 49 acre-feet per year of on-site well water to irrigate the existing strawberry fields. There are no local climate action plans or GHG reduction plans applicable to the Project site.

4. Environmental Analysis Greenhouse Gas Emissions
McHenry Solar Farm 4.8-7 May 2011 Draft Environmental Impact Report
However, there are applicable reduction goals set forth in AB 32, including the 39 Recommended Actions identified by CARB in its Climate Change Scoping Plan, and the guidance set forth in the SJVAPCD’s CCAP are applicable.
4.8.2 Significance Criteria The significance criteria for assessing the impacts from GHG emissions come from the CEQA Environmental Checklist. According to the CEQA Checklist, a project causes a potentially significant impact if it would:
a) Generate greenhouse gas emissions, either directly or indirectly, that may have a significant impact on the environment; and
b) Conflict with an applicable plan, policy, or regulation adopted for the purpose of reducing the emissions of greenhouse gases.
4.8.3 Discussion of Criteria with No Greenhouse Gas Emissions Impacts
As discussed in Section 4.8.4, analysis of the Project characteristics relative to the baseline and significance criteria shows that the Project would have impacts with respect to each of the criteria.
4.8.4 Impacts and Mitigation Measures
a) Generate greenhouse gas emissions, either directly or indirectly, that may have a significant impact on the environment.
Impact 4.8-1: The Project would result in emissions of greenhouse gases that would contribute to global climate change. (Less than significant)
GHG emissions would be generated by the Project during short-term construction activities and long-term operation and maintenance. Construction of the Project would occur over a period of approximately 10 months. Construction exhaust emissions would be associated with use of heavy-duty off-road equipment and light duty and heavy duty truck trips that would occur during various overlapping construction phases. The total direct exhaust emissions associated with construction of the Project were estimated using emission factors derived from CARB’s EMFAC2007 and OFFROAD emissions models (see Appendix B for details).
Appendix B identifies the proposed construction equipment inventory for the Project in terms of total hours for each piece of equipment for each construction phase. In addition, it is anticipated that an average of 92 construction workers would generate approximately 115 light-duty truck roundtrips each workday, and equipment and material deliveries would generate a total of 890 heavy-duty truck roundtrips per year that would be accompanied by 1,720 light-duty pilot truck trips (see Section 4.17, Transportation/Traffic). There would also be emissions generated from 24 light-duty trucks traveling on-site during the construction period.

4. Environmental Analysis Greenhouse Gas Emissions
McHenry Solar Farm 4.8-8 May 2011 Draft Environmental Impact Report
In addition, indirect GHG emission reductions associated with water use for dust control and other construction activities compared to the existing agricultural water usage of the site were estimated for the Project by using emission and use factors from the California Energy Commission (CEC) and the California Climate Action Registry (CCAR) (CEC, 2005 and CCAR, 2009). Based on the existing water use at the site to irrigate approximately 150 acres of strawberry fields, compared to the estimated Project-related water use during construction, the proposed Project would result in a slight net decrease of indirect water use-related emissions. Total Project construction emissions estimates are presented in Table 4.8-2. The combined direct exhaust and indirect water consumption-related emissions that would be associated with Project construction activities would be approximately 840 metric tons CO2e. Refer to Appendix B for additional information on the assumptions, emission factors, and methodologies used to estimate construction GHG emissions that would be associated with the Project. Given that decommissioning of the Project would occur over a period of approximately 3 months, compared to 10 months that would be required to construct the Project, it is expected that decommissioning emissions would be substantially less than the estimated construction emissions presented in Table 4.8-2.
TABLE 4.8-2 PROJECT GHG EMISSION ESTIMATES
Source or Activity
Metric Tons
CO2 CH4 N2O CO2e
Construction On-site Construction Equipment 296 0.0 0.0 299 Light-Duty and Heavy-Duty Trucks 531 0.0 0.0 542
Water Use - Indirect Emissions -1 0.0 0.0 -1
Total Net Construction Emissions 826 0.1 0.0 840
Operation
Worker Commutes 5 0 0 5 SF6 for 34.5 kV circuit breaker --- --- --- 3 Water Use - Indirect Emissions -1 0 0 -1
Emission Reduction Compared to Fossil Fuel-based Energy -19,693 -21 -65 -19,779
Total Net Operational Emissions -19,772 NOTES: See Appendix B for details for all assumptions and emission factors.
Operational emissions that would occur if the Project is implemented are also summarized in Table 4.8-2. Off-site emissions would be generated due to the commute of two full-time employees each day. Off-site employee commutes would generate approximately 521 roundtrips per year, which would generate approximately five tons CO2e each year (See Appendix B for details). On-site emission sources would be associated with maintenance and periodic panel washing activities. It is anticipated that normal maintenance and panel washing activities would generate direct emissions similar to those that are currently generated at the site associated with its agricultural use, including planting, maintenance, and harvesting.

4. Environmental Analysis Greenhouse Gas Emissions
McHenry Solar Farm 4.8-9 May 2011 Draft Environmental Impact Report
Operational on-site GHG emissions would also include SF6 leakage from the proposed 34.5-kV circuit breaker at the on-site substation. The Applicant has estimated that the new circuit breaker would have a capacity of approximately 25 pounds of SF6. The USEPA estimates that leaking circuit breakers manufactured in 1999 and later emit less than one percent of the SF6 nameplate capacity (USEPA, 2006, p.3). Considering this information, the Project could emit up to approximately 0.25 pound of SF6 per year, which is equal to approximately three metric tons CO2e per year. Therefore, the total long-term operational direct emissions (including worker commutes) that would be generated by the Project would be approximately eight metric tons CO2e per year.
Similar to that described for Project construction, indirect GHG emission reductions associated with operational water use for panel washing and landscape irrigation compared to the existing agricultural water usage of the site were estimated for the Project by using emission and use factors from the CEC and CCAR (CEC, 2005 and CCAR, 2009). Based on the existing water use at the site to irrigate approximately 150 acres of strawberry fields, compared to the estimated Project-related water use during operation, the proposed Project would result in a slight net decrease of indirect water use-related emissions (see Table 4.8-2).
Implementation of the Project would contribute an estimated 60,076 MWh of additional solar-generated energy per year to MID’s power grid compared to baseline conditions, and would, therefore, represent an emission reduction when compared to the same amount of “conventional” (carbon-based) energy production. The Project’s parasitic load would require approximately 120 MWh of electricity per year from MID’s electrical grid; therefore, the Project would result in an annual net contribution of approximately 59,956 MWh to MID’s electrical grid. Using emission factors for CO2, CH4, and N2O per MWh developed by the CCAR for California’s energy production portfolio, it is estimated that the Project would result in an annual GHG emissions reduction of approximately 19,779 metric tons CO2e. Therefore, operation of the Project would result in a net reduction of approximately 19,772 metric tons CO2e per year, or a reduction of over 1,600 metric tons CO2e per month. At this rate, the first month of Project operation would more than offset all of the emissions that would be generated during the 10-month construction period.
The SJVAPCD has established a GHG significance threshold methodology that recommends projects be compared to a “business-as-usual” scenario, and that projects should be considered to not have a significant impact if it can be demonstrated to have a 29 percent reduction in GHG emissions from the business-as-usual scenario. The business-as-usual scenario for the proposed Project assumes that there would be no changes to the methods used to generate electricity for the State of California. As described in Table 4.8-2, the Project would result in an annual GHG emissions reduction of more than 19,772 metric tons CO2e compared to the business-as-usual scenario, a reduction of more than 99 percent. Therefore, impacts associated with GHG emissions would be less than significant.
Mitigation: None required.
_________________________

4. Environmental Analysis Greenhouse Gas Emissions
McHenry Solar Farm 4.8-10 May 2011 Draft Environmental Impact Report
b) Conflict with an applicable plan, policy, or regulation adopted for the purpose of reducing the emissions of greenhouse gases.
Impact 4.8-2: The Project could conflict with CARB’s Climate Change Scoping Plan. (Less than significant with mitigation)
The Project could conflict with the intent of certain GHG reduction goals set forth in AB 32, including the 39 Recommended Actions identified by CARB in its Climate Change Scoping Plan. Table 4.8-1 presents the 39 Recommended Actions identified to date by CARB in its Climate Change Scoping Plan. Of the 39 measures identified, those that would be considered to be applicable to the Project would primarily be those actions related to transportation, the Renewables Portfolio Standard, and high global warming potential gases. Consistency of the Project with these measures has been evaluated by each source-type measure below:
Scoping Plan Measure T-7: Heavy-Duty Vehicle GHG Emission Reduction (Aerodynamic Efficiency)—Discrete Early Action. This measure will require existing trucks/trailers to be retrofitted with the best available technology and/or CARB-approved technology. This measure has been identified as a Discrete Early Action, which means that it began to be enforceable starting in 2010. Technologies that reduce GHG emissions and improve the fuel efficiency of trucks may include devices that reduce aerodynamic drag and rolling resistance. The requirements would apply to California and out-of-state registered trucks that travel to California. This measure would require in-use trucks and trailers to comply through a phase-in schedule starting in 2010 and achieve 100 percent compliance by 2014. Construction of the Project and the associated use of heavy-duty vehicles for hauling would be expected to be complete by mid-2012; therefore, the potential for the Project to conflict with compliance of this recommended action would be negligible.
Scoping Plan Measure E-3: Renewables Portfolio Standard (RPS). The RPS promotes multiple objectives, including diversifying the electricity supply. Increasing the RPS to 33 percent is designed to accelerate the transformation of the electricity sector, including investment in the transmission infrastructure and system changes to allow integration of large quantities of intermittent solar and wind generation. The Project would add renewable solar-generated energy to the electricity supply; therefore, the Project would be consistent with this recommended action.
Scoping Plan Measure H-6: High Global Warming Potential Gas Reductions from Stationary Sources – SF6 Leak Reduction and Recycling in Electrical Applications. This measure will reduce emissions of SF6 within the electric utility sector and at particle accelerators by requiring the use of best achievable control technology for the detection and repair of leaks and the recycling of SF6. This measure would establish a regulation mandating a performance standard. Utilities and other affected entities would comply by using leak detection and repair (LDAR) abatement equipment to reduce system leakage. The proposed performance standard would mandate and enhance current voluntary federal SF6 recycling standards. The proposed new on-site substation would include installation of a new circuit breaker that would contain SF6. Pursuant to Mitigation Measure 4.8-2 (see below), the Applicant would be required to install a circuit breaker with low SF6 leak rates and monitor the SF6-containing circuit breaker consistent

4. Environmental Analysis Greenhouse Gas Emissions
McHenry Solar Farm 4.8-11 May 2011 Draft Environmental Impact Report
with Scoping Plan Measure H-6. Implementation of Mitigation Measure 4.8-2 would ensure that the Project would not conflict with implementation of Measure H-6.
Regarding potential conflicts with the SJVAPCD CCAP, the Project would result in more than a 99 percent reduction in GHG emissions compared to the business-as-usual scenario (see Impact 4.8-1 discussion, above), considerably more than the 29 percent reduction needed to be consistent with the SJVAPCD CCAP. Therefore, the Project would be considered to be consistent with the SJVAPCD CCAP and would in fact provide a meaningful benefit regarding the state’s goals for reducing the emissions of greenhouse gases.
Mitigation Measure 4.8-2: Low SF6 Leak Rate Circuit Breaker and Monitoring. The Applicant shall ensure that the circuit breaker installed at the proposed new substation has a guaranteed SF6 annual leak rate of no more than 0.5 percent by volume. The Applicant shall provide MID with documentation of compliance, such as specification sheets, prior to installation of the circuit breaker. In addition, the Applicant shall monitor the SF6-containing circuit breaker at the substation consistent with Scoping Plan Measure H-6 for the detection and repair of leaks.
Significance after Mitigation: Less than Significant.
4.8.5 Alternatives
4.8.5.1 Reduced Project Alternative
If the Reduced Project Alternative is implemented, construction, operation and maintenance, and decommissioning activities would result in less than 10 percent fewer GHG emissions compared to the GHG emissions that would result from the proposed Project. Therefore, like the proposed Project, impacts from GHG emissions for the Reduced Project Alternative would be less than significant. However, the long-term benefit from emission reductions would also be approximately 10 percent less compared to the Project.
4.8.5.2 Non-Agriculture Site Alternative
Given the global nature of the effects of GHG emissions and that policies, regulations, and recommendations related to GHG emissions tend to be developed on the state, local, and air district level, the air quality setting described above in Section 4.8.1, Setting, is also applicable to this alternative site because it is also located in Stanislaus County and within the SJVAPCD.
If the Non-Agriculture Site Alternative is implemented, short-term solar farm construction and decommissioning activities would result in approximately 20 percent of the GHG emissions compared to the construction and decommissioning emissions that would result from the proposed Project. However, if this alternative is implemented, existing buildings and other facilities at this site would need to be demolished and removed from the site prior to construction. In addition, approximately 1.25 miles of existing distribution line poles would be removed and

4. Environmental Analysis Greenhouse Gas Emissions
McHenry Solar Farm 4.8-12 May 2011 Draft Environmental Impact Report
replaced with taller poles to support the 1.25 miles of sub-transmission line that would be required for this alternative. Therefore, the Non-Agriculture Site Alternative would be expected to result in similar overall construction-related GHG emissions compared to the proposed Project and the impacts would be less than significant. However, long-term emission reductions would also be approximately 20 percent of those that would occur with the Project, thus providing a substantially reduced benefit in meeting the state’s goals for reduction of GHGs.
4.8.5.3 No Project Alternative
If the No Project Alternative is implemented, short-term construction and decommissioning activities and long-term operation that would occur if the Project is implemented would not occur and the associated emissions and emission reduction would not be generated. The No Project Alternative would result in the continued long-term adverse impact associated with annual GHG emissions compared to implementation of the proposed Project.
References – Greenhouse Gas Emissions California Air Resources Board (CARB), 2007. Expanded List of Early Action Measures to
Reduce Greenhouse Gas Emissions in California Recommended for Board Consideration. September, 2007.
CARB, 2009. Climate Change Scoping Plan. Written, December, 2008. Released, January, 2009.
California Climate Action Registry (CCAR), 2009. General Reporting Protocol, Reporting Entity-Wide Greenhouse Gas Emissions, Version 3.1, January 2009.Tables C.4 and C.7.
California Energy Commission (CEC), 2005. California's Water – Energy Relationship Prepared in Support of the 2005 Integrated Energy Policy Report Proceeding, Final Staff Report, November 2005 (CEC-700-2005-011-SF) Table C-6, page 118.
IPCC, 2001. Climate Change 2001: Synthesis Report. Available at: http://www.ipcc.ch/ipccreports/tar/vol4/english/010.htm. Accessed January, 2011.
San Joaquin Valley Air Pollution Control District (SJVAPCD), 2011. Climate Change Action Plan webpage (http://www.valleyair.org/programs/CCAP/CCAP_menu.htm), accessed March 1, 2011.
U.S. Environmental Protection Agency (USEPA), 2006. SF6 Leak Rates from High Voltage Circuit Breakers – U.S. EPA Investigates Potential Greenhouse Gas Emissions Source. IEEE Power Engineering Society General Meeting, Montreal, Quebec, Canada, June 2006.
USEPA, 2009, Federal Register, 40 CFR Parts 86, 87, 89 et al. Mandatory Reporting of Greenhouse Gases; Final Rule October 30, 2009.

4. Environmental Analysis
McHenry Solar Farm 4.9-1 May 2011 Draft Environmental Impact Report
4.9 Hazards and Hazardous Materials
This section analyzes hazardous materials and other hazard issues that would be associated with Project construction, operation, maintenance, and decommissioning. The term “hazardous material” is defined by law as any material that, because of quantity, concentration, or physical or chemical characteristics, poses a significant present or potential hazard to human health and safety or to the environment.1 The issues evaluated in this section include the potential to encounter hazardous materials in soil and groundwater resulting from past uses and the potential for Project-related equipment to leak hazardous materials. This section also discusses the potential for the Project to impair emergency response or evacuation plans and the risk of wildland fires. The physical and regulatory setting, baseline for determining environmental impacts, and criteria used for determining the significance of such impacts are discussed below.
4.9.1 Setting
4.9.1.1 Regional and Local Setting
Section 2.2, Project Location and Existing Land Use, provides general information about the regional and local setting. This section provides setting information specific to hazards and hazardous materials in the Project area. The current land use within the Project site is agricultural with row cropping, irrigation facilities, and related access roads and staging areas. There are no schools within 0.25 mile of the Project site and there are no airports within 2 miles of the Project site. The Project site is in the dam inundation area for the New Melones Reservoir (Stanislaus County, 2005) and is in an area that has a low fire hazard severity due to the irrigated agricultural land on and in the vicinity of the Project site (SCFPD, 2011).
According to the landowner, the Project site has been in agricultural use for at least the past 30 years. Hazardous materials use at the site is therefore expected to be limited to those common to agricultural uses, such as pesticides, fertilizers, and fuels for farming equipment. Subsurface soil or groundwater contamination related to hazardous material use is present in isolated commercial and light industrial properties throughout the region, and is discussed below.
In January 2011, Environmental Data Resources (EDR), Inc. conducted a review of regulatory agency databases for the Project site and its vicinity to inventory sites of past hazardous materials releases (EDR, 2011) (see Appendix C). The database search included over 50 federal, state, and local agency lists for hazardous waste cleanup sites, leaking underground storage tank sites, landfills, hazardous waste generators, and sites registered to use or store hazardous materials within varying radii of the Project site. The EDR database review was supplemented with a review of the online database, Geotracker, which is maintained by the State Water Resources Control Board (SWRCB, 2011). The regulatory agency database reviews did not identify any known hazardous materials release sites at the Project site or in the vicinity of the Project site. The EDR database search identified two sites: one listed as having known laboratory waste, the
1 California Health and Safety Code, Chapter 6.95, Section 25501(o).

4. Environmental Analysis Hazards and Hazardous Materials
McHenry Solar Farm 4.9-2 May 2011 Draft Environmental Impact Report
other included an unidentified hazard. These sites are located more than 3 miles from the Project site and would not affect soil or groundwater conditions at the Project site.
With regard to naturally occurring asbestos, the Department of Conservation, Division of Mines and Geology published a guide entitled A General Location Guide for Ultramafic Rocks in California - Areas More Likely to Contain Naturally Occurring Asbestos (DOC, 2000) for generally identifying areas that are likely to contain naturally occurring asbestos. According to that Guide, rock formations that contain naturally occurring asbestos are known to be present in 44 of California’s 58 counties, including Stanislaus County.
Within the Guide, a map containing areas likely to have rock formations containing naturally occurring asbestos indicates that the Project site is not in an area that is likely to contain naturally occurring asbestos. As noted in the Guide, the map shows only the general location of formations containing naturally occurring asbestos and may not show all potential occurrences. Within Stanislaus County, however, most of the naturally occurring asbestos is in the areas to the west (near Santa Clara County) or the east (near Calaveras and Tuolumne counties). Therefore, naturally occurring asbestos is not a considered a significant environmental concern for the Project site and is not addressed further in this EIR.
4.9.1.2 Regulatory Setting
Federal and State
Hazardous Materials and Waste Handling
The federal Resource Conservation and Recovery Act of 1976 (RCRA) established a “cradle-to-grave” regulatory program governing the generation, transportation, treatment, storage, and disposal of hazardous waste. Pursuant to RCRA, individual states may implement their own hazardous waste programs in lieu of RCRA as long as the state program is at least as stringent as federal RCRA requirements. In California, the Department of Toxic Substances Control (DTSC) regulates the generation, transportation, treatment, storage, and disposal of hazardous material waste. The hazardous waste regulations establish criteria for identifying, packaging, and labeling hazardous wastes; dictate the management of hazardous waste; establish permit requirements for hazardous waste treatment, storage, disposal, and transportation; and identify hazardous wastes that cannot be disposed of in landfills.
Chapter 6.95 of the Health and Safety Code establishes minimum statewide standards for Hazardous Materials Business Plans, which are required to be prepared by businesses that handle hazardous materials. Hazardous Materials Business Plans describe hazardous materials inventory information, storage and secondary containment facilities, emergency response and evacuation procedures, and employee hazardous materials training programs.
Hazardous Materials Transportation
The U.S. Department of Transportation regulates hazardous materials transportation on all interstate roads. Within California, the state agencies with primary responsibility for enforcing

4. Environmental Analysis Hazards and Hazardous Materials
McHenry Solar Farm 4.9-3 May 2011 Draft Environmental Impact Report
federal and state regulations and for responding to transportation emergencies are the California Highway Patrol (CHP) and the California Department of Transportation (Caltrans). Together, federal and state agencies determine driver-training requirements, load-labeling procedures, and container specifications. Although special requirements apply to transporting hazardous materials, requirements for transporting hazardous waste are more stringent, and hazardous waste haulers must be licensed to transport hazardous waste on public roads.
Worker Safety
Occupational safety standards exist in federal and state laws to minimize worker safety risks from both physical and chemical hazards in the workplace. The California Division of Occupational Safety and Health (Cal-OSHA) and the federal Occupational Safety and Health Administration are the agencies responsible for assuring worker safety in the workplace. Cal-OSHA assumes primary responsibility for developing and enforcing standards for safe workplaces and work practices within the state. At sites known to be contaminated, a site safety plan must be prepared to protect workers. The site safety plan establishes policies and procedures to protect workers and the public from exposure to potential hazards at the contaminated site.
Emergency Response
California has developed an emergency response plan to coordinate emergency services provided by federal, state, and local government and private agencies. Responding to hazardous materials incidents is one part of this plan, as is responding to intentional acts of destruction. Another part involves development of a downstream evacuation plan for areas within potential inundation areas. In Stanislaus County, the Plan is administered by the Stanislaus County Office of Emergency Services (OES). This office provides preparedness before and coordination direction during large-scale emergencies and disasters. The Stanislaus County OES coordinates with partner agencies including nine cities, special districts, and key private agencies in providing planning, response, recovery, and mitigation activities as a result of disaster related incidents.
Aviation Hazards
Federal Aviation Administration (FAA) Regulations Part 77 (14 CFR 77) establish standards for what constitutes an obstruction to navigable airspace. Obstructions include any object if it is: (1) 500 feet above ground level; (2) 200 feet above ground level or above the established airport elevation, whichever is higher, within 3 nautical miles of an airport; and (3) above a height within a terminal obstacle clearance area or en route obstacle clearance area. In addition, California Public Utilities Code Section 21659 prohibits airspace hazards near airports (as defined by 14 CFR 77) unless a permit allowing the construction is issued by the Caltrans Division of Aeronautics.
Stanislaus County The Stanislaus County General Plan contains goals, policies, and implementation measures that could be applicable to the Project. For example, the Safety Element discusses fire hazards, hazardous materials, and other safety hazards and ways in which the county intends to reduce the risks of these hazards (Stanislaus County, 2008). The Stanislaus County Hazardous Waste Management Plan addresses transportation of hazardous wastes, cleanup of contaminated sites, and

4. Environmental Analysis Hazards and Hazardous Materials
McHenry Solar Farm 4.9-4 May 2011 Draft Environmental Impact Report
emergency response procedures. The Plan also recommends a series of goals, policies, and implementation actions to manage hazardous waste throughout the county (Stanislaus County, 2008). The Health and Safety chapter of the Stanislaus County Code contains ordinances to prevent harm to persons and property within the county boundaries (Stanislaus County, 2011a). None of the ordinances listed in the County Code appear to be directly applicable to the proposed Project.
In addition, the Hazardous Materials Division of the Stanislaus County Department of Environmental Resources conducts routine inspections at businesses required to submit Business Plans (Stanislaus County, 2011b).
The Stanislaus County OES has developed the Multi-Jurisdictional Hazard Mitigation Plan, which is a countywide plan that identifies risks posed by disasters, and identifies ways to minimize damage from those disasters. The plan is a comprehensive resource document that serves many purposes, including enhancing public awareness and understanding, creating a decision tool for management, promoting compliance with state and federal program requirements, enhancing local policies for hazard mitigation capability, and providing inter-jurisdictional coordination. An implementation strategy of the plan relative to dam inundation hazard is for the Stanislaus County OES to continue to work with other jurisdictions to develop evacuation routes to be used in case of dam failure (Stanislaus County, 2005; p. 74). The plan identifies State Routes 99, 108, 120, 33, 132, and Interstate 5 as routes that would be used during an emergency evacuation (Stanislaus County, 2005; p. 7).
4.9.1.3 Baseline
The environmental setting described above constitutes the baseline for determining the significance of potential impacts on hazards and hazardous materials. It consists of the actual pre-Project physical environmental conditions on the Project site. With respect to the Project area, baseline conditions include the hazardous materials that are used in the maintenance of the existing on-site agricultural field. Agricultural drainage can carry varying amounts of salts, nutrients, pesticides, trace metals, sediments, and other by-products to surface and ground waters. Lubricants and oils are also used for farming equipment, and must be replenished periodically. Although the existing Project site has not been identified on any regulatory agency list of known hazardous materials releases, the potential exists that minor spills during routine farming practices and equipment maintenance have occurred in the past and may affect local soil conditions.
4.9.2 Significance Criteria Based on CEQA Guidelines Appendix G, a project would cause a significant impact on hazards and hazardous materials if it would:
a) Create a significant hazard to the public or the environment through the routine transport, use, or disposal of hazardous materials;
b) Create a significant hazard to the public or the environment through reasonably foreseeable upset and accident conditions involving the release of hazardous materials into the environment;

4. Environmental Analysis Hazards and Hazardous Materials
McHenry Solar Farm 4.9-5 May 2011 Draft Environmental Impact Report
c) Emit hazardous emissions or handle hazardous or acutely hazardous materials, substances, or waste within 0.25 mile of an existing or proposed school;
d) Be located on a site which is included on a list of hazardous materials sites compiled pursuant to Government Code Section 65962.5 and, as a result, would it create a significant hazard to the public or the environment;
e) For a project located within an airport land use plan or, where such a plan has not been adopted, within two miles of a public airport or public use airport, would the project result in a safety hazard for people residing or working in the project area;
f) For a project within the vicinity of a private airstrip, would the project result in a safety hazard for people residing or working in the project area;
g) Impair implementation of or physically interfere with an adopted emergency response plan or emergency evacuation plan; or
h) Expose people or structures to a significant risk of loss, injury or death involving wildland fires, including where wildlands are adjacent to urbanized areas or where residences are intermixed with wildlands.
4.9.3 Discussion of Criteria with No Hazards and Hazardous Materials Impacts
Analysis of the setting and Project characteristics relative to the significance criteria indicate that the Project would have no impact related to hazards and hazardous materials with respect to criteria c), d), e), f), g), or h). The reasoning to support this conclusion follows.
c) The Project would not emit hazardous emissions or handle hazardous or acutely hazardous materials, substances, or waste within 0.25 mile of an existing or proposed school.
There are no existing or proposed schools within 0.25 mile of the Project site. Therefore, the Project would have no impact with regard to criterion c).
d) The Project would not be located on a site which is included on a list of hazardous material sites compiled pursuant to Government Code Section 65962.5 and, as a result, would it create a significant hazard to the public or the environment.
Based upon review of database searches of regulatory agency lists, the Project site is not located on a listed hazardous materials site (EDR, 2011). Therefore, the Project would have no impact with regard to criterion d).
e) For a project located within an airport land use plan or, where such a plan has not been adopted, within two miles of a public airport or public use airport, would the project result in a safety hazard for people residing or working in the project area.
The nearest airport (i.e., Modesto Municipal Airport) is approximately 8 miles from the Project site and its Land Use Plan does not include the Project site. Therefore, the Project would have no impact with regard to criterion e).

4. Environmental Analysis Hazards and Hazardous Materials
McHenry Solar Farm 4.9-6 May 2011 Draft Environmental Impact Report
f) The Project would not be located within the vicinity of a private airstrip, and would not result in a safety hazard for people residing or working in the project area.
There are no existing private airstrips in the vicinity of the Project site. Therefore, the Project would have no impact with regard to criterion f).
g) Project construction or operation would not impair implementation of or physically interfere with an adopted emergency response plan or emergency evacuation plan.
The Stanislaus County Multi-Jurisdictional Hazard Mitigation Plan identifies an implementation strategy to develop evacuation routes to be used in case of dam failure. The plan identifies State Routes 99, 108, 120, 33, 132, and Interstate 5 as routes that would be used during an emergency evacuation. State Route 108 (also known as Patterson Road in the Study Area) is along the southern perimeter of the Project site; however, Project construction, operation and maintenance, or decommissioning would not interfere with an emergency evacuation along State Route 108. Therefore, the Project would have no impact with regard to criterion g).
h) The Project would not expose people or structures to a significant risk of loss, injury or death involving wildland fires, including where wildlands are adjacent to urbanized areas or where residences are intermixed with wildlands.
The Project site includes and is surrounded by irrigated agricultural land. There are no wildlands in the immediate vicinity of the Project site. Therefore, the Project would have no impact with regard to criterion h).
4.9.4 Impacts and Mitigation Measures
a) Create a significant hazard to the public or the environment through the routine transport, use, or disposal of hazardous materials
Impact 4.9-1: Project construction, decommissioning, and operation/maintenance could create a hazard to the public or the environment through the routine transport, use, or disposal of hazardous materials. (Less than significant)
Construction and decommissioning of the Project would involve the use of hazardous materials, such as fuels and greases to fuel and service construction equipment. Such substances may be stored in temporary aboveground storage tanks or sheds located on the Project site. The fuels stored on-site would be in a locked container within a fenced and secure temporary staging area. Trucks and construction equipment would be serviced at off-site facilities. The use, storage, transport, and disposal of hazardous materials used during construction of the Project would be carried out in accordance with federal, state, and county regulations. No extremely hazardous substances (i.e., those governed pursuant to Title 40, Part 335 of the Code of Federal Regulations) are anticipated to be produced, used, stored, transported, or disposed of as a result of Project construction. Material Safety Data Sheets for all applicable materials present on-site would be made readily available to on-site personnel, as required by the Stanislaus County Environmental Health Services Department. Based on the substances that would be used and compliance with federal, state, and county regulations, this impact would be less than significant.

4. Environmental Analysis Hazards and Hazardous Materials
McHenry Solar Farm 4.9-7 May 2011 Draft Environmental Impact Report
Operation and maintenance of the Project is not expected to require hazardous materials or to generate hazardous waste. There would be 1 substation transformer and up to 25 other step-up transformers that would include the use of biodegradable seed oil, which is not considered to be a hazardous material. The proposed oil is approved for use in indoor or outdoor equipment installations and is readily biodegradable. Because it is a seed-oil based fluid, it can be differentiated from mineral oil regulation pursuant to the Edible Oil Regulatory Reform Act: Public Law 104-55. Oil disposal would occur in accordance with applicable regulations. PV panels and inverters would produce no waste during operation. Because of the type of transformer fluid that would be used, long-term operational impacts would be less than significant.
Mitigation: None required.
b) Create a significant hazard to the public or the environment through reasonably foreseeable upset and accident conditions involving the release of hazardous materials into the environment
Impact 4.9-2: The Project could result in an accidental spill or leak during construction or decommissioning that could release hazardous materials into the environment. (Less than significant with mitigation)
Construction and decommissioning of the Project would involve the use of heavy construction equipment, which would use hazardous materials such as oils, fuels, and other potentially flammable substances that are typically associated with construction activities. Use of such hazardous materials would include a risk of an accidental spill or leak of the materials into the environment.
As described in the MID 2006 PEIR Update (2006 PEIR Update; pp. 12-2 to 12-3), MID construction workers are trained to address spills of hazardous materials. Essentially these actions involve spill containment and notification of MID’s spill response group. All group employees are trained in emergency spill response. In the event of a more extensive fuel or other spill, MID would implement its existing hazardous materials spill plan. MID is experienced in handling electrical equipment and associated hazardous materials, maintains employee training in spill containment and cleanup, and maintains a hazardous spill response trailer equipped with adsorbent materials and other cleanup equipment. Although a spill during installation of the sub-transmission and distribution lines, fiber optic cable, and the switchyard and control building for this Project is unlikely, MID is prepared to appropriately respond. Spills would be reported to appropriate authorities when required by law. Contaminated soil and/or cleanup materials would be transported to an appropriate disposal site. As a result, no significant hazardous materials impacts are likely to occur as a result of MID’s construction and decommissioning activities.
With regard to the Applicant’s construction and decommissioning activities, implementation of Mitigation Measure 4.9-2 would reduce this temporary impact related to potential spill or leak risk on the surrounding environment to a less-than-significant level.

4. Environmental Analysis Hazards and Hazardous Materials
McHenry Solar Farm 4.9-8 May 2011 Draft Environmental Impact Report
Mitigation Measure 4.9-2: Accidental Spill Prevention and Response Plan. The Applicant shall prepare an Accidental Spill Prevention and Response Plan for construction and decommissioning activities for review and approval by MID. The Plan shall identify measures to prevent accidental spills from leaving the site and methods for responding to and cleaning up spills to limit the amount of materials released into the environment. Such measures shall include, but not be limited to, ensuring that absorbent material, tarps, storage drums, and other emergency spill supplies and equipment are kept at the Project site at all times.
Significance after Mitigation: Less than Significant.
4.9.5 Alternatives
4.9.5.1 Reduced Project Alternative
The Reduced Project Alternative would have similar impacts to the proposed Project related to construction and decommissioning because this alternative would be a smaller version of the proposed Project at the same site and using the same PV technology, and the same mitigation measure would be implemented to reduce the potential for spills to occur and to manage spills that do occur. Its difference is that this alternative would have a larger setback distance from McHenry Avenue and Patterson Road. Similar to the proposed Project, the Reduced Project Alternative would be farther than 3 miles from any hazardous site identified in the regulatory database searches, it would not be within 0.25 mile of an existing or proposed school, and would not be within 2 miles of a public airport. The Reduced Project Alternative would create a less-than-significant hazard to the public and the environment through the routine transport, use, or disposal of hazardous materials. The Reduced Project Alternative would also create a less-than-significant impact with mitigation related to an inadvertent release during construction of hazardous materials into the environment. Overall, impacts regarding hazards and hazardous materials would be essentially the same for this alternative as for the proposed Project.
4.9.5.2 Non-Agriculture Site Alternative
The site for this alternative is a former industrial site with existing buildings and infrastructure. The site is known as the Former Shell Lab Site. Review of the SWRCB online database, Geotracker, indicates that the Former Shell Lab Site is an open Cleanup Program Site related to contamination of groundwater by non-specified contaminants. The site is currently undergoing verification monitoring (SWRCB, 2011). Verification monitoring means that remediation phases are essentially complete and a monitoring/sampling program is occurring to confirm successful completion of cleanup at the site. The outdoor activity area associated with Joseph Gregori High School is approximately 100 feet from the Non-Agricultural Site Alternative boundary. The nearest buildings associated with the school are approximately 1,300 feet east of the site boundary.
The Non-Agriculture Site Alternative, including construction of the related sub-transmission line and fiber optic cable, would create a less-than-significant hazard to the public and the

4. Environmental Analysis Hazards and Hazardous Materials
McHenry Solar Farm 4.9-9 May 2011 Draft Environmental Impact Report
environment through the routine transport, use, or disposal of hazardous materials and it would also create a less-than-significant impact with mitigation during construction related to an inadvertent spill or leak of hazardous materials into the environment. These impacts would be similar to those for the proposed Project site.
Construction of the Non-Agriculture Site Alternative would have a much greater potential for disturbing previously unknown hazardous materials, when compared to the proposed Project. Former activities at the site likely included the use of hazardous materials such as fuels, solvents, and other refined petroleum products. If leaks or spills have occurred during that operation and unanticipated areas of contamination are encountered during demolition of existing on-site facilities prior to starting Project construction, Project construction workers and the environment could be exposed to the contamination. There is also the potential for students at Joseph Gregori High School, which is located immediately east of the site, to be exposed to the contamination. With implementation of the following Mitigation Measure, this impact related to potential disturbance of previously unknown hazardous materials would be reduced to a less-than-significant level.
Mitigation Measure 4.9-ALT 1: If the Non-Agriculture Site Alternative is implemented, the Applicant shall prepare and implement a Site-Specific Contamination Identification, Management, and Contingency Plan through coordination with the SWRCB. The plan shall identify a field sampling strategy designed to characterize any existing unidentified contamination at the site prior to the commencement of construction activities, and shall identify the administrative and engineering measures necessary to avoid exposures to workers and off-site receptors.
4.9.5.3 No Project Alternative
If the No Project Alternative is implemented, the proposed Project would not be implemented. It is expected that there would be no change at the Project site relative to its current agricultural practices, and expected current use of pesticides, fertilizers, and fuels for farming equipment. No change regarding existing on-site hazards or potential use of hazardous materials is expected.
References – Hazards and Hazardous Materials Cooper Power Systems, 2011. “Envirotemp® FR3™ Fire-Resistant Fluid.” Available at:
http://www.cooperpower.com/products/dielectric/envirotempFR3/. Accessed February 15, 2011.
Department of Conservation (DOC), Division of Mines and Geology, 2000. A General Location Guide for Ultramafic Rocks in California - Areas More Likely to Contain Naturally Occurring Asbestos. August 2000. Available at: ftp://ftp.consrv.ca.gov/pub/dmg/pubs/ofr/ofr_2000-019.pdf
Environmental Data Resources, Inc. (EDR), 2011. Radius Map™ Report with GeoCheck® for the McHenry Solar Farm Project, Inquiry Number: 2957885.1s, January 03, 2011.

4. Environmental Analysis Hazards and Hazardous Materials
McHenry Solar Farm 4.9-10 May 2011 Draft Environmental Impact Report
Stanislaus County, 2008. 1994 Stanislaus County General Plan, rev. December 2008.
Stanislaus Consolidated Fire Protection District (SCFPD), 2011. Personal Communication with Mayotte, Stephen, February 4, 2011.
Stanislaus County, 2011a. Stanislaus County Code of Ordinances. Revised January 2011.
Stanislaus County, 2011b. Hazardous Materials webpage. Available at: http://www.co.stanislaus.ca.us/er/hazardous-materials.shtm. Accessed February 4, 2011.
Stanislaus County, 2005. Multi-Jurisdictional Hazard Mitigation Plan, Revised July 2005.
State Water Resources Control Board (SWRCB). Geotracker website. Available at: https://geotracker.waterboards.ca.gov/map/?CMD=runreport&myaddress=mchenry+avenue%2C+del+rio%2C+ca. Accessed January 20, 2011

4. Environmental Analysis
McHenry Solar Farm 4.10-1 May 2011 Draft Environmental Impact Report
4.10 Hydrology and Water Quality
This section identifies and evaluates issues related to Hydrology and Water Quality in the context of the Project and alternatives. Discussed are the physical and regulatory setting; the baseline for determining environmental impacts; the criteria used for determining the significance of environmental impacts; potential impacts associated with construction, operation, maintenance, and decommissioning of the Project; and mitigation measures to reduce or avoid environmental impacts determined to be potentially significant.
4.10.1 Setting
4.10.1.1 Regional and Local Setting
Section 2.2, Project Location and Existing Land Use, provides general information about the regional and local setting. This section provides setting information specific to Hydrology and Water Quality.
Climate and Precipitation The average annual precipitation of San Joaquin Valley is five to 12 inches (125 to 305 millimeters), with the higher amounts occurring at higher elevation locations on the edge of the valley (such as the Project area) (NRCS, 2006). The climate is warm during the summer with temperatures around 70 degrees F and highs in the 90 degrees F. Winters are cool with temperatures typically around 50 degrees F. Most of the rainfall occurs as low or moderate intensity Pacific frontal storms from October to May. The average annual low temperature is 51 degrees F to an average annual high of 75 degrees F (15 to 20 degrees C), decreasing from south to north. The freeze-free period averages 325 days and ranges from 280 to 365 days, decreasing in length with elevation and from south to north (NRCS, 2006).
Surface Water Hydrology The major surface water features in the vicinity of the Project area are the Lower Stanislaus River, located less than one mile northwest of the site, and the Modesto Main Canal, which crosses Patterson Road to the east and McHenry Road to the south. Ables Drain is aligned east from the Modesto Main Canal and across McHenry Road. The Lower Stanislaus River is a natural river course that drains the west slopes of the Sierra Nevada, eventually meeting the San Joaquin River to the west. The Modesto Main Canal and Ables Drain are constructed water conveyances that bring water from the Tuolumne River to the Modesto area for agricultural irrigation. There are no rivers, creeks, canals, wetlands, or riparian habitats within the Project site, but surface water may pond during periods of high precipitation in minor depressions and within a shallow swale that rims the perimeter of the Project site. In this area of the county, there are very few constructed storm drain facilities or outlets, and stormwater is typically handled by field percolation. Typically, if stormwater exceeds infiltration capacity in this area, runoff flows to roadside ditches (Stanislaus County, 2004). Due to the flat topography and the well-drained

4. Environmental Analysis Hydrology and Water Quality
McHenry Solar Farm 4.10-2 May 2011 Draft Environmental Impact Report
nature of the underlying soils at the Project site, stormwater flows are likely to consist of sheet flow (i.e., not concentrated in channels) and would likely be contained within the Project site.
Surface Water Quality The primary surface water quality problem in the San Joaquin Valley occurs as a result of return flows from irrigated agriculture. Agricultural drainage, depending on management and location, carries varying amounts of salts, nutrients, pesticides, trace elements, sediments, and other by-products to surface waters and groundwater. To a lesser degree, return water from domestic and industrial wastes have resulted in water quality that is somewhat deteriorated as the Stanislaus River flows through the San Joaquin Valley toward its confluence with the San Joaquin River. The Central Valley Regional Water Quality Control Board (CVRWQCB) is responsible for the protection of water quality and beneficial uses of waters within Stanislaus County, including the Project area. The CVRWQCB has identified several water quality impairments for the Stanislaus River, including diazinon, chlorpyrifos (an insecticide), and “group A” pesticides from agricultural sources; mercury from historic resource extraction in the Sierra Nevada; and toxicity and temperature of unknown origin (CVRWQCB, 2009). Regulatory frameworks, standards, and management actions regarding water quality in the Study Area (i.e., the groundwater basin and watershed) are discussed in further detail below.
Groundwater Hydrology The Project site is located in the Modesto subbasin of the San Joaquin Groundwater basin. Both consolidated and unconsolidated sedimentary deposits form the primary water-bearing geologic formations of the subbasin. The Project site is underlain by older continental deposits that yield groundwater under primarily unconfined conditions, although at greater depths, groundwater may become semi-confined due to the occurrence of overlying clay layers of low permeability. Regionally, groundwater is thought to flow primarily to the southwest, although the presence of the Lower Stanislaus River may locally influence the direction of groundwater flow (DWR, 2004).
Groundwater is the major source of domestic and industrial water in Stanislaus County, and is used as a supplemental water supply for irrigation. Fluctuations in demands on groundwater have influenced groundwater levels, particularly near wells that draw groundwater for municipal supply. A well located a short distance south of the Project site shows that groundwater levels have fluctuated between 40 and 60 feet below the ground surface since the mid-1960s (DWR, 2010). The Project site is in an area considered as a natural groundwater recharge area due to the soil’s ability to freely infiltrate water (Stanislaus County, 2008).
Flood Hazards The Federal Emergency Management Agency (FEMA) administers the National Flood Insurance Program to provide subsidized flood insurance for those communities that comply with FEMA regulations. The Project site is not located in a 100-year or 500-year FEMA flood hazard zone, indicating that flooding from nearby watercourses is highly unlikely (FEMA, 2008). However, the Project is located in the dam failure inundation zone for the New Melones Dam (OEM, 2007). The New Melones Dam, located over 30 miles northeast of the Project site, plus improvements

4. Environmental Analysis Hydrology and Water Quality
McHenry Solar Farm 4.10-3 May 2011 Draft Environmental Impact Report
made to other flood control facilities in the Stanislaus County area have significantly reduced local natural flood hazards. However, if breached, the dam might cause flooding of significance to the Project area.
4.10.1.2 Regulatory Setting
Federal The federal statute that governs the activities associated with the Project that affect water quality is the federal Clean Water Act (CWA) (33 U.S.C. Section 1251). The Clean Water Act (CWA) establishes the basic structure for regulating discharges of pollutants into the waters of the United States and regulating quality standards for surface waters. The basis of the CWA was enacted in 1948 and was called the Federal Water Pollution Control Act, but the Act was significantly reorganized and expanded in 1972. The "Clean Water Act" became the Act's common name.
The federal CWA gives states the primary responsibility for protecting and restoring surface water quality and for issuance of National Pollutant Discharge Elimination System (NPDES) permits, as necessary.
State
Porter-Cologne Water Quality Control Act The Porter-Cologne Water Quality Control Act (Porter-Cologne) (Water Code Section 13000 et seq.) is the primary water quality control law for California. It is implemented by the State Water Resources Control Board (SWRCB) and nine Regional Water Quality Control Boards (RWQCBs). The California Legislature has assigned the primary responsibility to administer and enforce statutes for the protection and enhancement of water quality to the SWRCB and its nine RWQCBs. The SWRCB provides state-level coordination of the water quality control program by establishing statewide policies and plans for the implementation of state and federal regulations. The nine RWQCBs throughout California adopt and implement water quality control plans that recognize the unique characteristics of each region with regard to natural water quality, actual and potential beneficial uses, and water quality problems. The RWQCB adopts and implements a Water Quality Control Plan (hereinafter Basin Plan) that designates beneficial uses, establishes water quality objectives, and contains implementation programs and policies to achieve those objectives for all waters addressed through the plan (California Water Code Section 13240-13247).
The SWRCB establishes statewide policy for water quality control and provides oversight of the RWQCBs’ operations. The RWQCBs have jurisdiction over specific geographic areas that are defined by watersheds. Stanislaus County is under the jurisdiction of the CVRWQCB. In addition to other regulatory responsibilities, the RWQCBs have the authority to conduct, order, and oversee investigation and cleanup where discharges or threatened discharges of waste to waters of the state1 could cause pollution or nuisance, including impacts to public health and the environment.
1 “Waters of the state” are defined in the Porter-Cologne Act as “any surface water or groundwater, including saline
waters, within the boundaries of the state.” (Water Code Section 13050 (e)).

4. Environmental Analysis Hydrology and Water Quality
McHenry Solar Farm 4.10-4 May 2011 Draft Environmental Impact Report
Beneficial Use and Water Quality Objectives (CWA Section 303)
The CVRWQCB is responsible for the protection of the beneficial uses of waters within Stanislaus County and the Study Area. The CVRWQCB uses its planning, permitting, and enforcement authority to meet this responsibility and has adopted a Basin Plan for the Sacramento River and the San Joaquin River Basins to implement plans, policies, and provisions for water quality management. The CVRWQCB published the fourth edition of the Basin Plan in September 1998, having last revised it in 2009 to include approved amendments (CVRWQCB, 2009).
In accordance with state policy for water quality control, the CVRWQCB uses a range of beneficial use definitions for surface waters, groundwater basins, marshes, and mudflats that serve as the basis for establishing water quality objectives and discharge conditions and prohibitions. The Basin Plan has identified beneficial uses supported by the key surface water drainages throughout its jurisdiction (CVRWQCB, 2009). Table 4.10-1 identifies beneficial uses designated in the Basin Plan for the surface water and groundwater bodies relevant to the Study Area. Table 4.10-2 defines the applicable beneficial use categories. The Basin Plan also includes water quality objectives that are protective of the identified beneficial uses; the beneficial uses and water quality objectives collectively comprise the water quality standards for a given region and Basin Plan (CVRWQCB, 2009).
The objective of the federal CWA is “to restore and maintain the chemical, physical, and biological integrity of the nation’s waters.” Pursuant to CWA section 303(d), the State of California is required to develop a list of impaired water bodies that do not meet water quality standards and objectives. For those water bodies failing to meet standards, states are required to establish total maximum daily loads (TMDL). A TMDL defines how much of a specific pollutant a given water body can tolerate and still meet relevant water quality standards. The Lower Stanislaus River is listed as impaired with several pollutants, but no United States Environmental Protection Agency (USEPA)-approved TMDLs have been completed to date.
Construction Stormwater NPDES Permit Section 402 of the CWA prohibits discharges of stormwater from construction projects unless the discharge is in compliance with a NPDES permit. The SWRCB, the permitting authority in California, adopted a Statewide General Permit for Stormwater Discharges Associated with Construction Activity (Order No. 2009-0009) that encompasses construction sites that include one or more acres of soil disturbance. Construction activity includes clearing, grading, grubbing, excavation, stockpiling, and reconstruction of existing facilities involving removal or replacement.
The Construction General Permit requires that the landowner and/or contractor file permit registration documents prior to commencing construction and pay an annual fee. These documents include a notice of intent, risk assessment, site map, stormwater pollution prevention plan (SWPPP), and signed certification statement. The permit specifies a risk-based permitting approach that includes requirements specific to three overall levels of risk, determined based on the potential for the project to cause sedimentation as well as the sensitivity of the receiving water to sedimentation. The three

4. Environmental Analysis Hydrology and Water Quality
McHenry Solar Farm 4.10-5 May 2011 Draft Environmental Impact Report
TABLE 4.10-1 BENEFICIAL USES OF WATERS WITHIN THE STUDY AREA
MU
Na
AG
R
PR
O
IND
PO
W
RE
C-1
RE
C-2
WA
RM
CO
LD
MIG
R
SP
WN
WIL
D
Surface Water Stanislaus River (Goodwin Dam to San Joaquin River)
P E E E E E E E E E
Groundwater All Groundwaters X X X X
E = Existing Beneficial Uses P = Potential Beneficial Uses X = Suitable or Potentially Suitable for the Beneficial Use
a Refer to Table 4.10-2, below, for definition of abbreviations SOURCE: CVRWQCB, 2009.
TABLE 4.10-2 DEFINITIONS OF BENEFICIAL USES OF SURFACE WATERS
Beneficial Use Description
Municipal and Domestic Supply (MUN)
Uses of water for community, military, or individual water supply systems including, but not limited to, drinking water supply.
Agricultural Supply (AGR) Uses of water for farming, horticulture, or ranching including, but not limited to, irrigation, stock watering, or support of vegetation for range grazing.
Industrial Service Supply (IND)
Uses of water for industrial activities that do not depend primarily on water quality including, but not limited to, mining, cooling water supply, hydraulic conveyance, gravel washing, fire protection, or oil well repressurization.
Industrial Process Supply (PRO)
Uses of water for industrial activities that depend primarily on water quality.
Groundwater Recharge (GWR)
Uses of water for natural or artificial recharge or groundwater for purposes of future extraction, maintenance of water quality, or halting of saltwater intrusion into freshwater aquifers.
Water Contact Recreation (REC 1)
Uses of water for recreational activities involving body contact with water, where ingestion of water is reasonably possible. These uses include, but are not limited to, swimming, wading, water-skiing, skin and scuba diving, surfing, white-water activities, fishing, or use of natural hot springs.
Non-Contact Water Recreation (REC 2)
Uses of water for recreational activities involving proximity to water, but not normally involving body contact with water, where ingestion of water is reasonably possible. These uses include, but are not limited to, picnicking, sunbathing, hiking, beachcombing, camping, boating, tidepool and marine life study, hunting, sightseeing, or aesthetic enjoyment in conjunction with the above activities.
Warm Freshwater Habitat (WARM)
Uses of water that support warm water ecosystems including, but not limited to, preservation or enhancement of aquatic habitats, vegetation, fish, or wildlife, including invertebrates.
Wildlife Habitat (WILD) Uses of water that support terrestrial ecosystems including, but not limited to, preservation and enhancement of terrestrial habitats, vegetation, wildlife (e.g., mammals, birds, reptiles, amphibians, invertebrates), or wildlife water and food sources.
SOURCE: CVRWQCB, 2009.

4. Environmental Analysis Hydrology and Water Quality
McHenry Solar Farm 4.10-6 May 2011 Draft Environmental Impact Report
risk levels are used to determine specific numeric action levels and effluent limitations for pH and turbidity, as well as requirements for a rain event action plan, best management practice (BMP) implementation, monitoring, and reporting.
The SWPPP must include measures to ensure that all pollutants and their sources are controlled; non-stormwater discharges are identified and either eliminated, controlled, or treated; site BMPs are effective and result in the reduction or elimination of pollutants in stormwater discharges and authorized non-stormwater discharges; and BMPs installed to reduce or eliminate pollutants after construction are completed and maintained. The SWPPP must demonstrate that calculations and design details, as well as BMP controls for site run-off, are complete and correct. Non-stormwater discharges include those from improper dumping, accidental spills, and leakage from storage tanks or transfer areas. The General Construction Permit specifies minimum BMP requirements for stormwater control based on the risk level of the site. Post-construction stormwater performance standards must be included for sites not covered by a municipal stormwater permit. The standards address water quality, runoff reduction, drainage density, and channel protection requirements for the receiving water.
The permit requires effluent and receiving water monitoring to demonstrate compliance with permit requirements, and corrective action must be taken if these limitations are exceeded. The results of the monitoring and corrective actions must be reported annually to the SWRCB. The Construction General Permit specifies minimum qualifications for a qualified SWPPP developer and qualified SWPPP practitioner.
Stanislaus County
General Plan
The Stanislaus County General Plan contains goals, policies, and implementation measures that could be applicable to the Project. For example, the Conservation/Open Space Element includes policies to conserve and protect water resources and avoid significant loss of life and property due to floods and other water-related hazards. Generally, policies related to disturbance of rivers, creeks, and riparian habitats are not relevant to the Project because there are no wetlands or watercourses within the Project area. Policies that may be applicable to the Project include:
Policy 5: Protect groundwater aquifers and recharge areas, particularly those critical for the replenishment of reservoirs and aquifers.
Implementation Measure 4. During the project and environmental review process, encourage new development to incorporate water conservation measures to minimize adverse impacts on water supplies. Possible measures include, but are not limited to, low-flow plumbing fixtures, use of reclaimed wastewater for landscaping when feasible, and use of drought-tolerant landscaping. Responsible Departments: Environmental Resources, Building Inspections.
Implementation Measure 5. Continue to implement the landscape provisions of the Zoning Ordinance, which encourage drought-tolerant landscaping and water-conserving irrigation methods. Responsible Departments: Planning Department, Planning Commission, Board of Supervisors.

4. Environmental Analysis Hydrology and Water Quality
McHenry Solar Farm 4.10-7 May 2011 Draft Environmental Impact Report
Implementation Measure 6. During the project and environmental review process, encourage new urban development to be served by community wastewater treatment facilities and water systems rather than by package treatment plants or private septic tanks and wells. Responsible Departments: Planning Department, Environmental Resources, Planning Commission, Board of Supervisors.
Policy 16: Discourage development on lands that are subject to flooding, landslide, faulting or any natural disaster to minimize loss of life and property.
Implementation Measure 2. Development will not be permitted in floodways unless it meets the requirements of Chapter 16.40 of the County Code and is approved by the State Reclamation Board. Responsible Departments: Public Works, Planning Department, Planning Commission, Board of Supervisors.
Implementation Measure 5. The county shall utilize the California Environmental Quality Act (CEQA) process to ensure that development does not occur that would be subject to natural disasters. Responsible Departments: Planning Department, Planning Commission, Board of Supervisors.
County Code
County Well Ordinance. Improper well construction, maintenance, abandonment, or destruction can lead to contamination of groundwater. California Water Code, Section 13801, requires all counties to adopt water well standards in accordance with Department of Water Resources Bulletin No. 74-81: “Water Well Standards: State of California,” and Bulletin No. 74-90: “California Well Standards.” The Stanislaus County well ordinance (Ordinance Code §3- 313, Chapter 9.36) requires any well removal to conform to the California well standards, or more strict provisions. Stanislaus County requires a permit for the removal or destruction of any water well, and requires proper practice and procedures for well sealing so as to avoid cross contamination of groundwater aquifers.
Landscape and Irrigation Standards (Ord. CS 509 (part), 1992). Chapter 21.102 of the Stanislaus County Code prescribes standards of planting and irrigation system design and landscape and irrigation specifications that are conservative of water resources. Provisions of this ordinance include requiring 90 percent of landscaping to consist of drought-tolerant plant species. Plantings should be well-suited to the climate of the region and require minimal water once established in the landscape. Further, irrigation systems must be designed with water conservation in mind (e.g., underground systems to reduce water waste through evaporation).
Stormwater Management and Discharge Control Ordinance (Ord. CS 1047 §1, 2008). The purpose of the Stanislaus County Stormwater Management and Discharge Control Ordinance is to protect and promote the general health welfare and safety of the citizens of unincorporated Stanislaus County by controlling nonstormwater discharges to the stormwater conveyance system from spills, dumping or disposal of materials other than stormwater, and by reducing pollutants in urban stormwater discharges to the maximum extent practicable. This ordinance is intended to assist in the protection and enhancement of the water quality of watercourses, water bodies and wetlands in a manner pursuant to and consistent with the Federal Clean Water Act (33 U.S.C. Sections 1251 et seq.) and any subsequent amendments thereto, by reducing pollutants in

4. Environmental Analysis Hydrology and Water Quality
McHenry Solar Farm 4.10-8 May 2011 Draft Environmental Impact Report
stormwater discharges to the maximum extent practicable and by prohibiting nonstormwater discharges into the storm drain system. The ordinance contains provisions to control pollutants in stormwater for both construction and operation by requiring preparation of a stormwater pollution prevention plan and requiring compliance with applicable state and federal water quality regulations. The enforcement official (Department of Public Works) reviews development plans and may require controls as appropriate to minimize the long-term, post-construction activity discharge of stormwater pollutants from new developments, including compliance, as applicable, with industrial or construction activity stormwater permit.
Stormwater Drainage Requirements (Ordinance Code 1017 §16, 2007). In all cases where proposed construction for uses that involve structural ground coverage likely to affect storm drainage in the areas in which it is located, drainage facilities for the property shall be constructed in a manner approved by the Department of Public Works, which may include discharge into a publicly maintained storm drain system or ponding basin. Submission of the drainage plans for approval shall be the responsibility of the owner or the developer of the property on which the construction is proposed, and the application for a building permit shall be accompanied by a drainage plan suitable for review. The new development shall comply with the National Pollutant Discharge Elimination System (NPDES) General Permit No. CAS000004 and applicable Stormwater Codes as adopted by Stanislaus County.
4.10.1.3 Baseline
The environmental setting described above constitutes the baseline for determining the
significance of potential impacts on hydrology and water quality. It consists of the actual pre-
project physical environmental conditions related to water resources, hydrology, and water
quality that may be affected by the project, and may be summarized as follows:
There are no permanent surface water features on the Project site.
The Project site is an agricultural field that has well-drained soils currently absent of impervious surfaces.
Stormwater is generally handled via direct percolation into the soil, and there are no constructed stormwater facilities on or adjacent to the Project site.
Water quality in the Lower San Joaquin River and the Modesto groundwater subbasin is currently impacted to varying degrees by salts, nutrients, pesticides, trace elements, and other pollutants, primarily due to regional agricultural uses.
The Project site is currently irrigated using an on-site well for row crop production, with an annual water use estimated at 49 acre-feet per year (Sun Power, 2011a). The depth to groundwater is estimated to be 50 to 60 feet below the ground surface, based on water levels in a nearby well.
Based on location of FEMA flood hazard zones, there is less than a 0.2 percent chance that the Project site would be affected by flooding along the Lower San Joaquin River or nearby canals. However, the Project site may be affected if a catastrophic failure of the New Melones Dam occurs.

4. Environmental Analysis Hydrology and Water Quality
McHenry Solar Farm 4.10-9 May 2011 Draft Environmental Impact Report
4.10.2 Significance Criteria Based on CEQA Guidelines Appendix G, a project would cause a significant impact on hydrology and water quality if it would:
a) Violate any water quality standards or waste discharge requirements;
b) Substantially deplete groundwater supplies or interfere substantially with groundwater recharge such that there would be a net deficit in aquifer volume or a lowering of the local groundwater table level (e.g., the production rate of pre-existing nearby wells would drop to a level that would not support existing land uses or planned uses for which permits have been granted);
c) Substantially alter the existing drainage pattern of a site or area, including through the alteration of the course of a stream or river, in a manner which would result in substantial erosion or sedimentation on- or off-site;
d) Substantially alter the existing drainage pattern of a site or area, including through the alteration of the course of a stream or river, or substantially increase the rate or amount of surface runoff in a manner that would result in flooding on- or off-site;
e) Create or contribute runoff water that would exceed the capacity of existing or planned stormwater drainage systems or provide substantial additional sources of polluted runoff;
f) Otherwise substantially degrade water quality;
g) Place housing within a 100-year flood hazard area as mapped on a federal Flood Hazard Boundary or Flood Insurance Rate Map or other flood hazard delineation map;
h) Place within a 100-year flood hazard area structures that would impede or redirect flood flows;
i) Expose people or structures to a significant risk of loss, injury, or death involving flooding, including flooding as a result of the failure of a levee or dam; or
j) Inundation by seiche, tsunami, or mudflow.
4.10.3 Discussion of Criteria with No Hydrology and Water Quality Impacts
Analysis of the setting and Project characteristics relative to the significance criteria show that the Project would have no impact on Hydrology and Water Quality with respect to criteria b), g), h), and j). The reasoning supporting these conclusions follows.
b) The Project would not substantially deplete groundwater supplies or interfere substantially with groundwater recharge.
The Project would result in a net decrease in groundwater usage. The existing agricultural use of the site is estimated to be 49 acre-feet per year of groundwater from an on-site well for irrigation of row crops. Both construction- and operation-related groundwater needs for the Project would be substantially reduced from existing use and is estimated at 13 acre-feet per year during the

4. Environmental Analysis Hydrology and Water Quality
McHenry Solar Farm 4.10-10 May 2011 Draft Environmental Impact Report
construction phase, and 2 to 4 acre-feet per year for panel washing during operations. Landscape irrigation is expected to be greatest during the first year while drought tolerant plants are becoming established, and would require approximately 7.6 acre-feet per year (SunPower, 2011a). Decommissioning of the Project would require similar water usage as construction, due to water needs for dust control. Following decommissioning, the site would be returned to agricultural use, and would, therefore, have a similar water use as existing conditions. Therefore, the Project could result in a slight beneficial impact related to aquifer volumes and groundwater supplies.
g) The Project would not place housing or structures within a 100-year flood hazard zone.
The Project is outside of the 100- and 500-year flood hazard zones and does not involve housing.
h) The Project would not place within a 100-year flood hazard area structures that would impede or redirect flood flows.
The Project is outside of the 100- and 500-year flood hazard zones.
j) The Project would not be at risk of inundation by seiche, tsunami, or mudflow.
The Project is not in proximity to large water bodies (i.e., ocean or lake) that could produce a tsunami or seiche. Further, mudflows would not affect the Project because it is not in proximity to hillside areas.
4.10.4 Impacts and Mitigation Measures
a) Violate any water quality standards or waste discharge requirements; and
f) Otherwise substantially degrade water quality.
Impact 4.10-1: The Project could potentially degrade water quality such that it could violate water quality standards or waste discharge requirements. (Less than significant)
Construction and Decommissioning
Site clearing, grading, and excavation activities occurring during Project construction could loosen soil, expose soil, and increase its susceptibility to erosion from high winds and stormwater. Up to 154 acres of soil would be disturbed in the form of clearing and minimal grading during construction of the Project. Demolition and removal of equipment and debris during project decommissioning would result in a similar level of soil disturbance as construction impacts although would likely be shorter in duration. If intense rainfall occurred during construction or decommissioning phases, stormwater runoff could convey eroded soil material and other contaminants present as part of construction activities (i.e., gasoline, engine oil, drilling lubricants, and concrete) to nearby drainage ditches. An intense storm would be required to produce runoff because the Project site is nearly level and underlain by well-drained soils. Regardless, without proper controls, construction and decommissioning activities could degrade ambient water quality from sediments and other foreign contaminants and could violate water quality standards for

4. Environmental Analysis Hydrology and Water Quality
McHenry Solar Farm 4.10-11 May 2011 Draft Environmental Impact Report
turbidity, suspended sediment, and/or chemical constituents, as set forth by the Water Quality Control Plan for the San Joaquin River Basin (CVRWQCB, 1998).
In accordance with the NPDES General Permit for Stormwater Discharges Associated with Construction Activity, the CVRWQCB requires the preparation of a SWPPP prior to construction (the permit would likewise apply to closure and decommissioning activities because they are also considered construction activity). The SWPPP would include a list of BMPs designed to reduce water quality impacts from excessive stormwater flow, erosion, and sedimentation. Examples of BMPs include scheduling practices that avoid earthwork during periods of heavy rainfall, protecting and stabilizing soils prior to anticipated rainfall events, and re-vegetating or stabilizing construction areas. Sedimentation and erosion control BMPs include using water trucks during earth work activities, installing fiber rolls around temporary stockpiles, and implementing directional drainage swales as necessary to keep run-off within the project boundaries. In addition, hazardous materials BMPs include placing sanitary facilities and waste disposal locations away from sensitive areas, placing drip pans under parked vehicles, maintaining clean and sanitary work areas, and properly disposing of hazardous substances and construction/demolition wastes. Compliance with the NPDES General Permit would reduce the potential for erosion, sedimentation, and eventual surface and groundwater degradation by runoff during construction and decommissioning. Therefore, the impacts from construction and decommissioning would be less than significant.
Operation and Maintenance
Based on the Project site setting and Project configuration, operation of the Project would not violate water quality standards or waste discharge requirements. The solar array and associated facilities (e.g., substation, switchyard, O&M building) do not involve operational discharges of contaminated or poor quality wastewater. The O&M building would require a septic tank, which would be designed to be protective of water quality, as discussed in Impact 4.7-4 in Section 4.7, Geology and Soils. The transformers at the substation would use biodegradable seed oil, which is not a hazardous substance. Further, most of the Project site would have permeable ground cover. The ground beneath the solar array would be seeded with a short staple grass mix; and the interior access roads, the substation, and the switchyard would be covered with crushed rock. Impervious surfaces on the site would be limited to the posts of PV trackers, drive motors, equipment pads, paved areas at the site’s entrance and parking area, and the O&M building roof. These impervious surfaces would have a total area of 1.57 acres, or about one percent of the site (SunPower, 2011b). The flat topography and slow growing vegetation beneath the solar array would facilitate redistribution and maximum ground percolation of stormwater runoff from the PV panels. The PV panels would be constantly shifting and there would not be a permanent “drip line.” Ponding, percolation, and drainage along access roads, parking areas, the substation, and the O&M building would be facilitated by placement of crushed rock surfacing.
Considering that the level topography of the Project site would be generally unchanged, the amount of impervious surfaces would be minimal, the soils on-site are well drained, and the lack of hazardous materials to be used during project operation, it is not expected that the Project operation would degrade water quality relative to existing conditions. Therefore, the impacts from operation would be less than significant.

4. Environmental Analysis Hydrology and Water Quality
McHenry Solar Farm 4.10-12 May 2011 Draft Environmental Impact Report
c) Substantially alter the existing drainage pattern of a site or area, including through the alteration of the course of a stream or river, in a manner which would result in substantial erosion or sedimentation on- or off-site; and
d) Substantially alter the existing drainage pattern of a site or area, including through the alteration of the course of a stream or river, or substantially increase the rate or amount of surface runoff in a manner that would result in flooding on- or off-site.
Impact 4.10-2: The Project could alter the existing drainage pattern of the site in a manner that could result in erosion or sedimentation on- or off-site, or that could contribute to flooding. (Less than significant)
Construction, operation, maintenance, and decommissioning of the Project site would result in very little change to the existing drainage pattern of the Project area. There would be slight changes in grade associated with site preparation for the O&M building, the control building for the MID switchyard, access roads, and substation structures. However, the Project site would remain essentially flat, and these changes would be restricted to the Project site and would not alter the drainage courses in the area, which are located outside the Project boundary. As is standard with prefabricated buildings, drainage off the roofs of the O&M and control buildings (which are prefabricated structures) would be handled with roof drains and protective ground cover (e.g., rock-lined ditch or drain). Although on-site drainage paths may change slightly due to structures that intercept rainfall (such as PV panels, concrete foundation pads, or building rooftops) and finished grading, the site would not generate an additional volume of concentrated runoff that could cause erosion, siltation, or flooding to occur on or off the site. This is due to the same reasons described in Impact 4.10-1. During construction, effects on stormwater flows and drainage facilities would be minimized with BMPs required pursuant to the NPDES general construction permit, as discussed for Impact 4.10-1. Decommissioning of the Project would return the site to its existing use and condition, which means the drainage of the site would be similar to or the same as existing conditions.
Considering the requirements of the NPDES permit, the SWPPP, and required review and approval of the grading plan by Stanislaus County Department of Public Works, impacts to flow and water quality in the drainage ditches, which are attributable to Project activities, would be less than significant.
e) Create or contribute runoff water that would exceed the capacity of existing or planned stormwater drainage systems or provide substantial additional sources of polluted runoff.
Impact 4.10-3: The Project could create or contribute runoff water that could exceed the capacity of existing or planned stormwater drainage systems or provide additional sources of polluted runoff. (Less than significant)
There are no constructed storm drain facilities or outlets at the Project site, and stormwater is primarily handled by field percolation. The proposed Project would create approximately

4. Environmental Analysis Hydrology and Water Quality
McHenry Solar Farm 4.10-13 May 2011 Draft Environmental Impact Report
1.57 acres or 1 percent of the total Project area into impervious surfaces. If infiltration capacity of the soil is exceeded (i.e., during particularly intense or long-lasting storms), stormwater runoff may temporarily pond, or enter roadside ditches as sheet flow. The Project would not alter the topography of the site such that drainage patterns would change substantially (i.e., the site would remain essentially flat), and the majority of the site would remain covered with a grass mix or crushed gravel for access roads, O&M areas, and the substation site. As is standard with prefabricated buildings, drainage off the roofs of the O&M and control buildings (which are prefabricated structures) would be handled with roof drains and the protective ground cover (e.g., rock-lined ditch or crushed gravel). Therefore, runoff water is anticipated to behave in a similar manner as existing conditions, so this impact would be less than significant.
i) Expose people or structures to a significant risk of loss, injury, or death involving flooding, including flooding as a result of the failure of a levee or dam.
Impact 4.10-4: The Project could expose people or structures to a risk of loss, injury, or death involving flooding, including flooding as a result of the failure of a levee or dam. (Less than significant)
As discussed in the setting, the Project would be located within the dam failure inundation area for the New Melones Dam and would become inundated in the event of catastrophic failure of the dam. Dam inundation zones are based on the unlikely scenario of a total catastrophic dam collapse, occurring in a very short time frame (i.e., seconds). The scenario is considered highly unlikely but provides a worst case for planning purposes. The New Melones Dam is under the jurisdiction of the California Department of Water Resources, Division of Safety of Dams (DOSD) and is inspected regularly. DSOD inspectors review all aspects of dam safety and may require dam owners to perform work, maintenance, or implement controls if issues are found that could compromise the structural integrity of the dam structure. DSOD engineering requirements and annual inspections greatly reduce the potential for catastrophic dam failure in California. Due to the unlikely nature of dam failure, and the regulatory oversight of the DSOD, the impact from flooding as a result of the failure of a levee or dam is considered less than significant.
4.10.5 Alternatives
4.10.5.1 Reduced Project
The Reduced Project Alternative would, in general, have similar impacts to hydrology and water quality as the Project. During construction, the amount of soil disturbances would be relatively similar to the Project. Although the setbacks would be increased with the Reduced Project Alternative from a decreased size in the PV array, some level of site clearing and shallow grading would still be required for the perimeter landscape. Federal and state regulatory requirements discussed in the analysis of the Project would remain applicable to the Reduced Project

4. Environmental Analysis Hydrology and Water Quality
McHenry Solar Farm 4.10-14 May 2011 Draft Environmental Impact Report
Alternative. Operation of the Reduced Project Alternative would still require an O&M building, switchyard, substation, and other ancillary facilities, as described for the Project. Impacts on drainage patterns and water quality would be similar, although increasing the width of the landscape perimeter could have some degree of beneficial effect with respect to the control of stormwater flows. Water use would be reduced for the purposes of PV panel maintenance (panel washing) due to the reduction in the number of PV panels and increased for landscape irrigation due to the increased landscape area. Overall, however, water use would remain relatively similar to the Project, and below existing baseline water use.
4.10.5.2 Non-Agriculture Site
The Non-Agriculture Site Alternative would have impacts to hydrology and water quality that are reduced in intensity, when compared to those of the Project. Site conditions would be relatively similar to the Project in terms of topography and soil type. Therefore, stormwater would likely behave in a similar manner to the Project if the Non-Agriculture Site Alternative is implemented because the site would be flat and the soils would be well-drained. Because the site was formerly developed but is no longer in use, it is presumed that connections are available to a municipal water district and sanitary sewer, but that no water is currently being used. The impact of the Non-Agricultural Site Alternative on local groundwater levels would be reduced compared to the Project because it could be supplied by a water district rather than an on-site well, and thus no local lowering of the groundwater table would occur. The Non-Agriculture Site Alternative may have a greater impact related to depletion of groundwater supplies compared to the Project because the alternative would result in an increase in water use over existing conditions. However, water use would be about 20 percent of the proposed Project due to the reduced size of the Non-Agriculture Site Alternative. Therefore water use would be minimal in the context of a groundwater aquifer and municipal supplies and substantial depletion of groundwater supplies would not be expected.
Despite the greatly reduced size of the Non-Agriculture Site Alternative (29 acres versus 154 acres), impacts to surface and groundwater from soil disturbances during construction, as well as long-term site modifications, are likely to be about equal, given water quality best management practices would be implemented in either case pursuant to state laws. Because there are existing buildings on-site, demolition work would be required, which would introduce potential contaminants and hazardous materials. Demolition wastes would have to be properly managed in accordance with state and federal requirements. The implications of the potential for hazardous materials for this alternative are further discussed in Section 4.9, Hazards and Hazardous Materials. Because the Non-Agriculture Site Alternative would result in an increase in water use over baseline and would involve demolition of existing structures (and associated construction and demolition debris), it would likely result in slightly increased impacts to hydrology and water quality compared to the proposed Project. However, the overall impact would be expected to remain less than significant for the reasons above.

4. Environmental Analysis Hydrology and Water Quality
McHenry Solar Farm 4.10-15 May 2011 Draft Environmental Impact Report
4.10.5.3 No Project
The No Project Alternative would reduce all impacts to surface and groundwaters from construction-related disturbances and long-term site modifications because the site would continue to exist in its current condition. However, if the No Project Alternative is implemented, groundwater would continue to be used at the current level (estimated at 49 acre-feet per year), rather than the reduced water use which would result from implementation of the Project (estimated from 9.7 to 11.4 acre-feet per year). From this standpoint, the No Project Alternative may result in a greater impact related to depletion of groundwater supplies.
References – Hydrology and Water Quality Stanislaus County, 2004, Storm Water Management Program For Stanislaus County, Report of
Waste Discharge Under the SWRCB General Permit for Small Cities, CAS000004, Adopted 4/30/03, revised 5/18/04.
Stanislaus County, 2008. 1994 Stanislaus County General Plan, rev. December 2008.
Natural Resources Conservation Service (NRCS), U.S. Department of Agriculture, Land Resource Regions and Major Land Resource Areas of the United States, the Caribbean, and the Pacific Basin, U.S. Department of Agriculture Handbook 296, 2006.
Department of Water Resources (DWR). Groundwater Level Data by Basin. Available at http://www.water.ca.gov/waterdatalibrary/groundwater/download/ index.cfm, accessed 12/22/2010.
California Department of Water Resources (DWR), 2004. California’s Groundwater, San Joaquin River Hydrologic Region, San Joaquin Valley Groundwater Basin. Modesto Subbasin California Department of Water Resources, Bulletin 118. Last updated February, 2004.
Office of Emergency Services (OEM), Dam Inundation – Registered images and Boundary Files in ArcView Format, November 2007.
Federal Emergency Management Agency (FEMA), 2008. Digital Flood Insurance Rate Map, Stanislaus County, California (and unincorporated areas), DFIRM No. 06099C, available at http://www.msc.fema.gov/webapp/wcs/stores/servlet/FemaWelcomeView?storeId=10001&catalogId=10001&langId=-1, accessed on December 22, 2010. Effective date is 9/26/2008.
Central Valley Regional Water Quality Control Board (CVRWQCB), Water Quality Control Plan for the Central Valley Region, Fourth Edition, Revised September 2009 (with Approved Amendments), 2009.
SunPower, 2011a, Email communication regarding estimated water usage, February 18, 2011.
SunPower, 2011b, Email communication regarding impervious surfaces, April 25, 2011.

4. Environmental Analysis
McHenry Solar Farm 4.11-1 May 2011 Draft Environmental Impact Report
4.11 Land Use and Planning
This section identifies and evaluates issues related to Land Use and Planning in the context of the proposed Project and alternatives. Discussed are the physical and regulatory setting; the baseline for determining environmental impacts; the criteria used for determining the significance of environmental impacts; potential impacts associated with construction, operation, maintenance, and decommissioning of the Project; and mitigation measures to reduce or avoid environmental impacts determined to be potentially significant.
4.11.1 Setting
4.11.1.1 Regional and Local Setting
Section 2.2, Project Location and Existing Land Use, provides general information about the regional and local setting. This section 4.11.1 provides setting information specific to Land Use and Planning.
The site is designated for agricultural use in the Stanislaus County General Plan (Stanislaus County, 2008), and is zoned General Agriculture with a 40-acre minimum parcel size (A-2-40) pursuant to the County Code (Stanislaus County, 2011). Current land use within the Project site is agricultural, and includes row cropping (strawberries), agricultural facilities such as irrigation lines, and related access roads and staging areas. An existing residence and associated buildings located on Patterson Road near the intersection with McHenry Avenue are not part of the Project site. This is the closest residence to the Project site.
Surrounding land uses are predominantly agricultural, mostly orchards. A furniture store is located south of the Project site at the intersection of Ladd Road/Patterson Road and McHenry Avenue. The unincorporated community of Del Rio is located directly northwest of the site across McHenry Avenue. Land uses in Del Rio are primarily single-family residential and recreational: the Del Rio community includes the privately-owned Del Rio Golf and Country Club.
4.11.1.2 Regulatory Setting
Stanislaus County
General Plan
The Stanislaus County General Plan designates the Project site as Agriculture, as shown in Figure 4.11-1. Land with the Agriculture designation typically possesses characteristics regarding location, topography, parcel size, soil classification, water availability, and adjacent usage that are conducive to agricultural operations.
This designation establishes agriculture as the primary land use, but also allows dwelling units, limited agriculture-related commercial services, agriculture-related light industrial uses, and other uses that by their unique nature are not compatible with urban uses, provided they do not conflict with the primary use (Stanislaus County, 2008).

Residence (notpart of project)
Project Site
MC H
ENRY
AVE
LADD RD PATTERSON RDSK
ITTON
E RD
STEWART RD
BELTIS
DR
HARTLEY DR
DEL C
IELO
WY
SHER
RY LN
SOURCE: Stanislaus County GIS, 2008
Project Location
Merced County
Stanislaus County
San Joaquin County
§̈¦5
ST132
ST108ST99
"
McHenry Solar Farm. 209517.01
Figure 4.11-1General Plan Land Use Designations within the Project Vicinity
Agriculture
Planned Development
Residential - Low Density
0 500
Feet
4.11-2

4. Environmental Analysis Land Use and Planning
McHenry Solar Farm 4.11-3 May 2011 Draft Environmental Impact Report
Zoning
The Project site is zoned General Agriculture with a 40-acre minimum parcel size (A-2-40); however, public utility facilities are allowed in the A-2-40 under certain conditions, with a use permit. Surrounding areas also are zoned for agricultural use with the exception of the Del Rio community, which includes Rural Residential (R-A), Single-Family Residential (R-1), and Planned Development (P-D) districts (Stanislaus County, 2011).
California Government Code, Section 53091(e) states that zoning ordinances of a local jurisdiction “shall not apply to the location or construction of facilities…for the production or generation of electrical energy.” Therefore, proposed facilities to be owned and operated by MID, as part of the proposed Project, would be exempt from Stanislaus County zoning regulations.
4.11.1.3 Baseline
The environmental setting described above constitutes the baseline for determining the significance of potential impacts on land use and planning. Established communities located nearest to the Project site include the unincorporated community of Del Rio (northwest of the Project site), the City of Riverbank (approximately 1.5 miles to the east), and the City of Modesto (approximately 1.5 miles to the south). There are also several individual rural residences near the Project site, along Patterson Road and Ladd Road.
4.11.2 Significance Criteria Based on CEQA Guidelines Appendix G, a project would cause a significant impact on land use
and planning if it would:
a) Physically divide an established community;
b) Conflict with any applicable land use plan, policy, or the regulation of an agency with jurisdiction over the project (including, but not limited to the general plan, specific plan, local coastal program, or zoning ordinance) adopted for the purpose of avoiding or mitigating an environmental effect; or
c) Conflict with any applicable habitat conservation plan or natural community conservation plan.
4.11.3 Discussion of Criteria with No Land Use and Planning Impacts
Analysis of the setting and Project characteristics relative to the significance criteria show that the proposed Project would have no impact on land use and planning with respect to criteria a), b) or c). The reasoning supporting this conclusion follows.

4. Environmental Analysis Land Use and Planning
McHenry Solar Farm 4.11-4 May 2011 Draft Environmental Impact Report
a) The proposed Project would not physically divide an established community.
The Project site is located in a rural area of Stanislaus County and there are no established communities at the site or immediately surrounding the site. The site and vicinity are primarily used for agricultural production (mostly orchards), with the unincorporated community of Del Rio located northwest of the Project site. No permanent barriers to the primary public roads providing access to Del Rio, McHenry Avenue, or Patterson Road/Ladd Road, are included as part of the Project.
The proposed Project may also include the extension of proposed sub-transmission and distribution lines across McHenry Avenue if Option 1 or 2 are implemented, and would include the installation of approximately 7.5 miles of fiber optic cable on existing sub-transmission lines. MID anticipates that installation of the new sub-transmission line at the point of connection with the existing Ladd-Clough line along McHenry Avenue would take a single day. Installation of new fiber optic cable on existing poles would take approximately three months by two crews operating two line trucks. There will be minor disruption to traffic using McHenry Avenue, however no disruption is anticipated on road access to the Del Rio neighborhood when working near Stewart Road,
Therefore, the Project would have no impact regarding the division of an established community.
b) The proposed Project would not conflict with any applicable land use plan, policy, or the regulation of an agency with jurisdiction over the project (including, but not limited to the general plan, specific plan, local coastal program, or zoning ordinance) adopted for the purpose of avoiding or mitigating an environmental effect.
The Project site is designated as Agriculture by the county’s General Plan. Although this land use designation anticipates agriculture as the typical use, other uses that by their unique nature are not compatible with urban uses are acceptable, provided they do not conflict with the primary use. Use of the site for row crops would not continue if the Project is implemented, but the height of the solar panel array provides sufficient clearance to allow small livestock (such as goats and sheep) to graze on grasses underneath and around the solar panel arrays. To the extent that the Project site will support suitable native grasses, grazing would be accommodated by contracting with professionally managed herds to feed on the native grass mixture on a semi-annual or quarterly basis. In addition, it is expected that the site would be returned to agricultural use similar to existing conditions upon decommissioning of the Project when the Power Purchase Agreement between the Applicant and MID expires.
The Project site is zoned General Agriculture with a 40-acre minimum parcel size (A-2-40). Certain uses, including those that comprise the Applicant’s portion of the proposed Project, require a permit in the A-2 district.1 Tier Three uses are those that are not directly related to agriculture but may be necessary to serve the A-2 district or may be difficult to locate in an urban area. Facilities for public
1 California Government Code, Section 53091(e) states that zoning ordinances of a local jurisdiction “shall not apply
to the location or construction of facilities…for the production or generation of electrical energy.” Therefore, proposed facilities to be owned and operated by MID, as part of the proposed Project, would be exempt from Stanislaus County zoning regulations.

4. Environmental Analysis Land Use and Planning
McHenry Solar Farm 4.11-5 May 2011 Draft Environmental Impact Report
utilities are included as allowable under Tier Three uses. As discussed for Impact 4.2-2 in Section 4.2, Agriculture and Forest Resources, the Project would not conflict with existing zoning for agricultural use.
Therefore, the Project would not conflict with any applicable land use plan, policy, or regulation adopted for the purpose of avoiding or mitigating an environmental effect and no impact would result.
c) The proposed Project would not conflict with any applicable habitat conservation plan or natural community conservation plan.
The Project area does not fall within the geographic boundaries of any Habitat Conservation Plan, Natural Community Conservation Plan, or other approved local, regional, or state habitat conservation plan. Therefore, the proposed Project would have no impact on any such plan.
4.11.4 Impacts and Mitigation Measures No impacts regarding Land Use and Planning would occur with implementation of the proposed Project.
4.11.5 Alternatives
4.11.5.1 Reduced Project
Similar to the proposed Project, no land use impacts would result if this alternative is implemented. Construction and operation would not divide the nearby community of Del Rio; the proposed use as a solar farm is an allowable use with a use permit according to the county’s General Plan and zoning classification; and no habitat conservation plan exists on the site.
4.11.5.2 Non-Agriculture Site
The Non-Agriculture Site Alternative is located in rural Stanislaus County and is similar to the proposed Project in that the surrounding areas are primarily used for agricultural production with scattered rural residential dwellings. Joseph A. Gregori High School is located east of the site across Stoddard Road. A residential neighborhood in the unincorporated community of Salida is located approximately 0.3 mile west of this site. The site is designated as Planned Industrial by the Salida Community Plan and is zoned Planned Industrial (PI). Public utilities are a permitted use in PI Districts, thus no impact would result. Adjacent and nearby land uses are designated as Planned Industrial, Business Park, Public, Commercial, and Planned Industrial Reserve by the Salida Community Plan. Similar to the proposed Project, this alternative would not result in any permanent barriers that would divide an established community, and it would not conflict with a habitat conservation plan because no such plan is in effect for the area that includes this site.

4. Environmental Analysis Land Use and Planning
McHenry Solar Farm 4.11-6 May 2011 Draft Environmental Impact Report
4.11.5.3 No Project
If the No Project Alternative is implemented, the proposed Project would not be implemented. Therefore, there would be no foreseeable change in existing land use at the Project site, and no impact related to Land Use and Planning.
References – Land Use and Planning Stanislaus County, 2008. 1994 Stanislaus County General Plan, rev. December 2008.
Stanislaus County, 2011. County Code, Title 21, Zoning, Chapter 21.20, General Agriculture District (A-2), and Chapter 21.42, Planned Industrial District (PI).

4. Environmental Analysis
McHenry Solar Farm 4.12-1 May 2011 Draft Environmental Impact Report
4.12 Mineral Resources
This section identifies and evaluates issues related to Mineral Resources in the context of the proposed Project. Discussed are the physical and regulatory setting; the baseline for determining environmental impacts; the criteria used for determining the significance of environmental impacts; potential impacts associated with construction, operation, maintenance, and decommissioning of the Project; and mitigation measures to reduce or avoid environmental impacts determined to be potentially significant.
4.12.1 Setting
4.12.1.1 Regional and Local Setting
Section 2.2, Project Location and Existing Land Use, provides general information about the regional and local setting. This section 4.12.1 provides setting information specific to Mineral Resources. Information about mineral resources has been collected from the Stanislaus County General Plan, SMARA mineral land classifications, and the California Department of Conservation, Division of Oil, Gas and Geothermal Resources.
Mineral/Rock Resources Few commercial mining and mineral extraction activities occur in Stanislaus County (Stanislaus County, 2008). Most of the county’s sand and gravel resources occur adjacent to the Stanislaus and Tuolumne rivers in the eastern portions of the county. The closest sand and gravel resource area identified by the General Plan occurs along the Stanislaus River, east of Riverbank (Stanislaus County, 2008). The closest aggregate extraction operation is north of the project site, adjacent to the Stanislaus River (CGS, 2006). According to the California Geological Survey (2006), it is estimated that Stanislaus County will produce 51 million tons of permitted aggregate resources over the next 50 years, and that this production level is well short of the estimated demand.
The California Geological Survey (CGS) classifies the regional significance of mineral resources in accordance with the California Surface Mining and Reclamation Act of 1975 (SMARA). Mineral Resource Zones (MRZ) have been designated to indicate the significance of mineral deposits. The MRZ category for the project site (along with most of the eastern and central areas of the County, including the Non-Agricultural Site) is MRZ 3a, which is defined as areas that contain known mineral occurrences of undetermined mineral resource significance. Neither the project site nor the Non-Agricultural Site is within an aggregate resource area, which delineates areas that contain permitted mining areas or contain land uses that are compatible with possible future mining (Higgins and Dupras, 1993).
Geothermal Resources The Project area is located in the center of the San Joaquin Valley and is not the site of geothermal resources (California Department of Conservation, Division of Oil, Gas, and Geothermal

4. Environmental Analysis Mineral Resources
McHenry Solar Farm 4.12-2 May 2011 Draft Environmental Impact Report
Resources, 2001). Geothermal fields are more typical of mountainous areas with present or former volcanic activity.
Oil and Gas The Project site is not located on an oil or gas field (California Department of Conservation, Division of Oil, Gas, and Geothermal Resources, 2001). Although there are several plugged and abandoned wells northwest of the project site along the Stanislaus River, there are no oil and gas wells in Stanislaus County that are in commercial production (California Department of Conservation, Division of Oil, Gas, and Geothermal Resources, 2010).
4.12.1.2 Regulatory Setting
Surface Mining and Reclamation Act of 1975 The Surface Mining and Reclamation Act of 1975 (SMARA) (California Public Resources Code, Division 2, Chapter 9, Section 2710, et seq.) was enacted to ensure safe and sustainable use of California’s mineral resources. The two primary objectives are to ensure access to valuable mineral resources over time and to promote reclamation of surface mining operations and restoration of surface mines to safe conditions.
Implementation of SMARA occurs cooperatively between the state and local governments. The California Geological Survey (formerly known as the Department of Conservation, Division of Mines and Geology) prepares technical reports identifying mineral land classification based solely on geology and economics without regard to existing land use or land ownership. The State Mining and Geology Board then uses the technical reports to designate deposits that are economically important to the region, state, or nation. Local county and municipal governments then create land use policies and regulations through which SMARA is implemented. In addition, the California Health and Safety Code requires the covering, filling, or fencing of abandoned shafts, pits, and excavations (California Health and Safety Code Sections 24400-03). Furthermore, local governments have the ability to regulate and prohibit mining pursuant to applicable general plans and local zoning laws.
The reclamation of mined lands permits the continued mining of minerals and provides for the protection and subsequent beneficial use of the mined and reclaimed land. Surface mining takes place in diverse areas where the geologic, topographic, climatic, biological, and social conditions are significantly different, and reclamation operations and the specifications may vary accordingly (California Public Resources Code Section 2711).
Stanislaus County
General Plan
The Stanislaus County General Plan contains goals, policies, and implementation measures that could be applicable to the proposed Project. These policies aim to protect mineral resources and are outlined in Goal 9 of the Open Space and Conservation Element. These policies aim to guide land use decisions in areas that may contain mineral resources and to prohibit uses that threaten

4. Environmental Analysis Mineral Resources
McHenry Solar Farm 4.12-3 May 2011 Draft Environmental Impact Report
future mineral extraction. Further, the policies aim to provide for the safe and successful operation and reclamation of existing mineral resource extraction operations.
County Code
Chapter 28.88 of the Stanislaus County Code regulates existing mining operations as well as development proposals on land potentially containing saleable mineral resources. The purpose and intent of the chapter is to ensure the continued availability of important mineral resources, while regulating surface mining operations as required by California’s Surface Mining and Reclamation Act of 1975. The code contains policies to ensure that: 1) adverse environmental effects are prevented or minimized and that mined lands are reclaimed to a usable condition that is readily adaptable for alternative land uses, 2) that the production and conservation of minerals are encouraged, while giving consideration to values relating to recreation, watershed, wildlife, range and forage, and aesthetic enjoyment, and 3) residual hazards to the public health and safety are eliminated (Ord. CS 663, §20, 1998).
4.12.1.3 Baseline
The environmental setting described above constitutes the baseline for determining the significance of potential impacts on mineral resources. It consists of the actual pre-project physical environmental conditions. The baseline for the proposed project is that it: 1) is not currently available for aggregate resource extraction due to its existing agricultural use, 2) is not located in a mineral resource area as designated by Stanislaus County, 3) is not within an oil, gas or geothermal resource area, and 4) does not contain existing exploration or production wells.
4.12.2 Significance Criteria Based on CEQA Guidelines Appendix G, a project would cause a significant impact on mineral
resources if it would:
a) Result in the loss of availability of a known mineral resource that would be of value to the region and the residents of the state; or
b) Result in the loss of availability of a locally important mineral resource recovery site delineated on a local General Plan, specific plan or other land use plan.
4.12.3 Discussion of Criteria with No Mineral Resources Impacts
Analysis of the setting and Project characteristics relative to the significance criteria show that the proposed Project would have no impact on Mineral Resources with respect to the loss of availability of a locally important mineral resource recovery site for both of the CEQA significance criteria. Because the Project site: 1) is not currently available for aggregate resource extraction due to its existing agricultural use; 2) is not located in a mineral resource area as designated by Stanislaus County; 3) is not within an oil, gas, or geothermal resource area; and

4. Environmental Analysis Mineral Resources
McHenry Solar Farm 4.12-4 May 2011 Draft Environmental Impact Report
4) does not contain existing exploration or production wells; use of the site as a solar energy facility would not result in the loss of mineral resource availability.
4.12.4 Impacts and Mitigation Measures As discussed in Section 4.12.3, the project would have no impacts with respect to mineral resources.
4.12.5 Alternatives
4.12.5.1 Reduced Project
The Reduced Project alternative would have no impact on mineral resources for the same reasons discussed above in Section 4.12.3.
4.12.5.2 Non-Agriculture Site
The Non-Agriculture Site alternative would have no impact on mineral resources for the same reasons discussed above in Section 4.12.3.
4.12.5.3 No Project
The no project alternative would have no impact on mineral resources because no project would occur.
_________________________
References – Mineral Resources California Department of Conservation, Division of Oil, Gas, and Geothermal Resources, Oil,
Gas and Geothermal Fields in California, available online: ftp://ftp.consrv.ca.gov/pub/oil/maps/Map_S-1.pdf, 1:1,500,000-scale map, 2001.
California Department of Conservation, Division of Oil, Gas, and Geothermal Resources, Database File of Digital Well Locations, available online: http://www.conservation.ca.gov/dog/maps/Pages/goto_welllocation.aspx, Accessed June 14, 2010.
California Geological Survey, Aggregate Availability in California, Fifty Year Aggregate Demand Compared with Permitted Aggregate Resources, Map Sheet 52 (updated 2006), 2006.
Higgins, Chris T. and Dupras, Donald L. 1993. Mineral Land Classification of Stanislaus County, Special Report 173.
Stanislaus County, 2008. 1994 Stanislaus County General Plan, rev. December 2008.

4. Environmental Analysis
McHenry Solar Farm 4.13-1 May 2011 Draft Environmental Impact Report
4.13 Noise
This section identifies and evaluates issues related to noise in the context of the Project and alternatives. Discussed are the physical and regulatory setting; the baseline for determining environmental impacts; the criteria used for determining the significance of environmental impacts; potential impacts associated with the Project; and mitigation measures to reduce or avoid environmental impacts determined to be potentially significant.
4.13.1 Setting
4.13.1.1 Regional and Local Setting
Section 2.2, Project Location and Existing Land Use, provides general information about the regional and local setting. This section (4.13.1.1) provides setting information specific to noise in the Project area.
Noise Background Sound is mechanical energy transmitted by pressure waves through a medium such as air. Noise can be defined as unwanted sound. Sound is characterized by various parameters that include the rate of oscillation of sound waves (frequency), the speed of propagation, and the pressure level or energy content (amplitude). In particular, the sound pressure level has become the most common descriptor used to characterize the loudness of an ambient sound level. Sound pressure level is measured in decibels (dB), with zero dB corresponding roughly to the threshold of human hearing, and 120 to 140 dB corresponding to the threshold of pain.
Sound pressure fluctuations can be measured in units of hertz (Hz), which correspond to the frequency of a particular sound. Typically, sound does not consist of a single frequency, but rather a broad band of frequencies varying in levels of magnitude (sound power). When all of the audible frequencies of a sound are measured, a sound spectrum is plotted consisting of a range of frequency spanning 20 to 20,000 Hz. The sound pressure level, therefore, constitutes the additive force exerted by a sound corresponding to the sound frequency/sound power level spectrum.
The typical human ear is not equally sensitive to all frequencies of the audible sound spectrum. As a consequence, when assessing potential noise impacts, sound is measured using an electronic filter that de-emphasizes the frequencies below 1,000 Hz and above 5,000 Hz in a manner corresponding to the human ear’s decreased sensitivity to low and extremely high frequencies instead of the frequency mid-range. This method of frequency weighting is referred to as A-weighting and is expressed in units of A-weighted decibels (dBA). Some typical A-weighted sound levels are presented in Figure 4.13-1.
Noise Exposure and Community Noise An individual’s noise exposure is a measure of the noise experienced by the individual over a period of time. A noise level is a measure of noise at a given instant in time. However, noise levels rarely persist consistently over a long period of time. In fact, community noise varies continuously over

dBAOther
Sources
Outdoor
Rock Drill100
90
80
70
60
50
40
Shop Tools
Food Blender
Clothes Washer
Air Conditioner
Refrigerator
Jack Hammer
Heavy Truck, 55 mph
Metro Train, 50 mph
Bus, 55 mph
Auto, 55 mph
Lawn Mower
CommercialAir Conditioner
Indoor
All at 50 ft All at 3 ft
Figure 4.13-1Typical A - Weighted Sound Levels
SOURCE: Federal Transit Administration, 2006McHenry Solar Farm . 209517.01
4.13-2

4. Environmental Analysis Noise
McHenry Solar Farm 4.13-3 May 2011 Draft Environmental Impact Report
time with respect to the contributing sound sources of the community noise environment. Community noise is primarily the product of many distant noise sources, which constitute a relatively stable background noise exposure, with the individual contributors unidentifiable. Background noise levels change throughout a typical day, but do so gradually, corresponding with the addition and subtraction of distant noise sources and atmospheric conditions. The addition of short-duration single-event noise sources (e.g., aircraft flyovers, motor vehicles, sirens) makes community noise constantly variable throughout a day.
These successive additions of sound to the community noise environment vary the community noise level from instant to instant requiring the measurement of noise exposure over a period of time to legitimately characterize a community noise environment and evaluate cumulative noise impacts. This time-varying characteristic of environmental noise is described using statistical noise descriptors. The most frequently used noise descriptors are summarized below:
Leq: The equivalent sound level is used to describe noise over a specified period of time, in terms of a single numerical value. The Leq is the constant sound level that would contain the same acoustic energy as the varying sound level, during the same time period (i.e., the average noise exposure level for the given time period).
Lmax: The instantaneous maximum noise level measured during the measurement period of interest.
Ldn: The energy average of the A-weighted sound levels occurring during a 24-hour period, and which accounts for the greater sensitivity of most people to nighttime noise by weighting noise levels at night (“penalizing” nighttime noises). Noise between 10:00 p.m. and 7:00 a.m. is weighted (penalized) by adding 10 dBA to take into account the greater annoyance of nighttime noises.
Effects of Noise on People The effects of noise on people can be placed into three categories:
Interference with activities such as speech, sleep, and learning – The thresholds for speech interference indoors are about 45 dBA if the noise is steady and above 55 dBA if the noise is fluctuating. Outdoors, the thresholds are about 15 dBA higher. Interior residential standards for multi-family dwellings are set by the State of California at 45 Ldn. The standard is designed for sleep and speech protection and most jurisdictions apply the same criterion for all residential uses.
Subjective effects of annoyance, nuisance, and dissatisfaction – Based on attitude surveys used for measuring the annoyance felt in a community for noises intruding into homes or affecting outdoor activity areas, the main causes for annoyance are interference with speech, radio and television, house vibrations, and interference with sleep and rest. The Ldn as a measure has been found to provide a valid correlation of noise level and the percentage of people annoyed. Three aspects of community noise are most important in determining subjective response – the level of sound, the frequency composition or spectrum of the sound, and the variation of sound level with time.
Physiological effects, such as hearing loss or sudden startling – Although physical damage to the ear from an intense noise impulse is rare, a degradation of auditory acuity can occur even within a community noise environment. Hearing loss occurs mainly due to chronic

4. Environmental Analysis Noise
McHenry Solar Farm 4.13-4 May 2011 Draft Environmental Impact Report
exposure to excessive noise, but may be due to a single event such as an explosion. Natural hearing loss associated with aging may also be accelerated from chronic exposure to loud noise.
Because there is no completely satisfactory way to measure the subjective effects of noise, predicting a human reaction to a new noise environment is typically accomplished by assessing how the new noise compares to the existing noise levels to which one has adapted: the so called “ambient noise” level. With regard to increases in A-weighted noise level, the following relationships occur:
Except in carefully controlled laboratory experiments, a change of 1 dBA cannot be perceived;
Outside of the laboratory, a 3-dBA change is considered a just-perceivable difference when the change in noise is perceived but does not cause a human response;
A change in level of at least 5 dBA is required before any noticeable change in human response would be expected; and
A 10-dBA change is subjectively heard as approximately a doubling in loudness and can cause an adverse response.
These relationships occur, in part, because of the logarithmic nature of sound and the decibel system. Because the decibel scale is based on logarithms, two noise sources do not combine in a simple additive fashion, rather they combine logarithmically. For example, if two identical noise sources produce noise levels of 50 dBA, the combined sound level would be 53 dBA, not 100 dBA.
Noise Attenuation Sound level naturally decreases as one moves farther away from the source. Point sources of noise, including stationary mobile sources such as idling vehicles or on-site construction equipment, attenuate (lessen) at a rate of 6.0 dBA per doubling of distance from the source. In many cases, noise attenuation from a point source increases by 1.5 dB from 6.0 dBA to 7.5 dBA for each doubling of distance due to ground absorption and reflective wave canceling (Caltrans, 1998). These factors are collectively referred to as excess ground attenuation. The basic geometric spreading loss rate is used where the ground surface between a noise source and a receiver is reflective, such as parking lots or a smooth body of water. The excess ground attenuation rate (7.5 dBA per doubling of distance) is used where the ground surface is absorptive, such as soft dirt, grass, or scattered bushes and trees.
Widely distributed noises, such as a street with moving vehicles (a “line” source), typically would attenuate at a lower rate of approximately 3.0 dBA for each doubling of distance between the source and the receiver. If the ground surface between source and receiver is absorptive rather than reflective, the nominal rate increases by 1.5 dBA to 4.5 dBA for each doubling of distance (Caltrans, 1998). Atmospheric effects, such as wind and temperature gradients, also can influence noise attenuation rates from both line and point sources of noise. Trees and vegetation, buildings, and barriers reduce the noise level that would otherwise occur at a given receptor distance.

4. Environmental Analysis Noise
McHenry Solar Farm 4.13-5 May 2011 Draft Environmental Impact Report
Vibration Vibration is an oscillatory motion through a solid medium in which the motion’s amplitude can be described in terms of displacement, velocity, or acceleration. There are several different methods that are used to quantify vibration. The peak particle velocity (PPV) is defined as the maximum instantaneous peak of the vibration signal and is typically expressed in units of inches per second (in/sec). The PPV is most frequently used to describe vibration impacts to buildings. The root mean square (RMS) amplitude is most frequently used to describe the effect of vibration on the human body. The RMS amplitude is the average of the squared amplitude of the signal. Decibel notation (VdB) is commonly used to measure RMS. The decibel notation acts to compress the range of numbers required to describe vibration (FTA, 2006, p.7-4). Typically, ground-borne vibration generated by man-made activities attenuates rapidly with distance from the source of the vibration.
Existing Ambient Noise Environment The study area is located in rural northern unincorporated Stanislaus County between the City of Riverbank and community of Del Rio. The Project site currently consists of agricultural fields bounded by Patterson Road on its southern boundary and McHenry Avenue on its western boundary (see Figure 4.13-2). The main contributor to the existing noise environment in the vicinity of the Project site is vehicle traffic along Patterson Road and McHenry Avenue. Additional noise sources include periodic agricultural operations and maintenance activities and sounds emanating from the Del Rio community northwest of the Project site and the residence south of the site along Patterson Road. There are no public airports within two miles of the site.
To characterize existing Ldn noise levels in the vicinity of the Project site, traffic noise modeling was conducting using the Federal Highway Administration Lookup Traffic Noise Model (TNM) Version 2.5. Peak hour traffic count and vehicle type data for Patterson Road and McHenry Avenue were obtained from recent sources (EDAW, 2008 and Caltrans, 2009) for traffic noise model input. Table 4.13-1 presents the modeled ambient Ldn traffic noise levels. As noted in the table, traffic noise was modeled for McHenry Avenue both without a noise barrier and with a noise barrier to simulate noise conditions at residences in the Del Rio neighborhood adjacent to the site where a noise wall separates the homes from the road.
TABLE 4.13-1 MODELED AMBIENT TRAFFIC LDN NOISE LEVELS IN VICINITY OF THE PROJECT SITE
Roadway Segment Ldn (dBA) 50 feet from
Roadway Centerline
Patterson Road, east of McHenry Avenue 71.1
McHenry Avenue, north of Patterson Road 68.8
McHenry Avenue, north of Patterson Road with noise barrier 61.5
NOTES: Modeled data assume a hard terrain surface and that the average speed on the segments is assumed to
equal the speed limit for the roads (i.e., 45 miles per hour).

Residence (notpart of project)
Project Site
¬·1¬·2
¬·5
¬·4¬·3
MC H
ENRY
AVE
LADD RD PATTERSON RDSK
ITTON
E RD
STEWART RD
BELTIS
DR
HARTLEY DR
DEL C
IELO
WY
SPY GLASS D R
SHER
RY LN
SOURCE: ESA, 2011
Project Location
Merced County
Stanislaus County
San Joaquin County TuolumneCounty
§̈¦5
ST132
ST108ST99
"
McHenry Solar Farm. 209517.01
Figure 4.13-2Short Term Noise Measurement Locations
0 500
Feet
4.13-6

4. Environmental Analysis Noise
McHenry Solar Farm 4.13-7 May 2011 Draft Environmental Impact Report
In addition to the modeled ambient traffic noise levels, ambient Leq and Lmax short-term noise levels were measured to further characterize noise conditions in the vicinity of the Project site. Short-term measurements were taken at five locations (see Table 4.13-2 for the measured noise levels) along Ladd/Patterson Road and McHenry Avenue between 15 and 40 feet from the roadway centerline. Figure 4.13-2 illustrates the noise measurement locations. Ambient Leq noise levels in the vicinity of the Project site were measured to be between 65.2 and 76.1 dBA and the Lmax noise levels were measured to be 73.3 to 93.0 dBA. The predominant noise source in the study area was auto traffic.
TABLE 4.13-2 AMBIENT NOISE LEVELS MEASURED IN THE STUDY AREA
No. Measurement Location Time Leq Lmax
1. Patterson Road, in front of residence approximately 15 feet from road centerline.
2:28 p.m. 75.4 89.2
2:33 p.m. 75.8 84.5
2. McHenry Avenue, north of Ladd Road, approximately 40 feet from road centerline.
2:53 p.m. 65.2 75.4
2:58 p.m. 73.2 93.0
3. McHenry Avenue, north of Project site, approximately 30 feet from road centerline.
3:19 p.m. 76.1 88.5
3:24 p.m. 74.3 84.6
4. McHenry Avenue, northwest corner of Project site, approximately 50 feet from road centerline.
3:32 p.m. 66.9 73.3
3:37 p.m. 68.0 82.3
5. McHenry Avenue, south of the northwest corner of the Project site, approximately 30 feet from road centerline.
3:46 p.m. 75.2 83.7
3:51 p.m. 74.2 83.7
NOTE: Short-term (five-minute) measurements were collected on Thursday February 10, 2011.
It should be noted that the noise levels identified in Table 4.13-2 were mostly collected near the edge of the road shoulder and do not represent noise levels at the nearby residence locations, which tend to be setback farther from the road centerline. As a general rule, noise from a line source, such as traffic along a road, attenuates at a rate of approximately 3 dBA per doubling of distance from the source. For example, the residence along Patterson Road is setback approximately 50 feet from the road centerline. Therefore, a more accurate representation of the traffic noise level at that residence would include an attenuation of approximately 5 dBA from levels identified for monitoring location 1 in Table 4.13-2.
Sensitive Receptors Human response to noise varies considerably from one individual to another. Effects of noise at various levels can include interference with sleep, concentration, and communication, and can cause physiological and psychological stress and hearing loss. Given these effects, some land uses are considered more sensitive to ambient noise levels than others. In general, residences, schools, hotels, hospitals, and nursing homes are considered to be the most sensitive to noise. Places such as churches, libraries, and cemeteries, where people tend to pray, study, and/or contemplate also are sensitive to noise. Commercial and industrial uses are considered the least noise-sensitive.

4. Environmental Analysis Noise
McHenry Solar Farm 4.13-8 May 2011 Draft Environmental Impact Report
Sensitive receptors in the study area consist of residences. As shown in Figure 4.13-2, the closest residential property to the Project boundary is immediately adjacent to the site along Patterson Road where the road converges with Ladd Road. The next nearest residential properties are as close as 100 feet from the northwest corner of the site in the Del Rio community across McHenry Avenue. There is a sound wall along the outside perimeter of this neighborhood. There are no other sensitive receptors in the immediate vicinity of the Project site.
4.13.1.2 Regulatory Setting
Federal, State, and local agencies regulate different aspects of environmental noise. Federal and State agencies generally set noise standards for mobile sources, such as aircraft and motor vehicles, and regulation of stationary sources is within the jurisdiction of local agencies. Local regulation of noise in the Project area involves implementation of Stanislaus County General Plan policies and County Code ordinances that identify general standards intended to guide and influence development plans.
Stanislaus County General Plan The Stanislaus County General Plan contains a Noise Element. The purpose of the noise element is to limit the exposure of the community to excessive noise levels. The Noise Element Guidelines requires local governments to analyze and quantify noise levels and the extent of noise exposure through field measurements or noise modeling, and implement measures and possible solutions to existing and foreseeable noise problems. The Stanislaus County General Plan contains the following policies and implementation measures that would be applicable to the Project.
Policy One includes noise exposure limits to identify existing and potential noise conflicts through the Land Use Planning and Project Review processes (Stanislaus County, 2008). The implementation measure for Policy One indicates that single-family residential areas within Stanislaus County shall be designated as noise-impacted if exposed to existing or projected future exterior noise levels exceeding the 60 Ldn or the performance standards described below in Table 4.13-3.
TABLE 4.13-3 MAXIMUM ALLOWABLE NOISE EXPOSURE – STATIONARY NOISE SOURCESa
Noise Descriptor Daytime (7 a.m. to 10 p.m.) Nighttime (10 p.m. to 7 a.m.)
Hourly Leq, dBA 55 45
Maximum level, dBA 75 64 a As determined at the property line of the receiving land use. When determining the effectiveness of noise mitigation measures, the
standards may be applied on the receptor side of noise barriers or other property line noise mitigation measures. SOURCE: Stanislaus County, 2008.

4. Environmental Analysis Noise
McHenry Solar Farm 4.13-9 May 2011 Draft Environmental Impact Report
Policy Two strives to abate and avoid excessive noise exposure in the unincorporated areas of the County by requiring effective noise mitigation measures to be incorporated into the design of new noise-generating and new noise-sensitive land uses (Stanislaus County, 2008). The second implementation measure for Policy Two states that new development of industrial, commercial, or other noise-generating land uses will not be permitted if resulting noise levels would exceed 60 Ldn in noise-sensitive areas. Additionally, the development of new noise-generating land uses not preempted from local noise regulation will not be permitted if resulting noise levels would exceed the performance standards contained within Table 4.13-3 in areas containing residential or other noise sensitive land uses. Finally, the third implementation measure for Policy Two requires an acoustical analysis prior to the approval of a development of industrial, commercial, or other noise generating land use in an area containing noise-sensitive land uses.
Policy Three states that it is the objective of Stanislaus County to protect areas of the county where noise-sensitive land uses are located. The first implementation measure of Policy Three is applicable to the Project. It requires the evaluation of mitigation measures for projects that would cause the Ldn at noise-sensitive uses to increase by three dBA or more and exceed the “normally acceptable” level (i.e., 60 Ldn for single family residences), cause the Ldn at noise-sensitive uses to increase five dBA or more and remain “normally acceptable,” or cause new noise levels to exceed the noise ordinance limits (after adoption). These standards do not apply to construction noise that occurs between the hours of 7:00 a.m. and 7:00 p.m.
Stanislaus County Code
Chapter 10.46 of the Stanislaus County Code, Noise Control, includes noise and vibration thresholds that would apply to the Project (Stanislaus County, 2010). Section 10.46.050 of the Code states that it is unlawful for any person at any location within the unincorporated area of the County to create any noise or to allow the creation of any noise that causes the exterior noise level when measured at any residential property situated in either the incorporated or unincorporated area of the County to exceed maximum noise levels of 50 dBA during daytime hours (i.e., 7:00 a.m. to 9:59 p.m.) or 45 dBA during nighttime hours (i.e., 10:00 p.m. to 6:59 a.m.). If the measured ambient noise level exceeds the applicable noise level standard above, the ambient noise level shall become the applicable exterior noise level standard.
According to Stanislaus County Municipal Code Section 10.46.060, Specific noise source standards, Subsection E, Construction Equipment, no person shall operate any construction equipment so as to cause at or beyond the property line of any property upon which a dwelling unit is located an average sound level greater than 75 dBA between the hours of 7:00 p.m. and 7:00 a.m.
4.13.1.3 Baseline
Baseline conditions for this analysis reflect pre-Project conditions in the vicinity of the site, including moderate-to-heavy traffic along McHenry Avenue and Ladd/Patterson Road. Baseline ambient noise levels are represented by modeled Ldn levels between 62 and 71 dBA and measured Leq levels in the mid 60-dBA to mid 70-dBA range. The baseline includes a residence

4. Environmental Analysis Noise
McHenry Solar Farm 4.13-10 May 2011 Draft Environmental Impact Report
immediately adjacent to the Project site on Patterson Road and the Del Rio community northwest of the Project site across McHenry Avenue (see Figure 4.13-2).
4.13.2 Significance Criteria Based on CEQA Guidelines Appendix G, a project would cause a significant impact related to
noise if it would:
a) Result in exposure of persons to, or generation of, noise levels in excess of standards established in the local general plan or noise ordinance, or applicable standards of other agencies;
b) Result in exposure of persons to, or generation of, excessive groundborne vibration or groundborne noise levels;
c) Result in a substantial permanent increase in ambient noise levels in the project vicinity above levels existing without the project;
d) Result in a substantial temporary or periodic increase in ambient noise levels in the project vicinity above levels existing without the project;
e) For a project located within an airport land use plan area, or, where such a plan has not been adopted, in an area within two miles of a public airport or public use airport, would the project expose people residing or working in the area to excessive noise levels; or
f) For a project located in the vicinity of a private airstrip, would the project expose people residing or working in the project area to excessive noise levels.
4.13.3 Discussion of Criteria with No Noise Impacts Analysis of the setting and Project characteristics relative to the significance criteria show that the Project would have no noise or vibration-related impacts with respect to criteria a), e), and f). The reasoning supporting this conclusion is as follows:
a) The Project would not result in exposure of persons to or generation of noise levels in excess of standards established in the local general plan or noise ordinance, or applicable standards of other agencies.
As explained in more detail in Section 4.13.4, there would be no impact in this regard because the Project’s operational noise levels would be within the acceptable noise levels for residential uses as identified by the Stanislaus County General Plan’s land use compatibility standards and would not exceed the noise limits identified in Chapter 10.46 of the Stanislaus County Code.
e) The Project would not expose people residing or working in the area to excessive public airport noise levels.
There are no public airports within 2 miles of the site. Consequently, no noise impact associated with exposing people to excessive public airport noise would occur.

4. Environmental Analysis Noise
McHenry Solar Farm 4.13-11 May 2011 Draft Environmental Impact Report
f) The Project would not expose people residing or working in the Project area to excessive noise levels within the vicinity of a private airstrip.
The Project area is not located within the vicinity of a private airstrip. Consequently, no noise impact associated with private airstrips would occur.
4.13.4 Impacts and Mitigation Measures
b) Result in exposure of persons to, or generation of, excessive groundborne vibration or groundborne noise levels.
Operation and maintenance of the Project would not introduce any new sources of perceivable groundborne vibration to the Project area. Therefore, there would be no operation-related vibration impacts. Groundborne noise is the rumbling sound of structure surfaces caused by high vibration levels. Because implementation of the Project would not result in exposure of persons to or generation of excessive groundborne vibration, it also would not expose them to or generate excessive groundborne noise levels. Consequently, there would be no groundborne noise-related impact associated with operation and maintenance of the Project.
Impact 4.13-1: Project-related post driving would result in exposure of persons to groundborne vibration. (Less than significant)
Project construction activities would require the use of heavy construction equipment that would result in groundborne vibration. The construction equipment that would result in the highest vibration levels would be a vibratory (also known as sonic) post driver, which can generate vibration levels of up to 0.73 in/sec at a distance of 25 feet. However, vibration levels attenuate rapidly from the source. At a distance of 150 feet, which is the approximate distance that the closest residence would be to post driving activities, sonic post driver vibration would be up to 0.05 in/sec.
The PPV threshold of 0.20 in/sec identified by the California Department of Transportation (Caltrans, 2004, p.11) is used in this analysis to determine the significance of vibration impacts related to adverse human reaction, and the Federal Transit Administration (FTA) PPV threshold of 0.12 in/sec for buildings extremely susceptible to vibration damage is used to determine the significance of vibration impacts related to risk of architectural damage to buildings. Vibration levels at the closest residence locations would be well below these PPV thresholds. Therefore, construction-related vibration impacts would be less than significant.
_________________________
c) Result in a substantial permanent increase in ambient noise levels in the project vicinity above levels existing without the project.
Impact 4.13-2: Operation and maintenance of the Project would increase local ambient noise levels. (Less than significant)
The primary noise sources that would be associated with operation and maintenance of the Project would be the tracker unit motors, the substation transformer, modular power block

4. Environmental Analysis Noise
McHenry Solar Farm 4.13-12 May 2011 Draft Environmental Impact Report
inverters and medium voltage transformers, sub-transmission line corona discharge, and maintenance activities. Potential impacts associated with each of these sources are addressed below.
Modular Power Blocks
Implementation of the Project would include installation of up to 25 modular power blocks that would each be comprised of four to six individual tracker units. Each tracker unit would include a drive unit that would consist of a 0.5 horsepower motor that would rotate the drive strut so that the solar PV panels would be able to maximize exposure to sunlight throughout the day. The power block motors would be spaced at distances from each other that would range from approximately 66 feet to165 feet. Based on specifications of tracking motors for a similar PV project, the noise level of each proposed tracking motor can be expected to be approximately 48 dBA at 50 feet (ICF, 2010). Assuming that each of the six motors of a power block would operate simultaneously, the combined noise level would be as high as 51 dBA at 50 feet.
Each modular power block would also include an inverter and a medium voltage transformer. The inverters would be housed in containers that would substantially attenuate any inverter noise to negligible levels, and it is anticipated that the medium voltage transformers would result in noise levels substantially less than the high voltage transformer that would be installed at the proposed substation (i.e., less than 53 dBA at 50 feet; see Substation Transformer noise discussion below). When the medium voltage transformer noise would be combined with the tracker unit motors, the combined modular power block noise would be less than 55 dBA at 50 feet.
The power block closest to a residence would be approximately 150 feet to the west of the residence along Patterson Road. At 150 feet, the maximum power block combined motor and transformer noise would be less than 45 dBA, which would be substantially less than the ambient daytime noise level at that location. Although not typical, there would likely be days during the summer when the power block motors and medium transformers would operate slightly before 7:00 a.m. However, a noise level of less than 45 dBA would be less than the County’s nighttime maximum allowable noise exposure level of 45 dBA for stationary sources. Even if the power block motors and the medium voltage transformers would operate continuously day and night, which is an extremely conservative assumption given that the purpose of the motors would be for the PV panels to track the movement of the sun and the purpose of the medium voltage transformers are to step up voltage produced by sunlight, the associated Ldn level at 150 feet would be less than 51 dBA, which would be considerably less than the County General Plan policy acceptable Ldn noise level of 60 dBA at residential receptors. Therefore, impacts related to Project power block motor and medium voltage transformer noise would be less than significant.
Substation Transformer
The proposed Project would include installation of a substation that would have one 69/34-kV transformer bank. Operation of the new transformer at the proposed substation would increase noise levels in the immediate vicinity of the substation site. Transformer noise is caused, in part, by a phenomenon called magnetostriction, which causes the transformer to be magnetically excited and vibrate, producing a “humming” type sound. High voltage transformers also contain

4. Environmental Analysis Noise
McHenry Solar Farm 4.13-13 May 2011 Draft Environmental Impact Report
cooling fans that generate noise. Maximum noise levels that would be associated with the proposed substation transformer have been estimated to be no more than 53 dBA at a distance of 50 feet (ESA, 2011).
The nearest residences to the proposed substation site for the Proposed Interconnection option are in the Del Rio neighborhood, approximately 500 feet to the west (the substation would be located at greater distances from the nearest residences in the Del Rio neighborhood under the other two alignment/interconnection options). Assuming a maximum transformer noise of approximately 53 dBA at 50 feet, maximum noise levels at 500 feet would be 33 dBA, which would be virtually inaudible given the relatively high ambient noise levels in the area. The Option 1 and Option 2 substation locations would be approximately 900 feet north-northwest and north-northeast, respectively, from the nearest residence along Patterson Road. Transformer noise levels from these locations at the Patterson Road residence would be approximately 28 dBA, which would also be virtually inaudible. Therefore, noise impacts related to the Project substation transformer would be less than significant.
Sub-Transmission Line Corona Discharge
The term corona is used to describe the breakdown of air into charged particles caused by the electrical field at the surface of a conductor. Audible noise levels generated by corona discharge vary depending on weather conditions as well as the voltage and condition of the line. Wet weather conditions often increase corona discharge due to accumulation of raindrops, fog, frost, or condensation on the conductor surface, which causes surface irregularities thereby promoting corona discharge. Corona noise that would be associated with the proposed 69-kV sub-transmission line is estimated to be less than 37 dBA directly below the line when the conductors would be wet (EPRI, 1978, p.63). Given the elevated ambient noise levels along McHenry Avenue, sub-transmission line-related corona noise levels would not be audible at the nearest sensitive receptor locations if any of the three alignment/interconnection options are implemented, and would not exceed any applicable noise-related policies or municipal code standards. Therefore, impacts related to Project sub-transmission line corona noise would be less than significant.
Maintenance
Implementation of the Project would require two permanent employees that would work at the proposed operation and maintenance building at the site. The employees would inspect each component of the solar farm no less than once a month, and between two to four times per year the PV panels would be washed. In addition, some amount of unscheduled maintenance and repair would likely be necessary. These maintenance-related activities are not expected to be audible at the nearest sensitive receptor locations. Therefore, impacts related to maintenance of the Project would be less than significant.
Mitigation: None required.
_________________________

4. Environmental Analysis Noise
McHenry Solar Farm 4.13-14 May 2011 Draft Environmental Impact Report
d) Result in a substantial temporary or periodic increase in ambient noise levels in the project vicinity above levels existing without the project.
Impact 4.13-3: Project construction and decommissioning activities would temporarily increase local ambient noise levels. (Less than significant)
Noise levels related to construction activities within and adjacent to the Project site and along material delivery routes would fluctuate during the 10-month construction period, depending on the particular type, number, duration of use of various pieces of construction equipment, and number of daily deliveries. Construction activities would include construction of the solar array, the sub-transmission and distribution lines, fiber optic cables, the substation, the operation and maintenance building, and vehicle travel to and from the site. During the peak period of construction, it is anticipated that an average of approximately 125 daily round trips related to material hauling and commuting workers would raise ambient noise levels along McHenry Avenue, Ladd Road, and Patterson Road. These Project-related trips would represent a minor increase to the existing average daily traffic volume on these roads and would likely result in a short-term Ldn increase along the roads of less than 1 dBA. Table 4.13-4 provides typical noise levels produced by various types of construction equipment and vehicles that would be required to construct the Project.
TABLE 4.13-4 TYPICAL NOISE LEVELS FROM ON-SITE CONSTRUCTION EQUIPMENT AND VECHILES
Construction Equipment Noise Level (dBA, Leq at 50 feet)
Dump, Concrete, and Water Trucks Dozers Graders Sonic Post Driver Backhoes Cranes Loader Roller Scraper
88 85 85 96 80 83 85 74 89
SOURCE: FTA, 2006.
As indicated in the table, the majority of the construction equipment that would be used to construct the Project would result in noise levels between 80 dBA and 89 dBA at 50 feet; however, proposed use of the sonic post driver would result in a noise level of up to 96 dBA at 50 feet. The closest post driving activity to a residence would occur approximately 150 feet to the west of the residence along Patterson Road and would occur as close as 230 feet from the closest residences in the Del Rio neighborhood. At 150 feet and 230 feet, maximum post driver noise levels would be approximately 86 dBA and 83 dBA, respectively. Accounting for the existing sound wall that blocks the line of sight between the Del Rio neighborhood and the Project site, post driver noise levels at the nearest Del Rio neighborhood residence would be up to 76 dBA. It should be noted that these noise levels would occur only for the closest post driving locations and

4. Environmental Analysis Noise
McHenry Solar Farm 4.13-15 May 2011 Draft Environmental Impact Report
that the vast majority of such activities would occur at substantially farther distances from the nearest residences and would generate much lower noise levels at those residences.
As stated in Section 4.13.1.2, the County General Plan noise standards do not apply to construction noise that occurs between the hours of 7:00 a.m. and 7:00 p.m. and pursuant to County Municipal Code Section 10.46.060, construction noise levels between the hours of 7:00 p.m. and 7:00 a.m. shall not exceed 75 dBA at any residential property line. Proposed construction activities would occur between the hours of 7:00 a.m. and 7:00 p.m.; therefore, Project construction activities would comply with all applicable noise standards and municipal codes.
Although there are no applicable local policies or standards available to judge the significance of short-term daytime construction noise levels, the FTA has identified a daytime hourly Leq level of 90 dBA as a noise level where adverse community reaction could occur (FTA, 2006, p.B-2). Given that the loudest noise levels at the nearest residence would be limited to 86 dBA (76 dBA for the nearest residences in the Del Rio neighborhood) for no more than several days, and because construction activities would be limited to between the hours of 7:00 a.m. and 7:00 p.m. when ambient noise levels are most elevated, the temporarily increase in local noise levels would not be expected to cause a substantial nuisance to nearby residences. Therefore, short-term construction noise levels would result in a less than significant noise impact.
Decommissioning activities at the end of the Project life would involve similar but fewer pieces of construction equipment and would take place over a shorter duration (3 months) than would Project construction (10 months). It is expected that decommissioning activities would occur between the hours of 7:00 a.m. and 7:00 p.m. and so would comply with all applicable noise standards and municipal codes. Consequently, short-term noise levels from decommissioning would be similar to or less than during construction, and so would be less than significant.
Mitigation: None required.
4.13.5 Alternatives
4.13.5.1 Reduced Project Alternative
If the Reduced Project Alternative is implemented, short-term construction/decommissioning and long-term operation would result in slightly lower maximum noise levels at nearby residences due to the increased setbacks for Project facilities from McHenry Avenue and Patterson Road when compared to the proposed Project. In addition, construction and decommissioning activities would likely occur for a slightly shorter duration compared to the Project. Similar to the Project, the Reduced Project Alterative would result in less-than-significant short-term construction/ decommissioning and long-term operational impacts from noise and vibration.

4. Environmental Analysis Noise
McHenry Solar Farm 4.13-16 May 2011 Draft Environmental Impact Report
4.13.5.2 Non-Agriculture Site Alternative
Due to the proximity of the Non-Agriculture Site Alternative to Stoddard Road, the setting associated with this alternative includes ambient traffic-dominated noise levels. Sensitive receptors in the vicinity of the Non-Agriculture Site Alternative consist of three rural residences along Stoddard Road between approximately 70 feet and 200 feet from the site boundary, and the outdoor activity area associated with Joseph Gregori High School, which is approximately 100 feet from the site boundary. The nearest buildings associated with the school are approximately 1,300 feet east of the site boundary.
Accounting for the required setbacks, short-term construction and decommissioning and long-term operation of the Non-Agriculture Site Alternative would result in similar maximum noise levels at the nearby sensitive receptors as those that would occur with the Project. Although construction of this alternative would take approximately 2 to 4 months to complete, compared to 10 months for the Project, existing buildings and other facilities at the Non-Agriculture Site would need to be demolished prior to construction of the solar farm, and approximately 1.25 miles of existing distribution circuit poles along Stoddard Road would be removed and replaced with taller poles to support the 1.25 miles of new sub-transmission line. Therefore, the overall construction period duration associated with the Non-Agricultural Site Alternative would be 12 to 14 months, 2 to 4 months longer than for the proposed Project. In addition, demolition activities would likely involve higher noise levels compared to construction activities, due to loud sounds associated with debris breaking and handling. In addition to the equipment listed in Table 4.13-4 that would be required for construction, demolition activities would also require equipment such as jack hammers and metal saws. These pieces of equipment would result in persistent noise levels of 88 dBA and 90 dBA, respectively, measured at 50 feet (FTA, 2006). Construction of the sub-transmission line would result in short-term disturbances to an additional seven residences compared to the two or three residences of the Del Rio neighborhood that would be disturbed by sub-transmission line construction under the Project. However, as with the Project, the Non-Agricultural Site Alterative would result in less-than-significant short-term construction/decommissioning and long-term operational impacts from noise and vibration.
4.13.5.3 No Project Alternative
If the No Project Alternative is implemented, short-term construction activities and long-term operation of the Project would not occur and the associated noise levels would not be generated. The No Project Alternative would result in the continuation of agricultural use-related noise levels at the site. The No Project Alternative would eliminate the Project-specific less-than-significant impacts discussed in Section 4.13.4.

4. Environmental Analysis Noise
McHenry Solar Farm 4.13-17 May 2011 Draft Environmental Impact Report
References – Noise California Department of Transportation (Caltrans), 1998, Traffic Noise Analysis Protocol for
New Highway Construction and Reconstruction Projects, October 1998.
Caltrans, 2004, Noise, Vibration, and Hazardous Waste Management Office, 2004, Transportation- and Construction-Induced Vibration Guidance Manual, June 2004.
California Department of Transportation (Caltrans) and North County Corridor Transportation Expressway Authority, 2009. North County Corridor State Route 108 East Route Adoption Plan, September 2009.
EDAW, 2008. City of Riverbank General Plan Recirculated Draft Environmental Impact Report, January 15, 2008.
Electrical Power Research Institute (EPRI), 1978. Transmission line Reference Book, 115-138 kV Compact Line Design.
Environmental Science Associates (ESA), 2011. Memorandum, ESA D209515.01 – SunPower Modesto, CA – Transformer Noise Exposure, from Jason Mirise, Senior Acoustics Specialist, to Matt Fagundes, Technical Associate, May 2, 2011.
Federal Transit Authority (FTA), 2006. Transit Noise and Vibration Impact Assessment, May 2006.
ICF International, 2010. Noise Levels from Single Axis Tracking Motors, Rosamond Solar Project, Kern County, CA, Memorandum dated March 11, 2010.
Kuhlman, 2006. Load Tap Changing Transformer, Nameplate Capacity, July 24, 2006.
Stanislaus County, 2008. 1994 Stanislaus County General Plan, rev. December 2008.
Stanislaus County, 2010. Stanislaus County Code, Chapter 10.46, Noise Control. Accessed online (http://qcode.us/codes/stanislauscounty/) December 28, 2010.

4. Environmental Analysis
McHenry Solar Farm 4.14-1 May 2011 Draft Environmental Impact Report
4.14 Population and Housing
This section identifies and evaluates issues related to Population and Housing the context of the proposed Project and alternatives. Discussed are the physical and regulatory setting; the baseline for determining environmental impacts; the criteria used for determining the significance of environmental impacts; potential impacts associated with construction, operation, maintenance, and decommissioning of the Project; and mitigation measures to reduce or avoid environmental impacts determined to be potentially significant.
4.14.1 Setting
4.14.1.1 Regional and Local Setting
Section 2.2, Project Location and Existing Land Use, provides general information about the regional and local setting. This section 4.14.1 provides setting information specific to Population and Housing.
The Project site is located in rural Stanislaus County, near the county’s northern border with San Joaquin County. This portion of Stanislaus County consists primarily of agricultural land with scattered rural residences and open space surrounding the Stanislaus River. The City of Riverbank is located approximately one mile to the east of the Project site, and the City of Modesto is slightly over two miles to the south. According to the U.S. Census Bureau, the population of Modesto was approximately 202,000 in 2009 and Riverbank had approximately 20,000 residents (Census, 2010). The northwest corner of the Project site is opposite the southeast corner of the unincorporated community of Del Rio. Land uses in Del Rio are primarily single-family residential and recreational (Del Rio Golf and Country Club). The population of Del Rio was estimated as approximately 1,146 in 2009 (Census, 2010). As of March 2011, Stanislaus County had an unemployment rate of 18.4 percent, Modesto’s unemployment rate was 16.0 percent, and Riverbank’s unemployment rate was 26.7 percent (EDD, 2011).
There are no residences located on the Project site; however, an existing residence and associated buildings are located adjacent to the site on Patterson Road near the intersection with McHenry Avenue.
4.14.1.2 Regulatory Setting
Stanislaus County
General Plan
The Stanislaus County General Plan contains goals, policies and implementation measures that apply to all development projects in the unincorporated areas of the county. However, the General Plan contains no goals, policies or implementation measures that are applicable to the proposed Project in the context of population and housing (Stanislaus County, 2008).

4. Environmental Analysis Population and Housing
McHenry Solar Farm 4.14-2 May 2011 Draft Environmental Impact Report
4.14.1.3 Baseline
The environmental setting described above constitutes the baseline for determining the significance of potential impacts on Population and Housing.
4.14.2 Significance Criteria Based on CEQA Guidelines Appendix G, a project would cause a significant impact on Population and Housing if it would:
a) Induce substantial population growth in an area, either directly (for example, by proposing new homes and businesses) or indirectly (for example, through extension of roads or other infrastructure);
b) Displace substantial numbers of existing housing, necessitating the construction of replacement housing elsewhere; or
c) Displace substantial numbers of people, necessitating the construction of replacement housing elsewhere.
4.14.3 Discussion of Criteria with No Population and Housing Impacts
Analysis of the setting and Project characteristics relative to the significance criteria show that the proposed Project would have no impact on Population and Housing. The reasoning supporting this conclusion follows.
a) The proposed Project would not induce substantial population growth in an area, directly or indirectly.
The Project site is currently used as farmland (strawberries) with no housing and would be developed as a solar farm with no housing. Therefore, no direct inducement of population growth would result from implementation of the proposed Project.
The proposed Project would provide temporary employment opportunities, but this would not result in substantial population growth. The construction period would last approximately 10 months, and the project would provide employment for between 28 and 144 construction workers per month. The peak workforce of 144 would occur during months 4, 5 and 6. During Project operation, one permanent full-time plant manager and one full-time maintenance staff would work in the O&M building with other support personnel employed, as needed. In addition, security personnel would monitor the site during non-business hours and panel washing crews would be on-site two to four times per year. Decommissioning activities are expected to require a workforce of approximately 60 workers and would take approximately 3 months to complete.
It is anticipated that all temporary and permanent positions during construction, operation, and decommissioning phases would be filled from the local labor pool in Modesto and other nearby communities due to the high unemployment rates in Stanislaus County, Modesto, and Riverbank. Thus, the Project would not induce population growth in the area.

4. Environmental Analysis Population and Housing
McHenry Solar Farm 4.14-3 May 2011 Draft Environmental Impact Report
The purpose of the new electrical infrastructure would be to transfer power generated by the solar arrays to the regional electric grid. The access roads would be privately-owned and would neither extend off-site nor provide convenient connection points for potential off-site development. The proposed sub-transmission and distribution lines would also not extend off-site unless either the Option 1 or Option 2 sub-transmission line alignment was chosen by MID, in which case the line would connect to the existing Ladd-Clough 69-kV line on the west side of McHenry Avenue. The proposed Project also includes the installation of approximately 7.5 miles of overhead fiber optic cable by MID. The cable would be installed on existing off-site distribution and sub-transmission lines to enhance the reliability of communications on MID’s electric system. Construction of the proposed sub-transmission line route (or either optional route), access roads, or new fiber optic cable would not encourage new development or induce population growth in the area.
The increased generation from solar energy proposed by the Project is necessary to meet the California’s statewide goal of achieving a 33 percent renewable energy share by 2020 (enacted into law in April 2011 with the Governor’s signing of Senate Bill 1X-2), and therefore, is not considered growth-inducing because there is not currently a shortage of electrical power.
b) The proposed Project would not displace substantial numbers of existing housing.
There are no housing units on the Project site. One occupied residential dwelling is located adjacent to the site near the intersection of Patterson Road and McHenry Avenue. The Project would not result in the displacement of any existing housing, and therefore, would not necessitate the construction of replacement housing elsewhere. Consequently the Project would have no impact resulting in the displacement of existing housing.
c) The proposed Project would not displace substantial numbers of people.
No people live on the Project site. Therefore, no one would be displaced by the Project, and it would not be necessary, as result of the Project, to construct replacement housing. Consequently, the Project would have no impact related to the displacement of people.
4.14.4 Impacts and Mitigation Measures Because implementation of the proposed Project would cause no impact on population or housing, there are no impacts and no mitigation measures to be analyzed in this section.
4.14.5 Alternatives
4.14.5.1 Reduced Project
Similar to the proposed Project, the Reduced Project Alternative would have no impact on population and housing. If this alternative is implemented, the site would be developed as a solar farm with no housing on it. It is anticipated that all temporary and permanent positions during construction, operation, and decommissioning phases would be filled from the local labor pool in Modesto and other nearby communities due to the high unemployment rates in Stanislaus County, Modesto, and Riverbank. Thus, the Project would not induce population growth in the area. The

4. Environmental Analysis Population and Housing
McHenry Solar Farm 4.14-4 May 2011 Draft Environmental Impact Report
generation of solar energy to meet statewide goals is also not considered growth-inducing. No existing housing or people would be displaced by this alternative.
4.14.5.2 Non-Agriculture Site
Because this alternative site is located within Stanislaus County and only 4 miles from the location of the proposed Project site, the population and housing setting described above in Section 4.14.1, Setting, is also applicable to this alternative site.
No impact to Population and Housing would occur if this alternative is implemented. If this alternative is implemented, the site would be developed as a solar farm with no housing on it. It is anticipated that all temporary and permanent positions during construction, operation, and decommissioning phases would be filled from the local labor pool in Modesto and other nearby communities due to the high unemployment rates in Stanislaus County, Modesto, and Riverbank. Thus, the Project would not induce population growth in the area. The generation of solar energy to meet statewide goals is also not considered growth-inducing. No existing housing or people would be displaced by this alternative.
4.14.5.3 No Project
If the No Project Alternative is implemented, the proposed Project would not be constructed or operated; therefore, there would be no impact related to population and housing.
References – Population and Housing California Employment Development Department (EDD), 2011. Labor Market Information
Division, Monthly Labor Force Data for Cities and Census Designated Places, available at www.labormarketinfo.edd.ca.gov, March 2011.
Stanislaus County, 2008. 1994 Stanislaus County General Plan, rev. December 2008.
U.S. Census Bureau (Census), 2010. American FactFinder, 2005-2009 American Community Survey 5-Year Estimates. Fact Sheets for Del Rio Census Designated Place, City of Riverbank, and City of Modesto. www.factfinder.census.gov.

4. Environmental Analysis
McHenry Solar Farm 4.15-1 May 2011 Draft Environmental Impact Report
4.15 Public Services
This section identifies and evaluates issues related to Public Services in the context of the proposed Project and alternatives. Discussed are the physical and regulatory setting; the baseline for determining environmental impacts; the criteria used for determining the significance of environmental impacts; potential impacts associated with construction, operation, maintenance, and decommissioning of the Project; and mitigation measures to reduce or avoid environmental impacts determined to be potentially significant.
4.15.1 Setting
4.15.1.1 Regional and Local Setting
Section 2.2, Project Location and Existing Land Use, provides general information about the regional and local setting. This section 4.15.1 provides setting information specific to Public Services.
Fire Protection Fire protection services to the Project site are provided by the Stanislaus Consolidated Fire Protection District (SCFPD). The SCFPD serves approximately 217 square miles of unincorporated Stanislaus County and also provides fire protection services to the cities of Riverbank and Waterford, as well as the communities of Empire, Hickman, and La Grange. The SCFPD has 51 career employees, approximately ten volunteers, and six fire stations with an annual operating budget of $8.2 million. SCFPD Operational Staff consists of Battalion Chiefs, Captains, Engineers, and Firefighters who work consecutive 48-hour shifts on a rotational schedule that comprises a 56-hour week. The SCFPD responds to approximately 12 calls for emergency assistance per day (SCFPD, 2010).
The nearest fire station to the Project site is Station 36, located approximately 3.5 miles east at 3318 Topeka Street in the City of Riverbank. Station 36 is staffed 24 hours a day and includes two type-one engines, one type-three engine, one type-one water tender, and a water rescue boat (SCFPD, 2010).
Law Enforcement The Stanislaus County Sheriff’s Department (SCSD) provides law enforcement services to the unincorporated areas of Stanislaus County, including the Project site. The SCSD serves a population of over 100,000 covering an area of approximately 1,500 square miles. The SCSD also provides law enforcement services to four contract cities: Riverbank, Patterson, Hughson, and Waterford. The Operations Division has principal law enforcement jurisdiction in the unincorporated areas of the county. The Patrol unit responds to calls for assistance 24 hours a day.
The county is divided into four geographic areas, with the Project site located in the North Area Command within Beat 39. The North Area Command serves the communities of Del Rio and Empire, as well as the Airport District. It also provides contractual police services to the City of
4. Environmental Analysis Public Services
McHenry Solar Farm 4.15-2 May 2011 Draft Environmental Impact Report
Riverbank. The North Area Command station is located in Riverbank at 6727 Third Street, approximately 3.5 miles east of the Project site (SCSD, 2010).
Schools The Project site is located within the Stanislaus Union School District and the Modesto City High School District. The assigned schools for the site are Stanislaus Elementary School at 1931 Kiernan Avenue and Fred C. Beyer High School at 1717 Sylvan Avenue in the City of Modesto (SCGIS, 2010). Rio Altura Elementary School, which is part of the Riverbank Unified School District, is the nearest school to the site. This school is located approximately 2 miles east of the site at 2400 Stanislaus Avenue in the City of Riverbank (NOC, 2010).
Parks Stanislaus County contains numerous recreational facilities, including regional parks, community parks; neighborhood parks; and private recreational facilities. No public parks or recreational facilities are located on the Project site. Park and recreation facilities are discussed in Section 4.16, Recreation.
Other Public Facilities No other public facilities are located on the Project site. The Riverbank Branch of the Stanislaus County Library is located approximately 3 miles east of the Project site. The nearest public hospital is the Kaiser Permanente-Modesto Medical Center approximately five miles southwest of the site.
4.15.1.2 Regulatory Setting
State of California Government Code Sections 65996 and 65997 provide the exclusive methods of considering and mitigating impacts to school facilities that might occur as a result of the development of real property.
Education Code Section 17620, listed in Government Code Section 65997 as an approved mitigation method, allows school districts to levy a fee or other requirement against any construction within the boundaries of the school district for the purpose of funding construction of school facilities.
Stanislaus County
General Plan
The Stanislaus County General Plan contains goals, policies, and implementation measures that could be applicable to the proposed Project. For example, Safety Element Policy 7 addresses fire and sheriff protection. Implementation Measure 2 of this policy states that all discretionary projects shall be referred to the Fire Safety Department for review. Similarly, Implementation Measure 6 requires Sheriff’s Department review (Stanislaus County, 2008).

4. Environmental Analysis Public Services
McHenry Solar Farm 4.15-3 May 2011 Draft Environmental Impact Report
4.15.1.3 Baseline
The environmental setting described above constitutes the baseline for determining the significance of potential impacts on Public Services. There are no residents on the Project site; however, an existing residence is located adjacent to the site on Patterson Road near the intersection with McHenry Avenue.
4.15.2 Significance Criteria Based on CEQA Guidelines Appendix G, a project would cause a significant impact on Public Services if it would:
a) Result in substantial adverse physical impacts associated with the provision of new or physically altered governmental facilities, need for new or physically altered governmental facilities, the construction of which could cause significant environmental impacts, in order to maintain acceptable service ratios, response times or other performance objectives for any of the public services:
1. Fire Protection; 2. Police Protection; 3. Schools; 4. Parks; or 5. Other public facilities.
4.15.3 Discussion of Criteria with No Public Services Impacts Analysis of the setting and Project characteristics relative to the significance criteria show that the proposed Project would have no impact on Public Services. The reasoning supporting this conclusion is as follows:
a1) The proposed Project would not result in a substantial adverse physical impact associated with the provision of new or physically altered fire protection facilities.
Construction and decommissioning activities could temporarily affect the demand for fire protection and emergency response services due to the increased traffic associated with construction worker vehicle trips in the area. The construction period would last approximately 10 months, and between 28 and 144 construction workers would be working at the site per month. The peak workforce of 144 would occur during months 4, 5 and 6. Decommission activities are expected to require a workforce of approximately 60 workers and would take approximately 3 months to complete. Temporary construction-related or decommission-related increases in demand on fire protection services would not be significant enough to require the construction of a new fire station or the modification of an existing fire station, nor would it require hiring additional fire fighters.
Increases in long-term demand for fire protection services typically are associated with substantial increases in population. The proposed Project would be staffed by two permanent employees during Project operation with additional support personnel, as needed, for panel washing approximately twice per year. Sub-transmission and distribution line and switchyard maintenance would occur on a regular basis when MID is conducting its routine maintenance of all of its facilities in its service

4. Environmental Analysis Public Services
McHenry Solar Farm 4.15-4 May 2011 Draft Environmental Impact Report
area. Therefore, operational activities would not contribute to a population increase, and would not increase the demand for fire protection services or require new or altered facilities.
The proposed Project would not result in a substantial increased short-term or long-term demand for fire protection services. Accordingly, the Project would not require the construction or modification of fire service facilities, the construction of which could cause significant environmental impacts, nor would it require hiring additional fire fighters.
a2) The proposed Project would not result in a substantial adverse physical impact associated with the provision of new or physically altered police protection facilities.
Construction and decommissioning activities could temporarily affect the demand for police protection services. The construction period would last approximately 10 months, and between 28 and 144 construction workers would be working at the site per month. The peak workforce of 144 would occur during months 4, 5 and 6. Decommission activities are expected to require a workforce of approximately 60 workers and would take approximately 3 months to complete. Police protection service needs primarily would be required for theft of construction equipment and/or vandalism. Additionally, Project construction may, at times, require temporary partial closure of adjacent roadways, requiring traffic control measures, or safety measures that would typically be coordinated with the Sheriff’s Department. However, a temporary construction-related or decommission-related increase in demand on police services would not be significant enough to require the construction of a new Sheriff’s station or the modification of an existing station, nor would it require hiring additional law enforcement personnel.
Project operation and maintenance activities would require two full-time employees and additional personnel at limited times for routine maintenance and panel washing. As necessary for public safety and site security, the Applicant would install a 6- to 8-foot-high fence around the perimeter of the Project site with landscaping installed at key locations to minimize visibility. Exterior security lighting would be installed at the O&M building, substation, and site entrance to provide for safe access to the building and project facilities. Security personnel would monitor the facility during non-business hours and at times when no O&M staff would be present on-site.
Temporary construction, operation, or decommission demands for police protection services would not require new or physically altered Sheriff’s Department facilities nor hiring additional law enforcement personnel. Therefore, no impact to police protection services would result from implementation of the Project.
a3) The proposed Project would not result in a substantial adverse physical impact associated with the provision of new or physically altered school facilities.
No schools are present on-site or within 2 miles of the Project site. No residences are proposed as part of the Project, and all temporary Personnel (up to 144 workers), permanent personnel (two employees), and decommission workers (up to 60) who would work at the site are expected to be from the local area, therefore, the Project would not generate a demand for new school facilities, nor would it require the alteration of existing school facilities. It is expected that temporary and permanent employees reside locally and their school-aged children are part of the existing or

4. Environmental Analysis Public Services
McHenry Solar Farm 4.15-5 May 2011 Draft Environmental Impact Report
anticipated student population. Even if the permanent employees relocated to the area, two additional families would not exceed the schools projected enrollment projections. Therefore, implementation of the Project would not require the construction or expansion of school facilities and no impact would occur.
a4) The proposed Project would not result in a substantial adverse physical impact associated with the provision of new or physically altered park facilities.
Residential uses are not proposed as part of the Project; therefore, no direct increase in the number of park users is expected to result from the Project. It is expected that the construction workers, permanent employees, and decommission workers and their families would already reside locally, and so would be an existing park facility user. Even if the permanent employees were to relocate to the area, two additional families would not have an adverse physical impact on existing park facilities. Therefore, the Project would not require new park facilities or alterations to existing park facilities, and no impact would occur.
a5) The proposed Project would not result in a substantial adverse physical impact associated with the provision of any other public facilities.
No other public facilities, such as meeting halls, libraries, or hospitals are present on-site. No residences or public facilities are proposed as part of the Project. It is expected that the construction workers, permanent employees, and decommission workers and their families would already reside locally, and so would already be existing users of public facilities. Even if the permanent employees were to relocate to the area, two additional families would not have an adverse physical impact on public facilities. Therefore, constructing, operating, and decommissioning the Project would neither increase the demand on existing public facilities nor require the construction or expansion of any other public facilities. Accordingly, no impact would occur.
4.15.4 Impacts and Mitigation Measures Because implementation of the proposed Project would not impact public services, there are no impacts and no mitigation measures to be analyzed in this section.
4.15.5 Alternatives
4.15.5.1 Reduced Project
Similar to the proposed Project, the Reduced Project Alternative would have no impact to public services. Temporary construction-related and decommission-related increases in demand for fire protection and police services would not require the construction of any new facilities or hiring additional employees. Two employees would be on the site full-time during Project operation and maintenance, and security measures, such as fencing and exterior lighting, would be similar to the proposed Project. Two new full-time staff are proposed for Project operation, and it is expected that they would come from the local area, so the student population is not expected to increase, with no effect on nearby schools. It is expected that construction and decommission workers would reside locally, and would therefore, already be park facility users. Even if the permanent

4. Environmental Analysis Public Services
McHenry Solar Farm 4.15-6 May 2011 Draft Environmental Impact Report
employees were to relocate to the area, two additional families would not have an adverse physical impact on public services.
4.15.5.2 Non-Agriculture Site
Fire protection services to this alternative site are provided by the recently-formed Modesto Regional Fire Authority, which is comprised of the former Salida Fire Protection District, City of Modesto Fire Department, and Stanislaus County Office of Emergency Services and Fire Warden’s Office (MRFA, 2011). The Stanislaus County Sheriff’s Department provides law enforcement services. The alternative site is located within the Salida Union Elementary School District and the Modesto City High School District (SCGIS, 2011). No parks or other public facilities are located on this alternative site.
No impact to Public Services would occur if this alternative is implemented. Temporary construction-related and decommission-related increases in demand for fire protection and police services would not require the construction of any new facilities or the hiring of additional fire or law enforcement personnel. Two employees would be on the site full-time during operation and maintenance, and security measures such as fencing and exterior lighting, would be similar to the proposed Project. No residences are proposed, so the student population is not expected to increase, with no effect on nearby schools, including the adjacent Joseph A. Gregori High School. It is expected that construction workers and decommission workers would reside locally, and would therefore, already be park facility users. Even if the permanent employees were to relocate to the area, two additional families would not have an adverse physical impact on public services.
4.15.5.3 No Project
If the No Project Alternative is implemented, the proposed Project would not be constructed, operated, or decommissioned; therefore, there would be no impact related to Public Services.
References – Public Services Modesto Irrigation District, McHenry Solar Farm Project, Notice of Completion (NOC) of the
Notice of Preparation, December 6, 2010.
Modesto Regional Fire Authority (MRFA), 2011. Joint Powers Agreement, January 17, 2011.
Stanislaus County, 2008. 1994 Stanislaus County General Plan, rev. December 2008.
Stanislaus County Geographic Information Systems (SCGIS), 2010. School district map, 2010.
SCGIS, 2011. School district map, 2011.
Stanislaus Consolidated Fire Protection District (SCFPD), 2010. www.scfpd.us, accessed December 14, 2010.
Stanislaus County Sheriff’s Department (SCSD), 2010. www.stanislaussheriff.com, accessed December 14, 2010.

4. Environmental Analysis
McHenry Solar Farm 4.16-1 May 2011 Draft Environmental Impact Report
4.16 Recreation
This section identifies and evaluates issues related to Recreation in the context of the proposed Project and alternatives. Discussed are the physical and regulatory setting; the baseline for determining environmental impacts; the criteria used for determining the significance of environmental impacts; potential impacts associated with construction, operation, maintenance, and decommissioning of the Project; and mitigation measures to reduce or avoid environmental impacts determined to be potentially significant.
4.16.1 Setting
4.16.1.1 Regional and Local Setting
Section 2.2, Project Location and Existing Land Use, provides general information about the regional and local setting. This section 4.16.1 provides setting information specific to Recreation.
Stanislaus County contains numerous recreational facilities, including regional parks and open space areas, community parks, off-road parks, and private recreational facilities. McHenry Avenue Recreation Area is the nearest public park in the vicinity of the Project site. It is located across the Stanislaus River in San Joaquin County, approximately one mile northwest of the site. This park is managed by the U.S. Army Corps of Engineers, and it provides access to the river as well as camping and picnic sites (USACE, 2010). The nearest neighborhood park is Safreno Park at 2308 McAllister Lane in the City of Riverbank, approximately 2 miles east of the Project site. This 5-acre park includes playground equipment and an open field used for soccer (City of Riverbank, 2010).
The privately owned Del Rio Golf and Country Club is located approximately 0.5 mile northwest of the site. The club includes a 27-hole golf course and tennis courts. The privately-owned Modesto Rifle Club is located approximately 100 yards east of the Project site at 1041 Patterson Road. The club is separated from the Project site by an orchard. Facilities include a clubhouse, indoor and outdoor rifle and pistol ranges, and other associated structures.
4.16.1.2 Regulatory Setting
Stanislaus County
General Plan
The Stanislaus County General Plan contains goals, policies and implementation measures that could be applicable to the proposed Project. For example, the Conservation/Open Space Element contains policies that seek to maintain the natural environment in parks and open space areas (Policy 1), assure compatibility between natural areas and development (Policy 2), provide for local and regional parks (Policy 12), provide for trails and bikeways (Policy 14), and coordinate recreational resources with other federal, state and local agencies and private organizations (Policy 15) (Stanislaus County, 2008).

4. Environmental Analysis Recreation
McHenry Solar Farm 4.16-2 May 2011 Draft Environmental Impact Report
4.16.1.3 Baseline
The environmental setting described above constitutes the baseline for determining the significance of potential impacts on Recreation. There is no direct access from the Project site to the parks and recreation resources described above.
4.16.2 Significance Criteria Based on CEQA Guidelines Appendix G, a project would cause a significant impact on Recreation if it would:
a) Increase the use of existing neighborhood and regional parks or other recreational facilities such that substantial physical deterioration of the facility would occur or be accelerated; or
b) Include recreational facilities or require the construction or expansion of recreational facilities that might have an adverse physical effect on the environment.
4.16.3 Discussion of Criteria with No Recreation Impacts Analysis of the setting and Project characteristics relative to the significance criteria show that the proposed Project would have no impact on Recreation. The reasoning supporting this conclusion follows.
a) The proposed Project would not increase the use of existing neighborhood and regional parks or other recreational facilities such that physical deterioration of the facility would occur or be accelerated.
Increases in demand for recreational facilities typically are associated with substantial increases in population. The proposed Project would not contain a residential component that would result in an increased use of existing recreational facilities. There are no existing neighborhood parks on the Project site. The nearest neighborhood park is Safreno Park, approximately 2 miles east of the Project site, in the City of Riverbank. McHenry Avenue Recreation Area is the nearest regional park, located approximately 1 mile northwest of the Project site.
Operation and maintenance of the proposed Project would result in two permanent employees at the Project site, and therefore, would not result in a substantial increased demand for recreational facilities or increase the use of existing parks or recreational facilities. Due to the small number required, construction and decommission workers are expected to be local, and therefore, to be among the existing users of available facilities. The number of construction workers that would be required to construct the proposed Project, at its peak, would be approximately 144 workers per day. Construction activities would be temporary, lasting approximately 10 months. Decommission activities are expected to require a workforce of approximately 60 workers and would take approximately 3 months to complete. The proposed Project, therefore, would not result in a substantial increased demand for recreational facilities and would not increase the use of existing parks or recreational facilities so as to cause or accelerate the physical deterioration of any such facility. Therefore, no impact would result.

4. Environmental Analysis Recreation
McHenry Solar Farm 4.16-3 May 2011 Draft Environmental Impact Report
b) The proposed Project would not include recreational facilities or require the construction or expansion of recreational facilities that might have an adverse physical effect on the environment.
The proposed Project would not include recreational facilities. Further, it would not require the construction or expansion of recreational facilities because the Project would generate two permanent full-time employees. Due to the small number required, construction and decommission workers are expected to be local, and therefore, would be among the existing users of available facilities. The construction period would be limited in personnel and in duration: a peak workforce of 144 (occurring during approximately three months of the 10-month construction period) would be retained for Project construction. Decommission activities are expected to require a workforce of approximately 60 workers and would take approximately 3 months to complete. There would be no project-related increase in demand for recreational facilities, therefore, no new recreational facilities would need to be developed or expanded that could have an adverse physical effect on the environment. Therefore, no impact would occur.
4.16.4 Impacts and Mitigation Measures Because implementation of the proposed Project would result in no impact on recreation, there are not impacts or mitigation measures to be analyzed in this section.
4.16.5 Alternatives
4.16.5.1 Reduced Project
Similar to the proposed Project, the Reduced Project Alternative would have no impact to Recreation. This alternative does not include a residential component that would result in an increased use of existing recreational facilities. In addition, no new recreational facilities would need to be constructed for this alternative and expansion of existing facilities would not be required. Construction and decommission workers are expected to be local, and therefore, would be among the existing users of available facilities. Similar to the proposed Project, this alternative would generate two permanent jobs, so it would not generate a demand for new recreation facilities.
4.16.5.2 Non-Agriculture Site
The nearest park to this alternative site is Segesta Park at Finney Road and Segesta Avenue in the unincorporated community of Salida, approximately 2 miles west of the Project site. This 9-acre park includes playground equipment, a lighted basketball court, informal play areas, benches, restrooms, and picnic tables (Stanislaus County, 2011).
No impact to Recreation would occur if this alternative is implemented. The Non-Agriculture Site Alternative does not include a residential component that would result in an increased use of existing recreational facilities. In addition, no new recreational facilities would need to be constructed for this alternative and expansion of existing facilities would not be required. Construction and decommission workers are expected to be local, and therefore, would be among

4. Environmental Analysis Recreation
McHenry Solar Farm 4.16-4 May 2011 Draft Environmental Impact Report
the existing users of available facilities. Similar to the proposed Project, this alternative would generate two permanent jobs, so it would not generate a demand for new recreation facilities.
4.16.5.3 No Project
If the No Project Alternative is implemented, the proposed Project would not be constructed, operated, or decommissioned; therefore, there would be no impact related to Recreation.
_________________________
References – Recreation City of Riverbank, 2010. City Parks,
www.riverbank.org/Depts/Recreation/Display%20Pages/CityParks.aspx. Site accessed December 20, 2010.
Stanislaus County, 2008. 1994 Stanislaus County General Plan, rev. December 2008.
Stanislaus County, Department of Parks and Recreation, 2011. www.stancounty.com/er/parks. Site accessed April 26, 2011.
U.S. Army Corps of Engineers (USACE), 2010. Corps Lakes Gateway, Stanislaus River Parks. http://corpslakes.usace.army.mil/visitors/projects.cfm?Id=L212460. Site accessed December 13, 2010.

4. Environmental Analysis
McHenry Solar Farm 4.17-1 May 2011 Draft Environmental Impact Report
4.17 Transportation/Traffic
This section identifies and evaluates issues related to Transportation and Traffic in the context of the proposed Project and alternatives. Discussed are the physical and regulatory setting; the baseline for determining environmental impacts; the criteria used for determining the significance of environmental impacts; potential impacts associated with construction, operation, maintenance, and decommissioning of the Project; and mitigation measures to reduce or avoid environmental impacts determined to be potentially significant.
4.17.1 Setting
4.17.1.1 Regional and Local Setting
Section 2.2, Project Location and Existing Land Use, provides general information about the regional and local setting. This Section 4.17.1 provides setting information specific to Transportation and Traffic conditions.
Regional Roadways State Route 99 (SR 99) is a six-lane freeway that is generally aligned in a north-south direction. SR 99 provides access to SR 120, SR 132, SR 219, and to multiple communities throughout Stanislaus and San Joaquin counties. The most recent data published by Caltrans indicates the Annual Average Daily Traffic (AADT) on the roadway is approximately 110,000 vehicles (Caltrans, 2010a). The roadway is included in the Stanislaus County Congestion Management Program (CMP) Roadway Network (Stanislaus Council of Governments, 2010b).
State Route 108 (SR 108) is a two-lane major road that is generally aligned along Patterson Road in an east-west direction; however, the roadway is aligned in a north-south direction at its western junction at McHenry Avenue, as it continues along McHenry Avenue to Needham Street north of Modesto (Stanislaus County, 2008). SR 108 provides access to SR 99, SR 120, SR 219, and to multiple communities, including Riverbank and Oakdale. The most recent data published by Caltrans indicates the AADT on the roadway is approximately 16,100 vehicles (Caltrans, 2010a). The roadway is included in the CMP Roadway Network (Stanislaus Council of Governments, 2010b).
State Route 219 (SR 219) is a two-lane highway that is aligned in an east-west direction. SR 219 continues along Kiernan Avenue from McHenry Avenue (SR 108) to the east and its junction at SR 99 to the west. The highway generally serves the communities of Salida and Modesto. The most recent data published by Caltrans indicates the AADT on the roadway is approximately 14,500 vehicles (Caltrans, 2010a). The roadway is included in the CMP Roadway Network (Stanislaus Council of Governments, 2010b).

4. Environmental Analysis Transportation/Traffic
McHenry Solar Farm 4.17-2 May 2011 Draft Environmental Impact Report
Local Roadways McHenry Avenue is a two-lane north-south roadway that is designated as a Major road (Stanislaus County, 2008). The roadway is also designated SR 108 south of Patterson Road, providing vehicular access to SR 132, SR 219, as well as access to communities, including McHenry, Aurora, and Modesto.
Patterson Road is a two-lane east-west roadway that is designated as a Major road east of McHenry Road and is designated as a Collector Road west of McHenry Road (Stanislaus County, 2008). The roadway is also designated SR 108 between Calland Avenue to the east and its junction at McHenry Avenue to the west; it becomes Ladd Road west of McHenry Avenue. The roadway generally serves as a main corridor throughout the Riverbank area.
Ladd Road is a two-lane collector road is aligned in an east-west direction extending from Stoddard Road to the west and becoming Patterson Road east of McHenry Avenue (Stanislaus County, 2008).
The Project would be located at the northeast corner of the intersection of McHenry Avenue at Patterson Road – Ladd Road. This intersection has recently been redeveloped as a part of the Stanislaus County Capital Improvement Program (CIP), which approves funding for intersection improvements. The newly signalized and widened intersection is comprised of two through lanes on each of the McHenry Avenue northbound and southbound approaches, and an exclusive right-turn lane on the westbound Patterson Road approach; right turns share the through lane with through traffic on the northbound and southbound McHenry Avenue approaches, and the eastbound Ladd Road approach. An exclusive left-turn lane is provided on all four approaches to the intersection (Stanislaus County, 2010a, p.157).
Transit Facilities The Stanislaus Regional Transit (StaRT) provides fixed-route, deviated fixed-route, and curb-to-curb, dial-a-ride bus transportation services throughout Stanislaus County. The bus service provides connectivity to several other transit providers and transfer locations to several communities, including Turlock, Ceres, Modesto, Riverbank, and Oakdale (Stanislaus County, 2008). Currently, the StaRT Bus Route 60 (Modesto-Riverbank-Oakdale) operates fixed-route bus service along Patterson Road and McHenry Avenue. Weekday and Saturday bus service is available along this route, and the closest bus stops, in proximity to the Project, are located at the Claribel Road / McHenry Avenue intersection and the Patterson Road / Oakdale Road intersection. There is no bus stop adjacent to the Project site (Stanislaus Regional Transit, 2010).
Additional transit service in proximity to the Project site is provided by Riverbank-Oakdale Transit Authority (ROTA), which operates local and inter-city fixed-route bus service, and dial-a-ride service between both cities. Transit service is available Monday through Saturday, and the service provides several connections to other StaRT routes and direct service to Modesto.

4. Environmental Analysis Transportation/Traffic
McHenry Solar Farm 4.17-3 May 2011 Draft Environmental Impact Report
Bicycle and Pedestrian Facilities Bicycle facilities are classified as Class I (bicycle paths separated from roads), Class II (striped bicycle lanes within the paved areas of roadways), or Class III (signed bike routes that allow cyclists to share streets with vehicles) (Stanislaus Council of Governments, 2010a). Currently, there are no bicycle facilities in proximity of, or adjacent to, the Project.
Pedestrian facilities include sidewalks, crosswalks, curb ramps, pedestrian signals, and streetscape amenities. There are no pedestrian facilities in proximity of, or adjacent to, the Project.
4.17.1.2 Regulatory Setting
State of California
Department of Transportation (Caltrans)
Caltrans manages interregional transportation, including management and construction of the California highway system. In addition, Caltrans is responsible for permitting and regulation of the use of state roadways. Roads that are likely to be used as access routes by construction workers and construction vehicles to the project site include: SR 99, SR 108, and SR 219.
Caltrans’ construction practices require temporary traffic control planning “during any time the normal function of a roadway is suspended” (Caltrans, 2010b). Furthermore, Caltrans requires that permits be obtained for transportation of oversized loads and transportation of certain materials, and for construction-related traffic disturbance.
Stanislaus County
General Plan
The Stanislaus County General Plan contains goals, policies, and implementation measures that could be applicable to the Project. The Circulation Element of the General Plan includes strategies and principles as they aim to enhance compatibility between land use, infrastructure, and transportation modes (Stanislaus County, 2008). Applicable goals, policies, and implementation measures related to the Project are discussed below.
Policy 1: Development will be permitted only when facilities for circulation exist, or will exist as part of the development, to adequately handle increased traffic.
Implementation Measure 3: Developers will construct or pay the cost of new roads necessary to serve the development and mitigate impacts to existing roads.
Implementation Measure 7: County will require that newly created parcels will either have frontage on a County-maintained road or access will be provided per County Code.
Policy 2: Circulation systems shall be designed and maintained to promote safety and minimize traffic congestion.

4. Environmental Analysis Transportation/Traffic
McHenry Solar Farm 4.17-4 May 2011 Draft Environmental Impact Report
Implementation 1: County shall maintain level of service (LOS) C or better for all County roadways and intersections, and in no case shall the adopted LOS fall below LOS D.
Policy 5: Transportation requirements of commercial and industrial development shall be considered in all planning, construction, and improvements.
Implementation Measure 1: Roads constructed in zoning districts that allow industrial and commercial uses shall be designed and constructed to accommodate truck traffic.
Implementation Measure 2: Prior to development, provisions will be made to ensure that roadways providing access to these developments are designed and constructed to the necessary standards to accommodate truck traffic.
Implementation Measure 3: Development shall be planned so that truck access through residential areas is avoided.
Implementation Measure 5: Off-street truck parking standards shall be developed to ensure adequate parking is provided in new or expanding development.
Implementation Measure 6: On-street truck parking shall be discouraged where parking restricts adequate sight distances, detracts from visual aesthetics, or poses a potential hazard to motorists, bicyclists, or pedestrians.
Stanislaus County Congestion Management Program
The Stanislaus Council of Governments (StanCOG) serves as the Congestion Management Agency (CMA) of Stanislaus County. StanCOG is authorized to set state and federal funding priorities for transportation improvements affecting the Stanislaus County CMP transportation system. SR 99, SR 108, and SR 219 are roadways within the Project area that are designated as a part of the CMP roadway system.
The CMP specifies a system of highways and roadways for which traffic LOS standards are established. The Stanislaus County system includes all freeways, state highways, and principal arterials in the county. The program sets LOS standards for all CMP roadway segments and intersections – LOS C for roadways in rural areas and LOS D for roadways in urban areas. StanCOG requires local jurisdictions to analyze impacts of new developments or land use policy changes on CMP facilities (Stanislaus Council of Governments, 2010b, p. 44).
City of Riverbank The Project would be located in an unincorporated area of Stanislaus County; however, according to the City of Riverbank General Plan Update, the Project site would be located within the City’s “Sphere of Influence” (City of Riverbank, 2009). The Circulation Element of the City of Riverbank General Plan Update includes policies for providing specific direction in maintaining transportation service standards, improvements, sharing the cost for improvements, and managing travel demand for land in areas throughout the City of Riverbank (City of Riverbank, 2009). Specific goals, objectives, and policies specific to the Project include:
Policy CIRC-1.12: City will use LOS D as the goal for roadway segments, as measured on a daily basis. The City’s goal for peak-hour intersection LOS is LOS D.

4. Environmental Analysis Transportation/Traffic
McHenry Solar Farm 4.17-5 May 2011 Draft Environmental Impact Report
Policy CIRC-4.1: City will work with relevant public agencies to appropriately regulate the movement of truck traffic and hazardous materials through the City.
Policy CIRC-4.6: City will limit truck traffic to appropriate routes. Truck routes include SR 108 through the City (Patterson Road, Callander Avenue, and Atchison Street), Roselle Avenue, First Street (downtown area), Claus Road, Claribel Road, Snedigar Avenue, and Coffee Road. The City will designate, post signage, and otherwise restrict truck traffic from using other streets.
4.17.1.3 Baseline
The environmental setting described above constitutes the baseline for determining the significance of potential impacts on transportation and traffic. It consists of the actual pre-Project environmental conditions (physical and traffic characteristics) on area roadways (regional and local).
4.17.2 Significance Criteria Based on CEQA Guidelines Appendix G, a project would cause a significant impact on
transportation and traffic if it would:
a) Conflict with an applicable plan, ordinance, or policy establishing measures of effectiveness for the performance of the circulation system, taking into account all modes of transportation including mass transit and non-motorized travel and relevant components of the circulation system, including but not limited to intersections, streets, highways and freeways, pedestrian and bicycle paths, and mass transit.
b) Conflict with an applicable congestion management program, including, but not limited to level of service standards and travel demand measures, or other standards established by the county congestion management agency for designated roads or highways.
c) Result in a change in air traffic patterns, including either an increase in traffic levels or a change in location that results in substantial safety risks.
d) Substantially increase hazards due to a design feature (e.g., sharp curves or dangerous intersections) or incompatible uses (e.g., farm equipment).
e) Result in inadequate emergency access.
f) Conflict with adopted policies, plans, or programs regarding public transit, bicycle, or pedestrian facilities, or otherwise decrease the performance or safety of such facilities.
4.17.3 Discussion of Criteria with No Transportation/Traffic Impacts
Analysis of the setting and Project characteristics relative to the significance criteria show that the Project would have no impact on Transportation/Traffic with respect to criteria c) or f). The reasoning supporting this conclusion is as follows:

4. Environmental Analysis Transportation/Traffic
McHenry Solar Farm 4.17-6 May 2011 Draft Environmental Impact Report
c) The Project would not result in a change in air traffic patterns.
The Project is approximately 8 miles from the nearest airport (Modesto Municipal Airport), and would not place any object within the flight path for airplanes in the area, nor have any structures 500 feet high or taller. The Project would not result in a change in air traffic patterns, including either an increase in traffic levels or a change in location that results in substantial safety risks.
f) The Project would not conflict with adopted policies, plans, or programs supporting alternative transportation.
The Project would not directly or indirectly eliminate alternative transportation corridors or facilities (e.g., bike paths, lanes, or bus turnouts). In addition, the Project would not include changes in policies or programs that support alternative transportation. Therefore, the Project would not conflict with adopted policies, plans, or programs regarding public transit, bicycle, or pedestrian facilities, or otherwise decrease the performance or safety of such facilities.
4.17.4 Impacts and Mitigation Measures
4.17.4.1 Methodology
Project Construction Construction of the proposed solar facility would occur over approximately 10 months (tentatively from September 2011 to July 2012). Construction activities would involve site preparation, solar array construction, distribution and sub-transmission line installation (which would include the emplacement of up to nine new 65-foot-tall wood poles and up to 1,500 feet of new sub-transmission and distribution line), approximately 7.5 miles of new fiber optic cable, and construction of a substation, switchyard, and O&M building. Construction activities would occur simultaneously, and overlap one another, with grading and access road construction preceding the installation of trackers and associated equipment within each array area.
Construction staging and site preparation would be delineated within the confines of the Project site. Staging and other work areas would include temporary office trailers, parking for construction workers, and materials delivery area. Materials would be scheduled on a timely basis (as required) and would be sent out immediately to the area where they would be installed; therefore, materials would be staged on-site for a short period because temporary staging areas would move around the Project site as the construction progresses.
New access roads would be constructed for ingress and egress, and between the solar array rows to facilitate installation, maintenance, and cleaning of the solar panels, and decommissioning of the facility. The planned site entrance (primary vehicle driveway location) would be located at the northern boundary of the site near the proposed O&M building and substation, and the access road would also surround each building and parking stalls. The entrance roadway will provide vehicular access from McHenry Avenue. Additional access roads would be constructed in the center of the arrays (between the O&M building and equipment pads) within the site, and roads would be constructed along the perimeter of the site. Figure 2-2, in Chapter 2, Project Description, provides an illustration of planned access roadways in and around the Project.

4. Environmental Analysis Transportation/Traffic
McHenry Solar Farm 4.17-7 May 2011 Draft Environmental Impact Report
Project construction activities could result in short-term traffic and circulation impacts as a result of temporary increases in traffic from construction workers and transport of equipment and materials. During the scheduled 10-month construction period, the anticipated number of workers on-site would range between 28 and 144; with the peak number of workers occurring during months 4, 5, and 6 (refer to Table 2-1 in Chapter 2, Project Description for detailed description of construction schedule and workforce). Construction equipment would operate between the hours of 7:00 a.m. and 7:00 p.m. Monday through Friday. Nighttime and weekend construction work is not expected, but may occur on occasion, depending on schedule considerations. Project-related traffic would primarily consist of delivery of equipment, vehicles and materials, and daily construction worker trips. Vans and covered flatbed trailers would be used to haul the majority of equipment to the site, including solar PV panels, inverters, tracker steel, transmission poles, substation circuit breakers, and substation steel. Wide-load trailers (with pilot cars) would be used for transport of substation equipment, inverter enclosures, and cranes.
Material delivery would be scheduled to occur during off-peak traffic hours, and would comply with all Caltrans permitting requirements when these loads are oversize. The majority of solar array materials would be transported by truck from the Oakland area. These transport vehicles would use freeways and state highways to access the site, including Interstate 5 (I-5), I-580, and SR 99. Approximately 430 deliveries are expected to be required to deliver solar array components to the site over a 6-month period (an average of approximately four truck deliveries per work day), and approximately four pilot cars are expected to accompany these haul trucks during transport (an average of approximately four daily trips per work day).
The majority of construction materials would be procured locally, within an approximate 10-mile radius of the Project site. An estimated 460 deliveries are expected to be required to deliver construction materials to the site over the 10-month period (an average of approximately two truck deliveries per work day).
The majority of the labor force during the construction phase would be from the Modesto area and surrounding communities. Construction worker traffic would vary, depending on scheduling and phasing; however, worker-related traffic would average approximately 92 workers each day, and up to 144 workers each day during peak construction periods. Some carpooling among workers could occur, but to ensure that vehicle trip generation is not underestimated for the analysis of potential impacts, it is assumed that all workers would travel to and from the Project site alone. As a result, accounting for commute trips and miscellaneous midday trips, construction workers would generate an average of approximately 115 daily round trips, and approximately 180 round trips during peak construction periods.
Construction activity associated with staging, site preparation, installation, array assembling, commission of the facility, and subsequent delivery of construction materials and equipment would result in an average of 125 daily vehicle round trips to and from the site (250 one-way trips) over the 10-month period. During peak construction periods, approximately 190 daily vehicle round trips (380 one-way trips) would travel to and from the site. Table 4.17-1 presents the average total daily and peak vehicle trips to and from the Project site during construction.

4. Environmental Analysis Transportation/Traffic
McHenry Solar Farm 4.17-8 May 2011 Draft Environmental Impact Report
TABLE 4.17-1 ESTIMATED DAILY VEHICLE TRIPS FOR PROJECT CONSTRUCTION
Purpose of Vehicle Trip Average
Trips Peak
Tripsd
Truck Delivery of Solar Array Materialsa 8 8
Truck Delivery of Construction Materialsb 2 2
Construction Workersc, e 115 180
Total Daily Round Trips 125 190
Total One-Way Trips (one inbound and one outbound, to and from the site) 250 380
a Refers to number of trucks for delivery of solar array materials and additional four pilot cars during transport. b Refers to number of trucks for delivery of construction materials. c Worker trips include average total round trips per day (92 trips) x 1.25 = 115, to account for miscellaneous midday trips. d Peak period construction (months 4, 5, 6) would include up to 144 construction workers on-site. e Worker trips include peak period total round trips per day (144 trips) x 1.25 = 180, to account for miscellaneous midday trips. SOURCE: ESA, February 2011.
Project Operation The analysis for long-term increases in traffic associated with Project operation considers the extent of additional employees required to operate the Project site and the need for additional maintenance activities. Normal operation could involve employment of two full-time employees (plant manager and maintenance staff member). Approximately four additional support personnel would be employed periodically, as needed, to assist in maintenance activities (including panel washing, which would occur approximately two to four times per year). The two permanent employees would perform inspections and maintenance of the facility. As a result, the long-term traffic associated with the Project would yield two daily round trips to and from the site (four one-way trips per day).
Project Decommissioning and Site Reclamation As discussed in Chapter 2, Project Description, the power purchase agreement between the Applicant and Modesto Irrigation District (MID) has a term of 25 years. If no contract extension is available at the end of the contract term, the Project would cease operation, and at that time, the facilities would be decommissioned and dismantled, and the site would be restored to its pre-existing use. As a result, the Project, by contract, would be in use from its build-out date of approximately July 2012 (date of operation) to Year 2037. It is expected that any long-term maintenance of the Project and associated traffic (as previously described) would occur throughout the contracted agreement period.
Decommissioning of the site would include removal of all equipment and buildings on-site, as well as excavation to remove underground utilities. Additional grading would be required to remove roads, and foundations would be demolished. Decommissioning activities would result in

4. Environmental Analysis Transportation/Traffic
McHenry Solar Farm 4.17-9 May 2011 Draft Environmental Impact Report
a total of approximately 300 haul truck trips, a workforce of approximately 60 workers on-site, and would require approximately 3 months to complete.
The decommissioning of MID facilities would include the dismantling and removal of the switchyard equipment, control building; sub-transmission, distribution, and fiber optic lines, and wooden poles between the switchyard and interconnection point. This work would take three weeks to complete and would require approximately four workers on-site, one dump truck, and one flatbed truck.
a) Conflict with an applicable plan, ordinance, or policy establishing measures of effectiveness for the performance of the circulation system, taking into account all modes of transportation including mass transit and non-motorized travel and relevant components of the circulation system, including but not limited to intersections, streets, highways and freeways, pedestrian and bicycle paths, and mass transit?
Impact 4.17-1: Project construction and decommissioning activities could intermittently and temporarily increase traffic congestion due to vehicle trips generated by construction workers and construction vehicles on area roadways. (Less than significant with mitigation)
Construction
An average of 92 workers and a maximum of 144 workers would be needed for Project construction, with truck delivery to haul and transport materials on a daily basis. The estimated daily traffic from construction workers would result in an average of approximately 115 daily round trips (230 one-way trips) and up to 180 daily round trips (360 one-way trips), although the Applicant would encourage the use of carpools during construction. In addition, truck trips to and from the Project site would average up to four truck trips per day for delivery of solar array materials, up to four pilot vehicles to accompany trucks hauling solar array materials, and up to two truck trips per day for delivery of construction materials. As a result, an average of up to ten daily trips (six haul-truck trips and four vehicle trips from accompanying pilot cars for solar material transport) would travel to and from the project site during construction.
It is expected that materials and equipment likely would be delivered during off-peak commute hours, and would comply with all Caltrans permitting requirements when any truck loads are oversize. As described, Caltrans has the discretionary authority to issue special permits for the movement of vehicles/loads exceeding statutory limitations on the size, weight, and loading of vehicles contained in the California Vehicle Code. The California Highway Patrol (CHP) is notified about transportation of oversize/overweight loads.
Throughout the 10-month construction period, it is estimated that construction workforce and truck deliveries together would contribute an average of approximately 125 daily round trips to and from the Project site (250 one-way trips per day) to roads within the Project area. During the peak construction periods, the Project construction-generated trips would be about 190 daily round trips (380 one-way trips). The construction workforce would commute to the Project site from Modesto and surrounding communities, using SR 99, SR 219, SR 108 (McHenry Avenue and portions of Patterson Road), and Ladd Road to access the Project site. For the transport of

4. Environmental Analysis Transportation/Traffic
McHenry Solar Farm 4.17-10 May 2011 Draft Environmental Impact Report
solar array materials, it is expected that these materials would originate in the Oakland area, and these trucks would access the Project site via I-580, I-5, and SR 99, and travel onto surface roadways, including SR 219 (Kiernan Avenue), and SR 108 (McHenry Avenue). Construction materials would be procured locally, and it is expected that trucks hauling these materials would use state and local roadways to access the Project site, including SR 108 (McHenry Avenue and portions of Patterson Road), SR 219 (Kiernan Avenue), and Ladd Road.
Assessment of the short-term effect that Project construction traffic could have on local and regional roads includes review of existing traffic volumes and consideration of both the percentage increase the Project construction traffic would contribute to existing traffic levels and the capacity of the road to handle the additional traffic. Because the number of vehicles on roads vary from day-to-day and over the course of a day and routinely fluctuate plus or minus five percent, a change in traffic volume of five percent or less is generally not perceptible to the average motorist. Traffic volume on Project area roads is typically highest during morning and evening peak commute hours (generally between 7:00 am to 9:00 am, and 4:00 pm to 6:00 pm); traffic increases that occur during these peak periods may exacerbate short-term congestion.
The main roads providing access from the highway system to the Project area and access to the Project site include: SR 99, SR 108 (McHenry Avenue and portions of Patterson Road), and SR 219 (Kiernan Avenue). Compared to the recent average daily traffic on these roadways, the average daily Project-generated traffic (125 round trips / 250 one-way trips) would represent less than a 2 percent increase in daily traffic, and the daily Project-generated traffic during peak construction periods (190 round trips / 380 one-way trips) would represent less than a 3 percent increase in daily traffic. Those percent increases are less than the above-cited 5 percent daily fluctuation, and therefore, the Project would have a less-than-significant effect on traffic flow over the course of both average and peak work days. Table 4.17-2 summarizes these findings.
TABLE 4.17-2 PROJECT CONSTRUCTION TRIP PERCENT CONTRIBUTION TO ROADWAY TRAFFIC VOLUMES
Roadway
Average Annual Daily Traffic
(AADT)a
Project-Generated Traffic Percent (%) Contribution
Average Daily During 10-Month Construction Periodb
Average Daily During Peak Construction Periodc
SR 99 110,000 0.2 0.3
SR 108 16,100 1.5 2.3
SR 219 14,500 1.7 2.6 a AADT data provided by Caltrans (2010a). b Calculated percentage contribution of 250 one-way vehicle trips relative to existing AADT volumes per roadway. c Calculated percentage contribution of 380 one-way vehicle trips relative to existing AADT volumes per roadway. SOURCE: ESA, April 2011.
Construction workers would arrive at 7:00 a.m. (the start of their work day), and depart when their work day ends (7:00 p.m.). Because worker trips and truck trips associated with the transport of solar array materials and construction materials would likely occur during off-peak commute

4. Environmental Analysis Transportation/Traffic
McHenry Solar Farm 4.17-11 May 2011 Draft Environmental Impact Report
hours, the additional traffic would not represent a substantial increase in traffic volume that would appreciably affect traffic congestion. However, if construction-related traffic were to occur during commute hours, congestion on affected roadways may result. Mitigation measures are proposed to minimize Project construction traffic during peak commute hours.
With respect to Project construction effects on existing bus transit services, the short-term traffic increases that would occur on McHenry Avenue and Patterson Road during project construction would not disrupt transit service provided by StaRT Bus Route 60 on those roads, but, as noted above, traffic increases during morning and evening peak commute hours could increase traffic congestion, which could delay transit service; therefore, mitigation measures are proposed to reduce potential impacts.
Decommissioning
At the conclusion of the 25-year term of the Power Purchase Agreement between the Applicant and MID (or if extended, at the end of the extended term), the Project would cease operations and decommissioning and reclamation of the site would occur. Decommissioning of Project facilities would take place within a 3-month period, and would require a total of approximately 300 haul trucks trips and 60 daily workers throughout the entire process. As a result, on a daily basis, approximately 5 haul trucks would travel to and from the site, and up to 60 worker trips would occur. Decommissioning of MID facilities would occur within a three-week period, and would require up to four workers on-site, one dump truck, and one flatbed truck.
Decommissioning of the entire project site and associated facilities therein would generate a total of up to 7 truck round trips and up to 80 worker trips on a daily basis (174 one-way trips). As noted above for Project construction, traffic increases during morning and evening peak commute hours could increase traffic congestion, which could delay transit service. Implementation of the mitigation measures below would reduce potential impacts to traffic flow conditions to a less-than-significant level.
Mitigation Measure 4.17-1a: MID Traffic Control Measures. During construction and decommissioning of the sub-transmission and distribution lines and fiber optic cable, MID shall implement the following traffic mitigation measures from the 2006 PEIR Update (2006 PEIR Update; p. 10-6):
1. MID will coordinate design and construction of program facilities with the agencies with jurisdiction, including Caltrans, counties, cities, special districts, other utilities and the FAA, as required.
2. MID will obtain any necessary encroachment permits, inspections or other approvals from agencies with jurisdiction.
2A. MID will obtain any necessary approvals and inspections from agencies with jurisdiction.
2B. MID shall coordinate the design and construction and shall obtain any necessary permits from the County, City or State prior to placing any facilities

4. Environmental Analysis Transportation/Traffic
McHenry Solar Farm 4.17-12 May 2011 Draft Environmental Impact Report
within the public road rights-of-way of those agencies and shall conform to applicable conditions in the encroachment permit.
3. MID will utilize all necessary precautions to minimize safety concerns when working within public road rights-of-way. Traffic safety cones, construction signage or other measures will be used to alert drivers to construction activities.
4. Electrical facilities placed within public rights-of-way will comply with applicable standards for avoiding hazards to drivers, pedestrians and bicyclists.
Mitigation Measure 4.17-1b: Applicant Construction Traffic Management and Safety Plan. Prior to the start of construction (and, subsequently, decommissioning) of the Project, the Applicant shall prepare and implement a Traffic Management and Safety Plan that will reduce or eliminate impacts associated with the Project. The Plan shall adhere to Stanislaus County and Caltrans requirements, and shall include, at a minimum, the following elements:
a) Schedule Project-generated construction truck trips on SR 99, SR 108, and SR 219 outside the peak morning and evening commute hours to reduce potential traffic congestion and reduce potential for transit delays during these peak commute periods.
b) Comply with transportation permit requirements of Caltrans and CHP when scheduling Project-generated construction truck trips carrying oversized loads. In addition, provide pre-notification to local police, fire, and emergency service providers of the timing, location, and duration of construction activities that could affect the movement of emergency vehicles on area roadways.
c) Place signs (e.g., “Slow Trucks”, and/or “Trucks Turning Ahead”) along appropriate roads to notify drivers of construction traffic throughout the duration of the construction period.
Significance after Mitigation: Less than Significant.
_________________________
b) Conflict with an applicable congestion management program, including, but not limited to, LOS standards and travel demand measures, or other standards established by the county congestion management agency for designated roads or highways?
Impact 4.17-2: The Project could conflict with established congestion management programs on affected roads or highways. (Less than significant)
Project traffic (construction, operation and maintenance, and decommissioning) would use three designated roadways within the CMP roadway network to access the Project site: SR 99, SR 108 (McHenry Avenue and portions of Patterson Road), and SR 219. LOS standards and travel demand measures, established by the Stanislaus Council of Governments (the designated CMA), are intended to regulate long-term traffic impacts due to future development, and do not apply to temporary construction projects that cause short-term traffic increases that end when construction activities end.

4. Environmental Analysis Transportation/Traffic
McHenry Solar Farm 4.17-13 May 2011 Draft Environmental Impact Report
The workforce for the Project’s operation and maintenance activities would not result in a substantial increase the traffic volumes on area roads because the Project would generate four one-way vehicle trips per work day. The negligible amount of traffic generated by the operational and maintenance activities at the Project site would not affect roadway service levels, and traffic impacts on the designated CMP roadway network would be less than significant.
Mitigation: None required.
d) Substantially increase hazards due to a design feature (e.g., sharp curves or dangerous intersections) or incompatible uses (e.g., farm equipment)?
Impact 4.17-3: Project construction and decommissioning activities could increase traffic hazards due to large trucks entering and exiting the Project site. (Less than significant with mitigation)
Staging of construction equipment and parking for worker vehicles would be accommodated off-road within designated areas on the Project site, and vehicles would not interfere with other vehicles once they access the project site. However, Project-generated traffic (including large trucks) could interfere with other vehicles (including farm vehicles) on the roads used to access the Project site, which could create traffic safety hazards. During the 10-month construction period and the 3-month decommissioning period, trucks delivering or removing materials and equipment would enter and exit the Project site along McHenry Avenue. Those turning movements could create a traffic safety hazard requiring the need for traffic control. The presence of slow-moving trucks entering or exiting construction areas along roadways could pose a traffic hazard to other vehicles. The creation of potential traffic safety hazards as a result of Project construction or decommissioning would be a significant impact.
Mitigation Measure 4.17-3: Implement Mitigation Measures 4.17-1a and 4.17-1b.
Significance after Mitigation: Less than Significant.
e) Result in inadequate emergency access?
Impact 4.17-4: The Project could result in inadequate emergency access. (Less than significant with mitigation)
Vehicle access to and from the Project site would be located at the northern boundary of the site. Access roads would be built within the Project site; however, if an emergency were to occur, vehicles could enter and exit the site only from the one driveway location along the northern boundary. The absence of a second emergency access location could pose a safety hazard at the Project site and would be a significant impact. Mitigation measures are proposed to improve emergency access.

4. Environmental Analysis Transportation/Traffic
McHenry Solar Farm 4.17-14 May 2011 Draft Environmental Impact Report
Mitigation Measure 4.17-4: Develop an Emergency Access Plan for the Site. The Applicant shall develop and implement an Emergency Access Plan, which shall include evacuation routes and strategies to ensure accessibility and mobility for project area and emergency vehicles. Additional measures include developing an emergency action plan that identifies roles and responsibilities during emergencies and to update the plan regularly.
Significance after Mitigation: Less than Significant.
4.17.5 Alternatives
4.17.5.1 Reduced Project
The Reduced Project Alternative would generate either similar or only slightly less construction traffic along the same roadways as the Project. Therefore, potential impacts to transportation/ traffic under this alternative would be similar to, or slightly less than, the Project. Mitigation Measures 4.17-1 and 4.17-4 identified for the Project also would be required for this alternative.
4.17.5.2 Non-Agriculture Site
The description of regional roadways in Section 4.17.1, Setting, also applies to this alternative site, which is located only about 4 miles from the proposed Project site. Other regional and local roadways that would be affected by construction traffic associated with the Non-Agriculture Alternative site include SR 99, SR 219 (Kiernan Avenue), and Stoddard Road (a north-south arterial roadway of varying width).
Installation of the new 1.25-mile transmission line and modifications to the existing distribution circuit along the east side of Stoddard Road would likely result in a temporary disruption in travel flow due to possible lane closures, resulting in one-way alternate traffic flow, along Stoddard Road.
Because the alternative site would be only about 20 percent as large as the proposed Project site, the number of construction trips would likely be about 20 percent that of the Project (approximately 38 peak daily round trips compared to 190 for the Project) and for a much shorter duration (approximately 2 to 4 months compared to 10 months for the Project). However, prior to constructing the solar facilities at this site, the existing buildings and structures would have to be demolished and removed. Traffic during this demolition phase would consist of worker commutes and large trucks arriving and departing to dispose of the demolition debris off-site. Based on information available from a similar demolition project, a crew of 8 workers would take approximately 10 months to complete the demolition (see Section 3.3.1, Alternatives Evaluated in this EIR). Accounting for miscellaneous midday trips, there would be approximately 10 daily worker round trips. The number of truck trips required to remove and dispose of the demolition debris is not known, but it is reasonable to estimate that the volume of demolition debris from 15 large industrial buildings and several acres of paved area would be greater than the volume of

4. Environmental Analysis Transportation/Traffic
McHenry Solar Farm 4.17-15 May 2011 Draft Environmental Impact Report
materials required to construct the solar farm facilities at the proposed Project site, so it is expected that the number of truck trips required during demolition would be greater than 10 daily round trips.
Overall, the combined demolition/construction activities for this alternative site are expected to take approximately 12 to 14 months, slightly longer than the construction period for the proposed Project site. Traffic during this period would be considerably less for worker commuting compared with the Project. Although daily truck trips would be expected to be greater during demolition than would occur during construction of the Project, the total number of peak daily trips for this alternative would be less than the peak of 190 daily round trips expected for the Project. Even so, this alternative would require a traffic management and safety plan (Mitigation Measure 4.17-1) to address both demolition and construction activities and mitigate potential increases in congestion and traffic hazards.
Traffic related to operations and maintenance of the solar farm would be essentially the same as for the Project because the same number of employees would be required, so impacts would be similar. Traffic related to site decommissioning traffic would be proportionally less than the Project; even so, Mitigation Measure 4.17-2 would be required to ensure that impacts would be less than significant.
4.17.5.3 No Project
If the No Project Alternative is implemented, no changes to the site would occur, the Project site would continue to be used for an agricultural land use, and the existing environmental setting would be maintained. As a no-development alternative, the No Project Alternative would result in no changes to existing transportation and traffic conditions, and therefore, no potential impacts to those conditions.
_________________________
References – Transportation/Traffic California Department of Transportation (Caltrans), 2010a. 2009 Traffic Volumes on California
State Highways, available online at http://traffic-counts.dot.ca.gov/index.htm; accessed December 20, 2010.
California Department of Transportation (Caltrans), 2010b. California Manual on Uniform Traffic Control Devices for Streets and Highways, amended January 21, 2010.
City of Riverbank, 2009. City of Riverbank General Plan Update 2005-2025, adopted April 2009.
Stanislaus Council of Governments (StanCOG), 2010a. 2011 Regional Transportation Plan, adopted July 2010.
Stanislaus Council of Governments (StanCOG), 2010b. 2009 Congestion Management Process for the Stanislaus County Region, adopted January 2010.
Stanislaus County, 2008. 1994 Stanislaus County General Plan, revised December 2008.

4. Environmental Analysis Transportation/Traffic
McHenry Solar Farm 4.17-16 May 2011 Draft Environmental Impact Report
Stanislaus County, 2010a. Stanislaus County Department of Public Works – Ladd Road at McHenry Road Intersection Improvements, available online at http://www.stancounty.com/publicworks/projects.shtm; accessed December 21, 2010.
Stanislaus County, 2010b. Stanislaus County Code - §21.40.070, adopted October 2010; available at http://www.qcode.us/codes/stanislauscounty/; accessed January 10, 2011.
Stanislaus Regional Transit (StaRT), 2010 Bus Transit Timetable – Route 60 Modesto-Riverbank-Oakdale, available online at http://www.srt.org/fixed_route_schedules.htm; accessed January 10, 2011.

4. Environmental Analysis
McHenry Solar Farm 4.18-1 May 2011 Draft Environmental Impact Report
4.18 Utilities and Service Systems
This section identifies and evaluates issues related to Utilities and Service Systems in the context of the proposed Project and alternatives. Discussed are the physical and regulatory setting; the baseline for determining environmental impacts; the criteria used for determining the significance of environmental impacts; potential impacts associated with construction, operation, maintenance, and decommissioning of the Project; and mitigation measures to reduce or avoid environmental impacts determined to be potentially significant.
4.18.1 Setting
4.18.1.1 Regional and Local Setting
Section 2.2, Project Location and Existing Land Use, provides general information about the regional and local setting. This Section 4.18.1 provides setting information specific to water service, wastewater service, stormwater drainage, solid waste disposal, and energy services in the Project area.
Water Service An existing on-site well is currently used for irrigation water. The estimated existing water demand of the Project site used for the cultivation of strawberries is approximately 49 acre-feet per year (SunPower, 2011). A buried irrigation pipeline is aligned north-south in the center of the site perpendicular to Patterson Road, and another pipeline is aligned east-west parallel to and 215 feet north of Patterson Road. This pipeline crosses the site from the eastern edge to the existing residence that is adjacent to the site. The Stanislaus River is located approximately 1 mile northwest of the Project site; the MID Main Canal is aligned southwest-northeast approximately 450 feet to 1,200 feet south of the site.
Wastewater Service Wastewater service is not currently provided at the Project site. An existing private septic system is located on the residential parcel that is adjacent to the Project site near the intersection of Patterson Road and McHenry Avenue. Several municipalities and service districts provide sewer service within the county. Privately-owned and maintained septic tanks and leachfields are used in rural areas where no public service is available.
Stormwater Drainage There are no rivers, creeks, canals, wetlands, or riparian habitats within the Project site, but surface water may pond during periods of high precipitation in minor depressions and a shallow swale that is located along the perimeter of the site. In this area of the county, there are very few constructed storm drain facilities or outlets, and stormwater is typically managed by field percolation. If stormwater exceeds infiltration capacity, runoff flows to roadside ditches. See Section 4.10, Hydrology and Water Quality, for further discussion of drainage in the Project area.

4. Environmental Analysis Utilities and Service Systems
McHenry Solar Farm 4.18-2 May 2011 Draft Environmental Impact Report
Solid Waste Disposal Solid waste in Stanislaus County is disposed of at the county-owned Fink Road Landfill, which is a Class III landfill operated by the county’s Environmental Resources Department at 4000 Fink Road in Crows Landing. The Fink Road Landfill is estimated to have sufficient capacity through 2023 according to the California Department of Resources Recycling and Recovery (CalRecycle, 2010). The most recent solid waste diversion rate for Stanislaus County (2006) was 61 percent (CalRecycle, 2010). Since 2007, diversion rates are no longer measured. The passage of Senate Bill 1016 in 2006 established a new system, known as the Per Capita Disposal Measurement System. Only per capita disposal rates are measured to determine if a jurisdiction’s efforts are meeting the intent of Assembly Bill 939 (see discussion below, under Regulatory Setting) (CalRecycle, 2011a).
Stanislaus County’s per resident disposal target rate is 6.3 pounds per person per day (PPD); its per employee disposal target rate is 21.2 PPD. In 2008, the most recent date for which data is available, the county’s resident disposal rate was 3.9 PPD and the employee waste disposal rate was 12.2 PPD (CalRecycle, 2011b).
Energy Service Pacific Gas and Electric Company (PG&E) provides natural gas service to the Project area, and MID provides electricity at the site. An existing 69-kV transmission line is aligned along the west side of McHenry Avenue adjacent to the Project site. This transmission line crosses to the east side of McHenry at the northwest corner of the site. This line connects to the MID Ladd Substation near the intersection of Ladd Road and Tully Road.
4.18.1.2 Regulatory Setting
State of California
California Integrated Waste Management Act (Assembly Bill 939) and Senate Bill 1016
The Integrated Waste Management Act of 1989, known as Assembly Bill (AB) 939, required local jurisdictions to submit detailed solid waste planning documents for Board approval, and set diversion requirements of 25 percent in 1995 and 50 percent in 2000. In 2006, Senate Bill (SB) 1016 updated the requirements. New per capita disposal and goal measurements in SB 1016 moved the emphasis from an estimated diversion measurement number to using an actual disposal measurement number as a factor, along with evaluating program implementation efforts. These two factors will help determine each jurisdiction’s progress toward achieving its AB 939 diversion goals. The 50 percent diversion requirement is now being measured in terms of per capita disposal expressed as pounds per person per day.
Regional
Central Valley Regional Water Quality Control Board
The California Legislature has assigned the primary responsibility to administer and enforce statutes for the protection and enhancement of water quality to the State Water Resources Control

4. Environmental Analysis Utilities and Service Systems
McHenry Solar Farm 4.18-3 May 2011 Draft Environmental Impact Report
Board (SWRCB) and its nine Regional Water Quality Control Boards (RWQCBs). The Central Valley Regional Water Quality Control Board (CVRWQCB) is responsible for the protection of water quality and beneficial uses of waters within Stanislaus County. The CVRWQCB uses its planning, permitting, and enforcement authority to meet this responsibility and has adopted the Water Quality Control Plan for the Sacramento River and the San Joaquin River Basins (Basin Plan) to implement plans, policies, and provisions for water quality management.
Stanislaus County
General Plan. The Land Use Element of the Stanislaus County General Plan contains goals, policies and implementation measures that could be applicable to the proposed Project. Policy 4 discourages development in floodplain areas and Policy 22 states that future growth shall not exceed the capabilities/capacities of sewer, water, and solid waste providers (Stanislaus County, 2008).
Countywide Integrated Waste Management Plan. The county is required to produce a comprehensive planning and implementation document, the Countywide Integrated Waste Management Plan (CIWMP), to guide the county and the incorporated cities in their solid waste management activities. The CIWMP provides direction and establishes goals so the entire community will be assured adequate, long-term disposal capacity.
4.18.1.3 Baseline
The environmental setting described above constitutes the baseline for determining the significance of potential impacts on Utilities and Service Systems. The Project site is not connected to a potable water, wastewater, or public sewer system. Stormwater management occurs via natural drainage swales and ditches. Solid waste is disposed of at the Fink Road Landfill.
4.18.2 Significance Criteria Based on CEQA Guidelines Appendix G, a project would cause a significant impact on Utilities and Service Systems if it would:
a) Exceed wastewater treatment requirements of the applicable Regional Water Quality Control Board;
b) Require or result in the construction of new water or wastewater treatment facilities or expansion of existing facilities, the construction of which could cause significant environmental effects;
c) Require or result in the construction of new stormwater drainage facilities, the construction of which could cause significant environmental effects;
d) Not have sufficient water supplies available to serve the project from existing entitlements and resources, or if new or expanded entitlements are needed;

4. Environmental Analysis Utilities and Service Systems
McHenry Solar Farm 4.18-4 May 2011 Draft Environmental Impact Report
e) Result in a determination by the wastewater treatment provider which serves or may serve the project that it does not have adequate capacity to serve the project’s projected demand in addition to the provider’s existing commitments;
f) Be served by a landfill without sufficient permitted capacity to accommodate the project’s waste disposal needs; or
g) Not comply with federal, state and local statutes and regulations related to solid waste.
4.18.3 Discussion of Criteria with No Utilities and Service Systems Impacts
Analysis of the setting and Project characteristics relative to the significance criteria show that the proposed Project would have no impact on Utilities and Service Systems with respect to all criteria except c). The reasoning supporting this conclusion is as follows:
a) The proposed Project would not exceed the wastewater treatment requirements of the applicable Regional Water Quality Control Board.
The Project would not exceed wastewater treatment requirements because the Project would not be connected to a public sewer system. Restroom facilities would be provided in the O&M building and would be served by a private septic system to be developed on-site. Restroom facilities during Project construction and decommissioning would be provided by portable units to be serviced by licensed providers. Accordingly, there would be no impact with regard to criterion a).
b) The proposed Project would not require or result in the construction of new water or wastewater treatment facilities or expansion of existing facilities, the construction of which could cause significant environmental effects.
The Project would not require or result in the construction of new water or wastewater treatment facilities or the expansion of existing facilities because the Project would not be connected to either type of system.
During operation and maintenance, drinking water and process water would be supplied by the existing on-site well and would require on-site treatment for domestic use and to provide the necessary water quality for solar panel cleaning. Water treatment would be accomplished using a local vendor such as Culligan to provide a “whole house” system with self-contained replaceable treatment cylinders identical to systems used in residential applications. Restroom facilities would be provided in the O&M building and would be served by a private septic system to be developed on-site. Restroom facilities during Project construction and decommissioning would be provided by portable units to be serviced by licensed providers.
d) The proposed Project would have sufficient water supplies available to serve the Project from existing entitlements and resources, and new or expanded entitlements would not be needed.
The estimated existing water demand of the Project site used for the cultivation of strawberries is approximately 49 acre-feet per year (SunPower, 2011), which is supplied by the on-site well.

4. Environmental Analysis Utilities and Service Systems
McHenry Solar Farm 4.18-5 May 2011 Draft Environmental Impact Report
During construction, the primary use of water from that well would be for dust control, which would not require treatment of the water prior to use. Water may also be needed to moisture-condition the soil for proper compaction at roads and foundations. The estimated construction-related water demand is 10 acre-feet, although actual demand may vary by several acre-feet, depending on the season that construction work occurs.
During operation and maintenance, drinking water and process water would be supplied by the existing on-site well and would require on-site treatment for domestic use and to provide the necessary water quality for solar panel cleaning. Water treatment would be accomplished using a local vendor such as Culligan to provide a “whole house” system with self-contained replaceable treatment cylinders identical to systems used in residential applications. During the life of the Project, the panels would be washed approximately two to four times per year. Approximately 2 to 4 acre-feet per year would be needed for this use. Landscape irrigation would require a maximum of approximately 7.6 acre-feet per year during the first year of installation. This would be lower in subsequent years as the vegetation matures. Potable water use in the O&M building is estimated at approximately 5,000 gallons per year (SunPower, 2011).
During Project decommissioning and site restoration, dust control would be needed and several acre-feet of water may be used, depending on the time of year that those activities would occur.
The proposed Project would, therefore, require substantially less water than the existing agricultural use during the construction, operation, and decommissioning phases. No impact would occur.
e) The proposed Project would not result in a determination by the wastewater treatment provider that would serve the Project that it has inadequate capacity to serve the Project’s projected demand in addition to the provider’s existing commitments.
The Project would not exceed wastewater treatment requirements because the Project would not be connected to a public sewer system. Restroom facilities would be provided in the O&M building and would be served by a private septic system to be developed on-site during Project operation. Restroom facilities during Project construction and decommissioning would be provided by portable units to be serviced by licensed providers. Although these portable units may be emptied into the public sanitary sewer system, construction and decommissioning activity duration would be short (10 months for construction and 3 months for decommissioning) and the number of workers too small (up to 144 during Project construction and 60 workers for decommissioning) to impact the system. Accordingly, there would be no impact with regard to criterion e).
f) The proposed Project would be served by a landfill with sufficient permitted capacity to accommodate the Project’s solid waste disposal needs.
Construction of the proposed Project would generate various waste materials, including wood from cribbing and packing materials, concrete, and aggregate. Construction waste generated at the Project site would be sorted to separate recyclable and non-recyclable materials, and stored in dumpsters that would be serviced by a licensed solid waste hauler. Non-hazardous construction

4. Environmental Analysis Utilities and Service Systems
McHenry Solar Farm 4.18-6 May 2011 Draft Environmental Impact Report
materials that cannot be reused or recycled would likely be disposed of at the Fink Road Landfill in accordance with applicable regulations. Construction of the proposed 69-kV sub-transmission line would also require the removal of one existing wooden pole, which would either be reused by MID or disposed in a suitable facility. Operation of the Project would produce minimal solid waste generated by the two permanent on-site employees and during routine maintenance activities. The Fink Road Landfill has sufficient capacity to accept construction and operations waste generated by the Project. Upon decommissioning of the Project, the Applicant proposes to reuse the PV panels and then recycle them at the end of their useful life (approximately 40 years or more). The majority of the remaining Project equipment, such as the drive controllers, inverters, transformers, and switchgear may also either be reused or recycled. Poured concrete pads would be removed and recycled or crushed and reused as clean fill. No adverse impact to landfill capacity would result from implementation of the Project.
g) The proposed Project would comply with federal, state, and local statutes and regulations related to solid waste.
The proposed Project would generate waste during construction, operation, and decommissioning. Construction waste would include the one time disposal of material that could not be recycled or reused. The non-recyclable portion of construction and operation waste generated would not be substantial and would be disposed of in the Fink Road Landfill. As discussed above, this landfill has sufficient capacity to accept anticipated Project waste during construction.
During Project operation and decommissioning, the Applicant would dispose of waste consistent with applicable federal, state, and local recycling, reduction, and waste requirements and policies. Therefore, the Project would not result in impacts related to conflicts with statutes and regulations regarding solid waste.
4.18.4 Impacts and Mitigation Measures
c) Require or result in the construction of new stormwater drainage facilities, the construction of which could cause significant environmental effects.
Impact 4.18-1: The proposed Project would require or result in the construction of new stormwater drainage facilities, the construction of which could cause significant environmental effects. (Less than significant)
Constructing, operating, and decommissioning the proposed Project would result in very little change to the existing drainage pattern of the area. There would be slight changes in grade associated with site preparation for the O&M building, the control building for the MID switchyard, access roads, and substation structures. However, the Project site would remain essentially flat, and these changes would be restricted to the site. As is standard with prefabricated buildings, drainage off the roofs of the O&M and control buildings (which would be prefabricated structures) would be managed with roof drains and protective ground cover (e.g., rock-lined ditch or drain). Although onsite drainage paths may change slightly due to structures

4. Environmental Analysis Utilities and Service Systems
McHenry Solar Farm 4.18-7 May 2011 Draft Environmental Impact Report
that intercept rainfall (such as PV panels, concrete foundation pads, or building rooftops) and finished grading, the site would not generate an additional volume of concentrated runoff that could cause erosion, siltation, or flooding to occur on or off the site because most of the site will remain as open ground (under the PV panels) that will absorb stormwater. Drainage swales or other buffer techniques would be incorporated into the Project design to prevent any potential runoff off-site. The proposed project would not alter the topography of the site such that drainage patterns would change substantially (i.e., the site would remain essentially flat), and the majority of the site would remain covered with a grass mix or crushed gravel (for access roads, O&M areas, and the substation site). The impact would be less than significant.
Mitigation: None required.
4.18.5 Alternatives
4.18.5.1 Reduced Project
The Reduced Project Alternative would have similar water and wastewater systems as the proposed Project, thus no impact would occur regarding wastewater treatment, water supply, or wastewater capacity. Solid waste disposal needs and compliance with regulations related to solid waste would also not result in an impact if this alternative is implemented. The less-than-significant impact of the proposed Project regarding construction of new stormwater drainage facilities would be similar to or slightly less with the Reduced Project Alternative due to the site’s smaller footprint. Drainage swales or other buffer techniques would still be required, but the increased setbacks along McHenry Avenue and Patterson Road may slightly reduce the overall disturbed area needed for installation of such facilities. Decommissioning of the Project would return the site to its existing use and condition, which means the drainage of the site would be similar to or the same as existing conditions.
4.18.5.2 Non-Agriculture Site
Because this alternative site was formerly developed, it is assumed that connections are available to a municipal water district and sanitary sewer system. No operational impacts regarding water or wastewater would be anticipated because only two employees would be working on the Project site. It is anticipated that water supply during construction and decommissioning would be provided through the existing connection and/or via bottled water for construction workers, which would not be expected to exceed the capacity of local water service providers. Restroom facilities during construction and decommissioning would likely be provided by portable units to be serviced by licensed providers, as with the proposed Project.
Because the Non-Agriculture Site is currently developed with multiple buildings, structures, and paved parking areas that would have to be demolished and removed from the site, the amount of construction waste generated by this alternative would be substantially larger than for the proposed Project. However, with recycling the demolition waste would not be anticipated to

4. Environmental Analysis Utilities and Service Systems
McHenry Solar Farm 4.18-8 May 2011 Draft Environmental Impact Report
exceed landfill capacity. As with the proposed Project, the majority of the Project equipment would be reused or recycled when the site is decommissioned. Impacts regarding stormwater drainage facilities during operation would be less than the proposed Project due to the smaller project size, allowing the ground to absorb more stormwater. Decommissioning of this alternative site would likely return the site to vacant land, which would have similar drainage as the proposed Project due to the similar topography and soil type.
4.18.5.3 No Project
If the No Project Alternative is implemented, the proposed Project would not be constructed, operated, or decommissioned; therefore, there would be no impact related to Utilities and Service Systems.
References – Utilities and Service Systems California Department of Resources Recycling and Recovery (CalRecycle), 2010. Jurisdiction
Profile for Stanislaus County Regional Solid Waste Planning and Active Landfills Profile for Fink Road Landfill (50-AA-0-0001), www.calrecycle.ca.gov, site accessed December 20 and December 30, 2010.
CalRecycle, 2011a. Local Government Central, Goal Measurement, www.calrecycle.ca.gov/LGCentral/GoalMeasure, site accessed April 26, 2011.
CalRecycle, 2011b. Diversion/Disposal Rate Report for 2008, Stanislaus County Regional Solid Waste Planning Agency, www.calrecycle.ca.gov/LGCentral/Tools/mars/jurdrsta, site accessed April 26, 2011.
Stanislaus County, 2008. 1994 Stanislaus County General Plan, rev. December 2008.
SunPower, 2011. Email communication regarding estimated water usage, February 18, 2011.

McHenry Solar Farm 5-1 May 2011 Draft Environmental Impact Report
CHAPTER 5 Comparison of Alternatives
This section compares the environmental advantages and disadvantages of the Project and alternatives evaluated in detail in this EIR. This comparison is based on the analysis of environmental impacts of the Project provided in Sections 4.1 through 4.18 and the descriptions of the Project provided in Chapter 2, Project Description, and the alternatives in Section 3.3.1, Alternatives Evaluated in Detail in this EIR. This comparison is designed to satisfy the requirements of CEQA Guidelines §15126.6[d], Evaluation of Alternatives, which states:
The EIR shall include sufficient information about each alternative to allow meaningful evaluation, analysis, and comparison with the proposed project. A matrix displaying the major characteristics and significant environmental effects of each alternative may be used to summarize the comparison. If an alternative would cause one or more significant effects in addition to those that would be caused by the project as proposed, the significant effects of the alternative shall be discussed, but in less detail than the significant effects of the project as proposed.
5.1 Comparison Methodology
The following methodology was used to compare alternatives in this EIR:
Step 1: Identification of Alternatives. The alternatives development and screening process described in Chapter 3 was used to identify potential alternatives to the Project. Among the many potential alternatives initially considered, the Reduced Project Alternative, the Non-Agriculture Site Alternative, and the No Project Alternative were carried forward for detailed environmental review. No other reasonable feasible alternatives meeting the basic Project Objectives were identified that would substantially reduce or eliminate significant environmental effects of the Project.
Step 2: Determination of Environmental Impacts. Potential environmental impacts of the Project and each of the alternatives were identified and analyzed in detail in Chapter 4, including potential impacts related to construction, operation and maintenance, and decommissioning of the Project.
Step 3: Comparison of Proposed Project with Alternatives. Environmental impacts of the Project were compared to those of each alternative carried forward for analysis to determine the Environmentally Superior Alternative.

5. Comparison of Alternatives
McHenry Solar Farm 5-2 May 2011 Draft Environmental Impact Report
5.2 Comparison of Alternatives and Identification of the Environmentally Superior Alternative
As analyzed and documented in Chapter 4, the Project would not cause a significant and unavoidable impact in any resource area. All impacts of the Project would be less than significant or less than significant with mitigation incorporated. Two alternatives in addition to the No Project Alternative were identified for evaluation in this EIR. The potential environmental impacts of both alternatives are analyzed in comparison to the proposed Project in each of the 18 resource areas in Sections 4.1 through 4.18.
The results of the comparative analysis of each of the 18 resource areas analyzed in those sections of Chapter 4 are set forth in Table 5-1, which compares the conclusions of the impact analyses for both alternatives against the conclusions for the Project. The comparative analysis summarized in Table 5-1 shows that there are no potential impacts for which the proposed Project is the Least Preferred alternative, and there are two potential impacts for which the proposed Project is the Preferred alternative (for the other 16 potential impacts, there is no preferred alternative).
CEQA Guidelines §15126.6(e)(2) requires an EIR to identify an environmentally superior alternative. If the environmentally superior alternative is the No Project Alternative, the EIR also must identify an environmentally superior alternative from among the other alternatives. In general, the environmentally superior alternative is defined as that alternative with the least adverse impacts to the project area and its surrounding environment. CEQA Guidelines §15126.6(a) places emphasis on alternatives that “avoid or substantially lessen the significant effects” of a project; distinctions between impacts that are less than significant or are mitigated to less than significant are typically not considered when selecting an environmentally superior alternative.
The No Project Alternative would avoid all impacts of the proposed Project and would not create any new significant impacts of its own. However, as noted in Section 4.8.5, the No Project Alternative would result in the continued long-term adverse impacts associated with greenhouse gas emissions compared to implementation of the proposed Project. The CEQA Guidelines define the environmentally superior alternative as that alternative with the least adverse impacts to the project area and its surrounding environment; therefore, the No Project Alternative is considered the environmentally superior alternative for CEQA purposes because it would not create any of the localized impacts of the Project, even though its total net effect on the environment would be less beneficial than that of the Project. The No Project Alternative would fail to meet any of the basic Project Objectives, including assisting MID in meeting its Renewable Portfolio Standard and goals aimed at reducing greenhouse gas emissions by locating a PV solar plant within MID’s electric service territory as near as possible to existing electrical sub-transmission and distribution facilities.
Among the remaining two alternatives (Reduced Project and Non-Agriculture Site), neither would result in any new significant impacts so the comparison of alternatives and the proposed Project is reduced to minor distinctions between impacts that would be less than significant or mitigated to less than significant. The Reduced Project Alternative would reduce the energy output of the Project by 10 percent, but would reduce construction emissions by less than 10 percent. This is because the

5. Comparison of Alternatives
McHenry Solar Farm 5-3 May 2011 Draft Environmental Impact Report
TABLE 5-1 PROPOSED PROJECT VS. ALTERNATIVES
SUMMARY OF ENVIRONMENTAL IMPACT CONCLUSIONS
Resource Area Proposed Project Reduced Project Alternative Non-Agriculture Site Alternative
Aesthetics, Visual Quality, and Light and Glare
Impacts determined to be Less than Significant.
No Preference
Impacts would be similar to but slightly less than the proposed Project.
No Preference
Impacts would be slightly greater than the proposed Project during construction and decommissioning, but slightly less than the proposed Project during operation.
No Preference
Agriculture and Forest Resources
Impacts determined to be Less than Significant.
No Preference
Impacts would be similar to proposed Project.
No Preference
Impacts would be similar to proposed Project.
No Preference
Air Quality Impacts determined to be Less than Significant with Mitigation.
No Preference
Impacts would be similar to but slightly less than the proposed Project.
No Preference
Impacts would be similar to or slightly greater than the proposed Project.
No Preference
Biological Resources
Impacts determined to be Less than Significant with Mitigation.
No Preference
Impacts would be similar to the proposed Project.
No Preference
Impacts would be similar to but slightly less than the proposed Project.
No Preference
Cultural and Paleontological Resources
Impacts determined to be Less than Significant with Mitigation.
No Preference
Impacts would be similar to the proposed Project.
No Preference
Impacts would be potentially greater than the proposed Project, but still mitigable to Less than Significant.
No Preference
Energy Conservation
Impacts determined to be Less than Significant; beneficial contribution resulting from generation of renewable energy.
Preferred
Impacts would be similar to but slightly less than the proposed Project; less of a beneficial contribution than the proposed Project due to less renewable energy generation.
No Preference
Impacts would be similar to but slightly less than the proposed Project; less of a beneficial contribution than the proposed Project due to substantially less renewable energy generation.
Least Preferred
Geology and Soils Impacts determined to be Less than Significant.
No Preference
Impacts would be similar to the proposed Project.
No Preference
Impacts would be similar to the proposed Project.
No Preference
Greenhouse Gas Emissions
Impacts determined to be Less than Significant with Mitigation; overall beneficial impact from net GHG reduction.
Preferred
Impacts determined to be Less than Significant with Mitigation; slightly less overall beneficial impact than proposed Project from lower net GHG reduction.
No Preference
Impacts determined to be Less than Significant with Mitigation; less overall beneficial impact than proposed Project from substantially lower net GHG reduction.
Least Preferred

5. Comparison of Alternatives
TABLE 5-1 (Continued) PROPOSED PROJECT VS. ALTERNATIVES
SUMMARY OF ENVIRONMENTAL IMPACT CONCLUSIONS
McHenry Solar Farm 5-4 May 2011 Draft Environmental Impact Report
Resource Area Proposed Project Reduced Project Alternative Non-Agriculture Site Alternative
Hazards and Hazardous Materials
Impacts determined to be Less than Significant with Mitigation.
No Preference
Impacts would be similar to but slightly less than the proposed Project.
No Preference
Impacts would be potentially greater than the proposed Project, but still mitigable to Less than Significant.
No Preference
Hydrology and Water Quality
Impacts determined to be Less than Significant.
No Preference
Impacts would be similar to the proposed Project.
No Preference
Impacts would be similar to but slightly greater than the proposed Project.
No Preference
Land Use and Planning
No impacts.
No Preference
Impacts would be similar to the proposed Project.
No Preference
Impacts would be similar to the proposed Project.
No Preference
Mineral Resources
No impacts.
No Preference
Impacts would be similar to the proposed Project.
No Preference
Impacts would be similar to the proposed Project.
No Preference
Noise Impacts determined to be Less than Significant.
No Preference
Impacts would be similar to but slightly less than the proposed Project.
No Preference
Impacts would be greater than the proposed Project, but still mitigable to Less than Significant.
No Preference
Population and Housing
No impacts.
No Preference
Impacts would be similar to the proposed Project.
No Preference
Impacts would be similar to the proposed Project.
No Preference
Public Services No impacts.
No Preference
Impacts would be similar to the proposed Project.
No Preference
Impacts would be similar to the proposed Project.
No Preference
Recreation No impacts.
No Preference
Impacts would be similar to the proposed Project.
No Preference
Impacts would be similar to the proposed Project.
No Preference
Transportation and Traffic
Impacts determined to be Less than Significant with Mitigation.
No Preference
Impacts would be similar to but slightly less than the proposed Project.
No Preference
Impacts would be less than the proposed Project.
No Preference
Utilities and Service Systems
Impacts determined to be Less than Significant.
No Preference
Impacts would be similar to but slightly less than the proposed Project.
No Preference
Impacts would be similar to but slightly less than the proposed Project.
No Preference

5. Comparison of Alternatives
McHenry Solar Farm 5-5 May 2011 Draft Environmental Impact Report
construction activity for the solar array would be reduced by 10 percent, but all other ancillary project components would still have to be constructed, resulting in the same construction emissions for those facilities as for the Project. This small reduction in construction emissions for the Reduced Project Alternative, when compared to the Project’s emissions, is not considered substantial.
The Non-Agriculture Site Alternative was initially carried forward for analysis to avoid a potentially significant impact from the proposed Project’s conversion of exclusive agricultural use of Prime Farmland to a mix of agricultural and non-agricultural uses. However, the impact analysis in Section 4.2, Agriculture and Forest Resources, subsequently concluded that this potential impact would be less than significant because the conversion is only temporary and the non-agricultural uses of the site would be combined by being made available for a different agricultural use through managed grazing of small livestock, such as goats or sheep (see Impact 4.2-1 in Section 4.2.4, Impacts and Mitigation Measures). Because the proposed Project’s impact to farmland would not be significant, neither the Non-Agriculture Site nor any other non-farmland site would avoid or substantially lessen a significant effect of the Project, and therefore, is not considered environmentally superior. In addition, the high cost of building demolition necessary for site preparation, coupled with the reduced energy output potential, call into serious question the site’s ability to meet the Project Objective to ensure that the Project can be constructed in a technologically feasible manner and operated in a manner that allows power to be provided at a competitive price.
Based upon this analysis, neither the Reduced Project Alternative nor the Non-Agriculture Site Alternative would provide a material lessening of adverse impacts compared with the proposed Project. Conversely, both alternatives would result in less renewable energy to the MID grid compared with the proposed Project. Solar project renewable energy is considered an environmental benefit because it provides a substantial reduction in greenhouse gas emissions compared to the same amount of fossil-fuel based electricity generation. Therefore, as compared with the Reduced Project Alternative and the Non-Agriculture Site Alternative, the proposed Project is considered the environmentally superior alternative.

McHenry Solar Farm 6-1 May 2011 Draft Environmental Impact Report
CHAPTER 6 Cumulative Impacts
As defined in CEQA Guidelines §15355, the term “cumulative impacts” refers to two or more individual effects, which, when considered together, are considerable or that compound or increase other environmental impacts. “The cumulative impact from several projects is the change in the environment which results from the incremental impact of the project when added to other closely related past, present, and reasonably foreseeable probable future projects. Cumulative impacts can result from individually minor but collectively significant projects taking place over a period of time.” CEQA Guidelines §15355(b); see also, CEQA Guidelines §15130(a)(1).
Section 6.2 analyzes whether the impacts of the Project, when combined with those of the projects identified in Section 6.1, would cause or contribute to a significant cumulative impact. The Project’s incremental contribution to any significant cumulative impact also is evaluated in Section 6.2 to determine whether it is cumulatively considerable.
6.1 Projects Considered in the Cumulative Impact Analysis
Section 6.1 uses the “list of projects” approach (CEQA Guidelines §15130(b)(1)) to identify past, present, and reasonably foreseeable probable future projects that could cause environmental impacts that are closely related to those of the Project. Factors considered in determining whether to include a project on the list include whether it would cause impacts of the same nature as the Project, its location, the timing of its impacts, and the type of project.
Development projects, the impacts of which could interact with those of the Project, are listed in Table 6-1. The location of these projects is shown in Figure 6-1. No projects being considered or considered reasonably foreseeable are located in the City of Riverbank.
Existing renewable energy generation projects in MID’s service area could cause impacts that are similar to those anticipated to result from the proposed Project; however, as explained below, none of these past projects is causing impacts that could combine with those of the Project to result in or contribute to significant cumulative effects. MID is an independent publicly owned utility that provides electricity and other utilities and services to customers within its service area. MID has been providing electric service to customers since 1923. Its electric service area now includes approximately 560 square miles in the greater Modesto area (north of the Tuolumne River), Waterford, Salida, Mountain House (Northwest of Tracy) and parts of Ripon, Escalon, Oakdale, and Riverbank (MID, 2010).

6. Cumulative Impacts
McHenry Solar Farm 6-2 May 2011 Draft Environmental Impact Report
TABLE 6-1 McHENRY SOLAR FARM CUMULATIVE IMPACT ANALYSIS PROJECTS LIST
Map Key
Project Name Location
Approximate Distance from
Proposed Project Site Description Status/Schedule
1 City of Modesto Pelandale McHenry Specific Plan
The Pelandale-McHenry Specific Plan project site is located on the south side of Pelandale Avenue, west of McHenry Avenue (SR108), within unincorporated Stanislaus County.
2.5 miles The approximately 85-acre Specific Plan area is within the Pelandale-McHenry Comprehensive Planning District designated in the Modesto Urban Area General Plan. Adoption of the Specific Plan would allow the development of residential and commercial land uses, in addition to public facilities and open space.
The Specific Plan and related work is nearly complete, and is on hold at the project applicant’s request.
2 City of Modesto Woodglen Specific Plan
In Modesto, bordered by Bangs Avenue on the north, Pelandale Avenue on the south, Carver Road on the west and Tully Road on the east. Orchards and vineyards are located to the north and east of the project site, and single-family residential land use is located to the west and south.
2.5 miles A mix of single-family and multi-family residential and open space land use designations. The project includes up to 337 single-family dwelling units and 196 multi-family residential units. Additionally, the project proposes nearly 10 acres of open space, including a variety of park and storm drainage facilities.
The Specific Plan and related work efforts are in progress. Resolution of final issues and design details was completed late 2010, with public hearings for adoption by the Planning Commission and City Council to follow in Spring 2011. Need funding.
3 Caltrans Modesto Route-108 Rehabilitation
In Stanislaus County in Modesto on SR 108 from SR 132 to Coralwood Drive.
2.5 miles Rehabilitation of pavement. Postmile 22.4-26.5. EA: 10-3A740.
Completed March, 2010
4 Caltrans North County Corridor – SR 108 East Route Adoption
Oakdale, Riverbank, Modesto, Stanislaus 1 mile To replace the existing SR 108 and provide a high-capacity and high-speed expressway. Two corridors being considered would span approximately 18 miles from a location near the 108/219 intersection to a location on SR 120/108 approximately six miles east of Oakdale.
Undergoing environmental clearance. Expecting completion of project September 2017.
5 Caltrans SR 108 Operational Improvements
In Stanislaus County on SR 108 from SR 219 to SR 99.
1.5 miles Operational Improvements/Access Management Plan. Postmile 21.2-27.7. EA: 10-0T740.
Inactive.
6 Caltrans McHenry/Ladd Signals In Stanislaus County near Riverbank from 0.4 mile north of Saint Francis Avenue to 0.1 Mile West of Skittone Road.
Adjacent Install Signals. Postmile: 28.7-29.4. EA: 10-0N440.
Construction. Expected project completion June, 2011.
7 Caltrans Route 108 Widening In Stanislaus County On SR 108 at Estelle Avenue.
2.15 miles. Widen roadway and provide drive Access. Postmile: 31.2-31.3/ EA: 10-0C900.
Undergoing final engineering stage and right-of-way clearance. Expected project completion August, 2011.

6. Cumulative Impacts
McHenry Solar Farm Project 6-3 May 2011 Draft Environmental Impact Report
TABLE 6-1 (Continued) McHENRY SOLAR FARM CUMULATIVE IMPACT ANALYSIS PROJECTS LIST
Map Key
Project Name Location
Approximate Distance from
Proposed Project Site Description Status/Schedule
8 Fink Road Solar Farm 4401 & 4881 Fink Road, west of Interstate 5, in the Newman area. (APNs 025-012-016, 025-012-017, 025-012-031, 025-012-033, 027-033-012)
25 miles To establish a photovoltaic (PV) solar energy farm creating an aggregate peak power capacity of 80-100 megawatts (MW) of electricity on 800± acres of a 1,687± acre site. The construction will be in multiple phases with each phase being 20 MW consisting of approximately 1,400 trackers with 84,000 PV panels arranged in sub-arrays set on steel posts and aligned in rows utilizing single and dual axis trackers and all required devices. Additional site improvements include: all weather fire access roads; maintenance building; security fencing; construction staging area; and a transmission interconnect to an existing transmission line to PG&E’s Solano substation.
County processing of the project is on hold at the applicant’s request.
SOURCES: Modesto, 2011; Modesto, 2011b; Stanislaus County, 2011.

Proposed Project
¬«2¬«1
")5
")3
¬«7
")4
¬«6
¬«8!!
!!
!!
!!
!!
!!
!!
!
Locate
d 25
miles to
SW
UV108
UV132
UV99
UV219
McHenry Solar Farm . 209517.01Figure 6-1
Projects Considered in theCumulative Impact Analysis
SOURCE:Sunpower, 2010
0 1
Miles
Project Site
Linear Project
1. City of Modesto Pelandale McHenry Specif ic Plan2. City of Modesto Woodglen Specif ic Plan3. Caltrans Modesto Route-108 Rehabilitation 4. Caltrans North County Corridor – SR 108 East Route Adoption5. Caltrans SR 108 Operational Improvements6. Caltrans McHenry/Ladd Signals7. Caltrans Route 108 Widening8. Fink Road Solar Project
6-4

6. Cumulative Impacts
McHenry Solar Farm 6-5 May 2011 Draft Environmental Impact Report
Among its existing electric generation sources, MID owns, has an ownership interest in, or purchases power from three hydroelectric and five wind energy facilities. Existing hydropower projects include the Don Pedro Powerhouse (Tuolumne County, California), which generates hydroelectricity from water stored in Don Pedro Reservoir; New Hogan Powerhouse (Calaveras County, California), which generates power from water stored in New Hogan Reservoir; and Stone Drop Mini-Hydro (Stanislaus County, California), which generates power from MID’s Main Canal during irrigation season. Of these, only the Stone Drop Mini-Hydro is located within MID’s service territory. Of the five wind energy facilities, two are located in Washington State (Bighorn and Bighorn II), one is in Oregon (Star Point) and two are in California (High Winds, and Shiloh). None of the existing wind projects are in MID’s service territory. Consequently, none of MID’s existing renewable energy projects could cause impacts that would combine with those of the Project to cause or contribute to cumulative effects.
In response to legislative and regulatory pressures to increase its green energy portfolio up to 33 percent by 2020 while significantly reducing GHG emissions, MID has considered several renewable energy projects, both outside and within its service area. Although some of the renewable projects that have been considered by MID involved the execution of long-term purchase power agreements to receive renewable power from other parts of the state and the Pacific Northwest (MID, 2009), it is expected that new renewable energy resource development (such as this Project, if it is approved) would occur within MID’s service area. The addition of this Project is anticipated to add an additional 2 percent of renewable energy to MID’s portfolio of resources for a grand total of approximately 29 percent renewable energy meeting MID’s retail customer energy needs.
6.2 Cumulative Impacts Analysis
Incremental impacts resulting from construction, operation, and decommissioning of the Project and alternatives could combine with the incremental impacts of other projects to cause or contribute to cumulative effects.
Direct and indirect effects of the Project are analyzed in Chapter 4, Environmental Analysis. The Project would cause no impact related to Land Use and Planning, Mineral Resources, Population and Housing, Public Services, or Recreation. Therefore, it would not contribute to any cumulative impact related to these resources. Consequently, these resource areas are not discussed in detail in this Section 6.2 (CEQA Guidelines §15130(a)(1)).
For the remaining resource areas, this section analyzes potential cumulative effects of the Project combined with the effects of past, other present, and reasonably foreseeable future projects, and determines whether the incremental impacts of the Project are cumulatively considerable. The geographic scope of the cumulative effects analysis for each resource area is tailored to the natural boundaries of the affected resource. Potential cumulative effects could occur during the Project’s proposed 10-month construction period, during the projected 25-year term of the power purchase agreement (i.e., while the Project is operating), or during post-Project decommissioning activities, which are expected to require approximately 3 months to complete. Existing conditions

6. Cumulative Impacts
McHenry Solar Farm 6-6 May 2011 Draft Environmental Impact Report
within the cumulative impacts area of effect reflect a combination of the natural condition and the effects of past actions in the vicinity of the Project site.
6.2.1 Aesthetics, Visual Quality, Light and Glare Visual changes need not occur within the same vantage point to alter how affected viewers perceive the character and aesthetic quality of the region. The geographic scope considered for potential cumulative impacts related to aesthetics, visual quality, light and glare includes: (i) the areas from which the Project could be viewed, and (ii) all projects in Table 6-1 that are located in areas with an agricultural or rural character.
As discussed in Section 4.1.5, the Project, as mitigated by Mitigation Measure 4.1-2, would cause a less-than-significant impact related to the creation of a new source of nighttime lighting. The Project would be visible from only one of the projects in the cumulative scenario (Table 6-1): the Caltrans McHenry/Ladd Signals project. The installation of street signals would increase nighttime lighting in the area; however, the projects’ combined nighttime lighting effects would be minor. There is no evidence of an existing significant cumulative effect related to nighttime lighting in this area and, together, the combined impacts of the Caltrans McHenry/Ladd Signals project and the Project would not cause a significant cumulative impact related to nighttime light.
The analysis in Section 4.1.5 concluded that the Project would cause a less-than-significant impact related to the existing visual character of the site and its surroundings. Combined impacts of the Project and projects in the cumulative scenario could cause a significant cumulative impact relating to the visual character of the region. The Caltrans projects include widening, replacement or rehabilitation projects that represent a non-existent or minor visual change relative to existing conditions. Further, the City of Modesto specific planning process, which is occurring on the urban/agricultural interface, could result in a significant cumulative impact to the visual character of the region through conversion of farmland to urban development if full build-out of the plans were to occur. Taken together, the cumulative impacts related to the visual character of the region could be significant. However, the Project’s less-than-significant incremental contribution to this potentially significant cumulative impact relating to the character of the region would not be cumulatively considerable because views of the landscaped site would be screened from regional viewpoints by the orchards adjacent to the Project site and because the existing agricultural character of the site would be restored when decommissioning occurs. Because the incremental, Project-specific contribution to the potential significant cumulative impact is not cumulatively considerable, no mitigation measures are proposed in the cumulative context (CEQA Guidelines §15130(a)(3)).
6.2.2 Agriculture and Forest Resources The geographic scope considered for potential cumulative impacts to agriculture and forest resources is Stanislaus County. The Project would cause no impact to forest land or timberland, and so would not contribute to any cumulative impact to these resources. Likewise, no Williamson Act lands would be converted as a result of Project implementation.

6. Cumulative Impacts
McHenry Solar Farm 6-7 May 2011 Draft Environmental Impact Report
The Project temporarily would discontinue the current exclusive agricultural use (row crops) of Prime Farmland. However, as explained in Section 4.2.5, this would not be considered a permanent conversion and thus would result in a less-than-significant impact regarding the conversion of Prime Farmland from exclusive agricultural use (row crops) to a mix of agricultural use (grazing) and non-agricultural use. Caltrans’s route rehabilitation, widening and replacement projects are expected to cause less than significant impacts relating to agricultural conversion. Signalization projects would have no impact in this regard. However, the trend identified in Section 4.2, Agriculture and Forest Resources, shows more acres of Prime Farmland lost than gained between 2006 and 2008. This trend can be expected to continue in response to residential and other development pressures in Stanislaus County, e.g., such as may result from development consistent with the City of Modesto’s specific planning efforts. If it does, a significant cumulative impact relating to the conversion of Prime Farmland could result. However, the Project’s incremental contribution to a significant cumulative impact related to agricultural conversion would not be cumulatively considerable because, upon decommissioning of the Project, the site would be returned to an agricultural use similar to that occurring now. Because the incremental, Project-specific contribution to the potential significant cumulative impact is not cumulatively considerable, no mitigation measures are proposed in the cumulative context (CEQA Guidelines §15130(a)(3)).
6.2.3 Air Quality The geographic scope considered for potential cumulative impacts to air quality is the SJVAB, which is governed by the SJVAPCD. Based on ambient conditions, the SJVAB is a nonattainment area for state and federal ozone, PM10, and PM2.5 standards, which indicates that there is an existing adverse cumulative effect in the SJVAB relative to these pollutants. As discussed under Impacts 4.3-1 and 4.3-5, emissions during construction and decommissioning would not exceed the SJVAPCD threshold of 10 tons per year for ROG or NOx (ozone precursors).
As explained in Section 4.3, Air Quality, PM10 and PM2.5 have similar cumulative regional emphasis because particles can be entrained into the atmosphere and contribute to unhealthful levels over time. PM10 and PM2.5 also have the potential to cause significant impacts at a local scale if several grading or earth moving projects are underway simultaneously at nearby sites. As shown in Figure 6-1, a number of projects are proposed in the vicinity of the Project site. These projects include two specific plans and multiple California Department of Transportation (Caltrans) road improvement and widening, signal, and landscaping projects. If grading and earth moving activities associated with any of these projects would overlap with activities associated with construction of the Project, cumulative local impacts to PM10 and PM2.5 levels would be potentially significant. The SJVAPCD recommends that if it appears that the local cumulative PM10 impacts would be significant, the Lead Agency should require the project applicant to implement enhanced dust control measures. Enhanced dust control measures have been included as part of Mitigation Measure 4.3-1 (see discussions for Impacts 4.3-1 and 4.3-5). Consequently, the Project’s contribution to a PM10- or PM2.5-related cumulative impact would not be cumulatively considerable.

6. Cumulative Impacts
McHenry Solar Farm 6-8 May 2011 Draft Environmental Impact Report
Project-related emissions of pollutants that are in attainment of the state and federal air quality standards would not be cumulatively considerable because they would not contribute to an existing cumulative impact.
The geographic scope considered for potential cumulative impacts from TACs is a radius of 1,000 feet measured from the Project site boundary. This radius is recommended by the BAAQMD in its 2010 CEQA Guidelines (BAAQMD, 2010), and is used here in the absence of any specific guidance from the SJVAPCD. Aside from the traffic signal project planned for the intersection of McHenry Avenue and Patterson/Ladd Road, all of the projects in the cumulative scenario (see Figure 6-1) would be well outside a 1,000-foot radius from the proposed Project boundary. Construction activity (and hence diesel exhaust emissions) associated with the signalization project would be far less that that estimated for the proposed Project, which individually would be immaterial because of the minor amount of TAC emissions emitted over a short period. Therefore, the two projects combined would not result in a cumulatively considerable impact to health risk.
6.2.4 Biological Resources The geographic scope of potential cumulative impacts to biological resources encompasses the wildlife and plant habitats of affected species in the region, which is limited generally to northern Stanislaus County. The agricultural habitats and disturbed areas in the Study Area provide potential habitat for two special-status species (Swainson’s hawk and burrowing owl), as well as other protected nesting migratory birds.
As analyzed in Section 4.4, Project activities (as mitigated) would cause a less than significant impact related to potential disturbance or loss of Swainson’s hawk and its habitat, burrowing owl, and/or other protected nesting migratory birds as a result of temporary construction/ decommissioning disturbance or by converting agricultural habitat areas to other types of uses. The specific planning efforts identified in the cumulative scenario would occur in the city, and so would not convert agricultural lands. The Caltrans projects and Fink Road Solar Farm project could affect these species and habitats. However, upon decommissioning of the Project, the site would be returned to an agricultural use (with associated habitat values) similar to existing conditions. Therefore, the Project-specific less-than-significant temporary impact related to special status species and habitats would not be cumulatively considerable.
6.2.5 Cultural and Paleontological Resources The geographic scope of potential cumulative effects with respect to cultural and paleontological resources generally is limited to areas within the physical footprint of a proposed project and viewshed of any relevant historic district. For this Project, the geographic scope considered for potential cumulative impacts to cultural and paleontological resources is the Project site (no historic district has been designated in its vicinity). The Project site contains no known historic or archaeological sites. However, because there is a slight chance of encountering previously undiscovered cultural resources, including archaeological and paleontological resources or human remains, during construction of the Project, mitigation measures are recommended. With their

6. Cumulative Impacts
McHenry Solar Farm 6-9 May 2011 Draft Environmental Impact Report
implementation, the Project would have a less-than-significant impact in this respect. None of the cumulative projects could cause impacts that could combine geographically with those of the Project. Further, there is no existing adverse cumulative impact to cultural resources to which the Project’s incremental-less-than-significant impact could contribute. Accordingly, the incremental impact of the Project would not be cumulatively considerable.
6.2.6 Energy Conservation The geographic scope of potential cumulative effects with respect to energy conservation includes the electric grid to which Project power would contribute and areas from which transportation fuels would be provided (for this EIR, publicly-available fuel sources in the vicinity of the Project site). The Project would have no impact with respect to adverse effect on local and regional energy supplies or requirements for additional capacity, no adverse effects on peak and base period demands for electricity and other forms of energy, no adverse effect on energy resources, and the Project would directly support and further effort toward achieving existing energy standards. Therefore, the Project would have no contribution to any cumulative impact on those aspects of energy conservation.
The Project would cause a less-than-significant incremental impact relating to the consumption of energy, use of transportation energy, and use of transportation alternatives. The Projected demand on operational electricity requirements (electricity drawn from the MID power grid) would be negligible in comparison to the net energy produced, and thus the overall positive energy impact would not contribute to any adverse cumulative impact related to energy consumption, and would not be cumulatively considerable.
The Project’s less-than-significant incremental impact related to the use of transportation energy and efficient use of transportation alternatives is not expected to combine with the incremental impacts of other projects to cause an adverse cumulative impact on energy conservation. Project-related transportation impacts would be limited to the construction phase, which could overlap with the transportation needs (including fuel needs) of previously-approved past projects, as well as other present or future projects that come online during Project construction and decommissioning. Given the rural nature of the site, and the absence of an existing adverse cumulative impact to which the Project could contribute, the Project’s less-than-significant demand on/efficient use of transportation alternatives would not be cumulatively considerable. Similarly, the Project’s less-than-significant incremental usage of transportation energy to transport the construction labor force and materials to the site would not contribute to an existing adverse cumulative condition, and so would not be cumulatively considerable.
6.2.7 Geology, Soils and Seismicity The Central Valley lies between two seismically-active regions with a wide range of geologic and soil conditions that can vary widely within a short distance. Therefore, the geographic extent considered for potential cumulative impacts to people and structures related to geologic and seismic hazards is more localized or site-specific. As analyzed in Section 4.7, the Project could cause less-than-significant impacts related to strong seismic groundshaking, seismically-induced

6. Cumulative Impacts
McHenry Solar Farm 6-10 May 2011 Draft Environmental Impact Report
ground failure, erosion or loss of topsoil and expansive soils. However, none of the potential impacts of any of the projects in the cumulative scenario could interact with impacts of the Project on the Project site. Therefore, the Project’s incremental contribution to any cumulative impact related to geology and soils would not be cumulatively considerable.
6.2.8 Greenhouse Gas Emissions GHG emissions are inherently a cumulative concern, in that the significance of GHG emissions is determined based on whether such emissions would have a cumulatively considerable impact on global climate change. Although the geographic scope of cumulative impacts related to GHG emissions is global, this analysis focuses on the state, the region, and this Project’s direct and/or indirect generation or offset of GHG emissions. The proposed Project would result in a long-term net reduction of approximately 19,772 metric tons of CO2e per year and would not conflict with the state’s GHG reduction goals. Therefore, the Project-specific incremental impact on GHG emissions would not be cumulatively considerable.
6.2.9 Hazards and Hazardous Materials The geographic scope of the hazardous material cumulative impact analysis is 0.25 mile from the Project site boundary (because impacts related to hazards and hazardous materials generally are site-specific) and along Project delivery routes where Project construction-related hazardous materials could be transported, i.e., SR 108 (McHenry Avenue and portions of Patterson Road), SR 219 (Kiernan Avenue), and Ladd Road.
The Project could cause a temporary less-than-significant hazard to the public or the environment through the routine transport, use, or disposal of hazardous materials; and a temporary less-than-significant hazard to the public or the environment through reasonably foreseeable upset and accident conditions involving the release of hazardous materials into the environment. Only one of the projects listed on Table 6-1 (installation of traffic signals at the intersection of McHenry Avenue and Ladd Road) would be within the immediate vicinity of the Project. The hazard-related impacts of this project, combined with those of the proposed Project, would not result in a significant cumulative impact for hazards or hazardous materials even if the projects were to be constructed simultaneously because the small volume of any hazardous materials (e.g., vehicle fuels, lubricants) associated with the equipment needed to install the traffic signals would not be substantial and because there is no existing adverse cumulative condition to which these projects would contribute.
Further, concerning potential transportation-related hazards, cumulative projects 3 and 6 are complete or are expected to be complete before hazardous materials associated with the Project would be transported. Accordingly, these projects would not cause impacts that could combine with those of the Project. Cumulative projects 1, 2, 5, and 8 are inactive, on hold, or require funding; accordingly, the timing of related approvals and subsequent development is speculative. Cumulative project 4 could be approved as soon as Fall 2011, and subsequent construction could overlap with the construction period for the Project; however, the less than significant, Project-specific impact, combined with the impacts of this roadway replacement/expressway development project, would not cause or contribute to a significant cumulative effect given the small quantities to be transported

6. Cumulative Impacts
McHenry Solar Farm 6-11 May 2011 Draft Environmental Impact Report
and the expectation that all materials will be transported in accordance with all applicable safety requirements. Therefore, the Project would not cause a cumulatively considerable impact related to hazards and hazardous materials. Because the incremental, Project-specific contribution to the potential significant cumulative impact is not cumulatively considerable, no mitigation measures are proposed in the cumulative context (CEQA Guidelines §15130(a)(3)).
6.2.10 Hydrology and Water Quality For clarity, the following discussion of potential cumulative impacts related to hydrology and water quality is divided between surface water and groundwater.
Surface Water
The geographic area within which cumulative impacts associated with surface water hydrology and water quality could occur includes the watercourses that could be affected by the Project. This generally corresponds to rivers and canals that are located down-gradient of the Project, e.g., Ables Drain, the Modesto Main Canal and the Lower Stanislaus River. The Project site is flat and well-drained. Under normal circumstances, stormwater is confined to the site and percolates directly into the ground. However, during storm events of high intensity and long duration, surface water from the site may eventually overcome the capacity of roadside ditches to hold water and flow across roads and nearby lands into regional agricultural canals, and eventually into the San Joaquin River.
The Project would cause a less-than-significant impact related to surface water hydrology and water quality, primarily due to the minor changes that would occur at the site from a hydrological standpoint. No significant adverse cumulative impact is known to exist in the relevant geographic area related to hydrology and water quality. Other development listed on Table 6-1 that is expected to occur in the cumulative scenario would be required to comply with existing federal, state, and local laws that protect water quality, and so are not expected to cause a significant cumulative impact to which the Project could contribute. Consequently, the Project’s incremental impact to cumulative conditions related to hydrology and water quality would not be cumulatively considerable.
Groundwater
The geographic context for the cumulative impacts associated with groundwater includes the Modesto subbasin of the San Joaquin Groundwater basin. Each of the projects identified in Figure 6-1 is likely to fall within this area. Incremental impacts of the Project related to groundwater availability and quality could be considered to be positive because groundwater withdrawals from the on-site well would decrease. Because operation of the Project would involve some (although few) hazardous materials or pollutants, Section 4.10 concludes that the Project would have a less-than-significant impact on hydrology and water quality. There is no known existing significant adverse cumulative impact to groundwater to which the Project could contribute. Accordingly, the Project’s incremental contribution would not be cumulatively considerable.

6. Cumulative Impacts
McHenry Solar Farm 6-12 May 2011 Draft Environmental Impact Report
6.2.11 Land Use and Planning The Project would have no impact on Land Use and Planning; therefore, it would not contribute to any cumulative impact in this regard.
6.2.12 Mineral Resources The Project would have no impact on Mineral Resources; therefore, it would not contribute to any cumulative impact related to such resources.
6.2.13 Noise The geographic scope considered for potential cumulative impacts related to noise is the area within 0.25 mile of the Project site because sounds naturally attenuate with distance and intervening vegetation. The geographic scope includes existing elevated traffic noise associated with McHenry Avenue and Patterson Road. The only other identified project that would occur within 0.25 mile of the site is the Caltrans McHenry/Ladd Signals project. However, construction of the Caltrans McHenry/Ladd Signals project is expected to be completed prior to the start of construction activities associated with the proposed Project and the Caltrans McHenry/Ladd Signals project would not result in long-term noise. As discussed in Section 4.13, implementation of the Project would result in less than significant noise-related impacts given the low noise levels that would be associated with Project operation and the relatively high ambient noise levels in the area. Even with ambient noise levels, Project-related short-term and long-term noise levels would not be cumulatively considerable.
6.2.14 Population and Housing The Project would have no impact on Population and Housing; therefore, it would not contribute to any cumulative impact related to this resource area.
6.2.15 Public Services The Project would have no impact on Public Services; therefore, it would not contribute to any cumulative impact related to such services.
6.2.16 Recreation The Project would have no impact on Recreation; therefore, it would not contribute to any cumulative impact related to recreation.
6.2.17 Transportation and Traffic Potential cumulative traffic impacts could occur during the 10-month project construction period as a result: of (1) other projects that would generate increased traffic at the same time on the same roads as the Project, causing increased congestion and delays, and (2) infrastructure projects in

6. Cumulative Impacts
McHenry Solar Farm 6-13 May 2011 Draft Environmental Impact Report
roads that would be used by Project construction workers and trucks, which could delay project-related vehicles traveling past the work zones of the other projects.
The geographic scope of potential cumulative traffic impacts includes access routes to area freeways, state highways, and collector roadways used for material delivery routes and construction equipment/vehicle access to the Project site. Given the wide dispersion of state highways and interstate traffic along roadways that would be used by Project-related traffic, this analysis focuses on potential cumulative traffic impacts on roadways to the Project site, specifically roadways described in Section 4.17.1.1, Regional and Local Setting.
Based on the proposed construction scheduling shown for most of the projects listed in Table 6-1, simultaneous (overlapping) construction is not expected to occur during the construction of the Project: cumulative projects 3 and 6 are complete or are expected to be complete before Project construction would begin. Accordingly, these projects would not cause impacts that could combine with those of the Project. Cumulative projects 1, 2, 5, and 8 are inactive, on hold, or require funding; accordingly, the timing of related approvals and subsequent development is speculative. Cumulative project 4 could be approved as soon as Fall 2011, and subsequent construction could overlap with the construction period for the Project; however, the less than significant, Project-specific impact on transportation and traffic, combined with the impacts of this roadway replacement/expressway development project would not cause or contribute to a significant cumulative effect. Roadway conditions do not exhibit an existing, significant and adverse cumulative impact to which these impacts could contribute and, together, they would not cause one. Furthermore, the operational traffic associated with the Project would be negligible (four one-way trips per work day plus trips associated with panel washing that would occur two to four times per year), and the increase in traffic along adjacent roadways caused by the Project would not be substantial. As a result, the Project’s contribution to transportation/traffic impacts, in combination with other projects, would not be cumulatively considerable.
6.2.18 Utilities and Service Systems The Project would have no impact on water or wastewater infrastructure, or regarding solid waste disposal and compliance with waste regulations; therefore, it would not contribute to any cumulative impact in these areas.
Implementation of the Project would result in a less-than-significant impact regarding construction of stormwater drainage improvements. However, modifications would not alter the topography of the site such that drainage patterns would substantially change, and the Project would not generate an additional volume of concentrated runoff that could cause erosion, siltation, or flooding to occur on or off the site. Because there would be no off-site impacts from stormwater drainage and none of the other development projects would be developed on the Project site, there would be no potential for the Project to contribute to any cumulative impacts that may result from other projects (CEQA Guidelines §15130(a)(1)).
_________________________

6. Cumulative Impacts
McHenry Solar Farm 6-14 May 2011 Draft Environmental Impact Report
Resources – Cumulative Impacts Caltrans, 2010. Status of Projects, Central Region, District 10, December 2010. Available at:
http://www.dot.ca.gov/dist10/docs/d10sop.pdf. Accessed January 6, 2011.
Modesto, 2011. “Pelandale-McHenry Specific Plan.” Available at: <http://www.modestogov.com/ced/projects/pelandale-mchenry.asp.> Accessed January 3, 2011.
Modesto, 2010a. Modesto Planning Department. Personal Communication with Patrick Kelley, AICP on December 28, 2010.
Modesto, 2011b.”Woodglen Project.” <Available at: http://www.modestogov.com/ced/projects/woodglen.asp.> Accessed January 3, 2011.
Modesto Irrigation District (MID), 2010, MID Fast Facts, 2010.
MID, 2009. MID, Reflections: Annual Report 2009, http://www.mid.org/about/annualreport/MIDAR2009-FINAL.pdf, 2009.
Stanislaus County, 2011. Stanislaus County Planning Department, personal communication with B. Carlson, May 6, 2011.

McHenry Solar Farm 7-1 May 2011 Draft Environmental Impact Report
CHAPTER 7 Other CEQA Considerations
CEQA requires an EIR to consider the significant environmental effects of a proposed project (CEQA Guidelines §15126.2). Direct and indirect, short- and long-term effects of the Project are analyzed in Chapter 4, Environmental Analysis, which concludes that the Project would have no impact relating to Land Use and Planning, Mineral Resources, Population and Housing, Public Services, and Recreation. This chapter considers significant and unavoidable impacts in Section 7.1, significant irreversible environmental effects in Section 7.2, and growth-inducing impacts in Section 7.3.
7.1 Significant Unavoidable Environmental Impacts
CEQA §21100(b)(2)(A) requires an EIR to identify significant environmental effects that cannot be avoided if a project is implemented. All of the impacts of the Project either would be less than significant or would be mitigated to a less than significant level. Accordingly, no impact would remain significant and unavoidable after mitigation is implemented.
7.2 Significant Irreversible Changes
CEQA §21100(b)(2)(B) requires that an EIR identify any significant effect on the environment that would be irreversible if the project were implemented. CEQA Guidelines §15126.2(c) describes irreversible environmental changes as follows:
Uses of nonrenewable resources during the initial and continued phases of the project may be irreversible since a large commitment of such resources makes removal or nonuse thereafter unlikely. Primary impacts and, particularly, secondary impacts (such as highway improvement which provides access to a previously inaccessible area) generally commit future generations to similar uses. Also irreversible damage can result from environmental accidents associated with the project.
Construction of the Project would require some nonrenewable resources, such as fuel for construction vehicles and equipment. However, such use would be limited to the approximately 10-month construction period and the 3-month end-of-life decommissioning period. Operation and maintenance of the Project would last at least 25 years, which is the term of the Power Purchase Agreement between the Applicant and MID (the contract could be extended at the end of the initial term). The temporary construction- and decommissioning-related use of vehicle fuel would not result in a significant use of nonrenewable resources, and would not commit future generations to similar uses. Moreover, the Project’s primary objective is to assist MID in meeting its Renewable

7. Other CEQA Considerations
McHenry Solar Farm 7-2 May 2011 Draft Environmental Impact Report
Portfolio Standard and goals aimed at reducing greenhouse gas emissions by locating PV solar power plant facilities within MID’s electric service territory. To the extent that this proposed new renewable source of energy would offset the demand for fossil fuel-generated electricity for the life of the Project, the Project would reduce the use of non-renewable resources and their associated impacts. Consequently, the temporary and limited increase in consumption of nonrenewable resources that would be caused by the Project relative to existing conditions is justified.
Accidents, such as the release of hazardous materials, could trigger irreversible environmental damage. Initial Project construction and subsequent decommissioning would result in a temporary increase in the use, handling, and storage of hazardous materials when compared to existing use levels at the Project site (see Chapter 2, Project Description, Section 2.5.7 Waste Requirements and Waste Generation, Subsection Hazardous Materials and Hazardous Waste, for a range of hazardous materials that could be handled on-site). Considering the types and minimal quantities of hazardous materials that are and would continue to be used at the site, and emergency response plans and procedures that would be implemented as a part of the Project, accidental release of substantial quantities is unlikely. State and federal regulations and safety requirements, as described in the regulatory setting in Section 4.9, Hazards and Hazardous Materials, would ensure that public health and safety risks are maintained at acceptable levels, so that significant irreversible changes from accidental releases are not expected.
7.3 Growth-Inducing Impacts
CEQA Guidelines §15126.2(d) states that an EIR must discuss “the ways in which the proposed project could foster economic or population growth, or the construction of additional housing, either directly or indirectly, in the surrounding environment.” Growth can be induced in a number of ways, including directly through implementation of projects that create new housing and employment opportunities, and indirectly through elimination of obstacles to growth and stimulation of economic activity within a region. CEQA requires a discussion of how a project could increase population, employment, or housing in the areas surrounding the project, as well as an analysis of the infrastructure and planning changes that would be necessary to implement the project.
Section 4.14, Population and Housing, analyzes the Project’s overall effect on population and housing, including growth-inducing considerations. Project construction would last approximately 10 months and would require between 28 and 144 construction workers per month with a peak workforce of approximately 144 people in months 5, 6, and 7 of the construction schedule. It is anticipated that all temporary positions would be filled from the local labor pool. Construction workers are expected to commute to the site rather than move to the project vicinity from outside of the local area. The Project would require two permanent employees, who are expected to be from the local area, so operation and maintenance of the Project would not be growth-inducing. Because the ultimate decommissioning phase of the Project would be similar to, but shorter in duration and less workforce-intensive than, the construction phase, it also would not be growth-inducing.

7. Other CEQA Considerations
McHenry Solar Farm 7-3 May 2011 Draft Environmental Impact Report
The Project does not involve construction of new public roads, but would provide new electrical infrastructure. The new electrical infrastructure would transfer power generated by the solar plant to MID’s electric grid. The electrical infrastructure would not provide convenient connection points for potential off-site development. Therefore, it would not encourage new development or induce population growth. Further, MID provides electricity to meet the needs of the population in its service area, within which the population growth is governed by the city and county General Plans and the planning agencies within those jurisdictions. In sum, the Project would neither directly nor indirectly induce short-term or long-term population growth.
The Project involves generation of renewable energy for distribution to the electrical grid. This increased generation from solar energy is necessary to meet MID’s Renewable Portfolio Standard and California’s statewide goal of achieving a 33 percent renewable energy share by 2020. Therefore, it is not considered growth-inducing because it would reduce the use of fossil-fuel-based electricity generation.

McHenry Solar Farm 8-1 May 2011 Draft Environmental Impact Report
CHAPTER 8 Report Preparation
8.1 Report Authors
8.1.1 Lead Agency David Olivares, RP&D Engineer Modesto Irrigation District P.O. Box 4060 Modesto, CA 95352
Karna Harrigfeld, CEQA Counsel for MID Herum\Crabtree 2291 West March Lane, Suite B100 Stockton, CA 95207
8.1.2 Consultants
Environmental Science Associates
Doug Cover, QEP Project Director; Alternatives
Janna Scott, J.D. Project Manager; Project Description; Cumulative Analysis
Cory Barringhaus, AICP Deputy Project Manager; Agriculture and Forest Resources, Land Use and Planning, Population and Housing, Public Services, Recreation, Utilities and Service Systems
Kathy Anderson Cultural Resources
Josh Boldt, ISA CA Biological Resources
Allison Chan Cumulative Impacts
Pete Costa, AICP Transportation/Traffic
Dylan Duverge Hydrology and Water Quality, Mineral Resources
Matt Fagundes Air Quality, Energy Conservation, Greenhouse Gas Emissions, Hazards and Hazardous Materials, Noise
Jack Hutchinson, P.E. Transportation/Traffic
Julie Holst Air Quality, Energy Conservation, Greenhouse Gas Emissions, Hazards and Hazardous Materials, Noise, Cumulative Impacts
Jennifer Johnson, J.D. QA/QC
Heidi Koenig, RPA Cultural Resources
Cherie Kolin Aesthetics, Visual Quality, and Light and Glare; Geology and Soils

8. Report Preparation
McHenry Solar Farm 8-2 May 2011 Draft Environmental Impact Report
Chariss Tweedy, ISA CA Biological Resources
Wes McCullough GIS Analysis and Graphics
CH2M HILL (peer review)
John Carrier, J.D. Program Manager
Wendy Haydon Project Manager
Jeanne Acutanza Transportation/Traffic
Mark Bastasch Noise
Louise Brown Noise
Amy Clymo Air Quality and Greenhouse Gas Emissions
Deborah Dagang Transportation/Traffic
James Marble Biological Resources
Clint Helton Cultural Resources
Peggie King Hydrology and Water Quality
Geof Spaulding Paleontological Resources
Pamela Vanderbilt Air Quality and Greenhouse Gas Emissions
James Verhoff Paleontological Resources
8.2 Agencies and Organizations Contacted
The Modesto Irrigation District submitted a copy of the Notice of Preparation to the following agencies and organizations:
Federal
U.S. Fish and Wildlife Service
State California Department of Fish and Game
California Department of Transportation
Central Valley Regional Water Quality Control Board
Native American Heritage Commission
Local
Stanislaus County Department of Planning and Community Development
San Joaquin Valley Air Pollution Control District

McHenry Solar Farm 9-1 May 2011 Draft Environmental Impact Report
CHAPTER 9 Glossary and Acronyms
9.1 Glossary
This glossary includes selected definitions and acronyms to aid decision-makers and the public in evaluating the environmental impacts of the Project.
Word or Phrase Definition
Applicant Proposed Measure
An activity, process, or procedure that the Applicant has proposed as part of the Project to reduce or avoid potential environmental impacts.
Decommission Removal of all Project facilities at the end of the Project life, and return of the site to its pre-Project condition.
Distribution Line
Electrical conductors (wires) that carry electricity at 12.5 kilovolts (12,500 volts) or less.
Fiber Optic Cable
This is a cable made up of super-thin filaments of glass or other transparent materials that can carry beams of light. Because a fiber optic cable is light-based, data can be sent through it at the speed of light.
Megawatt (MW)
A unit of electrical energy equal to one million watts. One megawatt would power approximately 1,000 homes.
Mitigation Measure
An activity, process, or procedure required to reduce or avoid potentially significant environmental impacts of the Project. Mitigation Measures are in addition to any Applicant Proposed Measures.
Modular Power Block
The solar panel array would contain a combination of 1- and 1.5-MW modular power blocks, depending on final site design. Each 1-MW power block would be approximately 6 acres in size, and would contain 72 rows of solar PV panels with 4 “strings” of 10 panels per row. Each 1.5-MW power block would be approximately 9 acres in size, and would contain 108 rows of solar PV panels, also with 4 “strings” of 10 panels per row.

9. Glossary and Acronyms
McHenry Solar Farm 9-2 May 2011 Draft Environmental Impact Report
Word or Phrase Definition
Photovoltaic (PV) Panels
Solar panels that absorb sunlight to generate electricity. The Project panels would be constructed from monocrystalline silicon (one of the types of silicon that generates electricity from sunlight), non-reflective glass, aluminum frame, and copper electrical wires with plastic sheathing.
Solar Panel Array
General term that refers to the layout of solar panels on the Project site.
Substation The component of an electric generation, transmission, and distribution system that transforms voltage from high to low or the reverse using transformers. The Project substation would collect the medium voltage circuits that carry power from the individual modular power blocks. The substation would be located at the Project site. It would contain metering equipment, a series of fuses and circuit breakers that act as protective relays, and transformers to step-up the voltage to match the voltage of the sub-transmission grid at MID’s Ladd Road Substation. For the Project, the substation would step-up the voltage from 34-kV medium voltage to the 69-kV interconnection voltage of MID’s electric system.
Sub-transmission Line
Electrical conductors (wires) that carry electricity at between 69 kilovolts (69,000 volts) and 115 kilovolts (115,000 volts).
Switchyard The interconnection to MID’s electric system would occur in a MID switchyard that would be located at the Project site. The switchyard would have switchgear equipment and metering equipment for delivery of the output from the proposed power plant to MID’s electric system, as well as an electrical ground safety grid and concrete pads to support the switchyard equipment. A control building would also be constructed within the MID switchyard that would house communications and other equipment used to reliably interconnect the solar facility to MID’s electric system.
Tracker Unit Each modular power block is comprised of individual tracker units (four for the 1-MW power block and six for the 1.5-MW power block). The tracker units contain the rows of solar PV panels oriented in the north-south direction. The tracker units would rotate the rows of solar PV panels from east to west throughout the day following the sun to maximize exposure to sunlight, thereby maximizing electrical output. The rows of each tracker units would be linked together and rotated in unison by an industrial-grade system controller and drive unit.
Transformer A transformer is an electrical device that changes electricity from one voltage to another.
Transmission Line
Electrical conductors (wires) that carry electricity at or above 115 kilovolts (115,000 volts).

9. Glossary and Acronyms
McHenry Solar Farm 9-3 May 2011 Draft Environmental Impact Report
9.2 Acronyms and Abbreviations Acronym Definition AADT Annual Average Daily Traffic
AC Alternating current
APM Applicant Proposed Measures
AQMP Air Quality Management Plan
ASCE American Society of Civil Engineers
ATV All-terrain vehicle
BAAQMD Bay Area Air Quality Management District
BMPs Best management practices
CAA Clean Air Act
CAAQS California Ambient Air Quality Standard(s)
Cal-OSHA California Occupational Safety and Health Administration
CalRecycle California Department of Resources Recycling and Recovery
Caltrans California Department of Transportation
CARB California Air Resources Board
CAT Climate Action Team
CBC California Building Code
CCAR California Climate Action Registry
CCR California Code of Regulations
CCTS Central California Taxonomic System
CDFG California Department of Fish and Game
CEC California Energy Commission
CEQA California Environmental Quality Act
CESA California Endangered Species Act
CFR Code of Federal Regulations
CGS California Geological Survey
CH4 Methane
CHP California Highway Patrol
CIP Capital Improvement Program
CIWMP Countywide Integrated Waste Management Plan
CMP Congestion Management Program
CNDDB California Natural Diversity Database
CNEL Community Noise Equivalent Level

9. Glossary and Acronyms
McHenry Solar Farm 9-4 May 2011 Draft Environmental Impact Report
Acronym Definition CNPS California Native Plant Society
CO Carbon monoxide
CO2 Carbon dioxide
CO2e Carbon dioxide equivalent
CPUC California Public Utilities Commission
CSC California Species of Special Concern
CVRWQCB Central Valley Regional Water Quality Control Board
CWA Clean Water Act
CWHR California Wildlife Habitat Relationship System
DAS Data Acquisition System
dB Decibels
dBA A-weighted decibels
DC Direct current
DNL Day-Night Noise Level
DSOD Division of Safety of Dams
DTSC Department of Toxic Substances Control
EIR Environmental Impact Report
FAA Federal Aviation Administration
FEMA Federal Emergency Management Agency
FESA Federal Endangered Species Act
FMMP Farmland Mapping and Monitoring Program
g Acceleration due to gravity
GHG Greenhouse gas(es)
HFC Hydrofluorocarbon
Hz Hertz
IBC International Building Code
kV Kilovolt
LDAR Leak detection and repair
Ldn Energy average of A-weighted sound levels occurring during a 24-hour period
Leq Equivalent sound level
LGIA Large Generator Interconnection Agreement
Lmax Instantaneous maximum noise level
LOS Level of Service

9. Glossary and Acronyms
McHenry Solar Farm 9-5 May 2011 Draft Environmental Impact Report
Acronym Definition M Richter Magnitude
m/s Meters per second
MID Modesto Irrigation District
MM Modified Mercalli Intensity Scale
mph Miles per hour
MRZ Mineral Resource Zone
msl Mean sea level
Mw Moment Magnitude
MW Megawatt
MWac Megawatt alternating current (one million watts)
NAAQS National Ambient Air Quality Standard(s)
NAHC Native American Heritage Commission
NHPA National Historic Preservation Act
N2O Nitrous oxide
NOx Oxides of nitrogen
NO2 Nitrogen dioxide
NPDES National Pollutant Discharge Elimination System
NRCS Natural Resources Conservation Service
O&M Operation and maintenance
OSHA Occupational Safety and Health Administration
PFCs Perfluorocarbons
PG&E Pacific Gas & Electric Company
PGA Peak Ground Acceleration
PM10 Particulate matter less than 10 microns in size
PM2.5 Particulate matter less than 2.5 microns in size
ppm Parts per million
PPV Peak particle velocity
PRC Public Resources Code
PSHA Probabilistic Seismic Hazard Assessment
PV Photovoltaic
RCRA Resource Conservation and Recovery Act
RMS Root mean square
ROG Reactive Organic Gas
ROTA Riverbank-Oakdale Transit Authority

9. Glossary and Acronyms
McHenry Solar Farm 9-6 May 2011 Draft Environmental Impact Report
Acronym Definition RPS Renewable Portfolio Standard
RWQCB Regional Water Quality Control Board(s)
SCADA Supervisory Control and Data Acquisition
SCFPD Stanislaus Consolidated Fire Protection District
SCSD Stanislaus County Sheriff’s Department
SF6 Sulfur hexafluoride
SIP State Implementation Plan
SJVAB San Joaquin Valley Air Basin
SJVAPCD San Joaquin Valley Air Pollution Control District
SLC Species of Local Concern
SMARA Surface Mining and Reclamation Act
SO2 Sulfur dioxide
SRRE Source Reduction and Recycling Element
StanCOG Stanislaus County Council of Governments
StaRT Stanislaus Regional Transit
SWPPP Storm Water Pollution Prevention Plan
SWRCB State Water Resources Control Board (State Board)
TAC Toxic air contaminant
TMDL Total Maximum Daily Load
TPZ Timberland Production Zone
UBC Uniform Building Code
UCMP University of California, Museum of Paleontology
µg/m3 Micrograms per cubic meter
USACE U.S. Army Corps of Engineers
USEPA U.S. Environmental Protection Agency
USFWS U.S. Fish and Wildlife Service
USGS U.S. Geological Survey
VFD Variable-frequency drive
WDRs Waste Discharge Requirements
W/m2 Watts per square meter

McHenry Solar Farm 10-1 May 2011 Draft Environmental Impact Report
CHAPTER 10 Mitigation Monitoring Plan
10.1 Introduction
MID developed mitigation measures pursuant to its analysis of environmental impacts that could be associated with approval of the Large Generator Interconnection Agreement (LGIA) application filed for the McHenry Solar Farm (Project) by Solar Star California VIII, LLC1 (Solar Star, or Applicant). The purpose of these mitigation measures is to minimize potential environmental impacts during construction, operation, and decommissioning of the Project.
The mitigation measures are included in MID’s EIR for the Project pursuant to CEQA. Monitoring for the mitigation measures would occur as indicated in the EIR and in this Mitigation Monitoring Plan.
This Mitigation Monitoring Plan would be used to ensure that these mitigation measures, adopted as conditions for Project approval, are implemented. This plan meets CEQA’s requirement to prepare a reporting or monitoring program for the implementation of mitigation assigned as part of project approval or adoption (Pub. Res. Code § 21081.6; CEQA Guidelines § 15097). If and when the Project is approved by MID, MID will compile the Final Mitigation Monitoring Plan based on this plan and the mitigation measures included in the Final EIR, as certified by MID.
10.2 Mitigation Implementation and Monitoring
MID and the Applicant would monitor the implementation of mitigation measures provided in Table 10-1. MID would be responsible for implementation and monitoring of mitigation measures for impacts associated with construction, operation, and decommissioning of the proposed electrical switchyard, subtransmission and distribution lines, fiber optic cable, and control building (any of the three options). The Applicant would be responsible for the implementation and monitoring of mitigation measures for impacts associated with the construction, operation, and decommissioning of the proposed solar field, on-site substation, operation and maintenance building, and other site improvements.
The Applicant would be responsible for submitting all documentation and reports to MID and any other applicable regulatory agencies in a timely manner necessary for demonstrating compliance with mitigation requirements. The Applicant would ensure that the personnel designated for
1 Solar Star California VIII, LLC is a wholly-owned subsidiary of the SunPower Corporation.

10. Mitigation Monitoring Plan
McHenry Solar Farm 10-2 May 2011 Draft Environmental Impact Report
monitoring and implementation of the mitigation measures have authority to require implementation of mitigation requirements and would be capable of terminating any Project activities found to be inconsistent with mitigation measures or conditions of Project approval.
MID and the Applicant would be responsible for demonstrating compliance with other agency permit conditions to the appropriate regulatory agency. They also would be responsible for ensuring that construction personnel understand their responsibilities for adhering to the performance requirements of the Mitigation Monitoring Plan and other contractual requirements related to the implementation of mitigation measures as part of Project construction.
For each potential environmental impact and prescribed mitigation measure, Table 10-1 lists the corresponding mitigation implementation and monitoring requirements.
10.3 Mitigation Enforcement
The Applicant would report to MID regarding the implementation of all mitigation measures on a regular basis, as indicated in Table 10-1. If alternative mitigation measures are identified that would be equally effective in mitigating the identified impacts, the implementation of these alternative measures would not occur until agreed upon by MID and other regulatory agencies, as applicable.
10.4 Mitigation Monitoring Plan Measures
Table 10-1 presents the mitigation measures recommended in the EIR. The purpose of the table is to provide a single comprehensive list of impacts, mitigation measures, and monitoring requirements.

10. Mitigation Monitoring Plan
McHenry Solar Farm 10-3 May 2011 Draft Environmental Impact Report
TABLE 10-1 MITIGATION MONITORING PLAN FOR THE McHENRY SOLAR FARM PROJECT
Environmental Impact Mitigation Measures Proposed in this EIR Implementing Actions Monitoring/Reporting Requirements Timing
Aesthetics, Visual Quality, and Light and Glare
Impact 4.1-2: The Project would create a new source of light or glare which could adversely affect daytime or nighttime views in the area.
Mitigation Measure 4.1-2: Nighttime Construction Lighting. Nighttime construction lighting, if required, shall be shielded and oriented downward to minimize effects on any nearby receptors. Lighting shall be directed toward active construction areas only, and shall have the minimum brightness necessary to ensure worker safety.
The Applicant and MID shall implement measure as described for their respective portions of the Project.
Applicant- and MID-assigned environmental monitors shall observe nighttime lighting for compliance.
During construction and decommissioning.
Agriculture and Forest Resources
No mitigation required.
Air Quality
Impact 4.3-1: Construction and decommissioning activities would generate emissions of criteria pollutants, including suspended and inhalable particulate matter and equipment exhaust emissions.
Mitigation Measure 4.3-1: Implement Dust Control Measures. The Applicant shall submit a Dust Control Plan to the APCO for approval prior to start of construction (and, subsequently, decommissioning) activities. The Plan shall cover both Applicant and MID activities, and shall require implementation of the following dust control measures. All disturbed areas, including storage piles that are not being
actively used for construction purposes, shall be effectively stabilized of dust emissions using water, chemical stabilizer/suppressant, covered with a tarp or other suitable cover, or vegetative ground cover.
All on-site unpaved roads and off-site unpaved access roads shall be effectively stabilized of dust emissions using water or chemical stabilizer/suppressant.
All land clearing, grubbing, scraping, excavation, land leveling, grading, cut and fill, and demolition activities shall be effectively controlled of fugitive dust emissions using application of water or by presoaking.
When materials are transported off-site, all material shall be covered or effectively wetted to limit visible dust emissions, and at least six inches of freeboard space from the top of the container shall be maintained.
The Applicant shall submit the Dust Control Plan to the APCO at least 30 days prior to initiation of construction (and, subsequently, decommissioning). The Applicant shall provide to MID evidence of APCO approval of the Dust Control Plan prior to initiation of construction (and, subsequently, decommissioning).
MID shall verify APCO approval of the Dust Control Plan. The Applicant-assigned environmental monitor shall observe construction (and, subsequently, decommissioning) activities for compliance with the approved Plan.
During construction and decommissioning.

10. Mitigation Monitoring Plan
TABLE 10-1 (Continued) MITIGATION MONITORING PLAN FOR THE McHENRY SOLAR FARM PROJECT
McHenry Solar Farm 10-4 May 2011 Draft Environmental Impact Report
Environmental Impact Mitigation Measures Proposed in this EIR Implementing Actions Monitoring/Reporting Requirements Timing
Air Quality (cont.)
Impact 4.3-1 (cont.) Limit or expeditiously remove trackout (i.e., accumulation of mud or dirt from Project-related vehicle tires) from adjacent public streets near the Project access points. Trackout shall be immediately removed from public streets when it extends 50 or more feet from the Project access points; otherwise trackout shall be removed at the end of each workday. (The use of dry rotary brushes is expressly prohibited except where preceded or accompanied by sufficient wetting to limit the visible dust emissions.)(Use of blower devices is expressly forbidden).
Following the addition of materials to, or removal of materials from, the surface of outdoor storage piles, said piles shall be effectively stabilized of fugitive dust emissions using sufficient water or chemical stabilizer/suppressant.
Limit traffic speed on unpaved on-site roads to 15 mph.
Install sandbags or other erosion control measures to prevent silt runoff to public roadways from sites with a slope greater than one percent.
Install windbreaks at windward side(s) of construction areas.
Suspend excavation and grading activity when winds exceed 20 mph.
Impact 4.3-4: Construction and decommissioning emissions associated with the Project could result in emissions of ozone precursors and particulate matter that would be cumulatively considerable.
Mitigation Measure 4.3-4: Implement Mitigation Measure 4.3-1. See Mitigation Measure 4.3-1. See Mitigation Measure 4.3-1. See Mitigation Measure 4.3-1.
Impact 4.3-6: The Project would generate emissions of criteria pollutants, potentially exposing sensitive receptors to harmful pollutant concentrations.
Mitigation Measure 4.3-6: Implement Mitigation Measure 4.3-1. See Mitigation Measure 4.3-1. See Mitigation Measure 4.3-1. See Mitigation Measure 4.3-1.
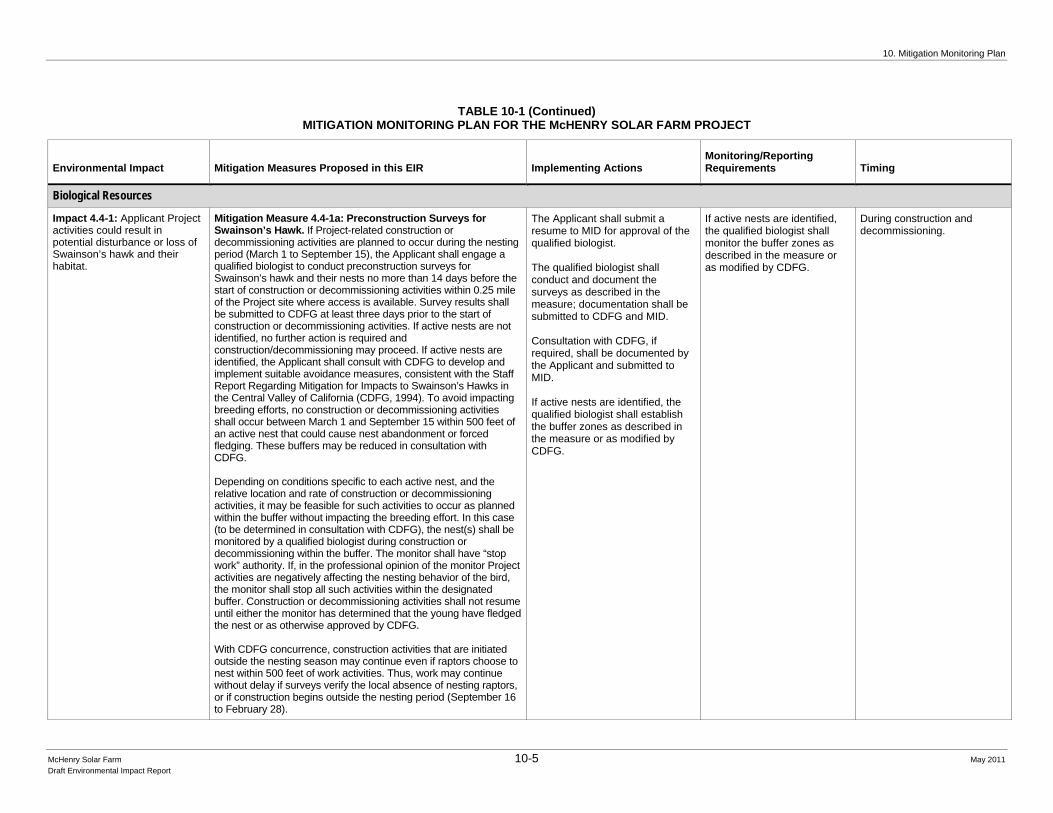
10. Mitigation Monitoring Plan
TABLE 10-1 (Continued) MITIGATION MONITORING PLAN FOR THE McHENRY SOLAR FARM PROJECT
McHenry Solar Farm 10-5 May 2011 Draft Environmental Impact Report
Environmental Impact Mitigation Measures Proposed in this EIR Implementing Actions Monitoring/Reporting Requirements Timing
Biological Resources
Impact 4.4-1: Applicant Project activities could result in potential disturbance or loss of Swainson’s hawk and their habitat.
Mitigation Measure 4.4-1a: Preconstruction Surveys for Swainson’s Hawk. If Project-related construction or decommissioning activities are planned to occur during the nesting period (March 1 to September 15), the Applicant shall engage a qualified biologist to conduct preconstruction surveys for Swainson’s hawk and their nests no more than 14 days before the start of construction or decommissioning activities within 0.25 mile of the Project site where access is available. Survey results shall be submitted to CDFG at least three days prior to the start of construction or decommissioning activities. If active nests are not identified, no further action is required and construction/decommissioning may proceed. If active nests are identified, the Applicant shall consult with CDFG to develop and implement suitable avoidance measures, consistent with the Staff Report Regarding Mitigation for Impacts to Swainson’s Hawks in the Central Valley of California (CDFG, 1994). To avoid impacting breeding efforts, no construction or decommissioning activities shall occur between March 1 and September 15 within 500 feet of an active nest that could cause nest abandonment or forced fledging. These buffers may be reduced in consultation with CDFG. Depending on conditions specific to each active nest, and the relative location and rate of construction or decommissioning activities, it may be feasible for such activities to occur as planned within the buffer without impacting the breeding effort. In this case (to be determined in consultation with CDFG), the nest(s) shall be monitored by a qualified biologist during construction or decommissioning within the buffer. The monitor shall have “stop work” authority. If, in the professional opinion of the monitor Project activities are negatively affecting the nesting behavior of the bird, the monitor shall stop all such activities within the designated buffer. Construction or decommissioning activities shall not resume until either the monitor has determined that the young have fledged the nest or as otherwise approved by CDFG. With CDFG concurrence, construction activities that are initiated outside the nesting season may continue even if raptors choose to nest within 500 feet of work activities. Thus, work may continue without delay if surveys verify the local absence of nesting raptors, or if construction begins outside the nesting period (September 16 to February 28).
The Applicant shall submit a resume to MID for approval of the qualified biologist. The qualified biologist shall conduct and document the surveys as described in the measure; documentation shall be submitted to CDFG and MID. Consultation with CDFG, if required, shall be documented by the Applicant and submitted to MID. If active nests are identified, the qualified biologist shall establish the buffer zones as described in the measure or as modified by CDFG.
If active nests are identified, the qualified biologist shall monitor the buffer zones as described in the measure or as modified by CDFG.
During construction and decommissioning.

10. Mitigation Monitoring Plan
TABLE 10-1 (Continued) MITIGATION MONITORING PLAN FOR THE McHENRY SOLAR FARM PROJECT
McHenry Solar Farm 10-6 May 2011 Draft Environmental Impact Report
Environmental Impact Mitigation Measures Proposed in this EIR Implementing Actions Monitoring/Reporting Requirements Timing
Biological Resources (cont.)
Impact 4.4-1 (cont.) Mitigation Measure 4.4-1b: Reduce Construction Noise Levels. If it appears that noise or vibration from vibratory post driving associated with Project construction (or other similar noise-generating construction or decommissioning activity) could affect nesting Swainson’s hawks that arrive after the start of construction, specific measures, including but not limited to use of noise dissipaters, shall be implemented to reduce noise levels. During post driving, a noise level of no greater than 85 decibels (measured at the nest) shall be used as general guidance for nests that are established after construction.
If construction (and, subsequently, decommissioning) activities are initiated prior to March 1, and a Swainson’s hawk nest is subsequently established within 500 feet of work activities, the Applicant shall implement noise reduction measures as described in the measure.
If active nests are established, the Applicant shall document that noise levels at the nest are no greater than 85 decibels, and shall submit the documentation to MID.
During construction and decommissioning.
Impact 4.4-2: MID activities could result in potential disturbance or loss of Swainson’s hawk and their habitat.
Mitigation Measure 4.4-2: Avian-safe Transmission Line (MID). Transmission poles should be designed using criteria identified in Avian Power Line Interaction Committee (APLIC, 2006).
MID shall implement the measure as described.
MID shall follow the monitoring and reporting requirements in the 2006 PEIR Update.
Design and construction of the sub-transmission line for Project interconnection.
Impact 4.4-3: Project activities could impact other tree-nesting raptors and/or protected nesting migratory birds.
Mitigation Measure 4.4-3: Preconstruction Raptor Surveys (Applicant). If Project-related construction and/or decommissioning activities are to occur during the breeding period for nesting raptors and/or protected nesting migratory birds (February 1 through August 31), the Applicant shall engage a qualified biologist to conduct preconstruction surveys of all potential habitat within 500 feet of the Project site no more than 14 days prior to the start of construction or decommissioning activities. If active nests are not identified, no further action is necessary. If active nests are identified during preconstruction surveys, a no-disturbance buffer shall be created around active raptor nests and nests of other special-status birds during the breeding season, or until it is determined by the qualified biologist that all young have fledged. Typical buffers are 500 feet for raptors and 250 feet for other nesting birds (e.g., waterfowl, and passerine birds). The size of these buffer zones and types of construction or decommissioning activities allowed in these areas could be further modified in coordination with CDFG and shall be based on existing noise and disturbance levels in the Project area.
The Applicant shall submit a resume to MID for approval of the qualified biologist. The qualified biologist shall conduct and document the surveys as described in the measure; documentation shall be submitted to MID. Consultation with CDFG, if required, shall be documented by the Applicant and submitted to MID. If active nests are identified, the qualified biologist shall establish the buffer zones as described in the measure or as modified by CDFG.
If active nests are identified, the qualified biologist shall monitor the buffer zones as described in the measure or as modified by CDFG.
During construction and decommissioning.

10. Mitigation Monitoring Plan
TABLE 10-1 (Continued) MITIGATION MONITORING PLAN FOR THE McHENRY SOLAR FARM PROJECT
McHenry Solar Farm 10-7 May 2011 Draft Environmental Impact Report
Environmental Impact Mitigation Measures Proposed in this EIR Implementing Actions Monitoring/Reporting Requirements Timing
Biological Resources (cont.)
Impact 4.4-4: Project activities could result in potential disturbance or loss of burrowing owls and their habitat.
Mitigation Measure 4.4-4a: Preconstruction Burrowing Owl Surveys (Applicant). The Applicant shall engage a qualified biologist to conduct preconstruction surveys for burrowing owls 14 to 30 days prior to the start of construction or decommissioning, using the most current CDFG protocol. Surveys shall cover grassland areas within a 500-foot buffer from all Project construction/decommissioning activities that are within suitable grasslands habitat, including checking for adult and juvenile burrowing owls and owl nests. If owls are detected during surveys, occupied burrows shall not be disturbed. Construction/decommissioning exclusion areas (e.g., orange exclusion fence or signage) shall be established around the occupied burrows, where no disturbance shall be allowed. During the nonbreeding season (September 1 through January 31), the exclusion zone shall extend 160 feet around occupied burrows. During the breeding season (February 1 through August 31), exclusion areas shall extend 250 feet around occupied burrows. If the above requirements cannot be met, passive relocation of on-site owls may be implemented as an alternative, but only during the nonbreeding season and only with prior CDFG approval. Passive relocation shall be accomplished by installing one-way doors on the entrances of burrows located within 160 feet of the Project area. The one-way doors shall be left in place for 48 hours to ensure the owls have left the burrow. The burrows shall then be excavated with a qualified biologist present. Construction/ decommissioning shall not proceed until the Project area is deemed free of owls by the qualified biologist.
The Applicant shall submit a resume to MID for approval of the qualified biologist. The qualified biologist shall conduct and document the surveys as described in the measure; documentation shall be submitted to CDFG and MID. Consultation with CDFG, if required, shall be documented by the Applicant and submitted to MID. If active burrows are identified, the qualified biologist shall establish the exclusion zones as described in the measure or as modified by CDFG. If passive relocation is required, the Applicant shall obtain approval from CDFG and hall submit documentation of that approval to MID.
If active burrows are identified, the qualified biologist shall monitor the exclusion zones as described in the measure or as modified by CDFG. If passive relocation is approved by CDFG, the qualified biologist shall conduct and document the relocation, and shall submit that documentation to CDFG and MID.
During construction and decommissioning.
Mitigation Measure 4.4-4b: Preconstruction Burrowing Owl Surveys (MID). Prior to construction, MID shall conduct pre-construction surveys for burrowing owl for the sub-transmission/distribution line and fiber optic cable alignment. These surveys shall be conducted using the most up-to-date CDFG published protocols (e.g., CDFG's 1995 Staff Report on Burrowing Owl Mitigation). If owls are detected during surveys, occupied burrows shall not be disturbed.
MID shall implement the measure as described.
MID shall follow the monitoring and reporting requirements in the 2006 PEIR Update.
Construction and decommissioning of the sub-transmission/distribution line and construction of the fiber optic cable.

10. Mitigation Monitoring Plan
TABLE 10-1 (Continued) MITIGATION MONITORING PLAN FOR THE McHENRY SOLAR FARM PROJECT
McHenry Solar Farm 10-8 May 2011 Draft Environmental Impact Report
Environmental Impact Mitigation Measures Proposed in this EIR Implementing Actions Monitoring/Reporting Requirements Timing
Cultural and Paleontological Resources
Impact 4.5-1: The proposed Project could potentially cause an adverse change in the significance of a unique archaeological resource pursuant to §15064.5.
Mitigation Measure 4.5-1: If Cultural Resources are Discovered During Ground-Disturbing Activities, Suspend Work until Resource is Evaluated. Prior to the initiation of site preparation or start of construction (and, subsequently, decommissioning), the Applicant shall retain a qualified professional archaeologist to complete an archaeological resources training program for construction workers involved in grading and excavation activities. Training shall include awareness and recognition of archaeological materials and the procedures to follow if construction crews encounter such materials in the course of earthwork, excavation, or grading. If archaeological resources are encountered, all activity within 50 feet of the find shall cease until it can be evaluated by a qualified archaeologist. Prehistoric archaeological materials could include obsidian and chert flaked-stone tools (e.g., projectile points, knives, scrapers) or toolmaking debris; culturally darkened soil (“midden”) containing heat-affected rocks, artifacts, or shellfish remains; and stone milling equipment (e.g., mortars, pestles, handstones, or milling slabs); and battered stone tools, such as hammerstones and pitted stones. Historic-period materials could include stone, concrete, or adobe footings and walls; filled wells or privies; and deposits of metal, glass, and/or ceramic refuse. The archaeologist shall notify the Applicant and MID if the resource may be significant. An appropriate treatment plan for the resources shall then be developed by the Applicant for approval by MID. The archaeologist shall consult with Native American representatives in determining appropriate treatment for prehistoric or Native American cultural resources, if discovered. In considering any suggested mitigation proposed by the archaeologist, the Applicant and MID shall determine whether avoidance is feasible in light of factors such as the nature of the find, project design, costs, and other considerations. If avoidance is not feasible, other appropriate measures (e.g., data recovery) shall be instituted. Work may proceed in other parts of the Project site while mitigation for cultural resources in other areas of the site is being carried out.
The Applicant shall submit a resume to MID for approval of the qualified professional archaeologist. The qualified professional archaeologist shall conduct the training program as described in the measure. If cultural resources are discovered during construction or decommissioning, the professional archaeologist shall implement the actions as described in the measure.
The Applicant shall submit documentation of the training program to MID. If cultural resources are discovered during construction or decommissioning, the Applicant shall provide MID with documentation of the actions taken to avoid or mitigate.
During construction and decommissioning.

10. Mitigation Monitoring Plan
TABLE 10-1 (Continued) MITIGATION MONITORING PLAN FOR THE McHENRY SOLAR FARM PROJECT
McHenry Solar Farm 10-9 May 2011 Draft Environmental Impact Report
Environmental Impact Mitigation Measures Proposed in this EIR Implementing Actions Monitoring/Reporting Requirements Timing
Cultural and Paleontological Resources (cont.)
Impact 4.5-2: The proposed Project could potentially destroy a unique paleontological resource or site or unique geologic feature.
Mitigation Measure 4.5-2: If Paleontological Resources are Discovered During Ground-Disturbing Activities, Suspend Work until Resource is Evaluated. Prior to the initiation of site preparation or start of construction (and, subsequently, decommissioning), the Applicant shall retain a qualified professional paleontologist or a California Registered Professional Geologist (California RPG) with appropriate paleontological expertise, as defined by the Society of Vertebrate Paleontology’s Conformable Impact Mitigation Guidelines Committee (SVP 1995 Guidelines), to carry out a paleontological resources training program for construction workers involved in grading and excavation activities. Training shall include awareness and recognition of potential fossil materials and the procedures to follow if construction crews encounter fossil materials in the course of earthwork, excavation, or grading. If construction crews discover potential fossils, all earthwork or other types of ground disturbance within 50 feet of the find shall stop immediately until the qualified professional paleontologist can assess the nature and importance of the find. Based on the scientific value or uniqueness of the find, the monitor may record the find and allow work to continue, or recommend salvage and recovery of the fossil. The Applicant shall require the paleontologist to be “on-call” throughout the duration of ground-disturbing activities.
The Applicant shall submit a resume to MID for approval of the qualified professional paleontologist. The qualified professional paleontologist shall conduct the training program as described in the measure. If fossil materials are discovered during construction or decommissioning, the professional paleontologist shall implement the actions as described in the measure.
The Applicant shall submit documentation of the training program to MID. If fossil materials are discovered during construction or decommissioning, the Applicant shall provide MID with documentation of the actions taken to avoid or mitigate.
During construction and decommissioning.
Impact 4.5-3: The proposed Project could potentially disturb human remains, including those interred outside of formal cemeteries.
Mitigation Measure 4.5-3: Halt Work if Human Remains are Identified During Construction. If human remains are uncovered during Project construction (and, subsequently, decommissioning), work shall immediately halt within 100 feet of the find. The Applicant shall contact the Stanislaus County Coroner to evaluate the remains and shall follow the procedures and protocols set forth in §15064.5(e)(1) of the CEQA Guidelines. If the County Coroner determines that the remains are Native American, the Applicant shall contact the Native American Heritage Commission, in accordance with Health and Safety Code Section 7050.5, subdivision (c), and Public Resources Code 5097.98 (as amended by AB 2641). The Native American Heritage Commission will then designate a Most Likely Descendent, who will provide recommendations as to the future disposition of the remains.
MID and the Applicant shall implement the measure as described for their respective portions of the Project.
If human remains are discovered, MID and the Applicant shall document the actions taken, including contact with the County Coroner and, if necessary, the NAHC.
During construction and decommissioning.

10. Mitigation Monitoring Plan
TABLE 10-1 (Continued) MITIGATION MONITORING PLAN FOR THE McHENRY SOLAR FARM PROJECT
McHenry Solar Farm 10-10 May 2011 Draft Environmental Impact Report
Environmental Impact Mitigation Measures Proposed in this EIR Implementing Actions Monitoring/Reporting Requirements Timing
Energy Conservation
No mitigation required.
Geology and Soils
No mitigation required.
Greenhouse Gas Emissions
Impact 4.8-2: The Project could conflict with CARB’s Climate Change Scoping Plan.
Mitigation Measure 4.8-2: Low SF6 Leak Rate Circuit Breaker and Monitoring. The Applicant shall ensure that the circuit breaker installed at the proposed new substation has a guaranteed SF6 annual leak rate of no more than 0.5 percent by volume. The Applicant shall provide MID with documentation of compliance, such as specification sheets, prior to installation of the circuit breaker. In addition, the Applicant shall monitor the SF6-containing circuit breaker at the substation consistent with Scoping Plan Measure H-6 for the detection and repair of leaks.
The Applicant shall implement the measure as described.
The Applicant shall provide MID with documentation of compliance, such as specification sheets, prior to installation of the circuit breaker. The Applicant shall monitor the SF6-containing circuit breaker at the substation as described in the measure.
Prior to installation of the circuit breaker (documentation). Life of the project (leak monitoring).
Hazards and Hazardous Materials
Impact 4.9-2: The Project could result in an accidental spill or leak during construction or decommissioning that could release hazardous materials into the environment.
Mitigation Measure 4.9-2: Accidental Spill Prevention and Response Plan. The Applicant shall prepare an Accidental Spill Prevention and Response Plan for construction and decommissioning activities for review and approval by MID. The Plan shall identify measures to prevent accidental spills from leaving the site and methods for responding to and cleaning up spills to limit the amount of materials released into the environment. Such measures shall include, but not be limited to, ensuring that absorbent material, tarps, storage drums, and other emergency spill supplies and equipment are kept at the Project site at all times.
The Applicant shall implement the measure as described.
The Applicant-assigned environmental monitor shall observe construction (and, subsequently, decommissioning) activities for compliance with the approved Plan.
During construction and decommissioning.
Hydrology and Water Quality
No mitigation required.
Land Use and Planning
No mitigation required.

10. Mitigation Monitoring Plan
TABLE 10-1 (Continued) MITIGATION MONITORING PLAN FOR THE McHENRY SOLAR FARM PROJECT
McHenry Solar Farm 10-11 May 2011 Draft Environmental Impact Report
Environmental Impact Mitigation Measures Proposed in this EIR Implementing Actions Monitoring/Reporting Requirements Timing
Mineral Resources
No mitigation required.
Noise
No mitigation required.
Population and Housing
No mitigation required.
Public Services
No mitigation required.
Recreation
No mitigation required.
Transportation/Traffic
Impact 4.17-1: Project construction and decommissioning activities could intermittently and temporarily increase traffic congestion due to vehicle trips generated by construction workers and construction vehicles on area roadways.
Mitigation Measure 4.17-1a: MID Traffic Control Measures. During construction and decommissioning of the sub-transmission and distribution lines and fiber optic cable, MID shall implement the following traffic mitigation measures from the 2006 PEIR Update (2006 PEIR Update; p. 10-6): 1. MID will coordinate design and construction of program
facilities with the agencies with jurisdiction, including Caltrans, counties, cities, special districts, other utilities and the FAA, as required.
2. MID will obtain any necessary encroachment permits, inspections or other approvals from agencies with jurisdiction.
2A. MID will obtain any necessary approvals and inspections from agencies with jurisdiction.
2B. MID shall coordinate the design and construction and shall obtain any necessary permits from the County, City or State prior to placing any facilities within the public road rights-of-way of those agencies and shall conform to applicable conditions in the encroachment permit.
MID shall implement the measure as described.
MID shall follow the monitoring and reporting requirements in the 2006 PEIR Update.
Construction and decommissioning of the sub-transmission/distribution line and construction of the fiber optic cable.

10. Mitigation Monitoring Plan
TABLE 10-1 (Continued) MITIGATION MONITORING PLAN FOR THE McHENRY SOLAR FARM PROJECT
McHenry Solar Farm 10-12 May 2011 Draft Environmental Impact Report
Environmental Impact Mitigation Measures Proposed in this EIR Implementing Actions Monitoring/Reporting Requirements Timing
Transportation/Traffic (cont.)
Impact 4.17-1 (cont.) 3. MID will utilize all necessary precautions to minimize safety concerns when working within public road rights-of-way. Traffic safety cones, construction signage or other measures will be used to alert drivers to construction activities.
4. Electrical facilities placed within public rights-of-way will comply with applicable standards for avoiding hazards to drivers, pedestrians and bicyclists.
Mitigation Measure 4.17-1b: Applicant Construction Traffic Management and Safety Plan. Prior to the start of construction (and, subsequently, decommissioning) of the Project, the Applicant shall prepare and implement a Traffic Management and Safety Plan that shall reduce or eliminate impacts associated with the Project. The Plan shall adhere to Stanislaus County and Caltrans requirements, and shall include, at a minimum, the following elements: a) Schedule Project-generated construction truck trips on SR 99,
SR 108, and SR 219 outside the peak morning and evening commute hours to reduce potential traffic congestion and reduce potential for transit delays during these peak commute periods.
b) Comply with transportation permit requirements of Caltrans and CHP when scheduling Project-generated construction truck trips carrying oversized loads. In addition, provide pre-notification to local police, fire, and emergency service providers of the timing, location, and duration of construction activities that could affect the movement of emergency vehicles on area roadways.
c) Place signs (e.g., “Slow Trucks”, and/or “Trucks Turning Ahead”) along appropriate roads to notify drivers of construction traffic throughout the duration of the construction period.
The Applicant shall implement the measure as described.
The Applicant-assigned environmental monitor shall observe construction (and, subsequently, decommissioning) activities for compliance with the approved Plan.
During construction and decommissioning.
Impact 4.17-3: Project construction and decommissioning activities could increase traffic hazards due to large trucks entering and exiting the Project site.
Mitigation Measure 4.17-3: Implement Mitigation Measures 4.17-1a and 4.17-1b.
See Mitigation Measures 4.17-1a and 4.17-1b.
See Mitigation Measures 4.17-1a and 4.17-1b.
See Mitigation Measures 4.17-1a and 4.17-1b.

10. Mitigation Monitoring Plan
TABLE 10-1 (Continued) MITIGATION MONITORING PLAN FOR THE McHENRY SOLAR FARM PROJECT
McHenry Solar Farm 10-13 May 2011 Draft Environmental Impact Report
Environmental Impact Mitigation Measures Proposed in this EIR Implementing Actions Monitoring/Reporting Requirements Timing
Transportation/Traffic (cont.)
Impact 4.17-4: The Project could result in inadequate emergency access.
Mitigation Measure 4.17-4: Develop an Emergency Access Plan for the Site. The Applicant shall develop and implement an Emergency Access Plan, which shall include evacuation routes and strategies to ensure accessibility and mobility for project area and emergency vehicles. Additional measures include developing an emergency action plan that identifies roles and responsibilities during emergencies and to update the plan regularly.
The Applicant shall implement the measure as described.
The Applicant-assigned environmental monitor shall observe construction (and, subsequently, decommissioning) activities for compliance with the approved Plan.
During construction, operation and maintenance, and decommissioning.
Utilities and Service Systems
No mitigation required.
McHenry Solar Farm A-1 May 2011 Draft Environmental Impact Report
APPENDIX A Scoping Report

THIS PAGE INTENTIONALLY LEFT BLANK
A-2

MCHENRY SOLAR FARM PROJECT Scoping Report
Prepared for February 2011Modesto Irrigation District
A-3

THIS PAGE INTENTIONALLY LEFT BLANK
A-4
MCHENRY SOLAR FARM PROJECT Scoping Report
Prepared for February 2011Modesto Irrigation District
225 Bush Street Suite 1700 San Francisco, CA 94104 415.896.5900 www.esassoc.com
209517.01
A-5

THIS PAGE INTENTIONALLY LEFT BLANK
A-6

McHenry Solar Farm i ESA / 209517.01 Scoping Report February 2011
TABLE OF CONTENTS
Page
1. Introduction ............................................................................................................... 1
2. Description of the Project ........................................................................................ 1 Project Summary ........................................................................................................ 1 Project Location .......................................................................................................... 2
3. Opportunities for Public Comment ......................................................................... 2 Notification .................................................................................................................. 2
4. Summary of Scoping Comments ............................................................................. 3 Commenting Parties ................................................................................................... 3 Comments Received During the Scoping Process ..................................................... 4 General Comments..................................................................................................... 4
5. Consideration of Issues Raised in Scoping Process ............................................ 4
List of Tables
Table 1 Parties Submitting Comments During the McHenry Solar Farm Project EIR Scoping Process .......................................................................................... 3
Table 2 Comments Received During the McHenry Solar Farm Project EIR Scoping Process ................................................................................................. 5
Appendices
A. Notice of Preparation .............................................................................................. A-1 B. Scoping Period Written Comments ......................................................................... B-1
A-7

THIS PAGE INTENTIONALLY LEFT BLANK
A-8

McHenry Solar Farm 1 ESA / 209517.01 Scoping Report February 2011
SCOPING REPORT
1. Introduction This report provides an overview of the written comments received by the Modesto Irrigation District (MID) during the public scoping period for the Environmental Impact Report (EIR) that MID is preparing for Solar Star California VIII, LLC’s McHenry Solar Farm Project (Project).1
CEQA Guidelines Section 15083 provides that a “Lead Agency may…consult directly with any person…it believes will be concerned with the environmental effects of the project.” Scoping is the process of early consultation with affected agencies and the public prior to completion of a Draft EIR. Section 15083(a) states that scoping can be “helpful to agencies in identifying the range of actions, alternatives, mitigation measures, and significant effects to be analyzed in depth in an EIR and in eliminating from detailed study issues found not to be important.” Scoping is an effective way to bring together and consider the concerns of affected State, regional, and local agencies, the Project proponent, and other interested persons (CEQA Guidelines Section 15083(b)).
Scoping is not conducted to resolve differences concerning the merits of a project or to anticipate the ultimate decision on a proposal. Rather, the purpose of scoping is to help ensure that a comprehensive and focused EIR will be prepared that provides a firm basis for the decision-making process.
This report is intended for use by the public to have access to and understand the comments received during the scoping period. It includes written comments received during the scoping period from December 6, 2010 to January 5, 2011. MID will use this report as a tool to ensure the preparation of a comprehensive and focused EIR. Pursuant to CEQA Guidelines Section 15082, all public comments will be considered2 in the EIR process.
2. Description of the Project
The Project includes the construction and operation of a 25-megawatt alternating current (MWac)photovoltaic (PV) electricity generating facility that would deliver solar-generated power to MID’s sub-transmission and distribution system. As part of the Project, MID proposes to
1 The Modesto Irrigation District is the lead agency pursuant to the California Environmental Quality Act (CEQA)
for the preparation of an EIR for the Project. 2 Comments not within the scope of CEQA will not be addressed through the CEQA process.
A-9

Scoping Report
McHenry Solar Farm 2 ESA / 209517.01 Scoping Report February 2011
construct, own, and operate a switching station in a new switchyard to be located adjacent to the proposed on-site Project substation. The Project also includes a new overhead 69-kilovolt (kV) sub-transmission line and 12-kV distribution line that would interconnect the proposed solar facility to MID’s existing electric system by connecting to an existing 69-kV sub-transmission line and 12-kV distribution line.
The Project includes the following elements:
� Solar field of 25 1-MW power blocks
� Substation
� Operation and Maintenance (O&M) building
� Control building
� 69-kV electrical switchyard
� Approximately 1,500-foot-long, 69-kV double-circuit overhead sub-transmission line and 12-kV distribution line
� Approximately 7.5 miles of new overhead fiber optic cable
� Site improvements, including access roads, fencing, lighting, and landscaping
The proposed 157-acre Project site is located in northern unincorporated Stanislaus County between the City of Riverbank and community of Del Rio, along Patterson Road near the intersection of McHenry Avenue. It consists of APNs 074-002-021, -029, -030, and -031. A residence and associated buildings located on a portion of this land are not part of the Project site.
3. Opportunities for Public Comment
On December 6, 2010, MID published and distributed a Notice of Preparation (NOP) to advise interested local, regional, state, and federal agencies, as well as the public, that an EIR would be prepared for the Project. The NOP was sent to a mailing list that included 300 property owners within an area that included the properties within 0.25 mile of the Project site and the residential subdivision located to the northwest of the Project site (referred to as the Del Rio community); the Governor’s Office of Planning and Research; State Clearinghouse; eight local, State, and federal agencies; and the Stanislaus County Library. Of the 310 copies of the NOP that were distributed, two were returned as undeliverable by the U.S. Postal Service.
The NOP solicited written comments to be received during the 30-day comment period (ending January 5, 2011) that address potential environmental concerns resulting from implementation of the Project. The public was encouraged to submit their comments to MID by either U.S. mail or e-mail.
A-10

Scoping Report
McHenry Solar Farm 3 ESA / 209517.01 Scoping Report February 2011
Additionally, the NOP presented the description and location of the Project, potential issues to be addressed in the EIR, where to locate supporting documents, and the contact name for additional information regarding the Project. The NOP is presented in Appendix A.
4. Summary of Scoping Comments Written comments were collected throughout the public comment period, during which time 14 letters were received. Stanislaus County submitted an amended comment letter, which was received after the formal comment period ended. MID accepted the amended letter to clarify the agency’s previous position. Therefore, a total of 15 letters were received. Appendix B contains copies of the submitted written comments.
The following individuals and agencies submitted comments on the scope of the EIR. These comments are organized chronologically in Table 1.
TABLE 1 PARTIES SUBMITTING COMMENTS DURING
THE MCHENRY SOLAR FARM PROJECT EIR SCOPING PROCESS
Name Organization Letter
Number Date
Scott Morgan California Office of Planning and Research, State Clearinghouse and Planning Unit (OPR) 1 December 6, 2010
Vicki Jones Stanislaus County, Department of Environmental Resources, Solid Waste Management Division (SCSW) 2 December 14, 2010
Katy Sanchez Native American Heritage Commission (NAHC) 3 December 14, 2010
Rick Walker Al’s Furniture 4 December 15, 2010
Mark R. Jensen Jensen & Jensen Attorneys, representing Amerine Orchards 5 December 15, 2010
Brad Wall City of Modesto, Community and Economic Development, Planning Division 6 December 21, 2010
Jan W. Pritchard Modesto Rifle Club, Inc. (MRC) 7 December 22, 2010
David Warner San Joaquin Valley Air Pollution Control District (SJVAPCD) 8 December 29, 2010
Christine Almen Stanislaus County Environmental Review Committee, transmitting comments from the Stanislaus County Department of Public Works (SCPW)
9 January 3, 2011
Steve Sbragia Owner, Project Site 10 January 4, 2011
Dennis E. Wilson Horizon Consulting Services, representing two Del Rio residents 11 January 4, 2011
Tom Dumas California Department of Transportation (Caltrans) 12 January 5, 2011
Christine Almen Stanislaus County Environmental Review Committee 13 January 6, 2011
Christine Almen Stanislaus County Environmental Review Committee, transmitting comments from the Stanislaus County Department of Planning and Community Development (SCPCD)
14 January 6, 2011
Christine Almen Stanislaus County Environmental Review Committee,
transmitting comments from the Stanislaus County, Agricultural Commissioner’s Office (SCAC)
15 January 6, 2011
A-11

Scoping Report
McHenry Solar Farm 4 ESA / 209517.01 Scoping Report February 2011
Table 2 summarizes the comments received during the scoping period. For more detailed information, see Appendix B, which contains copies of the letters that were submitted during the scoping period. Table 2 also provides a description of where the comment will be addressed in the Draft EIR.
The following comments are not within the scope of CEQA and will not be analyzed in the EIR:
7-3: The Project should not adversely impact the value of the Modesto Rifle Club’s real property and facilities.
7-4: Commenter hopes the Project is the MID’s least-cost option for the acquisition of reliable electrical generating capacity and associated energy.
11-4: The checklist should consider the impact on housing values in the adjacent Del Rio community in addition to aesthetic quality and views. (Note: Aesthetic quality and views will be discussed in the Aesthetic section of the Draft EIR.)
These comments are noted and will be considered by MID in its evaluation of whether or not to approve the Project.
5. Consideration of Issues Raised in Scoping Process A primary purpose of this Scoping Report is to document the process of soliciting and identifying comments from interested agencies and the public. The Scoping Process provides the means by which MID can determine those issues that interested participants consider to be the principal areas for study and analysis. Every issue that has been raised during scoping that falls within the scope of CEQA will be addressed in the Draft EIR.
A-12

Scoping Report
McHenry Solar Farm 5 ESA / 209517.01 Scoping Report February 2011
TABLE 2 COMMENTS RECEIVED DURING THE MCHENRY SOLAR FARM PROJECT EIR SCOPING PROCESS
Letter Comment Number Comment Summary
Response to Comment, or Draft EIR section(s) in which comment is
addressed
1 1-1 Letter acknowledging receipt of Notice of Preparation by the Office of Planning and Research, State Clearinghouse and PlanningUnit (OPR) and request for review by responsible agencies.
Other
2 2-1 Commenter lists recommendations consistent with the Stanislaus County Source Reduction and Recycling Element that should be incorporated into the Project. (SCSW)
Project Description; Utilities
3 3-1 Commenter recommends contacting the appropriate Information Center for a record search; preparing a report detailing findingsand recommendations of an archaeological inventory survey (if required); contacting the NAHC for a Sacred Lands File Check and list of appropriated Native American Contacts for consultation; and notes that lack of surface evidence of archaeological resources does not preclude their subsurface existence. (NAHC)
Cultural Resources
4 4-1 Commenter inquires whether temperature around his building will increase as a result of the Project. (Walker) Air Quality
5 5-1 Commenter states that dust generated by the adjacent almond farm is likely to drift onto the Project site, thereby possibly decreasing the efficiency of the solar panels. This could result in the need for panel washing. (Amerine)
Utilities
5 5-2 Commenter notes that Stanislaus County has a right-to-farm ordinance that protects farming operations in the vicinity of theProject. (Amerine)
Agriculture and Forest Resources
6 6-1 Commenter states the Project is located in the City of Modesto’s Sphere of Influence and General Plan boundary. (City of Modesto)
Land Use
6 6-2 Commenter states support for development of clean energy projects such as the proposed solar farm, which will help improve air quality and reduce greenhouse gas emissions. (City of Modesto)
Air Quality; GHG Emissions
6 6-3 Commenter states preference that power lines be undergrounded in order to enhance public safety and aesthetics. (City of Modesto)
Aesthetics; Alternatives
6 6-4 Commenter recommends the solar farm be screened with landscaping around the perimeter of the site. (City of Modesto) Project Description; Aesthetics
7 7-1 Commenter states the Project should not adversely impact the beneficial uses of MRC’s real property and facilities. (MRC) Recreation
7 7-2 Commenter states the Project should not adversely impact the operation of any communication equipment located on MRC property. (MRC)
Project Description; Utilities
7 7-3 Commenter states the Project should not adversely impact the value of MRC’s real property and facilities. Other
7 7-4 Commenter hopes the Project is the MID’s least-cost option for the acquisition of reliable electrical generating capacity and associated energy. (MRC)
Other
8 8-1 Commenter states the environmental review of the Project’s potential impact on air quality should include the identification and quantification of project-related emissions. The review should include discussion of components and phases of the Project and the associated emission projections (including ongoing emissions from each previous phase). (SJVAPCD)
Air Quality
8 8-2 Commenter states equipment exhaust as well as fugitive dust emissions should be quantified. Project-related short-term (construction) impacts should be considered significant if, with the implementation of mitigation measures, emissions exceed 10 tons per year of NOx, 10 tons per year of ROG, or 15 tons per year of PM10. (SJVAPCD)
Air Quality
A-13

Scoping Report
TABLE 2 (Continued) COMMENTS RECEIVED DURING THE MCHENRY SOLAR FARM PROJECT EIR SCOPING PROCESS
McHenry Solar Farm 6 ESA / 209517.01 Scoping Report February 2011
Letter Comment Number Comment Summary
Response to Comment, or Draft EIR section(s) in which comment is
addressed
8 8-3 Commenter states emissions from permitted (stationary) sources and non-permitted (mobile) sources should be analyzed separately. Project-related long-term (operational) impacts should be considered significant if, with implementation of mitigationmeasures, emissions exceed 10 tons per year of NOx, 10 tons per year of ROG, or 15 tons per year of PM10. (SJVAPCD)
Air Quality
8 8-4 Commenter states diesel truck emissions are a source of toxic air contaminants (TACs) that are known to have a potential healthimpact on sensitive receptors. The SJVAPCD recommends the Project be evaluated for potential health impacts to nearby sensitive receptors. The SJVAPCD recommends that a health risk screening analysis be conducted to determine if a health risk assessment (HRA) is necessary. If the screening analysis indicates that the risk is equal to or greater than 10 in one million, the SJVAPCD recommends either preparation of a detailed HRA or incorporation of mitigation measures to reduce impacts to less than significant. (SJVAPCD)
Air Quality
8 8-5 Commenter states the environmental review of air quality impacts should include a discussion of mitigation measures, if any, that are incorporated into the Project to reduce emissions. (SJVAPCD)
Project Description; Air Quality
8 8-6 Commenter states that, based on information provided, the Project meets the applicability threshold within District Rule 9510(Indirect Source Review) of 9,000 square feet of other land uses. Therefore, per Section 2.1 of the rule, the SJVAPCD concludesthe Project is subject to District Rule 9510. Any applicant subject to District Rule 9510 is required to submit an Air Impact Assessment (AIA) application to the SJVAPCD no later than applying for final discretionary approval, and to pay any applicable off-site mitigation fees before issuance of the first grading/building permit. If approval of the Project constitutes the last discretionary approval, the SJVAPCD recommends that demonstration of compliance with District Rule 9510, including payment of applicable fees before issuance of the first grading/building permit, be made a condition of project approval. (SJVAPCD)
Air Quality; Appendix B
8 8-7 Commenter states the Project may be subject to SJVAPCD rules and regulations including, but not limited to: Regulation VIII(Fugitive PM10 Prohibitions), Rule 4102 (Nuisance), Rule 4601 (Architectural Coatings), and Rule 4641 (Cutback, Slow Cure, and Emulsified Asphalt, Paving and Maintenance Operations). The Project may also require SJVAPCD permits. The Project may also require approval of an Authority to Construct (ATC). (SJVAPCD)
Air Quality Appendix B
9 9-1 Commenter states the Stanislaus Environmental Review Committee has reviewed the Project and determined it will not have asignificant effect on the environment.
Other
9 9-2 Commenter states grading and drainage of the Project site could affect Stanislaus County road right-of-way. Best ManagementPractices should be considered to minimize changes to the existing drainage patterns and the amount of tracking by vehicles on County and State roads. (SCPW)
Hydrology
9 9-3 Commenter states potential location of driveways is a concern. The locations could affect traffic flow due to the Project location near the intersection of Patterson Road and McHenry Avenue. Stanislaus County will approve the location of proposed driveway(s) for the Project. Other requirements will be considered when the application is made with Stanislaus County Planningfor a conditional use permit. (SCPW)
Transportation
10 10-1 Commenter notes that MID does not currently have legal right to use or possess any portion of the property for a switchyard or for any other purpose. However, the commenter and the Project Applicant have negotiated the terms and conditions under which MID will have the right to establish a switching station on the property, and the parties expect to have the matter finalized within30-60 days of January 4, 2011. (Sbragia)
Project Description
11 11-1 Commenter states they are strongly opposed to the Project in the proposed location. (Horizon) Alternatives
A-14

Scoping Report
TABLE 2 (Continued) COMMENTS RECEIVED DURING THE MCHENRY SOLAR FARM PROJECT EIR SCOPING PROCESS
McHenry Solar Farm 7 ESA / 209132.01 Scoping Report February 2011
Letter Comment Number Comment Summary
Response to Comment, or Draft EIR section(s) in which comment is
addressed
11 11-2 Commenter states the site is composed of the some of the best agricultural land in the area, primarily Class I soils. Therefore, it would appear that the loss of prime farmland cannot be mitigated. Commenter requests that the Project Applicant be required to purchase an equal amount of prime agricultural land to replace this loss. Commenter views the proposal in the same light as a residential project, which would be required to replace the loss of prime farmland. (Horizon)
Agriculture and Forest Resources
11 11-3 Commenter inquiries what happens to this eyesore when solar technology becomes obsolete or the solar panels are no longerproductive? Will the site be cleared and returned to agriculture? (Horizon)
Project Description; Aesthetics; Agriculture and Forest Resources
11 11-4 Commenter states the checklist should consider the impact on housing values in the adjacent Del Rio community in addition to aesthetic quality and views. (Horizon)
Aesthetics; Other
11 11-5 Commenter requests that other suitable locations (such as industrially zoned land) be discussed under the no project alternative.(Horizon)
Alternatives
11 11-6 Commenter inquires why MID is the lead agency for the Project? Commenter states Stanislaus County should be the lead agency. (Horizon)
Executive Summary
12 12-1 Commenter states Caltrans has responsibility for maintenance and operation of state and interstate highways within California.Any proposals that would affect the State Highway System are of concern to Caltrans. (Caltrans)
Transportation
12 12-2 Commenter states the Project Applicant should consult with District 10 Landscape Architecture and Traffic Operations/Safety to ensure that the project design minimizes visual impacts and does not compromise safety of motorists due to glare. (Caltrans)
Aesthetics
12 12-3 Commenter states the NOP identifies several activities that may require issuance of Encroachment Permits by Caltrans, including construction or alteration of transmission lines and access roads. As defined in CEQA Section 21069, Caltrans would act as a Responsible Agency for projects requiring an Encroachment Permit. An application for an Encroachment Permit must include appropriate environmental studies and a copy of the environmental document adopted by the Lead Agency. The EIR should identify any need for an Encroachment Permit from Caltrans for the Project. (Caltrans)
Transportation Appendix B
12 12-4 Commenter states the EIR should identify any cultural resources, biological resources, hazardous waste locations, and otherresources within Caltrans right-of-way and include analysis of potential impacts to those resources. Appropriate avoidance, minimization, and mitigation measures should be identified in the EIR. (Caltrans)
Biological Resources; Cultural Resources; Hazards and Hazardous Materials
13 13-1 Commenter states the Stanislaus Environmental Review Committee has reviewed the Project and determined it may have a significant effect on the environment.
Other
14 14-1 Commenter states the Project will require a Use Permit Application for project approval. Commenter agrees with MID’s determination that MID is the Lead Agency for the Project under CEQA. (SCPCD)
Appendix B
15 15-1 Commenter states the Project may have a significant effect on the environment as it takes prime farmland out of currentagricultural production. Agricultural buffers need to be considered and implemented as appropriate. Commenter states there are other areas in the County that are less agriculturally viable and more suited for this type of land use. (SCAC)
Agriculture and Forest Resources
A-15

THIS PAGE INTENTIONALLY LEFT BLANK
A-16

Scoping Report
McHenry Solar Farm A-1 ESA / 209517.01 Scoping Report February 2011
APPENDIX A
A-17

THIS PAGE INTENTIONALLY LEFT BLANK
A-2
A-18

A-3
A-19

A-4
A-20

A-5
A-21

A-6
A-22

A-7
A-23

THIS PAGE INTENTIONALLY LEFT BLANK
A-24

Scoping Report
McHenry Solar Farm B-1 ESA / 209517.01 Scoping Report February 2011
APPENDIX B
A-25

THIS PAGE INTENTIONALLY LEFT BLANK
B-2
A-26

Comment Letter 1
1-1
B-3
A-27

Comment Letter 1
B-4
A-28

Com
ment Letter 1
B-5
A-29

Comment Letter 2
2-1
B-6
A-30

Comment Letter 2
B-7
A-31

Comment Letter 2
B-8
A-32

Comment Letter 3
3-1
B-9
A-33

Comment Letter 3
B-10
A-34

�
Janna Scott
�
����������������� �������������������������������� ��������������� ��!"�"�#�"#�$������%���&���&��%�� ��%������'������('!�����%)�*�����+����)�$�,�������� ,�-�.�����-���������� ���/��+����0���� Mr. Walker, Thank you very much for your comment. We appreciate your input of any comments or questions regarding the evaluation of this project and will consider your question in the evaluation of the environmental impacts of the McHenry Solar Farm Project. We will also add your question to the administrative record in this process. There will also be future opportunities for the public to provide input in the environmental review process for this project. However, if you should have additional comments or questions at this time please feel free to contact me. Cordially, ������������ ����������������������� ������������������� ������������� ��������� �!"#"$ %�&�'$�!(�"$�)*"!" +��&�'$�!(�"$�)*"*" ������,-�����
���������&���&�����������.�&�� #� ��1������������������� ��������������� ��!"�"�!��2�$����������������� ������ ��3���+����0���
���������&���&�����������.�&�� #� ��1������������������� ��������������� ��!"�"��� "�$������%������������1%������ ��+����0��� Since I am the closest one to the farm,, I do have a question…Has there been any studies done about how much HEAT it draws…In other words will the temperature around my building go up because of the FARM?????Rick Walker Owner Al’s Furniture
Comment Letter 4
4-1
B-11
A-35
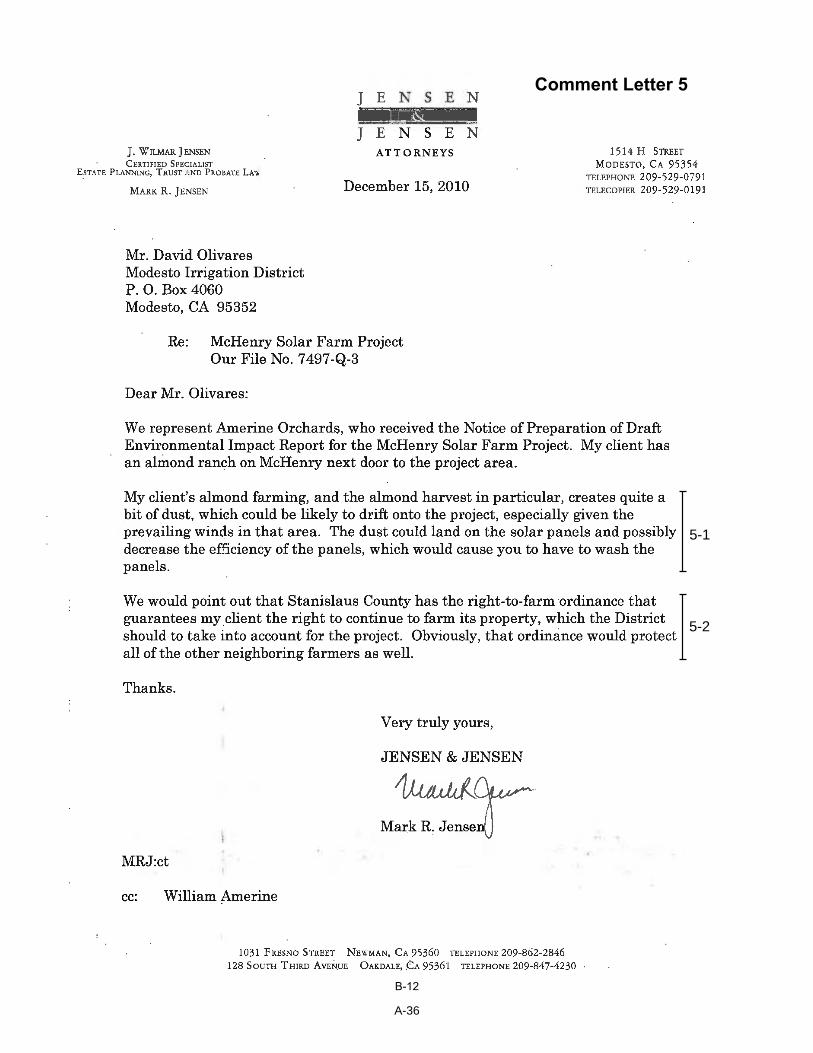
Comment Letter 5
5-1
5-2
B-12
A-36

Comment Letter 6
6-1
6-2
6-36-4
B-13
A-37

Comment Letter 7
B-14
A-38

Comment Letter 7
7-1
7-2
7-3
7-4
B-15
A-39

Comment Letter 8
8-1
8-2
B-16
A-40

Comment Letter 8
8-2cont.
8-3
8-4
8-5
8-6
B-17
A-41

Comment Letter 8
8-6cont.
8-7
B-18
A-42

Comment Letter 9
9-1
B-19
A-43

Comment Letter 9
9-2
9-3
B-20
A-44

Comment Letter 9
B-21
A-45

Comment Letter 10
10-1
B-22
A-46

Comment Letter 11
11-1
11-2
11-3
11-4
11-5
11-6
B-23
A-47

Comment Letter 11
11-6cont.
B-24
A-48

Comment Letter 12
12-1
12-2
12-3
12-4
B-25
A-49

Comment Letter 12
12-4
B-26
A-50

Comment Letters 13, 14 and 15
14-1
13-1
B-27
A-51

Comment Letters 13, 14 and 15
15-1
B-28
A-52

McHenry Solar Farm B-1 May 2011 Draft Environmental Impact Report
APPENDIX B Air Resources

THIS PAGE INTENTIONALLY LEFT BLANK
B-2

CONSTRUCTION
ROG NOx CO PM10 PM2.5
Onsite Construction Equipment 0.28 2.32 1.09 0.12 0.11
Light-Duty and Heavy-Duty Trucks 0.24 1.02 3.75 0.06 0.05
Fugitive Dust --- --- --- 5.81 0.93
Total (tons/year) 0.52 3.34 4.84 5.99 1.09
SJVAPCD Significance Threshold 10 10 NA 15 15
Construction Activity CO2 CH4 N2O CO2e
Onsite Construction Equipment 296.4 0.0 0.0 299.2
Light-Duty and Heavy-Duty Trucks 531.0 0.0 0.0 541.9
Water Use - Indirect Emissions -1.1 0.0 0.0 -1.1
Total 826.3 0.1 0.0 840.1
Emissions Source
Estimated Daily Construction Emissions (tons/year)
Estimated Total Emissions (metric tons/year)
B-3

OPERATIONS
Operational Source ROG NOx CO PM10 PM2.5
Worker Commutes 0.00 0.00 0.03 0.00 0.00
Total (tons/year) 0.00 0.00 0.03 0.00 0.00
SJVAPCD Significance Threshold 10 10 NA 15 15
Operational Source CO2 CH4 N20 CO2e
Worker Commutes 5 0 0 5
SF6 for 34.5 kV circuit breaker --- --- --- 3
Water Use - Indirect Emissions -1 0 0 -1
Energy Displaced From the Electrical Grid -19,693 -21 -65 -19,779
Total Net Emissions -19,772
Estimated Annual Operational Emissions (tons/year)
Estimated Total Emissions (metric tons/year)
B-4

Fugitive dust from Soil Disturbance
Emission Factor
(pounds/acre) 3
(acres/day) 1 days/year 2 PM10 PM10 PM2.5 4 PM10 PM2.5 4
3.8 84 20 76.0 15.8 3.2 0.7
1 It is assumed that up to 242,000 sf would be disturbed each day during the site preparation construction phase and 2 acres a day during the array construction period.
Average of 5.6 acres and 2 acres.2 Soil disturbed would occur during the site preparation (21 days) and the solar array construction phase (63 days).3
4
The Midwest Research Institute has derived a value of 0.11 tons/acre/month, which converts to 10 pounds per acre per day, assuming 22 workdays per month. The California Air Resources Board review has reviewed this factor and concluded that it represents PM10 emissions with watering. Consequently, ARB concludes that 20 pounds per acre day is more appropriate for unmitigated fugitive dust conditions (CARB, 2002; http://www.arb.ca.gov/ei/areasrc/fullpdf/full7-7.pdf)
Area Disturbed (pounds/day)
Emissions
(tons/year)
PM2.5 fractions for soil disturbance and earth moving were obtained from SCAQMD, 2006.
B-5

Unpaved Road Fugitive Dust from Trucks
(miles/day) days/year PM10 PM2.5 PM10 PM2.5 PM10 PM2.5
242 21 1.0 0.1 249.5 25.0 2.6 0.3
6
7 Based on AP-42 Emission Factor: E (lbs/VMT) = k (s/12)^a (W/3)^b
Where:
E = emission rate in pounds per vehicle mile traveled
k = particle size multiplier (assumed 1.5 lb/VMT for PM10 and 0.15 lb/VMT for PM2.5 per AP-42, Table 13.2.2-2)
a = 0.9
b = 0.45
s = silt content (assumed 8.5% for a construction site per AP-42, Table 13.2.2-1)
W = average weight (tons) of vehicles (assumed 2.6 tons; 98% small trucks weigh 2 tons, 2% heavy trucks weigh 30 tons)
2.0 0.6
PM10 PM2.5 PM10 PM2.5
Unmitigated = 325.5 40.8 5.8 0.9
(tons/year)
Emissions
Emissions
Total Fugitive Dust
Emission Factors
(pounds/VMT) 7 (pounds/day)VMT 6
(tons/year)
TOTAL
(pounds/day)
Assumes that there would be 24 light-duty trucks at the site that would each travel 10 miles and two delivery trucks that would each travel one mile on unpaved roads.
B-6

Construction Equipment Inventory
No. hrs/day days hrs No. hrs/day days hrs No. hrs/day days hrs No. hrs/day days hrs No. hrs/day days hrs No. hrs/day days hrsExcavators (168 hp) 1 8 21 168 0 0 0 0 0 0 0 0 0 0 0 0 1 8 5 40 0 0 0 0 208Graders (174 hp) 1 8 21 168 0 0 0 0 0 0 0 0 0 0 0 0 1 8 5 40 0 0 0 0 208Rollers (95 hp) 1 8 21 168 1 7 5 35 0 0 0 0 0 0 0 0 1 8 5 40 0 0 0 0 243Rubber Tired Loader (164 hp) 1 8 21 168 0 0 0 0 0 0 0 0 1 8 2 16 0 0 0 0 1 8 5 40 224Backhoes (108 hp) 1 8 21 168 1 7 5 35 1 8 64 512 1 8 2 16 1 8 5 40 0 0 0 0 771Cement Mixer (10 hp) 0 0 0 0 1 6 5 30 0 0 0 0 0 0 0 0 0 0 0 0 0 0 0 0 30Pavers (100 hp) 0 0 0 0 1 7 5 35 0 0 0 0 0 0 0 0 0 0 0 0 0 0 0 0 35Post Drivers/Drill Rig (291 hp) 0 0 0 0 0 0 0 0 2 8 64 1,024 1 8 2 16 0 0 0 0 0 0 0 0 1,040Cranes (399 hp) 0 0 0 0 0 0 0 0 1 4 1 4 1 4 2 8 1 4 1 4 1 4 5 20 36Rough Terrain Forklifts (93 hp) 0 0 0 0 0 0 0 0 2 6 64 768 1 6 2 12 1 6 5 30 1 6 5 30 840Trenchers (63 hp) 0 0 0 0 0 0 0 0 1 8 5 40 0 0 0 0 0 0 0 0 0 0 0 0 40Water Truck (189 hp) 1 6 21 126 0 0 0 0 1 6 64 384 0 0 0 0 0 0 0 0 0 0 0 0 510
Total 4,185
Total HoursEquipmentSite Preparation Paving Construction of Solar Array Installation of Gen-Tie Line Substation and O&M Bldg Fiber Optic Cable
B-7

Annual Onsite Criteria Pollutant Exhaust Emissions
ROG NOx CO SOx PM10 PM2.5 ROG NOx CO SOx PM10 PM2.5
Excavators (168 hp) 208 175 0.137 1.035 0.668 0.001 0.063 0.058 0.01 0.11 0.07 0.00 0.01 0.01Graders (174 hp) 208 175 0.164 1.271 0.738 0.001 0.074 0.068 0.02 0.13 0.08 0.00 0.01 0.01Rollers (95 hp) 243 120 0.112 0.700 0.413 0.001 0.061 0.056 0.01 0.09 0.05 0.00 0.01 0.01Ruber Tired Loader (164 hp) 224 175 0.139 1.080 0.630 0.001 0.063 0.058 0.02 0.12 0.07 0.00 0.01 0.01Backhoes (108 hp) 771 120 0.083 0.528 0.358 0.001 0.048 0.044 0.03 0.20 0.14 0.00 0.02 0.02Cement Mixer (10 hp) 30 15 0.008 0.048 0.039 0.000 0.003 0.002 0.00 0.00 0.00 0.00 0.00 0.00Pavers (100 hp) 35 120 0.155 0.923 0.516 0.001 0.082 0.075 0.00 0.02 0.01 0.00 0.00 0.00Post Drivers/Drill Rig (291 hp) 1,040 500 0.142 1.490 0.554 0.003 0.052 0.048 0.07 0.77 0.29 0.00 0.03 0.02Cranes (399 hp) 36 500 0.172 1.648 0.613 0.002 0.063 0.058 0.00 0.03 0.01 0.00 0.00 0.00Rough Terrain Forklifts (93 hp) 840 120 0.112 0.687 0.440 0.001 0.063 0.058 0.05 0.29 0.18 0.00 0.03 0.02Trenchers (63 hp) 40 120 0.143 0.866 0.478 0.001 0.075 0.069 0.00 0.02 0.01 0.00 0.00 0.00Water Truck (189 hp) 510 500 0.237 2.122 0.705 0.003 0.078 0.072 0.06 0.54 0.18 0.00 0.02 0.02Note: PM10 and PM2.5 emissions are based on PM emissions factors from the Offroad model
with PM10 and PM2.5 fractions applied to the PM EF (SCAQMD, 2006) Total Annual Emissions = 0.28 2.32 1.09 0.00 0.12 0.11References:SCAQMD (South Coast Air Quality Management District). 2006. Final Methodology to Calculate PM2.5 and PM2.5 Significance Thresholds, Appendix A - Updated CEIDARS Table with PM2.5 Fractions.
Daily Emissions (tons/year)
Activity/EquipmentTotal Hours
Max Horsepower
Equipment Emission Rates (lb/hour)
B-8

ONROAD CRITERIA POLLUTANT EMISSIONS - OPERATIONS
ROG NOx CO SOx PM10 PM2.5 ROG NOx CO SOx PM10 PM2.5
Light duty truck - 15 mph 0.0002 0.0009 0.0069 0.0000 0.0001 0.0001
Light duty truck - 60 mph 0.0001 0.0008 0.0035 0.0000 0.0001 0.0001
Note: used EMFAC 2007, for model years 1985 through 2011 and for 60F.
Vehicle Type Trips/proj miles/trip ROG NOx CO Sox PM10 PM2.5
Light duty truck - 15 mph 521 2 0.00 0.00 0.01 0.00 0.00 0.00Light duty truck - 60 mph 521 18 0.00 0.00 0.02 0.00 0.00 0.00
Total Average Daily Emissions NA NA 0.00 0.00 0.03 0.00 0.00 0.00
All trips per day are roundtrips. The light-duty truck trips represent a maximum of 2 daily worker round-trips 5 days a week (261 trips per year each). It is assumed that each light-duty trip would include 2.0 miles of 15 mph travel and 18.0 miles of 65 mph travel.The emissions for 15 mph include the start-up emissions, each round-trip would generate two start-ups.
ONROAD GREENHOUSE GAS EMISSIONS - OPERATIONS
CO2 CH4 N2O CO2 CH4 N2O
Light duty truck - 15 mph 1.4963 0.0001 0.0001
Light duty truck - 60 mph 0.9152 0.0001 0.0001
Note: used EMFAC 2007, for model years 1989 through 2009; Emission factors are for 60F.
Vehicle Type Trips/year miles/trip CO2 CH4 N2O CO2e
Light duty truck - 15 mph 521 2 0.86 0.00 0.00 0.88Light duty truck - 60 mph 521 18 3.90 0.00 0.00 4.07
Total (metric tons) NA NA 4.76 0.00 0.00 4.95
All trips per day are roundtrips. The light-duty truck trips represent a maximum of 2 daily worker round-trips 5 days a week (261 trips per year each). It is assumed that each light-duty trip would include 2.0 miles of 15 mph travel and 18.0 miles of 65 mph travel.The emissions for 15 mph include the start-up emissions, each round-trip would generate two start-ups..
Notes: 0.907194 metric tons = 1 ton; 2000 pounds = 1 ton.
Global Warming Potential for CH4 = 21; GWP for N2O = 310.
Gasoline emission of GHG
678.7310 g CO2/mile Offroad at 15 mph
0.0563 g CH4/mile (CCAR, 2009)
0.03639 g NO2/mile (CCAR, 2009)
CH4 emissions = 0.000083 ratio of CH4 emission to CO2 Emissions
N2O emissions = 0.000054 ratio of N20 emission to CO2 Emissions
References:California Climate Action Registry, General Reporting Protocol, Reporting Entity-Wide Greenhouse Gas Emissions, Version 3.1, January 2009. Tables C.3 and C.6.
Gasoline emissions are averaged for vehicle models from 1985 to present.
0.0013 0.0177
Emission Factors
Emission Factors
Vehicle Type
Running Exhaust Emission Factors (pounds/mile) Starting Emission Factors (pound/start-up)
0.0000
Starting Emission Factors
Annual Operational Emissions (tons/year)
0.0011 0.0000 2.646E-05
Annual Operational On-road Emissions (metric tons/year)
0.3229 2.678E-05 1.731E-05
(pounds/start-up)Running Exhaust Emission Factors
(pounds/mile)
Vehicle TypeB-9

ONROAD CRITERIA POLLUTANT EMISSIONS - CONSTRUCTION
ROG NOx CO SOx PM10 PM2.5 ROG NOx CO SOx PM10 PM2.5
Light duty truck - 15 mph 0.0002 0.0009 0.0069 0.0000 0.0001 0.0001Light duty truck - 60 mph 0.0001 0.0008 0.0035 0.0000 0.0001 0.0001
Heavy duty truck -15 mph 0.0055 0.0384 0.0186 0.0001 0.0021 0.0019Heavy duty truck -60 mph 0.0016 0.0294 0.0068 0.0000 0.0014 0.0013
Note: used EMFAC 2007, for model years 1985 through 2011; Emission factors for NOx are for 60F.
Vehicle Type Trips/proj miles/trip ROG NOx CO Sox PM10 PM2.5
Light duty truck - 15 mph 100800 0.5 0.14 0.13 1.95 0.00 0.01 0.01Light duty truck - 15 mph 24150 2 0.04 0.05 0.59 0.00 0.00 0.00Light duty truck - 60 mph 24150 18 0.02 0.17 0.76 0.00 0.01 0.01
Heavy duty truck -15 mph 460 2 0.00 0.02 0.04 0.00 0.00 0.00Heavy duty truck -60 mph 460 18 0.01 0.12 0.03 0.00 0.01 0.01
Total Annual Emissions NA NA 0.20 0.48 3.37 0.00 0.03 0.03
All trips per day are roundtrips. The 24,150 light-duty truck trips represent 115 daily round trips generated by construction workers for 210 days traveling 20 miles per day at the site for 210 days . The light-duty truck trips lengths that are 0.5 mile are associated with 24 vehicles making 20 trips onsite at 15 mph. The 2-mile and 18 mile trips represent one worker trip at 10% 15 mph and 90% 60 mph.The heavy-duty truck trips are for material deliveries. Total trip lengths are 20 miles at 10% 15 mph and 90% 60 mph.The emissions for 15 mph include the start-up emissions, each round-trip would generate two start-ups.
PV Delivery
Vehicle Type Trips/proj miles/trip ROG NOx CO Sox PM10 PM2.5
Light duty truck - 15 mph 1720 2 0.00 0.00 0.03 0.00 0.00 0.00Light duty truck - 60 mph 1720 74 0.00 0.05 0.22 0.00 0.00 0.00
Heavy duty truck -15 mph 430 2 0.00 0.02 0.02 0.00 0.00 0.00Heavy duty truck -60 mph 430 74 0.03 0.47 0.11 0.00 0.02 0.02
Total Annual Emissions NA NA 0.04 0.54 0.38 0.00 0.03 0.03
All trips per day are roundtrips. The light-duty truck trips represent 4 pilot trips per PV delivery. The heavy-duty truck trip amount for PV delivery is 430 trips. It is assumed that PV panal deliveries would be 76 mile-roundtips in the SJVAB. It is assumed that each trip would include 2.0 miles of 15 mph travel.The emissions for 15 mph include the start-up emissions, each round-trip would generate one start-up in the SJVAB.
TOTAL ONROAD CONSTRUCTION EMISSIONS 0.24 1.02 3.75 0.00 0.06 0.05
Emission Factors
Vehicle Type
Running Exhaust Emission Factors (pounds/mile)
0.0011 0.0000
Starting Emission Factors (pound/start-up)
0.00000.00630.0045 0.0000
2.646E-05
8.818E-06
Worker and Material Delivery Trips (tons/year)
0.0000
0.0642
0.0013 0.0177
B-10

ONROAD GREENHOUSE GAS EMISSIONS - CONSTRUCTION
CO2 CH4 N2O CO2 CH4 N2O
Light duty truck - 15 mph 1.4963 0.0001 0.0001
Light duty truck - 60 mph 0.9152 0.0001 0.0001
Heavy duty truck -15 mph 5.6814 0.0000 0.0000
Heavy duty truck -60 mph 3.6631 0.0000 0.0000
Note: used EMFAC 2007, for model years 1985 through 2011; Emission factors are for 60F.
Vehicle Type Trips/year miles/trip CO2 CH4 N2O CO2e
Light duty truck - 15 mph 100800 0.5 63.73 0.01 0.00 64.90Light duty truck - 15 mph 24150 2 39.86 0.00 0.00 40.59Light duty truck - 60 mph 24150 18 180.47 0.02 0.02 185.89
Heavy duty truck -15 mph 460 2 2.41 0.00 0.00 2.41Heavy duty truck -60 mph 460 18 13.76 0.00 0.00 13.77
Total (metric tons) NA NA 300.23 0.03 0.02 307.56
All trips per day are roundtrips. The 24,150 light-duty truck trips represent 115 daily round trips generated by construction workers for 210 days traveling 20 miles per day at the site for 210 days . The light-duty truck trips lengths that are 0.5 mile are associated with 24 vehicles making 20 trips onsite at 15 mph. The 2-mile and 18 mile trips represent one worker trip at 10% 15 mph and 90% 60 mph.The heavy-duty truck trips are for material deliveries. Total trip lengths are 20 miles at 10% 15 mph and 90% 60 mph.The emissions for 15 mph include the start-up emissions, each round-trip would generate two start-ups.
Vehicle Type Trips/year miles/trip CO2 CH4 N2O CO2e
Light duty truck - 15 mph 1720 2 2.84 0.00 0.00 2.89Light duty truck - 60 mph 1720 158 112.82 0.02 0.01 116.21
Heavy duty truck -15 mph 430 2 2.26 0.00 0.00 2.26Heavy duty truck -60 mph 430 158 112.89 0.00 0.00 113.00
Total (metric tons) NA NA 230.80 0.02 0.01 234.36
All trips per day are roundtrips. The light-duty truck trips represent 4 pilot trips per PV delivery. The heavy-duty truck trip amount for PV delivery is 430 trips. It is assumed that PV panal deliveries would be 160-mile roundtrips to Oakland. It is assumed that each trip would include 2.0 miles of 15 mph travel.The emissions for 15 mph include the start-up emissions, each round-trip would generate two start-ups.
TOTAL ONROAD CONSTRUCTION EMISSIONS 531.03 0.05 0.03 541.92
Notes: 0.907194 metric tons = 1 ton; 2000 pounds = 1 ton.
Global Warming Potential for CH4 = 21; GWP for N2O = 310.
Gasoline emission of GHG
678.731 g CO2/mile Offroad at 15 mph
0.0563 g CH4/mile (CCAR, 2009)
0.03639 g NO2/mile (CCAR, 2009)
CH4 emissions = 0.000083 ratio of CH4 emission to CO2 Emissions
N2O emissions = 0.000054 ratio of N20 emission to CO2 Emissions
Diesel emission of GHG (CCAR, 2009)
2577.096 g CO2/mile Offroad at 15 mph
0.0048 g CH4/mile (CCAR, 2009)
0.0051 g NO2/mile (CCAR, 2009)
CH4 emissions = 0.000002 ratio of CH4 emission to CO2 Emissions
N2O emissions = 0.000002 ratio of N20 emission to CO2 Emissions
References:California Climate Action Registry, General Reporting Protocol, Reporting Entity-Wide Greenhouse Gas Emissions, Version 3.1, January 2009. Tables C.3 and C.6.
PV Delivery Trips (metric tons/year)
1.995E-07
2.678E-05 1.731E-05
0.1008
0.3229
Worker and Material Delivery Trips (metric tons/year)
(pounds/mile)Starting Emission Factors
(pounds/start-up)
1.877E-07
Running Exhaust Emission Factors
Emission Factors
Vehicle Type
B-11

Annual Onsite Greenhouse Gas Emissions Exhaust Emissions
CO2 CH4 N2O CO2 CH4 N2O CO2e
Excavators (168 hp) 208 175 112.121 0.012 0.00287 10.58 0.00 0.00 10.69Graders (174 hp) 208 175 123.810 0.015 0.00317 11.68 0.00 0.00 11.80Rollers (95 hp) 243 120 58.936 0.010 0.00151 6.50 0.00 0.00 6.57Ruber Tired Loader (164 hp) 224 175 106.220 0.013 0.00272 10.79 0.00 0.00 10.90Backhoes (108 hp) 771 120 51.682 0.007 0.00132 18.07 0.00 0.00 18.27Cement Mixer (10 hp) 30 15 6.315 0.001 0.00016 0.09 0.00 0.00 0.09Pavers (100 hp) 35 120 69.134 0.014 0.00177 1.10 0.00 0.00 1.11Post Drivers/Drill Rig (291 hp) 1,040 500 311.029 0.013 0.00797 146.73 0.01 0.00 148.02Cranes (399 hp) 36 500 179.940 0.016 0.00461 2.94 0.00 0.00 2.97Rough Terrain Forklifts (93 hp) 840 120 62.394 0.010 0.00160 23.77 0.00 0.00 24.04Trenchers (63 hp) 40 120 64.837 0.013 0.00166 1.18 0.00 0.00 1.19Water Truck (189 hp) 510 500 272.089 0.021 0.00697 62.94 0.00 0.00 63.55
296.36 0.02 0.01 299.20
Notes: 0.907194 metric tons = 1 ton; 2000 pounds = 1 ton.
Global Warming Potential for CH4 = 21; GWP for N2O = 310.
Diesel emission of GHG (CCAR, 2009)10150 g CO2/gal
0.26 g N2O/gal
N2O emissions = 0.000026 ratio of N20 emission to CO2 Emissions
References:California Climate Action Registry, General Reporting Protocol, Reporting Entity-Wide Greenhouse Gas Emissions, Version 3.1, January 2009. Tables C.3 and C.6.
Annual Onsite Greenhouse Gas Emissions Due to Fugitive SF6
SF6 for 34.5 kV circuit breaker C02e (pounds) metric tons
25 23,900 0.01 2.7
Sources: For pounds of SF6: E-mail communication from Carl Madrazo, January 27, 2011For leak rate: U.S. Environmental Protection Agency (USEPA), 2006. SF6 Leak Rates from High Voltage Circuit Breakers – U.S. EPA Investigates Potential Greenhouse Gas Emissions Source. IEEE Power Engineering Society General Meeting, Montreal, Quebec, Canada, June 2006
SF6 GWP Leak Factor
Activity/Equipment
Total Equipment Emissions
Annual Emissions (metric tons per year)Equipment Emission Rates (lb/hour)Maximum HP
Total Hours
B-12

Indirect Water Usage Emissions
Existing Water Demand - Strawberries16.1 million gallons per year
Source: E-mail communication from Steve Cahilig, February , 2011
Proposed Project Water Demand3.3 Short-term construction demand (million gallons per year)(average of 10 af)3.3 Long-term operational demand (million gallons per year)(average of 10 af)
Net Reduction in Water Usage12.8 Net reduction in water usage (million gallons per year) during construction 12.8 Net reduction in water usage (million gallons per year) during operations
Use and Emission FactorsWater energy use factor* (CEC, 2005)
250 kW-hr/MGElectricity use emission factors (CCAR, 2009)
CO2 CH4 N2Olbs/MW-hr 724.12 0.0302 0.0081
Reduction in Water Related Electrical Consumption3,197.87 For each construction and operations (kW-hr/yr)
3.20 For each construction and operations (MW-hr/yr)
Indirect Emission Reductions Assoc. with Electricity Use (metric tons/year)CO2 CH4 N2O CO2e
Emissions 1.050 0.000 0.000 1.055
Notes: Global Warming Potential for CH4 = 25; GWP for N2O = 296.
* Water energy use factor includes supply, conveyance, and treatment.
There are 325,581.43 gallons per acre-foot
References:California Energy Commission (CEC), 2005. California's Water - Energy Relationship Prepared in Suppot of the 2005
Integrated Energy Policy Report Proceeding (04-IEPR-01E), November 2005 (Table 1-3, page 11).
California Climate Action Registry, 2009. General Reporting Protocol, Reporting Entity-Wide Greenhouse
Gas Emissions, Version 3.1, January 2009.Tables C.4 and C.7.
B-13

Energy Displaced From the Electrical Grid
MW-hrsNet Production 59,956
Electricity Use Emission Factors (CCAR, 2009) CO2 CH4 N2O
lbs/MW-hr 724.12 0.0302 0.0081
Emission Reduction (GHG Avoided)CO2 CH4 N2O
lb/yr 43,415,339 1,811 486CO2e lb/yr 43,415,339 45,267 143,751CO2e MT/yr 19,693 21 65Total CO2e MT/yr 19,779
Global Warming Potential for CH4 = 25; GWP for N2O = 296.
References:California Energy Commission (CEC), 2005. California's Water - Energy Relationship Prepared in Suppot of the 2005
Integrated Energy Policy Report Proceeding (04-IEPR-01E), November 2005 (Table 1-3, page 11).
California Climate Action Registry, 2009. General Reporting Protocol, Reporting Entity-Wide Greenhouse
Gas Emissions, Version 3.1, January 2009.Tables C.4 and C.7.
B-14

Title : McHenry Solar Farm ProjectVersion : Emfac2007 V2.3 Nov 1 2006Run Date : 2011/02/26 05:53:37Scen Year: 2011 -- All model years in the range 1985 to 2011 selectedSeason : AnnualArea : Stanislaus***************************************************************************************** Year: 2011 -- Model Years 1985 to 2011 Inclusive -- Annual Emfac2007 Emission Factors: V2.3 Nov 1 2006
County Average Stanislaus County Average
Table 1: Running Exhaust Emissions (grams/mile)
Pollutant Name: Reactive Org Gases Temperature: 60F Relative Humidity: 50%
SpeedMPH LDA LDT MDT HDT UBUS MCY ALL
15 0 0.109 0 2.495 0 0 1.04560 0 0.034 0 0.745 0 0 0.313
Pollutant Name: Carbon Monoxide Temperature: 60F Relative Humidity: 50%
SpeedMPH LDA LDT MDT HDT UBUS MCY ALL
15 0 3.116 0 8.416 0 0 5.19460 0 1.58 0 3.101 0 0 2.176
Pollutant Name: Oxides of Nitrogen Temperature: 60F Relative Humidity: 50%
SpeedMPH LDA LDT MDT HDT UBUS MCY ALL
15 0 0.391 0 17.41 0 0 7.06460 0 0.347 0 13.355 0 0 5.447
Pollutant Name: Carbon Dioxide Temperature: 60F Relative Humidity: 50%
SpeedMPH LDA LDT MDT HDT UBUS MCY ALL
15 0 678.731 0 2577.096 0 0 1423.03560 0 415.157 0 1661.564 0 0 903.843
B-15

Pollutant Name: Sulfur Dioxide Temperature: 60F Relative Humidity: 50%
SpeedMPH LDA LDT MDT HDT UBUS MCY ALL
15 0 0.007 0 0.025 0 0 0.01460 0 0.004 0 0.016 0 0 0.009
Pollutant Name: PM10 Temperature: 60F Relative Humidity: 50%
SpeedMPH LDA LDT MDT HDT UBUS MCY ALL
15 0 0.029 0 0.88 0 0 0.36260 0 0.01 0 0.562 0 0 0.227
Pollutant Name: PM10 - Tire Wear Temperature: 60F Relative Humidity: 50%
SpeedMPH LDA LDT MDT HDT UBUS MCY ALL
15 0 0.008 0 0.036 0 0 0.01960 0 0.008 0 0.036 0 0 0.019
Pollutant Name: PM10 - Brake Wear Temperature: 60F Relative Humidity: 50%
SpeedMPH LDA LDT MDT HDT UBUS MCY ALL
15 0 0.013 0 0.028 0 0 0.01960 0 0.013 0 0.028 0 0 0.019
Pollutant Name: Gasoline - mi/gal Temperature: 60F Relative Humidity: 50%
Speed MPH LDA LDT MDT HDT UBUS MCY ALL
15 0.000 12.541 0.000 6.869 0.000 0.000 12.490 60 0.000 20.970 0.000 13.902 0.000 0.000 20.906
B-16

Pollutant Name: Diesel - mi/gal Temperature: 60F Relative Humidity: 50%
Speed MPH LDA LDT MDT HDT UBUS MCY ALL
15 0.000 29.156 0.000 3.883 0.000 0.000 6.150 60 0.000 29.156 0.000 6.014 0.000 0.000 8.090
Title : McHenry Solar Farm ProjectVersion : Emfac2007 V2.3 Nov 1 2006Run Date : 2011/02/26 05:53:37Scen Year: 2011 -- All model years in the range 1985 to 2011 selectedSeason : AnnualArea : Stanislaus***************************************************************************************** Year: 2011 -- Model Years 1985 to 2011 Inclusive -- Annual Emfac2007 Emission Factors: V2.3 Nov 1 2006
County Average Stanislaus County Average
Table 2: Starting Emissions (grams/trip)
Pollutant Name: Reactive Org Gases Temperature: 60F Relative Humidity: ALL
Timemin LDA LDT MDT HDT UBUS MCY ALL
5 0 0.055 0 0.21 0 0 0.07310 0 0.108 0 0.409 0 0 0.14220 0 0.207 0 0.775 0 0 0.27130 0 0.297 0 1.099 0 0 0.38640 0 0.377 0 1.38 0 0 0.48950 0 0.448 0 1.619 0 0 0.57860 0 0.509 0 1.814 0 0 0.654
120 0 0.654 0 1.73 0 0 0.774180 0 0.526 0 1.836 0 0 0.671240 0 0.556 0 1.938 0 0 0.71300 0 0.587 0 2.037 0 0 0.748360 0 0.616 0 2.133 0 0 0.785420 0 0.645 0 2.225 0 0 0.821480 0 0.674 0 2.314 0 0 0.856540 0 0.702 0 2.399 0 0 0.891600 0 0.729 0 2.482 0 0 0.924660 0 0.755 0 2.56 0 0 0.956720 0 0.781 0 2.636 0 0 0.987
B-17

Pollutant Name: Carbon Monoxide Temperature: 60F Relative Humidity: ALL
Timemin LDA LDT MDT HDT UBUS MCY ALL
5 0 0.741 0 3.384 0 0 1.03510 0 1.457 0 6.631 0 0 2.03320 0 2.814 0 12.712 0 0 3.91630 0 4.073 0 18.243 0 0 5.65140 0 5.233 0 23.223 0 0 7.23650 0 6.294 0 27.654 0 0 8.67360 0 7.257 0 31.535 0 0 9.96
120 0 9.807 0 26.722 0 0 11.69180 0 7.209 0 27.503 0 0 9.468240 0 7.63 0 28.31 0 0 9.932300 0 8.016 0 29.142 0 0 10.368360 0 8.368 0 30.001 0 0 10.777420 0 8.686 0 30.885 0 0 11.158480 0 8.97 0 31.795 0 0 11.512540 0 9.22 0 32.73 0 0 11.838600 0 9.435 0 33.692 0 0 12.136660 0 9.617 0 34.679 0 0 12.407720 0 9.764 0 35.692 0 0 12.65
Pollutant Name: Oxides of Nitrogen Temperature: 60F Relative Humidity: ALL
Timemin LDA LDT MDT HDT UBUS MCY ALL
5 0 0.232 0 0.661 0 0 0.2810 0 0.264 0 0.996 0 0 0.34520 0 0.32 0 1.584 0 0 0.46130 0 0.367 0 2.064 0 0 0.55640 0 0.404 0 2.434 0 0 0.6350 0 0.432 0 2.696 0 0 0.68460 0 0.45 0 2.848 0 0 0.717
120 0 0.477 0 2.891 0 0 0.745180 0 0.492 0 2.88 0 0 0.758240 0 0.489 0 2.864 0 0 0.753300 0 0.484 0 2.842 0 0 0.746360 0 0.477 0 2.815 0 0 0.737420 0 0.468 0 2.782 0 0 0.725480 0 0.457 0 2.743 0 0 0.711540 0 0.444 0 2.699 0 0 0.695600 0 0.43 0 2.649 0 0 0.677660 0 0.414 0 2.594 0 0 0.656720 0 0.396 0 2.532 0 0 0.634
B-18

Pollutant Name: Carbon Dioxide Temperature: 60F Relative Humidity: ALL
Timemin LDA LDT MDT HDT UBUS MCY ALL
5 0 12.27 0 1.528 0 0 11.07410 0 14.743 0 3.048 0 0 13.44120 0 20.127 0 6.061 0 0 18.56130 0 26.097 0 9.041 0 0 24.19840 0 32.651 0 11.987 0 0 30.3550 0 39.79 0 14.899 0 0 37.01960 0 47.514 0 17.778 0 0 44.204
120 0 102.587 0 30.237 0 0 94.532180 0 117.464 0 35.723 0 0 108.363240 0 132.088 0 40.885 0 0 121.934300 0 146.46 0 45.723 0 0 135.244360 0 160.579 0 50.237 0 0 148.294420 0 174.445 0 54.428 0 0 161.083480 0 188.058 0 58.295 0 0 173.611540 0 201.419 0 61.838 0 0 185.879600 0 214.527 0 65.057 0 0 197.886660 0 227.383 0 67.952 0 0 209.632720 0 239.986 0 70.524 0 0 221.118
Pollutant Name: Sulfur Dioxide Temperature: 60F Relative Humidity: ALL
Timemin LDA LDT MDT HDT UBUS MCY ALL
5 0 0 0 0 0 0 010 0 0 0 0 0 0 020 0 0 0 0 0 0 030 0 0 0 0 0 0 040 0 0 0 0.001 0 0 050 0 0 0 0.001 0 0 0.00160 0 0.001 0 0.001 0 0 0.001
120 0 0.001 0 0.001 0 0 0.001180 0 0.001 0 0.001 0 0 0.001240 0 0.001 0 0.001 0 0 0.001300 0 0.002 0 0.001 0 0 0.001360 0 0.002 0 0.001 0 0 0.002420 0 0.002 0 0.001 0 0 0.002480 0 0.002 0 0.001 0 0 0.002540 0 0.002 0 0.001 0 0 0.002600 0 0.002 0 0.001 0 0 0.002660 0 0.002 0 0.001 0 0 0.002720 0 0.002 0 0.001 0 0 0.002
B-19

Pollutant Name: PM10 Temperature: 60F Relative Humidity: ALL
Timemin LDA LDT MDT HDT UBUS MCY ALL
5 0 0.001 0 0 0 0 0.00110 0 0.001 0 0.001 0 0 0.00120 0 0.003 0 0.001 0 0 0.00230 0 0.004 0 0.001 0 0 0.00340 0 0.005 0 0.002 0 0 0.00450 0 0.006 0 0.002 0 0 0.00560 0 0.007 0 0.003 0 0 0.006
120 0 0.01 0 0.003 0 0 0.009180 0 0.011 0 0.004 0 0 0.01240 0 0.011 0 0.004 0 0 0.011300 0 0.012 0 0.004 0 0 0.011360 0 0.013 0 0.004 0 0 0.012420 0 0.013 0 0.004 0 0 0.012480 0 0.014 0 0.004 0 0 0.013540 0 0.014 0 0.004 0 0 0.013600 0 0.014 0 0.004 0 0 0.013660 0 0.014 0 0.005 0 0 0.013720 0 0.015 0 0.005 0 0 0.014
B-20

McHenry Solar Farm C-1 May 2011 Draft Environmental Impact Report
APPENDIX C Hazards and Hazardous Materials

THIS PAGE INTENTIONALLY LEFT BLANK
C-2
FORM-NULL-ASH
®kcehCoeGhtiwtropeR™paMsuidaRRDEehT
440 Wheelers Farms RoadMilford, CT 06461Toll Free: 800.352.0050www.edrnet.com
McHenry Solar Farm299 Paterson RoadModesto, CA 95356
Inquiry Number: 2957885.1sJanuary 03, 2011
C-3

SECTION PAGE
Executive Summary ES1
Overview Map 2
Detail Map 3
Map Findings Summary 4
Map Findings 7
Orphan Summary 8
Government Records Searched/Data Currency Tracking GR-1
GEOCHECK ADDENDUM
Physical Setting Source Addendum A-1
Physical Setting Source Summary A-2
Physical Setting SSURGO Soil Map A-5
Physical Setting Source Map A-9
Physical Setting Source Map Findings A-11
Physical Setting Source Records Searched A-19
TC2957885.1s Page 1
Thank you for your business.Please contact EDR at 1-800-352-0050
with any questions or comments.
Disclaimer - Copyright and Trademark NoticeThis Report contains certain information obtained from a variety of public and other sources reasonably available to Environmental DataResources, Inc. It cannot be concluded from this Report that coverage information for the target and surrounding properties does not exist fromother sources. NO WARRANTY EXPRESSED OR IMPLIED, IS MADE WHATSOEVER IN CONNECTION WITH THIS REPORT. ENVIRONMENTALDATA RESOURCES, INC. SPECIFICALLY DISCLAIMS THE MAKING OF ANY SUCH WARRANTIES, INCLUDING WITHOUT LIMITATION,MERCHANTABILITY OR FITNESS FOR A PARTICULAR USE OR PURPOSE. ALL RISK IS ASSUMED BY THE USER. IN NO EVENT SHALLENVIRONMENTAL DATA RESOURCES, INC. BE LIABLE TO ANYONE, WHETHER ARISING OUT OF ERRORS OR OMISSIONS, NEGLIGENCE,ACCIDENT OR ANY OTHER CAUSE, FOR ANY LOSS OF DAMAGE, INCLUDING, WITHOUT LIMITATION, SPECIAL, INCIDENTAL,CONSEQUENTIAL, OR EXEMPLARY DAMAGES. ANY LIABILITY ON THE PART OF ENVIRONMENTAL DATA RESOURCES, INC. IS STRICTLYLIMITED TO A REFUND OF THE AMOUNT PAID FOR THIS REPORT. Purchaser accepts this Report "AS IS". Any analyses, estimates, ratings,environmental risk levels or risk codes provided in this Report are provided for illustrative purposes only, and are not intended to provide, norshould they be interpreted as providing any facts regarding, or prediction or forecast of, any environmental risk for any property. Only a Phase IEnvironmental Site Assessment performed by an environmental professional can provide information regarding the environmental risk for anyproperty. Additionally, the information provided in this Report is not to be construed as legal advice.
Copyright 2011 by Environmental Data Resources, Inc. All rights reserved. Reproduction in any media or format, in wholeor in part, of any report or map of Environmental Data Resources, Inc., or its affiliates, is prohibited without prior written permission.EDR and its logos (including Sanborn and Sanborn Map) are trademarks of Environmental Data Resources, Inc. or its affiliates. All othertrademarks used herein are the property of their respective owners.
TABLE OF CONTENTS
C-4

EXECUTIVE SUMMARY
TC2957885.1s EXECUTIVE SUMMARY 1
A search of available environmental records was conducted by Environmental Data Resources, Inc (EDR).The report was designed to assist parties seeking to meet the search requirements of EPA’s Standardsand Practices for All Appropriate Inquiries (40 CFR Part 312), the ASTM Standard Practice forEnvironmental Site Assessments (E 1527-05) or custom requirements developed for the evaluation ofenvironmental risk associated with a parcel of real estate.
TARGET PROPERTY INFORMATION
ADDRESS
299 PATERSON ROADMODESTO, CA 95356
COORDINATES
37.736800 - 37˚ 44’ 12.5’’Latitude (North): 120.990700 - 120˚ 59’ 26.5’’Longitude (West): Zone 10Universal Tranverse Mercator: 677053.4UTM X (Meters): 4178308.5UTM Y (Meters): 110 ft. above sea levelElevation:
USGS TOPOGRAPHIC MAP ASSOCIATED WITH TARGET PROPERTY
37120-F8 RIVERBANK, CATarget Property Map:1987Most Recent Revision:
37120-G8 ESCALON, CANorth Map:1976Most Recent Revision:
37121-F1 SALIDA, CAWest Map:1987Most Recent Revision:
TARGET PROPERTY SEARCH RESULTS
The target property was not listed in any of the databases searched by EDR.
DATABASES WITH NO MAPPED SITES
No mapped sites were found in EDR’s search of available ("reasonably ascertainable ") governmentrecords either on the target property or within the search radius around the target property for thefollowing databases:
STANDARD ENVIRONMENTAL RECORDS
Federal NPL site listNPL National Priority List
C-5

EXECUTIVE SUMMARY
TC2957885.1s EXECUTIVE SUMMARY 2
Proposed NPL Proposed National Priority List SitesNPL LIENS Federal Superfund Liens
Federal Delisted NPL site listDelisted NPL National Priority List Deletions
Federal CERCLIS listCERCLIS Comprehensive Environmental Response, Compensation, and Liability Information SystemFEDERAL FACILITY Federal Facility Site Information listing
Federal CERCLIS NFRAP site ListCERC-NFRAP CERCLIS No Further Remedial Action Planned
Federal RCRA CORRACTS facilities listCORRACTS Corrective Action Report
Federal RCRA non-CORRACTS TSD facilities listRCRA-TSDF RCRA - Treatment, Storage and Disposal
Federal RCRA generators listRCRA-LQG RCRA - Large Quantity GeneratorsRCRA-SQG RCRA - Small Quantity GeneratorsRCRA-CESQG RCRA - Conditionally Exempt Small Quantity Generator
Federal institutional controls / engineering controls registriesUS ENG CONTROLS Engineering Controls Sites ListUS INST CONTROL Sites with Institutional Controls
Federal ERNS listERNS Emergency Response Notification System
State- and tribal - equivalent NPLRESPONSE State Response Sites
State- and tribal - equivalent CERCLISENVIROSTOR EnviroStor Database
State and tribal landfill and/or solid waste disposal site listsSWF/LF Solid Waste Information System
State and tribal leaking storage tank listsLUST Geotracker’s Leaking Underground Fuel Tank ReportSLIC Statewide SLIC Cases
C-6

EXECUTIVE SUMMARY
TC2957885.1s EXECUTIVE SUMMARY 3
INDIAN LUST Leaking Underground Storage Tanks on Indian Land
State and tribal registered storage tank listsUST Active UST FacilitiesAST Aboveground Petroleum Storage Tank FacilitiesINDIAN UST Underground Storage Tanks on Indian LandFEMA UST Underground Storage Tank Listing
State and tribal voluntary cleanup sitesVCP Voluntary Cleanup Program PropertiesINDIAN VCP Voluntary Cleanup Priority Listing
ADDITIONAL ENVIRONMENTAL RECORDS
Local Brownfield listsUS BROWNFIELDS A Listing of Brownfields Sites
Local Lists of Landfill / Solid Waste Disposal SitesDEBRIS REGION 9 Torres Martinez Reservation Illegal Dump Site LocationsODI Open Dump InventoryWMUDS/SWAT Waste Management Unit DatabaseSWRCY Recycler DatabaseHAULERS Registered Waste Tire Haulers ListingINDIAN ODI Report on the Status of Open Dumps on Indian Lands
Local Lists of Hazardous waste / Contaminated SitesUS CDL Clandestine Drug LabsHIST Cal-Sites Historical Calsites DatabaseSCH School Property Evaluation ProgramToxic Pits Toxic Pits Cleanup Act SitesCDL Clandestine Drug LabsUS HIST CDL National Clandestine Laboratory Register
Local Lists of Registered Storage TanksCA FID UST Facility Inventory DatabaseHIST UST Hazardous Substance Storage Container DatabaseSWEEPS UST SWEEPS UST Listing
Local Land RecordsLIENS 2 CERCLA Lien InformationLUCIS Land Use Control Information SystemLIENS Environmental Liens ListingDEED Deed Restriction Listing
Records of Emergency Release ReportsHMIRS Hazardous Materials Information Reporting System
C-7

EXECUTIVE SUMMARY
TC2957885.1s EXECUTIVE SUMMARY 4
CHMIRS California Hazardous Material Incident Report SystemLDS Land Disposal Sites ListingMCS Military Cleanup Sites Listing
Other Ascertainable RecordsRCRA-NonGen RCRA - Non GeneratorsDOT OPS Incident and Accident DataDOD Department of Defense SitesFUDS Formerly Used Defense SitesCONSENT Superfund (CERCLA) Consent DecreesROD Records Of DecisionUMTRA Uranium Mill Tailings SitesMINES Mines Master Index FileTRIS Toxic Chemical Release Inventory SystemTSCA Toxic Substances Control ActFTTS FIFRA/ TSCA Tracking System - FIFRA (Federal Insecticide, Fungicide, & Rodenticide Act)/TSCA (Toxic Substances Control Act)HIST FTTS FIFRA/TSCA Tracking System Administrative Case ListingSSTS Section 7 Tracking SystemsICIS Integrated Compliance Information SystemPADS PCB Activity Database SystemMLTS Material Licensing Tracking SystemRADINFO Radiation Information DatabaseFINDS Facility Index System/Facility Registry SystemRAATS RCRA Administrative Action Tracking SystemCA BOND EXP. PLAN Bond Expenditure PlanWDS Waste Discharge SystemNPDES NPDES Permits ListingCortese "Cortese" Hazardous Waste & Substances Sites ListHIST CORTESE Hazardous Waste & Substance Site ListNotify 65 Proposition 65 RecordsDRYCLEANERS Cleaner FacilitiesWIP Well Investigation Program Case ListHAZNET Facility and Manifest DataEMI Emissions Inventory DataINDIAN RESERV Indian ReservationsSCRD DRYCLEANERS State Coalition for Remediation of Drycleaners ListingHWP EnviroStor Permitted Facilities ListingHWT Registered Hazardous Waste Transporter DatabaseCOAL ASH EPA Coal Combustion Residues Surface Impoundments ListFINANCIAL ASSURANCE Financial Assurance Information ListingPCB TRANSFORMER PCB Transformer Registration DatabasePROC Certified Processors DatabaseMWMP Medical Waste Management Program ListingCOAL ASH DOE Sleam-Electric Plan Operation Data
EDR PROPRIETARY RECORDS
EDR Proprietary RecordsManufactured Gas Plants EDR Proprietary Manufactured Gas Plants
SURROUNDING SITES: SEARCH RESULTS
Surrounding sites were not identified.
Unmappable (orphan) sites are not considered in the foregoing analysis.
C-8

EXECUTIVE SUMMARY
TC2957885.1s EXECUTIVE SUMMARY 5
Due to poor or inadequate address information, the following sites were not mapped. Count: 2 records.
Site Name Database(s)____________ ____________
CLANDESTINE LAB WASTE SLIC1312 MCHENRY 111 US CDL
C-9

EDR Inc.EDR Inc.EDR Inc.EDR Inc.EDR Inc.EDR Inc.EDR Inc.EDR Inc.EDR Inc.EDR Inc.EDR Inc.EDR Inc.EDR Inc.EDR Inc.EDR Inc.EDR Inc.EDR Inc.EDR Inc.EDR Inc.EDR Inc.EDR Inc.EDR Inc.EDR Inc.EDR Inc.EDR Inc.EDR Inc.EDR Inc.EDR Inc.EDR Inc.EDR Inc.EDR Inc.EDR Inc.EDR Inc.EDR Inc.EDR Inc.EDR Inc.EDR Inc.EDR Inc.EDR Inc.EDR Inc.
115 kV
115 kV
115 kV
115 kV
C-10

EDR Inc.EDR Inc.EDR Inc.EDR Inc.EDR Inc.EDR Inc.EDR Inc.EDR Inc.EDR Inc.EDR Inc.EDR Inc.EDR Inc.EDR Inc.EDR Inc.EDR Inc.EDR Inc.EDR Inc.EDR Inc.EDR Inc.EDR Inc.EDR Inc.EDR Inc.EDR Inc.EDR Inc.EDR Inc.EDR Inc.EDR Inc.EDR Inc.EDR Inc.EDR Inc.EDR Inc.EDR Inc.EDR Inc.EDR Inc.EDR Inc.EDR Inc.EDR Inc.EDR Inc.EDR Inc.EDR Inc.
115 kV
C-11

MAP FINDINGS SUMMARY
SearchTarget Distance Total
Database Property (Miles) < 1/8 1/8 - 1/4 1/4 - 1/2 1/2 - 1 > 1 Plotted
STANDARD ENVIRONMENTAL RECORDS
Federal NPL site list 0 NR 0 0 0 0 1.000NPL 0 NR 0 0 0 0 1.000Proposed NPL 0 NR NR NR NR NR TPNPL LIENS
Federal Delisted NPL site list 0 NR 0 0 0 0 1.000Delisted NPL
Federal CERCLIS list 0 NR NR 0 0 0 0.500CERCLIS 0 NR 0 0 0 0 1.000FEDERAL FACILITY
Federal CERCLIS NFRAP site List 0 NR NR 0 0 0 0.500CERC-NFRAP
Federal RCRA CORRACTS facilities list 0 NR 0 0 0 0 1.000CORRACTS
Federal RCRA non-CORRACTS TSD facilities list 0 NR NR 0 0 0 0.500RCRA-TSDF
Federal RCRA generators list 0 NR NR NR 0 0 0.250RCRA-LQG 0 NR NR NR 0 0 0.250RCRA-SQG 0 NR NR NR 0 0 0.250RCRA-CESQG
Federal institutional controls /engineering controls registries
0 NR NR 0 0 0 0.500US ENG CONTROLS 0 NR NR 0 0 0 0.500US INST CONTROL
Federal ERNS list 0 NR NR NR NR NR TPERNS
State- and tribal - equivalent NPL 0 NR 0 0 0 0 1.000RESPONSE
State- and tribal - equivalent CERCLIS 0 NR 0 0 0 0 1.000ENVIROSTOR
State and tribal landfill and/orsolid waste disposal site lists
0 NR NR 0 0 0 0.500SWF/LF
State and tribal leaking storage tank lists 0 NR NR 0 0 0 0.500LUST 0 NR NR 0 0 0 0.500SLIC
TC2957885.1s Page 4
C-12

MAP FINDINGS SUMMARY
SearchTarget Distance Total
Database Property (Miles) < 1/8 1/8 - 1/4 1/4 - 1/2 1/2 - 1 > 1 Plotted
0 NR NR 0 0 0 0.500INDIAN LUST
State and tribal registered storage tank lists 0 NR NR NR 0 0 0.250UST 0 NR NR NR 0 0 0.250AST 0 NR NR NR 0 0 0.250INDIAN UST 0 NR NR NR 0 0 0.250FEMA UST
State and tribal voluntary cleanup sites 0 NR NR 0 0 0 0.500VCP 0 NR NR 0 0 0 0.500INDIAN VCP
ADDITIONAL ENVIRONMENTAL RECORDS
Local Brownfield lists 0 NR NR 0 0 0 0.500US BROWNFIELDS
Local Lists of Landfill / SolidWaste Disposal Sites
0 NR NR 0 0 0 0.500DEBRIS REGION 9 0 NR NR 0 0 0 0.500ODI 0 NR NR 0 0 0 0.500WMUDS/SWAT 0 NR NR 0 0 0 0.500SWRCY 0 NR NR NR NR NR TPHAULERS 0 NR NR 0 0 0 0.500INDIAN ODI
Local Lists of Hazardous waste /Contaminated Sites
0 NR NR NR NR NR TPUS CDL 0 NR 0 0 0 0 1.000HIST Cal-Sites 0 NR NR NR 0 0 0.250SCH 0 NR 0 0 0 0 1.000Toxic Pits 0 NR NR NR NR NR TPCDL 0 NR NR NR NR NR TPUS HIST CDL
Local Lists of Registered Storage Tanks 0 NR NR NR 0 0 0.250CA FID UST 0 NR NR NR 0 0 0.250HIST UST 0 NR NR NR 0 0 0.250SWEEPS UST
Local Land Records 0 NR NR NR NR NR TPLIENS 2 0 NR NR 0 0 0 0.500LUCIS 0 NR NR NR NR NR TPLIENS 0 NR NR 0 0 0 0.500DEED
Records of Emergency Release Reports 0 NR NR NR NR NR TPHMIRS 0 NR NR NR NR NR TPCHMIRS 0 NR NR NR NR NR TPLDS
TC2957885.1s Page 5
C-13

MAP FINDINGS SUMMARY
SearchTarget Distance Total
Database Property (Miles) < 1/8 1/8 - 1/4 1/4 - 1/2 1/2 - 1 > 1 Plotted
0 NR NR NR NR NR TPMCS
Other Ascertainable Records 0 NR NR NR 0 0 0.250RCRA-NonGen 0 NR NR NR NR NR TPDOT OPS 0 NR 0 0 0 0 1.000DOD 0 NR 0 0 0 0 1.000FUDS 0 NR 0 0 0 0 1.000CONSENT 0 NR 0 0 0 0 1.000ROD 0 NR NR 0 0 0 0.500UMTRA 0 NR NR NR 0 0 0.250MINES 0 NR NR NR NR NR TPTRIS 0 NR NR NR NR NR TPTSCA 0 NR NR NR NR NR TPFTTS 0 NR NR NR NR NR TPHIST FTTS 0 NR NR NR NR NR TPSSTS 0 NR NR NR NR NR TPICIS 0 NR NR NR NR NR TPPADS 0 NR NR NR NR NR TPMLTS 0 NR NR NR NR NR TPRADINFO 0 NR NR NR NR NR TPFINDS 0 NR NR NR NR NR TPRAATS 0 NR 0 0 0 0 1.000CA BOND EXP. PLAN 0 NR NR NR NR NR TPWDS 0 NR NR NR NR NR TPNPDES 0 NR NR 0 0 0 0.500Cortese 0 NR NR 0 0 0 0.500HIST CORTESE 0 NR 0 0 0 0 1.000Notify 65 0 NR NR NR 0 0 0.250DRYCLEANERS 0 NR NR NR 0 0 0.250WIP 0 NR NR NR NR NR TPHAZNET 0 NR NR NR NR NR TPEMI 0 NR 0 0 0 0 1.000INDIAN RESERV 0 NR NR 0 0 0 0.500SCRD DRYCLEANERS 0 NR 0 0 0 0 1.000HWP 0 NR NR NR 0 0 0.250HWT 0 NR NR 0 0 0 0.500COAL ASH EPA 0 NR NR NR NR NR TPFINANCIAL ASSURANCE 0 NR NR NR NR NR TPPCB TRANSFORMER 0 NR NR 0 0 0 0.500PROC 0 NR NR NR 0 0 0.250MWMP 0 NR NR NR NR NR TPCOAL ASH DOE
EDR PROPRIETARY RECORDS
EDR Proprietary Records 0 NR 0 0 0 0 1.000Manufactured Gas Plants
NOTES:
TP = Target Property
NR = Not Requested at this Search Distance
Sites may be listed in more than one database
TC2957885.1s Page 6
C-14

MAP FINDINGSMap IDDirection
EDR ID NumberDistanceEPA ID NumberDatabase(s)SiteElevation
NO SITES FOUND
TC2957885.1s Page 7
C-15

ORPHAN SUMMARY
City EDR ID Site Name Site Address Zip Database(s)
Count: 2 records.
MODESTO S106486414 CLANDESTINE LAB WASTE 19950 HIGHWAY 108 SLICMODESTO 1012056094 1312 MCHENRY 111 1312 MCHENRY 111 US CDL
TC2957885.1s Page 8
C-16

To maintain currency of the following federal and state databases, EDR contacts the appropriate governmental agencyon a monthly or quarterly basis, as required.
Number of Days to Update: Provides confirmation that EDR is reporting records that have been updated within 90 daysfrom the date the government agency made the information available to the public.
STANDARD ENVIRONMENTAL RECORDS
Federal NPL site list
NPL: National Priority ListNational Priorities List (Superfund). The NPL is a subset of CERCLIS and identifies over 1,200 sites for prioritycleanup under the Superfund Program. NPL sites may encompass relatively large areas. As such, EDR provides polygoncoverage for over 1,000 NPL site boundaries produced by EPA’s Environmental Photographic Interpretation Center(EPIC) and regional EPA offices.
Date of Government Version: 07/02/2010Date Data Arrived at EDR: 07/14/2010Date Made Active in Reports: 10/04/2010Number of Days to Update: 82
Source: EPATelephone: N/ALast EDR Contact: 10/13/2010Next Scheduled EDR Contact: 01/24/2011Data Release Frequency: Quarterly
NPL Site Boundaries
Sources:
EPA’s Environmental Photographic Interpretation Center (EPIC)Telephone: 202-564-7333
EPA Region 1 EPA Region 6Telephone 617-918-1143 Telephone: 214-655-6659
EPA Region 3 EPA Region 7Telephone 215-814-5418 Telephone: 913-551-7247
EPA Region 4 EPA Region 8Telephone 404-562-8033 Telephone: 303-312-6774
EPA Region 5 EPA Region 9Telephone 312-886-6686 Telephone: 415-947-4246
EPA Region 10Telephone 206-553-8665
Proposed NPL: Proposed National Priority List SitesA site that has been proposed for listing on the National Priorities List through the issuance of a proposed rulein the Federal Register. EPA then accepts public comments on the site, responds to the comments, and places onthe NPL those sites that continue to meet the requirements for listing.
Date of Government Version: 07/02/2010Date Data Arrived at EDR: 07/14/2010Date Made Active in Reports: 10/04/2010Number of Days to Update: 82
Source: EPATelephone: N/ALast EDR Contact: 10/13/2010Next Scheduled EDR Contact: 01/24/2011Data Release Frequency: Quarterly
NPL LIENS: Federal Superfund LiensFederal Superfund Liens. Under the authority granted the USEPA by CERCLA of 1980, the USEPA has the authorityto file liens against real property in order to recover remedial action expenditures or when the property ownerreceived notification of potential liability. USEPA compiles a listing of filed notices of Superfund Liens.
Date of Government Version: 10/15/1991Date Data Arrived at EDR: 02/02/1994Date Made Active in Reports: 03/30/1994Number of Days to Update: 56
Source: EPATelephone: 202-564-4267Last EDR Contact: 11/22/2010Next Scheduled EDR Contact: 02/28/2011Data Release Frequency: No Update Planned
TC2957885.1s Page GR-1
GOVERNMENT RECORDS SEARCHED / DATA CURRENCY TRACKING
C-17

Federal Delisted NPL site list
DELISTED NPL: National Priority List DeletionsThe National Oil and Hazardous Substances Pollution Contingency Plan (NCP) establishes the criteria that theEPA uses to delete sites from the NPL. In accordance with 40 CFR 300.425.(e), sites may be deleted from theNPL where no further response is appropriate.
Date of Government Version: 07/02/2010Date Data Arrived at EDR: 07/14/2010Date Made Active in Reports: 10/04/2010Number of Days to Update: 82
Source: EPATelephone: N/ALast EDR Contact: 10/13/2010Next Scheduled EDR Contact: 01/24/2011Data Release Frequency: Quarterly
Federal CERCLIS list
CERCLIS: Comprehensive Environmental Response, Compensation, and Liability Information SystemCERCLIS contains data on potentially hazardous waste sites that have been reported to the USEPA by states, municipalities,private companies and private persons, pursuant to Section 103 of the Comprehensive Environmental Response, Compensation,and Liability Act (CERCLA). CERCLIS contains sites which are either proposed to or on the National PrioritiesList (NPL) and sites which are in the screening and assessment phase for possible inclusion on the NPL.
Date of Government Version: 01/29/2010Date Data Arrived at EDR: 02/09/2010Date Made Active in Reports: 04/12/2010Number of Days to Update: 62
Source: EPATelephone: 703-412-9810Last EDR Contact: 12/30/2010Next Scheduled EDR Contact: 04/11/2011Data Release Frequency: Quarterly
FEDERAL FACILITY: Federal Facility Site Information listingA listing of National Priority List (NPL) and Base Realignment and Closure (BRAC) sites found in the ComprehensiveEnvironmental Response, Compensation and Liability Information System (CERCLIS) Database where EPAa??s FederalFacilities Restoration and Reuse Office is involved in cleanup activities.
Date of Government Version: 06/23/2009Date Data Arrived at EDR: 01/15/2010Date Made Active in Reports: 02/10/2010Number of Days to Update: 26
Source: Environmental Protection AgencyTelephone: 703-603-8704Last EDR Contact: 10/13/2010Next Scheduled EDR Contact: 01/24/2011Data Release Frequency: Varies
Federal CERCLIS NFRAP site List
CERCLIS-NFRAP: CERCLIS No Further Remedial Action PlannedArchived sites are sites that have been removed and archived from the inventory of CERCLIS sites. Archived statusindicates that, to the best of EPA’s knowledge, assessment at a site has been completed and that EPA has determinedno further steps will be taken to list this site on the National Priorities List (NPL), unless information indicatesthis decision was not appropriate or other considerations require a recommendation for listing at a later time.This decision does not necessarily mean that there is no hazard associated with a given site; it only means that,based upon available information, the location is not judged to be a potential NPL site.
Date of Government Version: 06/23/2009Date Data Arrived at EDR: 09/02/2009Date Made Active in Reports: 09/21/2009Number of Days to Update: 19
Source: EPATelephone: 703-412-9810Last EDR Contact: 12/01/2010Next Scheduled EDR Contact: 03/14/2011Data Release Frequency: Quarterly
Federal RCRA CORRACTS facilities list
CORRACTS: Corrective Action ReportCORRACTS identifies hazardous waste handlers with RCRA corrective action activity.
TC2957885.1s Page GR-2
GOVERNMENT RECORDS SEARCHED / DATA CURRENCY TRACKING
C-18

Date of Government Version: 05/25/2010Date Data Arrived at EDR: 06/02/2010Date Made Active in Reports: 10/04/2010Number of Days to Update: 124
Source: EPATelephone: 800-424-9346Last EDR Contact: 11/22/2010Next Scheduled EDR Contact: 02/28/2011Data Release Frequency: Quarterly
Federal RCRA non-CORRACTS TSD facilities list
RCRA-TSDF: RCRA - Treatment, Storage and DisposalRCRAInfo is EPA’s comprehensive information system, providing access to data supporting the Resource Conservationand Recovery Act (RCRA) of 1976 and the Hazardous and Solid Waste Amendments (HSWA) of 1984. The databaseincludes selective information on sites which generate, transport, store, treat and/or dispose of hazardous wasteas defined by the Resource Conservation and Recovery Act (RCRA). Transporters are individuals or entities thatmove hazardous waste from the generator offsite to a facility that can recycle, treat, store, or dispose of thewaste. TSDFs treat, store, or dispose of the waste.
Date of Government Version: 02/17/2010Date Data Arrived at EDR: 02/19/2010Date Made Active in Reports: 05/17/2010Number of Days to Update: 87
Source: Environmental Protection AgencyTelephone: (415) 495-8895Last EDR Contact: 10/07/2010Next Scheduled EDR Contact: 01/17/2011Data Release Frequency: Quarterly
Federal RCRA generators list
RCRA-LQG: RCRA - Large Quantity GeneratorsRCRAInfo is EPA’s comprehensive information system, providing access to data supporting the Resource Conservationand Recovery Act (RCRA) of 1976 and the Hazardous and Solid Waste Amendments (HSWA) of 1984. The databaseincludes selective information on sites which generate, transport, store, treat and/or dispose of hazardous wasteas defined by the Resource Conservation and Recovery Act (RCRA). Large quantity generators (LQGs) generateover 1,000 kilograms (kg) of hazardous waste, or over 1 kg of acutely hazardous waste per month.
Date of Government Version: 02/17/2010Date Data Arrived at EDR: 02/19/2010Date Made Active in Reports: 05/17/2010Number of Days to Update: 87
Source: Environmental Protection AgencyTelephone: (415) 495-8895Last EDR Contact: 10/07/2010Next Scheduled EDR Contact: 01/17/2011Data Release Frequency: Quarterly
RCRA-SQG: RCRA - Small Quantity GeneratorsRCRAInfo is EPA’s comprehensive information system, providing access to data supporting the Resource Conservationand Recovery Act (RCRA) of 1976 and the Hazardous and Solid Waste Amendments (HSWA) of 1984. The databaseincludes selective information on sites which generate, transport, store, treat and/or dispose of hazardous wasteas defined by the Resource Conservation and Recovery Act (RCRA). Small quantity generators (SQGs) generatebetween 100 kg and 1,000 kg of hazardous waste per month.
Date of Government Version: 02/17/2010Date Data Arrived at EDR: 02/19/2010Date Made Active in Reports: 05/17/2010Number of Days to Update: 87
Source: Environmental Protection AgencyTelephone: (415) 495-8895Last EDR Contact: 10/07/2010Next Scheduled EDR Contact: 01/17/2011Data Release Frequency: Quarterly
RCRA-CESQG: RCRA - Conditionally Exempt Small Quantity GeneratorsRCRAInfo is EPA’s comprehensive information system, providing access to data supporting the Resource Conservationand Recovery Act (RCRA) of 1976 and the Hazardous and Solid Waste Amendments (HSWA) of 1984. The databaseincludes selective information on sites which generate, transport, store, treat and/or dispose of hazardous wasteas defined by the Resource Conservation and Recovery Act (RCRA). Conditionally exempt small quantity generators(CESQGs) generate less than 100 kg of hazardous waste, or less than 1 kg of acutely hazardous waste per month.
Date of Government Version: 02/17/2010Date Data Arrived at EDR: 02/19/2010Date Made Active in Reports: 05/17/2010Number of Days to Update: 87
Source: Environmental Protection AgencyTelephone: (415) 495-8895Last EDR Contact: 10/07/2010Next Scheduled EDR Contact: 01/17/2011Data Release Frequency: Varies
TC2957885.1s Page GR-3
GOVERNMENT RECORDS SEARCHED / DATA CURRENCY TRACKING
C-19

Federal institutional controls / engineering controls registries
US ENG CONTROLS: Engineering Controls Sites ListA listing of sites with engineering controls in place. Engineering controls include various forms of caps, buildingfoundations, liners, and treatment methods to create pathway elimination for regulated substances to enter environmentalmedia or effect human health.
Date of Government Version: 12/20/2009Date Data Arrived at EDR: 01/20/2010Date Made Active in Reports: 04/12/2010Number of Days to Update: 82
Source: Environmental Protection AgencyTelephone: 703-603-0695Last EDR Contact: 12/10/2010Next Scheduled EDR Contact: 03/28/2011Data Release Frequency: Varies
US INST CONTROL: Sites with Institutional ControlsA listing of sites with institutional controls in place. Institutional controls include administrative measures,such as groundwater use restrictions, construction restrictions, property use restrictions, and post remediationcare requirements intended to prevent exposure to contaminants remaining on site. Deed restrictions are generallyrequired as part of the institutional controls.
Date of Government Version: 12/20/2009Date Data Arrived at EDR: 01/20/2010Date Made Active in Reports: 04/12/2010Number of Days to Update: 82
Source: Environmental Protection AgencyTelephone: 703-603-0695Last EDR Contact: 12/10/2010Next Scheduled EDR Contact: 03/28/2011Data Release Frequency: Varies
Federal ERNS list
ERNS: Emergency Response Notification SystemEmergency Response Notification System. ERNS records and stores information on reported releases of oil and hazardoussubstances.
Date of Government Version: 07/09/2010Date Data Arrived at EDR: 07/09/2010Date Made Active in Reports: 08/17/2010Number of Days to Update: 39
Source: National Response Center, United States Coast GuardTelephone: 202-267-2180Last EDR Contact: 10/06/2010Next Scheduled EDR Contact: 01/17/2011Data Release Frequency: Annually
State- and tribal - equivalent NPL
RESPONSE: State Response SitesIdentifies confirmed release sites where DTSC is involved in remediation, either in a lead or oversight capacity.These confirmed release sites are generally high-priority and high potential risk.
Date of Government Version: 08/18/2010Date Data Arrived at EDR: 09/16/2010Date Made Active in Reports: 09/29/2010Number of Days to Update: 13
Source: Department of Toxic Substances ControlTelephone: 916-323-3400Last EDR Contact: 11/09/2010Next Scheduled EDR Contact: 02/21/2011Data Release Frequency: Quarterly
State- and tribal - equivalent CERCLIS
ENVIROSTOR: EnviroStor DatabaseThe Department of Toxic Substances Control’s (DTSC’s) Site Mitigation and Brownfields Reuse Program’s (SMBRP’s)EnviroStor database identifes sites that have known contamination or sites for which there may be reasons to investigatefurther. The database includes the following site types: Federal Superfund sites (National Priorities List (NPL));State Response, including Military Facilities and State Superfund; Voluntary Cleanup; and School sites. EnviroStorprovides similar information to the information that was available in CalSites, and provides additional site information,including, but not limited to, identification of formerly-contaminated properties that have been released forreuse, properties where environmental deed restrictions have been recorded to prevent inappropriate land uses,and risk characterization information that is used to assess potential impacts to public health and the environmentat contaminated sites.
TC2957885.1s Page GR-4
GOVERNMENT RECORDS SEARCHED / DATA CURRENCY TRACKING
C-20

Date of Government Version: 08/18/2010Date Data Arrived at EDR: 09/16/2010Date Made Active in Reports: 09/29/2010Number of Days to Update: 13
Source: Department of Toxic Substances ControlTelephone: 916-323-3400Last EDR Contact: 11/09/2010Next Scheduled EDR Contact: 02/21/2011Data Release Frequency: Quarterly
State and tribal landfill and/or solid waste disposal site lists
SWF/LF (SWIS): Solid Waste Information SystemActive, Closed and Inactive Landfills. SWF/LF records typically contain an inve ntory of solid waste disposalfacilities or landfills. These may be active or i nactive facilities or open dumps that failed to meet RCRA Section4004 criteria for solid waste landfills or disposal sites.
Date of Government Version: 08/23/2010Date Data Arrived at EDR: 08/24/2010Date Made Active in Reports: 09/29/2010Number of Days to Update: 36
Source: Department of Resources Recycling and RecoveryTelephone: 916-341-6320Last EDR Contact: 11/23/2010Next Scheduled EDR Contact: 03/07/2011Data Release Frequency: Quarterly
State and tribal leaking storage tank lists
LUST REG 9: Leaking Underground Storage Tank ReportOrange, Riverside, San Diego counties. For more current information, please refer to the State Water ResourcesControl Board’s LUST database.
Date of Government Version: 03/01/2001Date Data Arrived at EDR: 04/23/2001Date Made Active in Reports: 05/21/2001Number of Days to Update: 28
Source: California Regional Water Quality Control Board San Diego Region (9)Telephone: 858-637-5595Last EDR Contact: 12/22/2010Next Scheduled EDR Contact: 04/11/2011Data Release Frequency: No Update Planned
LUST REG 7: Leaking Underground Storage Tank Case ListingLeaking Underground Storage Tank locations. Imperial, Riverside, San Diego, Santa Barbara counties.
Date of Government Version: 02/26/2004Date Data Arrived at EDR: 02/26/2004Date Made Active in Reports: 03/24/2004Number of Days to Update: 27
Source: California Regional Water Quality Control Board Colorado River Basin Region (7)Telephone: 760-776-8943Last EDR Contact: 11/01/2011Next Scheduled EDR Contact: 02/14/2011Data Release Frequency: No Update Planned
LUST REG 6V: Leaking Underground Storage Tank Case ListingLeaking Underground Storage Tank locations. Inyo, Kern, Los Angeles, Mono, San Bernardino counties.
Date of Government Version: 06/07/2005Date Data Arrived at EDR: 06/07/2005Date Made Active in Reports: 06/29/2005Number of Days to Update: 22
Source: California Regional Water Quality Control Board Victorville Branch Office (6)Telephone: 760-241-7365Last EDR Contact: 12/10/2010Next Scheduled EDR Contact: 03/28/2011Data Release Frequency: No Update Planned
LUST REG 6L: Leaking Underground Storage Tank Case ListingFor more current information, please refer to the State Water Resources Control Board’s LUST database.
Date of Government Version: 09/09/2003Date Data Arrived at EDR: 09/10/2003Date Made Active in Reports: 10/07/2003Number of Days to Update: 27
Source: California Regional Water Quality Control Board Lahontan Region (6)Telephone: 530-542-5572Last EDR Contact: 12/10/2010Next Scheduled EDR Contact: 03/28/2011Data Release Frequency: No Update Planned
LUST REG 5: Leaking Underground Storage Tank DatabaseLeaking Underground Storage Tank locations. Alameda, Alpine, Amador, Butte, Colusa, Contra Costa, Calveras, ElDorado, Fresno, Glenn, Kern, Kings, Lake, Lassen, Madera, Mariposa, Merced, Modoc, Napa, Nevada, Placer, Plumas,Sacramento, San Joaquin, Shasta, Solano, Stanislaus, Sutter, Tehama, Tulare, Tuolumne, Yolo, Yuba counties.
TC2957885.1s Page GR-5
GOVERNMENT RECORDS SEARCHED / DATA CURRENCY TRACKING
C-21

Date of Government Version: 07/01/2008Date Data Arrived at EDR: 07/22/2008Date Made Active in Reports: 07/31/2008Number of Days to Update: 9
Source: California Regional Water Quality Control Board Central Valley Region (5)Telephone: 916-464-4834Last EDR Contact: 01/03/2011Next Scheduled EDR Contact: 04/18/2011Data Release Frequency: Quarterly
LUST REG 4: Underground Storage Tank Leak ListLos Angeles, Ventura counties. For more current information, please refer to the State Water Resources ControlBoard’s LUST database.
Date of Government Version: 09/07/2004Date Data Arrived at EDR: 09/07/2004Date Made Active in Reports: 10/12/2004Number of Days to Update: 35
Source: California Regional Water Quality Control Board Los Angeles Region (4)Telephone: 213-576-6710Last EDR Contact: 12/06/2010Next Scheduled EDR Contact: 03/21/2011Data Release Frequency: No Update Planned
LUST REG 3: Leaking Underground Storage Tank DatabaseLeaking Underground Storage Tank locations. Monterey, San Benito, San Luis Obispo, Santa Barbara, Santa Cruz counties.
Date of Government Version: 05/19/2003Date Data Arrived at EDR: 05/19/2003Date Made Active in Reports: 06/02/2003Number of Days to Update: 14
Source: California Regional Water Quality Control Board Central Coast Region (3)Telephone: 805-542-4786Last EDR Contact: 10/18/2010Next Scheduled EDR Contact: 01/31/2011Data Release Frequency: No Update Planned
LUST REG 2: Fuel Leak ListLeaking Underground Storage Tank locations. Alameda, Contra Costa, Marin, Napa, San Francisco, San Mateo, SantaClara, Solano, Sonoma counties.
Date of Government Version: 09/30/2004Date Data Arrived at EDR: 10/20/2004Date Made Active in Reports: 11/19/2004Number of Days to Update: 30
Source: California Regional Water Quality Control Board San Francisco Bay Region (2)Telephone: 510-622-2433Last EDR Contact: 12/16/2010Next Scheduled EDR Contact: 04/04/2011Data Release Frequency: Quarterly
LUST REG 1: Active Toxic Site InvestigationDel Norte, Humboldt, Lake, Mendocino, Modoc, Siskiyou, Sonoma, Trinity counties. For more current information,please refer to the State Water Resources Control Board’s LUST database.
Date of Government Version: 02/01/2001Date Data Arrived at EDR: 02/28/2001Date Made Active in Reports: 03/29/2001Number of Days to Update: 29
Source: California Regional Water Quality Control Board North Coast (1)Telephone: 707-570-3769Last EDR Contact: 11/01/2010Next Scheduled EDR Contact: 02/14/2011Data Release Frequency: No Update Planned
LUST: Geotracker’s Leaking Underground Fuel Tank ReportLeaking Underground Storage Tank Incident Reports. LUST records contain an inventory of reported leaking undergroundstorage tank incidents. Not all states maintain these records, and the information stored varies by state. Formore information on a particular leaking underground storage tank sites, please contact the appropriate regulatoryagency.
Date of Government Version: 10/28/2010Date Data Arrived at EDR: 10/28/2010Date Made Active in Reports: 11/17/2010Number of Days to Update: 20
Source: State Water Resources Control BoardTelephone: see region listLast EDR Contact: 12/16/2010Next Scheduled EDR Contact: 04/04/2011Data Release Frequency: Quarterly
LUST REG 8: Leaking Underground Storage TanksCalifornia Regional Water Quality Control Board Santa Ana Region (8). For more current information, please referto the State Water Resources Control Board’s LUST database.
TC2957885.1s Page GR-6
GOVERNMENT RECORDS SEARCHED / DATA CURRENCY TRACKING
C-22

Date of Government Version: 02/14/2005Date Data Arrived at EDR: 02/15/2005Date Made Active in Reports: 03/28/2005Number of Days to Update: 41
Source: California Regional Water Quality Control Board Santa Ana Region (8)Telephone: 909-782-4496Last EDR Contact: 10/18/2010Next Scheduled EDR Contact: 01/31/2011Data Release Frequency: Varies
SLIC: Statewide SLIC CasesThe SLIC (Spills, Leaks, Investigations and Cleanup) program is designed to protect and restore water qualityfrom spills, leaks, and similar discharges.
Date of Government Version: 10/28/2010Date Data Arrived at EDR: 10/28/2010Date Made Active in Reports: 11/17/2010Number of Days to Update: 20
Source: State Water Resources Control BoardTelephone: 866-480-1028Last EDR Contact: 12/16/2010Next Scheduled EDR Contact: 04/04/2011Data Release Frequency: Varies
SLIC REG 1: Active Toxic Site InvestigationsThe SLIC (Spills, Leaks, Investigations and Cleanup) program is designed to protect and restore water qualityfrom spills, leaks, and similar discharges.
Date of Government Version: 04/03/2003Date Data Arrived at EDR: 04/07/2003Date Made Active in Reports: 04/25/2003Number of Days to Update: 18
Source: California Regional Water Quality Control Board, North Coast Region (1)Telephone: 707-576-2220Last EDR Contact: 11/01/2010Next Scheduled EDR Contact: 02/14/2011Data Release Frequency: No Update Planned
SLIC REG 2: Spills, Leaks, Investigation & Cleanup Cost Recovery ListingThe SLIC (Spills, Leaks, Investigations and Cleanup) program is designed to protect and restore water qualityfrom spills, leaks, and similar discharges.
Date of Government Version: 09/30/2004Date Data Arrived at EDR: 10/20/2004Date Made Active in Reports: 11/19/2004Number of Days to Update: 30
Source: Regional Water Quality Control Board San Francisco Bay Region (2)Telephone: 510-286-0457Last EDR Contact: 12/16/2010Next Scheduled EDR Contact: 04/04/2011Data Release Frequency: Quarterly
SLIC REG 3: Spills, Leaks, Investigation & Cleanup Cost Recovery ListingThe SLIC (Spills, Leaks, Investigations and Cleanup) program is designed to protect and restore water qualityfrom spills, leaks, and similar discharges.
Date of Government Version: 05/18/2006Date Data Arrived at EDR: 05/18/2006Date Made Active in Reports: 06/15/2006Number of Days to Update: 28
Source: California Regional Water Quality Control Board Central Coast Region (3)Telephone: 805-549-3147Last EDR Contact: 10/18/2010Next Scheduled EDR Contact: 01/31/2011Data Release Frequency: Semi-Annually
SLIC REG 4: Spills, Leaks, Investigation & Cleanup Cost Recovery ListingThe SLIC (Spills, Leaks, Investigations and Cleanup) program is designed to protect and restore water qualityfrom spills, leaks, and similar discharges.
Date of Government Version: 11/17/2004Date Data Arrived at EDR: 11/18/2004Date Made Active in Reports: 01/04/2005Number of Days to Update: 47
Source: Region Water Quality Control Board Los Angeles Region (4)Telephone: 213-576-6600Last EDR Contact: 01/03/2011Next Scheduled EDR Contact: 04/18/2011Data Release Frequency: Varies
SLIC REG 5: Spills, Leaks, Investigation & Cleanup Cost Recovery ListingThe SLIC (Spills, Leaks, Investigations and Cleanup) program is designed to protect and restore water qualityfrom spills, leaks, and similar discharges.
TC2957885.1s Page GR-7
GOVERNMENT RECORDS SEARCHED / DATA CURRENCY TRACKING
C-23

Date of Government Version: 04/01/2005Date Data Arrived at EDR: 04/05/2005Date Made Active in Reports: 04/21/2005Number of Days to Update: 16
Source: Regional Water Quality Control Board Central Valley Region (5)Telephone: 916-464-3291Last EDR Contact: 12/10/2010Next Scheduled EDR Contact: 03/28/2011Data Release Frequency: Semi-Annually
SLIC REG 6V: Spills, Leaks, Investigation & Cleanup Cost Recovery ListingThe SLIC (Spills, Leaks, Investigations and Cleanup) program is designed to protect and restore water qualityfrom spills, leaks, and similar discharges.
Date of Government Version: 05/24/2005Date Data Arrived at EDR: 05/25/2005Date Made Active in Reports: 06/16/2005Number of Days to Update: 22
Source: Regional Water Quality Control Board, Victorville BranchTelephone: 619-241-6583Last EDR Contact: 11/22/2010Next Scheduled EDR Contact: 02/28/2011Data Release Frequency: Semi-Annually
SLIC REG 6L: SLIC SitesThe SLIC (Spills, Leaks, Investigations and Cleanup) program is designed to protect and restore water qualityfrom spills, leaks, and similar discharges.
Date of Government Version: 09/07/2004Date Data Arrived at EDR: 09/07/2004Date Made Active in Reports: 10/12/2004Number of Days to Update: 35
Source: California Regional Water Quality Control Board, Lahontan RegionTelephone: 530-542-5574Last EDR Contact: 11/22/2010Next Scheduled EDR Contact: 02/28/2011Data Release Frequency: No Update Planned
SLIC REG 7: SLIC ListThe SLIC (Spills, Leaks, Investigations and Cleanup) program is designed to protect and restore water qualityfrom spills, leaks, and similar discharges.
Date of Government Version: 11/24/2004Date Data Arrived at EDR: 11/29/2004Date Made Active in Reports: 01/04/2005Number of Days to Update: 36
Source: California Regional Quality Control Board, Colorado River Basin RegionTelephone: 760-346-7491Last EDR Contact: 11/01/2010Next Scheduled EDR Contact: 02/14/2011Data Release Frequency: No Update Planned
SLIC REG 8: Spills, Leaks, Investigation & Cleanup Cost Recovery ListingThe SLIC (Spills, Leaks, Investigations and Cleanup) program is designed to protect and restore water qualityfrom spills, leaks, and similar discharges.
Date of Government Version: 04/03/2008Date Data Arrived at EDR: 04/03/2008Date Made Active in Reports: 04/14/2008Number of Days to Update: 11
Source: California Region Water Quality Control Board Santa Ana Region (8)Telephone: 951-782-3298Last EDR Contact: 12/10/2010Next Scheduled EDR Contact: 03/28/2011Data Release Frequency: Semi-Annually
SLIC REG 9: Spills, Leaks, Investigation & Cleanup Cost Recovery ListingThe SLIC (Spills, Leaks, Investigations and Cleanup) program is designed to protect and restore water qualityfrom spills, leaks, and similar discharges.
Date of Government Version: 09/10/2007Date Data Arrived at EDR: 09/11/2007Date Made Active in Reports: 09/28/2007Number of Days to Update: 17
Source: California Regional Water Quality Control Board San Diego Region (9)Telephone: 858-467-2980Last EDR Contact: 11/08/2010Next Scheduled EDR Contact: 02/21/2011Data Release Frequency: Annually
INDIAN LUST R10: Leaking Underground Storage Tanks on Indian LandLUSTs on Indian land in Alaska, Idaho, Oregon and Washington.
TC2957885.1s Page GR-8
GOVERNMENT RECORDS SEARCHED / DATA CURRENCY TRACKING
C-24

Date of Government Version: 08/05/2010Date Data Arrived at EDR: 08/06/2010Date Made Active in Reports: 10/04/2010Number of Days to Update: 59
Source: EPA Region 10Telephone: 206-553-2857Last EDR Contact: 11/01/2010Next Scheduled EDR Contact: 02/14/2011Data Release Frequency: Quarterly
INDIAN LUST R1: Leaking Underground Storage Tanks on Indian LandA listing of leaking underground storage tank locations on Indian Land.
Date of Government Version: 02/19/2009Date Data Arrived at EDR: 02/19/2009Date Made Active in Reports: 03/16/2009Number of Days to Update: 25
Source: EPA Region 1Telephone: 617-918-1313Last EDR Contact: 11/02/2010Next Scheduled EDR Contact: 02/14/2011Data Release Frequency: Varies
INDIAN LUST R8: Leaking Underground Storage Tanks on Indian LandLUSTs on Indian land in Colorado, Montana, North Dakota, South Dakota, Utah and Wyoming.
Date of Government Version: 05/24/2010Date Data Arrived at EDR: 05/27/2010Date Made Active in Reports: 08/09/2010Number of Days to Update: 74
Source: EPA Region 8Telephone: 303-312-6271Last EDR Contact: 11/01/2010Next Scheduled EDR Contact: 02/14/2011Data Release Frequency: Quarterly
INDIAN LUST R6: Leaking Underground Storage Tanks on Indian LandLUSTs on Indian land in New Mexico and Oklahoma.
Date of Government Version: 08/05/2010Date Data Arrived at EDR: 08/06/2010Date Made Active in Reports: 10/04/2010Number of Days to Update: 59
Source: EPA Region 6Telephone: 214-665-6597Last EDR Contact: 11/01/2010Next Scheduled EDR Contact: 02/14/2011Data Release Frequency: Varies
INDIAN LUST R4: Leaking Underground Storage Tanks on Indian LandLUSTs on Indian land in Florida, Mississippi and North Carolina.
Date of Government Version: 08/27/2010Date Data Arrived at EDR: 08/30/2010Date Made Active in Reports: 10/04/2010Number of Days to Update: 35
Source: EPA Region 4Telephone: 404-562-8677Last EDR Contact: 11/01/2010Next Scheduled EDR Contact: 02/14/2011Data Release Frequency: Semi-Annually
INDIAN LUST R9: Leaking Underground Storage Tanks on Indian LandLUSTs on Indian land in Arizona, California, New Mexico and Nevada
Date of Government Version: 08/30/2010Date Data Arrived at EDR: 08/30/2010Date Made Active in Reports: 10/04/2010Number of Days to Update: 35
Source: Environmental Protection AgencyTelephone: 415-972-3372Last EDR Contact: 11/01/2010Next Scheduled EDR Contact: 02/14/2011Data Release Frequency: Quarterly
INDIAN LUST R7: Leaking Underground Storage Tanks on Indian LandLUSTs on Indian land in Iowa, Kansas, and Nebraska
Date of Government Version: 11/04/2009Date Data Arrived at EDR: 05/04/2010Date Made Active in Reports: 07/07/2010Number of Days to Update: 64
Source: EPA Region 7Telephone: 913-551-7003Last EDR Contact: 12/03/2010Next Scheduled EDR Contact: 02/14/2011Data Release Frequency: Varies
State and tribal registered storage tank lists
TC2957885.1s Page GR-9
GOVERNMENT RECORDS SEARCHED / DATA CURRENCY TRACKING
C-25

UST: Active UST FacilitiesActive UST facilities gathered from the local regulatory agencies
Date of Government Version: 10/28/2010Date Data Arrived at EDR: 10/28/2010Date Made Active in Reports: 11/18/2010Number of Days to Update: 21
Source: SWRCBTelephone: 916-480-1028Last EDR Contact: 12/16/2010Next Scheduled EDR Contact: 04/04/2011Data Release Frequency: Semi-Annually
AST: Aboveground Petroleum Storage Tank FacilitiesRegistered Aboveground Storage Tanks.
Date of Government Version: 08/01/2009Date Data Arrived at EDR: 09/10/2009Date Made Active in Reports: 10/01/2009Number of Days to Update: 21
Source: State Water Resources Control BoardTelephone: 916-341-5712Last EDR Contact: 10/12/2010Next Scheduled EDR Contact: 01/24/2011Data Release Frequency: Quarterly
INDIAN UST R10: Underground Storage Tanks on Indian LandThe Indian Underground Storage Tank (UST) database provides information about underground storage tanks on Indianland in EPA Region 10 (Alaska, Idaho, Oregon, Washington, and Tribal Nations).
Date of Government Version: 08/05/2010Date Data Arrived at EDR: 08/06/2010Date Made Active in Reports: 10/04/2010Number of Days to Update: 59
Source: EPA Region 10Telephone: 206-553-2857Last EDR Contact: 11/01/2010Next Scheduled EDR Contact: 02/14/2011Data Release Frequency: Quarterly
INDIAN UST R9: Underground Storage Tanks on Indian LandThe Indian Underground Storage Tank (UST) database provides information about underground storage tanks on Indianland in EPA Region 9 (Arizona, California, Hawaii, Nevada, the Pacific Islands, and Tribal Nations).
Date of Government Version: 08/30/2010Date Data Arrived at EDR: 08/30/2010Date Made Active in Reports: 10/04/2010Number of Days to Update: 35
Source: EPA Region 9Telephone: 415-972-3368Last EDR Contact: 11/01/2010Next Scheduled EDR Contact: 02/14/2011Data Release Frequency: Quarterly
INDIAN UST R8: Underground Storage Tanks on Indian LandThe Indian Underground Storage Tank (UST) database provides information about underground storage tanks on Indianland in EPA Region 8 (Colorado, Montana, North Dakota, South Dakota, Utah, Wyoming and 27 Tribal Nations).
Date of Government Version: 05/24/2010Date Data Arrived at EDR: 05/27/2010Date Made Active in Reports: 08/09/2010Number of Days to Update: 74
Source: EPA Region 8Telephone: 303-312-6137Last EDR Contact: 11/01/2010Next Scheduled EDR Contact: 02/14/2011Data Release Frequency: Quarterly
INDIAN UST R7: Underground Storage Tanks on Indian LandThe Indian Underground Storage Tank (UST) database provides information about underground storage tanks on Indianland in EPA Region 7 (Iowa, Kansas, Missouri, Nebraska, and 9 Tribal Nations).
Date of Government Version: 04/01/2008Date Data Arrived at EDR: 12/30/2008Date Made Active in Reports: 03/16/2009Number of Days to Update: 76
Source: EPA Region 7Telephone: 913-551-7003Last EDR Contact: 11/09/2010Next Scheduled EDR Contact: 02/14/2011Data Release Frequency: Varies
INDIAN UST R6: Underground Storage Tanks on Indian LandThe Indian Underground Storage Tank (UST) database provides information about underground storage tanks on Indianland in EPA Region 6 (Louisiana, Arkansas, Oklahoma, New Mexico, Texas and 65 Tribes).
TC2957885.1s Page GR-10
GOVERNMENT RECORDS SEARCHED / DATA CURRENCY TRACKING
C-26

Date of Government Version: 08/03/2010Date Data Arrived at EDR: 08/04/2010Date Made Active in Reports: 10/04/2010Number of Days to Update: 61
Source: EPA Region 6Telephone: 214-665-7591Last EDR Contact: 11/01/2010Next Scheduled EDR Contact: 02/14/2011Data Release Frequency: Semi-Annually
INDIAN UST R5: Underground Storage Tanks on Indian LandThe Indian Underground Storage Tank (UST) database provides information about underground storage tanks on Indianland in EPA Region 5 (Michigan, Minnesota and Wisconsin and Tribal Nations).
Date of Government Version: 02/11/2010Date Data Arrived at EDR: 02/11/2010Date Made Active in Reports: 04/12/2010Number of Days to Update: 60
Source: EPA Region 5Telephone: 312-886-6136Last EDR Contact: 11/01/2010Next Scheduled EDR Contact: 02/14/2011Data Release Frequency: Varies
INDIAN UST R4: Underground Storage Tanks on Indian LandThe Indian Underground Storage Tank (UST) database provides information about underground storage tanks on Indianland in EPA Region 4 (Alabama, Florida, Georgia, Kentucky, Mississippi, North Carolina, South Carolina, Tennesseeand Tribal Nations)
Date of Government Version: 08/27/2010Date Data Arrived at EDR: 08/30/2010Date Made Active in Reports: 10/04/2010Number of Days to Update: 35
Source: EPA Region 4Telephone: 404-562-9424Last EDR Contact: 11/01/2010Next Scheduled EDR Contact: 02/14/2011Data Release Frequency: Semi-Annually
INDIAN UST R1: Underground Storage Tanks on Indian LandThe Indian Underground Storage Tank (UST) database provides information about underground storage tanks on Indianland in EPA Region 1 (Connecticut, Maine, Massachusetts, New Hampshire, Rhode Island, Vermont and ten TribalNations).
Date of Government Version: 02/19/2009Date Data Arrived at EDR: 02/19/2009Date Made Active in Reports: 03/16/2009Number of Days to Update: 25
Source: EPA, Region 1Telephone: 617-918-1313Last EDR Contact: 11/02/2010Next Scheduled EDR Contact: 02/14/2011Data Release Frequency: Varies
FEMA UST: Underground Storage Tank ListingA listing of all FEMA owned underground storage tanks.
Date of Government Version: 01/01/2010Date Data Arrived at EDR: 02/16/2010Date Made Active in Reports: 04/12/2010Number of Days to Update: 55
Source: FEMATelephone: 202-646-5797Last EDR Contact: 10/29/2010Next Scheduled EDR Contact: 01/31/2011Data Release Frequency: Varies
State and tribal voluntary cleanup sites
INDIAN VCP R7: Voluntary Cleanup Priority LisitngA listing of voluntary cleanup priority sites located on Indian Land located in Region 7.
Date of Government Version: 03/20/2008Date Data Arrived at EDR: 04/22/2008Date Made Active in Reports: 05/19/2008Number of Days to Update: 27
Source: EPA, Region 7Telephone: 913-551-7365Last EDR Contact: 04/20/2009Next Scheduled EDR Contact: 07/20/2009Data Release Frequency: Varies
VCP: Voluntary Cleanup Program PropertiesContains low threat level properties with either confirmed or unconfirmed releases and the project proponentshave request that DTSC oversee investigation and/or cleanup activities and have agreed to provide coverage forDTSC’s costs.
TC2957885.1s Page GR-11
GOVERNMENT RECORDS SEARCHED / DATA CURRENCY TRACKING
C-27

Date of Government Version: 08/18/2010Date Data Arrived at EDR: 09/16/2010Date Made Active in Reports: 09/29/2010Number of Days to Update: 13
Source: Department of Toxic Substances ControlTelephone: 916-323-3400Last EDR Contact: 11/09/2010Next Scheduled EDR Contact: 02/21/2011Data Release Frequency: Quarterly
INDIAN VCP R1: Voluntary Cleanup Priority ListingA listing of voluntary cleanup priority sites located on Indian Land located in Region 1.
Date of Government Version: 04/02/2008Date Data Arrived at EDR: 04/22/2008Date Made Active in Reports: 05/19/2008Number of Days to Update: 27
Source: EPA, Region 1Telephone: 617-918-1102Last EDR Contact: 10/04/2010Next Scheduled EDR Contact: 01/17/2011Data Release Frequency: Varies
ADDITIONAL ENVIRONMENTAL RECORDS
Local Brownfield lists
US BROWNFIELDS: A Listing of Brownfields SitesIncluded in the listing are brownfields properties addresses by Cooperative Agreement Recipients and brownfieldsproperties addressed by Targeted Brownfields Assessments. Targeted Brownfields Assessments-EPA’s Targeted BrownfieldsAssessments (TBA) program is designed to help states, tribes, and municipalities--especially those without EPABrownfields Assessment Demonstration Pilots--minimize the uncertainties of contamination often associated withbrownfields. Under the TBA program, EPA provides funding and/or technical assistance for environmental assessmentsat brownfields sites throughout the country. Targeted Brownfields Assessments supplement and work with other effortsunder EPA’s Brownfields Initiative to promote cleanup and redevelopment of brownfields. Cooperative AgreementRecipients-States, political subdivisions, territories, and Indian tribes become Brownfields Cleanup RevolvingLoan Fund (BCRLF) cooperative agreement recipients when they enter into BCRLF cooperative agreements with theU.S. EPA. EPA selects BCRLF cooperative agreement recipients based on a proposal and application process. BCRLFcooperative agreement recipients must use EPA funds provided through BCRLF cooperative agreement for specifiedbrownfields-related cleanup activities.
Date of Government Version: 06/24/2010Date Data Arrived at EDR: 06/25/2010Date Made Active in Reports: 08/17/2010Number of Days to Update: 53
Source: Environmental Protection AgencyTelephone: 202-566-2777Last EDR Contact: 12/30/2010Next Scheduled EDR Contact: 04/11/2011Data Release Frequency: Semi-Annually
Local Lists of Landfill / Solid Waste Disposal Sites
ODI: Open Dump InventoryAn open dump is defined as a disposal facility that does not comply with one or more of the Part 257 or Part 258Subtitle D Criteria.
Date of Government Version: 06/30/1985Date Data Arrived at EDR: 08/09/2004Date Made Active in Reports: 09/17/2004Number of Days to Update: 39
Source: Environmental Protection AgencyTelephone: 800-424-9346Last EDR Contact: 06/09/2004Next Scheduled EDR Contact: N/AData Release Frequency: No Update Planned
DEBRIS REGION 9: Torres Martinez Reservation Illegal Dump Site LocationsA listing of illegal dump sites location on the Torres Martinez Indian Reservation located in eastern RiversideCounty and northern Imperial County, California.
Date of Government Version: 01/12/2009Date Data Arrived at EDR: 05/07/2009Date Made Active in Reports: 09/21/2009Number of Days to Update: 137
Source: EPA, Region 9Telephone: 415-947-4219Last EDR Contact: 12/22/2010Next Scheduled EDR Contact: 04/11/2011Data Release Frequency: No Update Planned
TC2957885.1s Page GR-12
GOVERNMENT RECORDS SEARCHED / DATA CURRENCY TRACKING
C-28

WMUDS/SWAT: Waste Management Unit DatabaseWaste Management Unit Database System. WMUDS is used by the State Water Resources Control Board staff and theRegional Water Quality Control Boards for program tracking and inventory of waste management units. WMUDS is composedof the following databases: Facility Information, Scheduled Inspections Information, Waste Management Unit Information,SWAT Program Information, SWAT Report Summary Information, SWAT Report Summary Data, Chapter 15 (formerly Subchapter15) Information, Chapter 15 Monitoring Parameters, TPCA Program Information, RCRA Program Information, ClosureInformation, and Interested Parties Information.
Date of Government Version: 04/01/2000Date Data Arrived at EDR: 04/10/2000Date Made Active in Reports: 05/10/2000Number of Days to Update: 30
Source: State Water Resources Control BoardTelephone: 916-227-4448Last EDR Contact: 11/22/2010Next Scheduled EDR Contact: 02/28/2011Data Release Frequency: Quarterly
SWRCY: Recycler DatabaseA listing of recycling facilities in California.
Date of Government Version: 07/23/2010Date Data Arrived at EDR: 09/21/2010Date Made Active in Reports: 09/29/2010Number of Days to Update: 8
Source: Department of ConservationTelephone: 916-323-3836Last EDR Contact: 12/23/2010Next Scheduled EDR Contact: 04/04/2011Data Release Frequency: Quarterly
HAULERS: Registered Waste Tire Haulers ListingA listing of registered waste tire haulers.
Date of Government Version: 09/27/2010Date Data Arrived at EDR: 09/28/2010Date Made Active in Reports: 10/18/2010Number of Days to Update: 20
Source: Integrated Waste Management BoardTelephone: 916-341-6422Last EDR Contact: 11/23/2010Next Scheduled EDR Contact: 03/07/2011Data Release Frequency: Varies
INDIAN ODI: Report on the Status of Open Dumps on Indian LandsLocation of open dumps on Indian land.
Date of Government Version: 12/31/1998Date Data Arrived at EDR: 12/03/2007Date Made Active in Reports: 01/24/2008Number of Days to Update: 52
Source: Environmental Protection AgencyTelephone: 703-308-8245Last EDR Contact: 11/09/2010Next Scheduled EDR Contact: 02/21/2011Data Release Frequency: Varies
Local Lists of Hazardous waste / Contaminated Sites
US CDL: Clandestine Drug LabsA listing of clandestine drug lab locations. The U.S. Department of Justice ("the Department") provides thisweb site as a public service. It contains addresses of some locations where law enforcement agencies reportedthey found chemicals or other items that indicated the presence of either clandestine drug laboratories or dumpsites.In most cases, the source of the entries is not the Department, and the Department has not verified the entryand does not guarantee its accuracy. Members of the public must verify the accuracy of all entries by, for example,contacting local law enforcement and local health departments.
Date of Government Version: 05/07/2010Date Data Arrived at EDR: 06/18/2010Date Made Active in Reports: 08/17/2010Number of Days to Update: 60
Source: Drug Enforcement AdministrationTelephone: 202-307-1000Last EDR Contact: 12/08/2010Next Scheduled EDR Contact: 03/21/2011Data Release Frequency: Quarterly
HIST CAL-SITES: Calsites DatabaseThe Calsites database contains potential or confirmed hazardous substance release properties. In 1996, CaliforniaEPA reevaluated and significantly reduced the number of sites in the Calsites database. No longer updated by thestate agency. It has been replaced by ENVIROSTOR.
TC2957885.1s Page GR-13
GOVERNMENT RECORDS SEARCHED / DATA CURRENCY TRACKING
C-29

Date of Government Version: 08/08/2005Date Data Arrived at EDR: 08/03/2006Date Made Active in Reports: 08/24/2006Number of Days to Update: 21
Source: Department of Toxic Substance ControlTelephone: 916-323-3400Last EDR Contact: 02/23/2009Next Scheduled EDR Contact: 05/25/2009Data Release Frequency: No Update Planned
SCH: School Property Evaluation ProgramThis category contains proposed and existing school sites that are being evaluated by DTSC for possible hazardousmaterials contamination. In some cases, these properties may be listed in the CalSites category depending on thelevel of threat to public health and safety or the environment they pose.
Date of Government Version: 08/18/2010Date Data Arrived at EDR: 09/16/2010Date Made Active in Reports: 09/29/2010Number of Days to Update: 13
Source: Department of Toxic Substances ControlTelephone: 916-323-3400Last EDR Contact: 11/09/2010Next Scheduled EDR Contact: 02/21/2011Data Release Frequency: Quarterly
TOXIC PITS: Toxic Pits Cleanup Act SitesToxic PITS Cleanup Act Sites. TOXIC PITS identifies sites suspected of containing hazardous substances where cleanuphas not yet been completed.
Date of Government Version: 07/01/1995Date Data Arrived at EDR: 08/30/1995Date Made Active in Reports: 09/26/1995Number of Days to Update: 27
Source: State Water Resources Control BoardTelephone: 916-227-4364Last EDR Contact: 01/26/2009Next Scheduled EDR Contact: 04/27/2009Data Release Frequency: No Update Planned
CDL: Clandestine Drug LabsA listing of drug lab locations. Listing of a location in this database does not indicate that any illegal druglab materials were or were not present there, and does not constitute a determination that the location eitherrequires or does not require additional cleanup work.
Date of Government Version: 08/19/2010Date Data Arrived at EDR: 08/23/2010Date Made Active in Reports: 09/29/2010Number of Days to Update: 37
Source: Department of Toxic Substances ControlTelephone: 916-255-6504Last EDR Contact: 01/03/2011Next Scheduled EDR Contact: 04/18/2011Data Release Frequency: Varies
US HIST CDL: National Clandestine Laboratory RegisterA listing of clandestine drug lab locations. The U.S. Department of Justice ("the Department") provides thisweb site as a public service. It contains addresses of some locations where law enforcement agencies reportedthey found chemicals or other items that indicated the presence of either clandestine drug laboratories or dumpsites.In most cases, the source of the entries is not the Department, and the Department has not verified the entryand does not guarantee its accuracy. Members of the public must verify the accuracy of all entries by, for example,contacting local law enforcement and local health departments.
Date of Government Version: 09/01/2007Date Data Arrived at EDR: 11/19/2008Date Made Active in Reports: 03/30/2009Number of Days to Update: 131
Source: Drug Enforcement AdministrationTelephone: 202-307-1000Last EDR Contact: 03/23/2009Next Scheduled EDR Contact: 06/22/2009Data Release Frequency: No Update Planned
Local Lists of Registered Storage Tanks
CA FID UST: Facility Inventory DatabaseThe Facility Inventory Database (FID) contains a historical listing of active and inactive underground storagetank locations from the State Water Resource Control Board. Refer to local/county source for current data.
Date of Government Version: 10/31/1994Date Data Arrived at EDR: 09/05/1995Date Made Active in Reports: 09/29/1995Number of Days to Update: 24
Source: California Environmental Protection AgencyTelephone: 916-341-5851Last EDR Contact: 12/28/1998Next Scheduled EDR Contact: N/AData Release Frequency: No Update Planned
TC2957885.1s Page GR-14
GOVERNMENT RECORDS SEARCHED / DATA CURRENCY TRACKING
C-30

UST MENDOCINO: Mendocino County UST DatabaseA listing of underground storage tank locations in Mendocino County.
Date of Government Version: 09/23/2009Date Data Arrived at EDR: 09/23/2009Date Made Active in Reports: 10/01/2009Number of Days to Update: 8
Source: Department of Public HealthTelephone: 707-463-4466Last EDR Contact: 12/06/2010Next Scheduled EDR Contact: 03/21/2011Data Release Frequency: Annually
HIST UST: Hazardous Substance Storage Container DatabaseThe Hazardous Substance Storage Container Database is a historical listing of UST sites. Refer to local/countysource for current data.
Date of Government Version: 10/15/1990Date Data Arrived at EDR: 01/25/1991Date Made Active in Reports: 02/12/1991Number of Days to Update: 18
Source: State Water Resources Control BoardTelephone: 916-341-5851Last EDR Contact: 07/26/2001Next Scheduled EDR Contact: N/AData Release Frequency: No Update Planned
SWEEPS UST: SWEEPS UST ListingStatewide Environmental Evaluation and Planning System. This underground storage tank listing was updated andmaintained by a company contacted by the SWRCB in the early 1990’s. The listing is no longer updated or maintained.The local agency is the contact for more information on a site on the SWEEPS list.
Date of Government Version: 06/01/1994Date Data Arrived at EDR: 07/07/2005Date Made Active in Reports: 08/11/2005Number of Days to Update: 35
Source: State Water Resources Control BoardTelephone: N/ALast EDR Contact: 06/03/2005Next Scheduled EDR Contact: N/AData Release Frequency: No Update Planned
Local Land Records
LIENS 2: CERCLA Lien InformationA Federal CERCLA (’Superfund’) lien can exist by operation of law at any site or property at which EPA has spentSuperfund monies. These monies are spent to investigate and address releases and threatened releases of contamination.CERCLIS provides information as to the identity of these sites and properties.
Date of Government Version: 05/06/2010Date Data Arrived at EDR: 05/11/2010Date Made Active in Reports: 08/09/2010Number of Days to Update: 90
Source: Environmental Protection AgencyTelephone: 202-564-6023Last EDR Contact: 11/01/2010Next Scheduled EDR Contact: 02/14/2011Data Release Frequency: Varies
LUCIS: Land Use Control Information SystemLUCIS contains records of land use control information pertaining to the former Navy Base Realignment and Closureproperties.
Date of Government Version: 12/09/2005Date Data Arrived at EDR: 12/11/2006Date Made Active in Reports: 01/11/2007Number of Days to Update: 31
Source: Department of the NavyTelephone: 843-820-7326Last EDR Contact: 11/22/2010Next Scheduled EDR Contact: 03/07/2011Data Release Frequency: Varies
LIENS: Environmental Liens ListingA listing of property locations with environmental liens for California where DTSC is a lien holder.
Date of Government Version: 10/26/2010Date Data Arrived at EDR: 10/27/2010Date Made Active in Reports: 11/17/2010Number of Days to Update: 21
Source: Department of Toxic Substances ControlTelephone: 916-323-3400Last EDR Contact: 12/09/2010Next Scheduled EDR Contact: 01/31/2011Data Release Frequency: Varies
TC2957885.1s Page GR-15
GOVERNMENT RECORDS SEARCHED / DATA CURRENCY TRACKING
C-31

DEED: Deed Restriction ListingSite Mitigation and Brownfields Reuse Program Facility Sites with Deed Restrictions & Hazardous Waste ManagementProgram Facility Sites with Deed / Land Use Restriction. The DTSC Site Mitigation and Brownfields Reuse Program(SMBRP) list includes sites cleaned up under the program’s oversight and generally does not include currentor former hazardous waste facilities that required a hazardous waste facility permit. The list represents deedrestrictions that are active. Some sites have multiple deed restrictions. The DTSC Hazardous Waste ManagementProgram (HWMP) has developed a list of current or former hazardous waste facilities that have a recorded landuse restriction at the local county recorder’s office. The land use restrictions on this list were required bythe DTSC HWMP as a result of the presence of hazardous substances that remain on site after the facility (orpart of the facility) has been closed or cleaned up. The types of land use restriction include deed notice, deedrestriction, or a land use restriction that binds current and future owners.
Date of Government Version: 09/14/2010Date Data Arrived at EDR: 09/15/2010Date Made Active in Reports: 09/29/2010Number of Days to Update: 14
Source: Department of Toxic Substances ControlTelephone: 916-323-3400Last EDR Contact: 12/14/2010Next Scheduled EDR Contact: 03/28/2011Data Release Frequency: Semi-Annually
Records of Emergency Release Reports
HMIRS: Hazardous Materials Information Reporting SystemHazardous Materials Incident Report System. HMIRS contains hazardous material spill incidents reported to DOT.
Date of Government Version: 04/06/2010Date Data Arrived at EDR: 04/07/2010Date Made Active in Reports: 05/27/2010Number of Days to Update: 50
Source: U.S. Department of TransportationTelephone: 202-366-4555Last EDR Contact: 10/07/2010Next Scheduled EDR Contact: 01/17/2011Data Release Frequency: Annually
CHMIRS: California Hazardous Material Incident Report SystemCalifornia Hazardous Material Incident Reporting System. CHMIRS contains information on reported hazardous materialincidents (accidental releases or spills).
Date of Government Version: 12/31/2009Date Data Arrived at EDR: 07/21/2010Date Made Active in Reports: 08/20/2010Number of Days to Update: 30
Source: Office of Emergency ServicesTelephone: 916-845-8400Last EDR Contact: 11/01/2010Next Scheduled EDR Contact: 02/14/2011Data Release Frequency: Varies
LDS: Land Disposal Sites ListingThe Land Disposal program regulates of waste discharge to land for treatment, storage and disposal in waste managementunits.
Date of Government Version: 10/28/2010Date Data Arrived at EDR: 10/28/2010Date Made Active in Reports: 11/17/2010Number of Days to Update: 20
Source: State Water Qualilty Control BoardTelephone: 866-480-1028Last EDR Contact: 12/16/2010Next Scheduled EDR Contact: 04/04/2011Data Release Frequency: Quarterly
MCS: Military Cleanup Sites ListingThe State Water Resources Control Board and nine Regional Water Quality Control Boards partner with the Departmentof Defense (DoD) through the Defense and State Memorandum of Agreement (DSMOA) to oversee the investigationand remediation of water quality issues at military facilities.
Date of Government Version: 10/28/2010Date Data Arrived at EDR: 10/28/2010Date Made Active in Reports: 11/17/2010Number of Days to Update: 20
Source: State Water Resources Control BoardTelephone: 866-480-1028Last EDR Contact: 12/16/2010Next Scheduled EDR Contact: 04/04/2011Data Release Frequency: Quarterly
Other Ascertainable Records
TC2957885.1s Page GR-16
GOVERNMENT RECORDS SEARCHED / DATA CURRENCY TRACKING
C-32

RCRA-NonGen: RCRA - Non GeneratorsRCRAInfo is EPA’s comprehensive information system, providing access to data supporting the Resource Conservationand Recovery Act (RCRA) of 1976 and the Hazardous and Solid Waste Amendments (HSWA) of 1984. The databaseincludes selective information on sites which generate, transport, store, treat and/or dispose of hazardous wasteas defined by the Resource Conservation and Recovery Act (RCRA). Non-Generators do not presently generate hazardouswaste.
Date of Government Version: 02/17/2010Date Data Arrived at EDR: 02/19/2010Date Made Active in Reports: 05/17/2010Number of Days to Update: 87
Source: Environmental Protection AgencyTelephone: (415) 495-8895Last EDR Contact: 10/07/2010Next Scheduled EDR Contact: 01/17/2011Data Release Frequency: Varies
DOT OPS: Incident and Accident DataDepartment of Transporation, Office of Pipeline Safety Incident and Accident data.
Date of Government Version: 01/12/2010Date Data Arrived at EDR: 02/09/2010Date Made Active in Reports: 04/12/2010Number of Days to Update: 62
Source: Department of Transporation, Office of Pipeline SafetyTelephone: 202-366-4595Last EDR Contact: 11/09/2010Next Scheduled EDR Contact: 02/21/2011Data Release Frequency: Varies
DOD: Department of Defense SitesThis data set consists of federally owned or administered lands, administered by the Department of Defense, thathave any area equal to or greater than 640 acres of the United States, Puerto Rico, and the U.S. Virgin Islands.
Date of Government Version: 12/31/2005Date Data Arrived at EDR: 11/10/2006Date Made Active in Reports: 01/11/2007Number of Days to Update: 62
Source: USGSTelephone: 703-692-8801Last EDR Contact: 10/28/2010Next Scheduled EDR Contact: 01/31/2011Data Release Frequency: Semi-Annually
FUDS: Formerly Used Defense SitesThe listing includes locations of Formerly Used Defense Sites properties where the US Army Corps of Engineersis actively working or will take necessary cleanup actions.
Date of Government Version: 12/31/2009Date Data Arrived at EDR: 08/12/2010Date Made Active in Reports: 12/02/2010Number of Days to Update: 112
Source: U.S. Army Corps of EngineersTelephone: 202-528-4285Last EDR Contact: 12/13/2010Next Scheduled EDR Contact: 03/28/2011Data Release Frequency: Varies
CONSENT: Superfund (CERCLA) Consent DecreesMajor legal settlements that establish responsibility and standards for cleanup at NPL (Superfund) sites. Releasedperiodically by United States District Courts after settlement by parties to litigation matters.
Date of Government Version: 07/01/2010Date Data Arrived at EDR: 08/11/2010Date Made Active in Reports: 12/02/2010Number of Days to Update: 113
Source: Department of Justice, Consent Decree LibraryTelephone: VariesLast EDR Contact: 01/03/2011Next Scheduled EDR Contact: 04/18/2011Data Release Frequency: Varies
ROD: Records Of DecisionRecord of Decision. ROD documents mandate a permanent remedy at an NPL (Superfund) site containing technicaland health information to aid in the cleanup.
Date of Government Version: 06/01/2010Date Data Arrived at EDR: 06/16/2010Date Made Active in Reports: 08/17/2010Number of Days to Update: 62
Source: EPATelephone: 703-416-0223Last EDR Contact: 12/10/2010Next Scheduled EDR Contact: 03/28/2011Data Release Frequency: Annually
TC2957885.1s Page GR-17
GOVERNMENT RECORDS SEARCHED / DATA CURRENCY TRACKING
C-33

UMTRA: Uranium Mill Tailings SitesUranium ore was mined by private companies for federal government use in national defense programs. When the millsshut down, large piles of the sand-like material (mill tailings) remain after uranium has been extracted fromthe ore. Levels of human exposure to radioactive materials from the piles are low; however, in some cases tailingswere used as construction materials before the potential health hazards of the tailings were recognized.
Date of Government Version: 12/14/2009Date Data Arrived at EDR: 09/29/2010Date Made Active in Reports: 10/04/2010Number of Days to Update: 5
Source: Department of EnergyTelephone: 505-845-0011Last EDR Contact: 11/29/2010Next Scheduled EDR Contact: 03/14/2011Data Release Frequency: Varies
MINES: Mines Master Index FileContains all mine identification numbers issued for mines active or opened since 1971. The data also includesviolation information.
Date of Government Version: 08/04/2010Date Data Arrived at EDR: 09/09/2010Date Made Active in Reports: 12/02/2010Number of Days to Update: 84
Source: Department of Labor, Mine Safety and Health AdministrationTelephone: 303-231-5959Last EDR Contact: 09/09/2010Next Scheduled EDR Contact: 03/21/2011Data Release Frequency: Semi-Annually
TRIS: Toxic Chemical Release Inventory SystemToxic Release Inventory System. TRIS identifies facilities which release toxic chemicals to the air, water andland in reportable quantities under SARA Title III Section 313.
Date of Government Version: 12/31/2008Date Data Arrived at EDR: 01/13/2010Date Made Active in Reports: 02/18/2010Number of Days to Update: 36
Source: EPATelephone: 202-566-0250Last EDR Contact: 12/17/2010Next Scheduled EDR Contact: 03/14/2011Data Release Frequency: Annually
TSCA: Toxic Substances Control ActToxic Substances Control Act. TSCA identifies manufacturers and importers of chemical substances included on theTSCA Chemical Substance Inventory list. It includes data on the production volume of these substances by plantsite.
Date of Government Version: 12/31/2006Date Data Arrived at EDR: 09/29/2010Date Made Active in Reports: 12/02/2010Number of Days to Update: 64
Source: EPATelephone: 202-260-5521Last EDR Contact: 12/29/2010Next Scheduled EDR Contact: 04/11/2011Data Release Frequency: Every 4 Years
FTTS: FIFRA/ TSCA Tracking System - FIFRA (Federal Insecticide, Fungicide, & Rodenticide Act)/TSCA (Toxic Substances Control Act)FTTS tracks administrative cases and pesticide enforcement actions and compliance activities related to FIFRA,TSCA and EPCRA (Emergency Planning and Community Right-to-Know Act). To maintain currency, EDR contacts theAgency on a quarterly basis.
Date of Government Version: 04/09/2009Date Data Arrived at EDR: 04/16/2009Date Made Active in Reports: 05/11/2009Number of Days to Update: 25
Source: EPA/Office of Prevention, Pesticides and Toxic SubstancesTelephone: 202-566-1667Last EDR Contact: 11/29/2010Next Scheduled EDR Contact: 03/14/2011Data Release Frequency: Quarterly
FTTS INSP: FIFRA/ TSCA Tracking System - FIFRA (Federal Insecticide, Fungicide, & Rodenticide Act)/TSCA (Toxic Substances Control Act)A listing of FIFRA/TSCA Tracking System (FTTS) inspections and enforcements.
Date of Government Version: 04/09/2009Date Data Arrived at EDR: 04/16/2009Date Made Active in Reports: 05/11/2009Number of Days to Update: 25
Source: EPATelephone: 202-566-1667Last EDR Contact: 11/29/2010Next Scheduled EDR Contact: 03/14/2011Data Release Frequency: Quarterly
TC2957885.1s Page GR-18
GOVERNMENT RECORDS SEARCHED / DATA CURRENCY TRACKING
C-34

HIST FTTS: FIFRA/TSCA Tracking System Administrative Case ListingA complete administrative case listing from the FIFRA/TSCA Tracking System (FTTS) for all ten EPA regions. Theinformation was obtained from the National Compliance Database (NCDB). NCDB supports the implementation of FIFRA(Federal Insecticide, Fungicide, and Rodenticide Act) and TSCA (Toxic Substances Control Act). Some EPA regionsare now closing out records. Because of that, and the fact that some EPA regions are not providing EPA Headquarterswith updated records, it was decided to create a HIST FTTS database. It included records that may not be includedin the newer FTTS database updates. This database is no longer updated.
Date of Government Version: 10/19/2006Date Data Arrived at EDR: 03/01/2007Date Made Active in Reports: 04/10/2007Number of Days to Update: 40
Source: Environmental Protection AgencyTelephone: 202-564-2501Last EDR Contact: 12/17/2007Next Scheduled EDR Contact: 03/17/2008Data Release Frequency: No Update Planned
HIST FTTS INSP: FIFRA/TSCA Tracking System Inspection & Enforcement Case ListingA complete inspection and enforcement case listing from the FIFRA/TSCA Tracking System (FTTS) for all ten EPAregions. The information was obtained from the National Compliance Database (NCDB). NCDB supports the implementationof FIFRA (Federal Insecticide, Fungicide, and Rodenticide Act) and TSCA (Toxic Substances Control Act). SomeEPA regions are now closing out records. Because of that, and the fact that some EPA regions are not providingEPA Headquarters with updated records, it was decided to create a HIST FTTS database. It included records thatmay not be included in the newer FTTS database updates. This database is no longer updated.
Date of Government Version: 10/19/2006Date Data Arrived at EDR: 03/01/2007Date Made Active in Reports: 04/10/2007Number of Days to Update: 40
Source: Environmental Protection AgencyTelephone: 202-564-2501Last EDR Contact: 12/17/2008Next Scheduled EDR Contact: 03/17/2008Data Release Frequency: No Update Planned
SSTS: Section 7 Tracking SystemsSection 7 of the Federal Insecticide, Fungicide and Rodenticide Act, as amended (92 Stat. 829) requires allregistered pesticide-producing establishments to submit a report to the Environmental Protection Agency by March1st each year. Each establishment must report the types and amounts of pesticides, active ingredients and devicesbeing produced, and those having been produced and sold or distributed in the past year.
Date of Government Version: 12/31/2008Date Data Arrived at EDR: 01/06/2010Date Made Active in Reports: 02/10/2010Number of Days to Update: 35
Source: EPATelephone: 202-564-4203Last EDR Contact: 11/01/2010Next Scheduled EDR Contact: 02/14/2011Data Release Frequency: Annually
ICIS: Integrated Compliance Information SystemThe Integrated Compliance Information System (ICIS) supports the information needs of the national enforcementand compliance program as well as the unique needs of the National Pollutant Discharge Elimination System (NPDES)program.
Date of Government Version: 04/24/2010Date Data Arrived at EDR: 04/29/2010Date Made Active in Reports: 05/17/2010Number of Days to Update: 18
Source: Environmental Protection AgencyTelephone: 202-564-5088Last EDR Contact: 12/23/2010Next Scheduled EDR Contact: 04/11/2011Data Release Frequency: Quarterly
PADS: PCB Activity Database SystemPCB Activity Database. PADS Identifies generators, transporters, commercial storers and/or brokers and disposersof PCB’s who are required to notify the EPA of such activities.
Date of Government Version: 02/01/2010Date Data Arrived at EDR: 04/22/2010Date Made Active in Reports: 08/09/2010Number of Days to Update: 109
Source: EPATelephone: 202-566-0500Last EDR Contact: 11/10/2010Next Scheduled EDR Contact: 01/31/2011Data Release Frequency: Annually
TC2957885.1s Page GR-19
GOVERNMENT RECORDS SEARCHED / DATA CURRENCY TRACKING
C-35

MLTS: Material Licensing Tracking SystemMLTS is maintained by the Nuclear Regulatory Commission and contains a list of approximately 8,100 sites whichpossess or use radioactive materials and which are subject to NRC licensing requirements. To maintain currency,EDR contacts the Agency on a quarterly basis.
Date of Government Version: 03/18/2010Date Data Arrived at EDR: 04/06/2010Date Made Active in Reports: 05/27/2010Number of Days to Update: 51
Source: Nuclear Regulatory CommissionTelephone: 301-415-7169Last EDR Contact: 12/13/2010Next Scheduled EDR Contact: 03/28/2011Data Release Frequency: Quarterly
RADINFO: Radiation Information DatabaseThe Radiation Information Database (RADINFO) contains information about facilities that are regulated by U.S.Environmental Protection Agency (EPA) regulations for radiation and radioactivity.
Date of Government Version: 07/13/2010Date Data Arrived at EDR: 07/14/2010Date Made Active in Reports: 08/09/2010Number of Days to Update: 26
Source: Environmental Protection AgencyTelephone: 202-343-9775Last EDR Contact: 10/14/2010Next Scheduled EDR Contact: 01/24/2011Data Release Frequency: Quarterly
FINDS: Facility Index System/Facility Registry SystemFacility Index System. FINDS contains both facility information and ’pointers’ to other sources that contain moredetail. EDR includes the following FINDS databases in this report: PCS (Permit Compliance System), AIRS (AerometricInformation Retrieval System), DOCKET (Enforcement Docket used to manage and track information on civil judicialenforcement cases for all environmental statutes), FURS (Federal Underground Injection Control), C-DOCKET (CriminalDocket System used to track criminal enforcement actions for all environmental statutes), FFIS (Federal FacilitiesInformation System), STATE (State Environmental Laws and Statutes), and PADS (PCB Activity Data System).
Date of Government Version: 04/14/2010Date Data Arrived at EDR: 04/16/2010Date Made Active in Reports: 05/27/2010Number of Days to Update: 41
Source: EPATelephone: (415) 947-8000Last EDR Contact: 12/10/2010Next Scheduled EDR Contact: 03/28/2011Data Release Frequency: Quarterly
RAATS: RCRA Administrative Action Tracking SystemRCRA Administration Action Tracking System. RAATS contains records based on enforcement actions issued under RCRApertaining to major violators and includes administrative and civil actions brought by the EPA. For administrationactions after September 30, 1995, data entry in the RAATS database was discontinued. EPA will retain a copy ofthe database for historical records. It was necessary to terminate RAATS because a decrease in agency resourcesmade it impossible to continue to update the information contained in the database.
Date of Government Version: 04/17/1995Date Data Arrived at EDR: 07/03/1995Date Made Active in Reports: 08/07/1995Number of Days to Update: 35
Source: EPATelephone: 202-564-4104Last EDR Contact: 06/02/2008Next Scheduled EDR Contact: 09/01/2008Data Release Frequency: No Update Planned
BRS: Biennial Reporting SystemThe Biennial Reporting System is a national system administered by the EPA that collects data on the generationand management of hazardous waste. BRS captures detailed data from two groups: Large Quantity Generators (LQG)and Treatment, Storage, and Disposal Facilities.
Date of Government Version: 12/31/2007Date Data Arrived at EDR: 02/25/2010Date Made Active in Reports: 05/12/2010Number of Days to Update: 76
Source: EPA/NTISTelephone: 800-424-9346Last EDR Contact: 11/30/2010Next Scheduled EDR Contact: 03/07/2011Data Release Frequency: Biennially
TC2957885.1s Page GR-20
GOVERNMENT RECORDS SEARCHED / DATA CURRENCY TRACKING
C-36

CA BOND EXP. PLAN: Bond Expenditure PlanDepartment of Health Services developed a site-specific expenditure plan as the basis for an appropriation ofHazardous Substance Cleanup Bond Act funds. It is not updated.
Date of Government Version: 01/01/1989Date Data Arrived at EDR: 07/27/1994Date Made Active in Reports: 08/02/1994Number of Days to Update: 6
Source: Department of Health ServicesTelephone: 916-255-2118Last EDR Contact: 05/31/1994Next Scheduled EDR Contact: N/AData Release Frequency: No Update Planned
WDS: Waste Discharge SystemSites which have been issued waste discharge requirements.
Date of Government Version: 06/19/2007Date Data Arrived at EDR: 06/20/2007Date Made Active in Reports: 06/29/2007Number of Days to Update: 9
Source: State Water Resources Control BoardTelephone: 916-341-5227Last EDR Contact: 11/29/2010Next Scheduled EDR Contact: 03/14/2011Data Release Frequency: Quarterly
NPDES: NPDES Permits ListingA listing of NPDES permits, including stormwater.
Date of Government Version: 08/24/2010Date Data Arrived at EDR: 08/24/2010Date Made Active in Reports: 09/29/2010Number of Days to Update: 36
Source: State Water Resources Control BoardTelephone: 916-445-9379Last EDR Contact: 11/23/2010Next Scheduled EDR Contact: 03/07/2011Data Release Frequency: Quarterly
CORTESE: "Cortese" Hazardous Waste & Substances Sites ListThe sites for the list are designated by the State Water Resource Control Board (LUST), the Integrated WasteBoard (SWF/LS), and the Department of Toxic Substances Control (Cal-Sites). This listing is no longer updatedby the state agency.
Date of Government Version: 10/05/2010Date Data Arrived at EDR: 10/06/2010Date Made Active in Reports: 11/17/2010Number of Days to Update: 42
Source: CAL EPA/Office of Emergency InformationTelephone: 916-323-3400Last EDR Contact: 10/06/2010Next Scheduled EDR Contact: 01/17/2011Data Release Frequency: Quarterly
HIST CORTESE: Hazardous Waste & Substance Site ListThe sites for the list are designated by the State Water Resource Control Board [LUST], the Integrated Waste Board[SWF/LS], and the Department of Toxic Substances Control [CALSITES].
Date of Government Version: 04/01/2001Date Data Arrived at EDR: 01/22/2009Date Made Active in Reports: 04/08/2009Number of Days to Update: 76
Source: Department of Toxic Substances ControlTelephone: 916-323-3400Last EDR Contact: 01/22/2009Next Scheduled EDR Contact: N/AData Release Frequency: No Update Planned
NOTIFY 65: Proposition 65 RecordsProposition 65 Notification Records. NOTIFY 65 contains facility notifications about any release which could impactdrinking water and thereby expose the public to a potential health risk.
Date of Government Version: 10/21/1993Date Data Arrived at EDR: 11/01/1993Date Made Active in Reports: 11/19/1993Number of Days to Update: 18
Source: State Water Resources Control BoardTelephone: 916-445-3846Last EDR Contact: 12/22/2010Next Scheduled EDR Contact: 04/11/2011Data Release Frequency: No Update Planned
TC2957885.1s Page GR-21
GOVERNMENT RECORDS SEARCHED / DATA CURRENCY TRACKING
C-37

DRYCLEANERS: Cleaner FacilitiesA list of drycleaner related facilities that have EPA ID numbers. These are facilities with certain SIC codes:power laundries, family and commercial; garment pressing and cleaner’s agents; linen supply; coin-operated laundriesand cleaning; drycleaning plants, except rugs; carpet and upholster cleaning; industrial launderers; laundry andgarment services.
Date of Government Version: 09/15/2010Date Data Arrived at EDR: 09/16/2010Date Made Active in Reports: 09/29/2010Number of Days to Update: 13
Source: Department of Toxic Substance ControlTelephone: 916-327-4498Last EDR Contact: 12/13/2010Next Scheduled EDR Contact: 03/28/2011Data Release Frequency: Annually
WIP: Well Investigation Program Case ListWell Investigation Program case in the San Gabriel and San Fernando Valley area.
Date of Government Version: 07/03/2009Date Data Arrived at EDR: 07/21/2009Date Made Active in Reports: 08/03/2009Number of Days to Update: 13
Source: Los Angeles Water Quality Control BoardTelephone: 213-576-6726Last EDR Contact: 01/03/2011Next Scheduled EDR Contact: 04/18/2011Data Release Frequency: Varies
HAZNET: Facility and Manifest DataFacility and Manifest Data. The data is extracted from the copies of hazardous waste manifests received each yearby the DTSC. The annual volume of manifests is typically 700,000 - 1,000,000 annually, representing approximately350,000 - 500,000 shipments. Data are from the manifests submitted without correction, and therefore many containsome invalid values for data elements such as generator ID, TSD ID, waste category, and disposal method.
Date of Government Version: 12/31/2009Date Data Arrived at EDR: 07/07/2010Date Made Active in Reports: 08/12/2010Number of Days to Update: 36
Source: California Environmental Protection AgencyTelephone: 916-255-1136Last EDR Contact: 10/19/2010Next Scheduled EDR Contact: 01/31/2011Data Release Frequency: Annually
EMI: Emissions Inventory DataToxics and criteria pollutant emissions data collected by the ARB and local air pollution agencies.
Date of Government Version: 12/31/2008Date Data Arrived at EDR: 09/29/2010Date Made Active in Reports: 10/18/2010Number of Days to Update: 19
Source: California Air Resources BoardTelephone: 916-322-2990Last EDR Contact: 12/30/2010Next Scheduled EDR Contact: 04/11/2011Data Release Frequency: Varies
INDIAN RESERV: Indian ReservationsThis map layer portrays Indian administered lands of the United States that have any area equal to or greaterthan 640 acres.
Date of Government Version: 12/31/2005Date Data Arrived at EDR: 12/08/2006Date Made Active in Reports: 01/11/2007Number of Days to Update: 34
Source: USGSTelephone: 202-208-3710Last EDR Contact: 10/28/2010Next Scheduled EDR Contact: 01/31/2011Data Release Frequency: Semi-Annually
SCRD DRYCLEANERS: State Coalition for Remediation of Drycleaners ListingThe State Coalition for Remediation of Drycleaners was established in 1998, with support from the U.S. EPA Officeof Superfund Remediation and Technology Innovation. It is comprised of representatives of states with establisheddrycleaner remediation programs. Currently the member states are Alabama, Connecticut, Florida, Illinois, Kansas,Minnesota, Missouri, North Carolina, Oregon, South Carolina, Tennessee, Texas, and Wisconsin.
Date of Government Version: 08/31/2010Date Data Arrived at EDR: 09/01/2010Date Made Active in Reports: 12/02/2010Number of Days to Update: 92
Source: Environmental Protection AgencyTelephone: 615-532-8599Last EDR Contact: 12/13/2010Next Scheduled EDR Contact: 02/07/2011Data Release Frequency: Varies
TC2957885.1s Page GR-22
GOVERNMENT RECORDS SEARCHED / DATA CURRENCY TRACKING
C-38

PROC: Certified Processors DatabaseA listing of certified processors.
Date of Government Version: 07/23/2010Date Data Arrived at EDR: 09/21/2010Date Made Active in Reports: 09/29/2010Number of Days to Update: 8
Source: Department of ConservationTelephone: 916-323-3836Last EDR Contact: 12/23/2010Next Scheduled EDR Contact: 04/04/2011Data Release Frequency: Quarterly
MWMP: Medical Waste Management Program ListingThe Medical Waste Management Program (MWMP) ensures the proper handling and disposal of medical waste by permittingand inspecting medical waste Offsite Treatment Facilities (PDF) and Transfer Stations (PDF) throughout thestate. MWMP also oversees all Medical Waste Transporters.
Date of Government Version: 09/03/2010Date Data Arrived at EDR: 09/16/2010Date Made Active in Reports: 09/29/2010Number of Days to Update: 13
Source: Department of Public HealthTelephone: 916-558-1784Last EDR Contact: 12/14/2010Next Scheduled EDR Contact: 03/28/2011Data Release Frequency: Varies
COAL ASH DOE: Sleam-Electric Plan Operation DataA listing of power plants that store ash in surface ponds.
Date of Government Version: 12/31/2005Date Data Arrived at EDR: 08/07/2009Date Made Active in Reports: 10/22/2009Number of Days to Update: 76
Source: Department of EnergyTelephone: 202-586-8719Last EDR Contact: 10/28/2010Next Scheduled EDR Contact: 01/31/2011Data Release Frequency: Varies
COAL ASH EPA: Coal Combustion Residues Surface Impoundments ListA listing of coal combustion residues surface impoundments with high hazard potential ratings.
Date of Government Version: 11/09/2009Date Data Arrived at EDR: 12/18/2009Date Made Active in Reports: 02/10/2010Number of Days to Update: 54
Source: Environmental Protection AgencyTelephone: N/ALast EDR Contact: 12/21/2010Next Scheduled EDR Contact: 03/28/2011Data Release Frequency: Varies
HWT: Registered Hazardous Waste Transporter DatabaseA listing of hazardous waste transporters. In California, unless specifically exempted, it is unlawful for anyperson to transport hazardous wastes unless the person holds a valid registration issued by DTSC. A hazardouswaste transporter registration is valid for one year and is assigned a unique registration number.
Date of Government Version: 10/19/2010Date Data Arrived at EDR: 10/20/2010Date Made Active in Reports: 11/17/2010Number of Days to Update: 28
Source: Department of Toxic Substances ControlTelephone: 916-440-7145Last EDR Contact: 10/20/2010Next Scheduled EDR Contact: 01/31/2011Data Release Frequency: Quarterly
HWP: EnviroStor Permitted Facilities ListingDetailed information on permitted hazardous waste facilities and corrective action ("cleanups") tracked in EnviroStor.
Date of Government Version: 08/09/2010Date Data Arrived at EDR: 08/11/2010Date Made Active in Reports: 08/20/2010Number of Days to Update: 9
Source: Department of Toxic Substances ControlTelephone: 916-323-3400Last EDR Contact: 12/10/2010Next Scheduled EDR Contact: 02/21/2011Data Release Frequency: Quarterly
FINANCIAL ASSURANCE 2: Financial Assurance Information ListingA listing of financial assurance information for solid waste facilities. Financial assurance is intended to ensurethat resources are available to pay for the cost of closure, post-closure care, and corrective measures if theowner or operator of a regulated facility is unable or unwilling to pay.
TC2957885.1s Page GR-23
GOVERNMENT RECORDS SEARCHED / DATA CURRENCY TRACKING
C-39

Date of Government Version: 09/27/2010Date Data Arrived at EDR: 09/28/2010Date Made Active in Reports: 10/18/2010Number of Days to Update: 20
Source: California Integrated Waste Management BoardTelephone: 916-341-6066Last EDR Contact: 12/20/2010Next Scheduled EDR Contact: 03/07/2011Data Release Frequency: Varies
FINANCIAL ASSURANCE: Financial Assurance Information ListingFinancial Assurance information
Date of Government Version: 03/01/2007Date Data Arrived at EDR: 06/01/2007Date Made Active in Reports: 06/29/2007Number of Days to Update: 28
Source: Department of Toxic Substances ControlTelephone: 916-255-3628Last EDR Contact: 11/10/2010Next Scheduled EDR Contact: 02/14/2011Data Release Frequency: Varies
FEDLAND: Federal and Indian LandsFederally and Indian administrated lands of the United States. Lands included are administrated by: Army Corpsof Engineers, Bureau of Reclamation, National Wild and Scenic River, National Wildlife Refuge, Public Domain Land,Wilderness, Wilderness Study Area, Wildlife Management Area, Bureau of Indian Affairs, Bureau of Land Management,Department of Justice, Forest Service, Fish and Wildlife Service, National Park Service.
Date of Government Version: 12/31/2005Date Data Arrived at EDR: 02/06/2006Date Made Active in Reports: 01/11/2007Number of Days to Update: 339
Source: U.S. Geological SurveyTelephone: 888-275-8747Last EDR Contact: 10/28/2010Next Scheduled EDR Contact: 01/31/2011Data Release Frequency: N/A
PCB TRANSFORMER: PCB Transformer Registration DatabaseThe database of PCB transformer registrations that includes all PCB registration submittals.
Date of Government Version: 01/01/2008Date Data Arrived at EDR: 02/18/2009Date Made Active in Reports: 05/29/2009Number of Days to Update: 100
Source: Environmental Protection AgencyTelephone: 202-566-0517Last EDR Contact: 11/10/2010Next Scheduled EDR Contact: 02/14/2011Data Release Frequency: Varies
EDR PROPRIETARY RECORDS
EDR Proprietary Records
Manufactured Gas Plants: EDR Proprietary Manufactured Gas PlantsThe EDR Proprietary Manufactured Gas Plant Database includes records of coal gas plants (manufactured gas plants)compiled by EDR’s researchers. Manufactured gas sites were used in the United States from the 1800’s to 1950’sto produce a gas that could be distributed and used as fuel. These plants used whale oil, rosin, coal, or a mixtureof coal, oil, and water that also produced a significant amount of waste. Many of the byproducts of the gas production,such as coal tar (oily waste containing volatile and non-volatile chemicals), sludges, oils and other compoundsare potentially hazardous to human health and the environment. The byproduct from this process was frequentlydisposed of directly at the plant site and can remain or spread slowly, serving as a continuous source of soiland groundwater contamination.
Date of Government Version: N/ADate Data Arrived at EDR: N/ADate Made Active in Reports: N/ANumber of Days to Update: N/A
Source: EDR, Inc.Telephone: N/ALast EDR Contact: N/ANext Scheduled EDR Contact: N/AData Release Frequency: No Update Planned
TC2957885.1s Page GR-24
GOVERNMENT RECORDS SEARCHED / DATA CURRENCY TRACKING
C-40

COUNTY RECORDS
ALAMEDA COUNTY:
Contaminated SitesA listing of contaminated sites overseen by the Toxic Release Program (oil and groundwater contamination fromchemical releases and spills) and the Leaking Underground Storage Tank Program (soil and ground water contaminationfrom leaking petroleum USTs).
Date of Government Version: 10/13/2010Date Data Arrived at EDR: 10/14/2010Date Made Active in Reports: 11/17/2010Number of Days to Update: 34
Source: Alameda County Environmental Health ServicesTelephone: 510-567-6700Last EDR Contact: 01/03/2011Next Scheduled EDR Contact: 04/18/2011Data Release Frequency: Semi-Annually
Underground TanksUnderground storage tank sites located in Alameda county.
Date of Government Version: 10/13/2010Date Data Arrived at EDR: 10/14/2010Date Made Active in Reports: 11/18/2010Number of Days to Update: 35
Source: Alameda County Environmental Health ServicesTelephone: 510-567-6700Last EDR Contact: 01/03/2011Next Scheduled EDR Contact: 04/18/2011Data Release Frequency: Semi-Annually
CONTRA COSTA COUNTY:
Site ListList includes sites from the underground tank, hazardous waste generator and business plan/2185 programs.
Date of Government Version: 08/16/2010Date Data Arrived at EDR: 08/17/2010Date Made Active in Reports: 08/20/2010Number of Days to Update: 3
Source: Contra Costa Health Services DepartmentTelephone: 925-646-2286Last EDR Contact: 11/22/2010Next Scheduled EDR Contact: 02/21/2011Data Release Frequency: Semi-Annually
FRESNO COUNTY:
CUPA Resources ListCertified Unified Program Agency. CUPA’s are responsible for implementing a unified hazardous materials and hazardouswaste management regulatory program. The agency provides oversight of businesses that deal with hazardous materials,operate underground storage tanks or aboveground storage tanks.
Date of Government Version: 10/15/2010Date Data Arrived at EDR: 10/15/2010Date Made Active in Reports: 11/17/2010Number of Days to Update: 33
Source: Dept. of Community HealthTelephone: 559-445-3271Last EDR Contact: 10/18/2010Next Scheduled EDR Contact: 01/31/2011Data Release Frequency: Semi-Annually
KERN COUNTY:
Underground Storage Tank Sites & Tank ListingKern County Sites and Tanks Listing.
Date of Government Version: 08/31/2010Date Data Arrived at EDR: 09/01/2010Date Made Active in Reports: 09/30/2010Number of Days to Update: 29
Source: Kern County Environment Health Services DepartmentTelephone: 661-862-8700Last EDR Contact: 11/22/2010Next Scheduled EDR Contact: 02/28/2011Data Release Frequency: Quarterly
LOS ANGELES COUNTY:
TC2957885.1s Page GR-25
GOVERNMENT RECORDS SEARCHED / DATA CURRENCY TRACKING
C-41

San Gabriel Valley Areas of ConcernSan Gabriel Valley areas where VOC contamination is at or above the MCL as designated by region 9 EPA office.
Date of Government Version: 03/30/2009Date Data Arrived at EDR: 03/31/2009Date Made Active in Reports: 10/23/2009Number of Days to Update: 206
Source: EPA Region 9Telephone: 415-972-3178Last EDR Contact: 12/22/2010Next Scheduled EDR Contact: 04/11/2011Data Release Frequency: No Update Planned
HMS: Street Number ListIndustrial Waste and Underground Storage Tank Sites.
Date of Government Version: 07/29/2010Date Data Arrived at EDR: 10/29/2010Date Made Active in Reports: 11/17/2010Number of Days to Update: 19
Source: Department of Public WorksTelephone: 626-458-3517Last EDR Contact: 10/18/2010Next Scheduled EDR Contact: 01/31/2011Data Release Frequency: Semi-Annually
List of Solid Waste FacilitiesSolid Waste Facilities in Los Angeles County.
Date of Government Version: 10/25/2010Date Data Arrived at EDR: 10/27/2010Date Made Active in Reports: 11/17/2010Number of Days to Update: 21
Source: La County Department of Public WorksTelephone: 818-458-5185Last EDR Contact: 10/25/2010Next Scheduled EDR Contact: 02/07/2011Data Release Frequency: Varies
City of Los Angeles LandfillsLandfills owned and maintained by the City of Los Angeles.
Date of Government Version: 03/05/2009Date Data Arrived at EDR: 03/10/2009Date Made Active in Reports: 04/08/2009Number of Days to Update: 29
Source: Engineering & Construction DivisionTelephone: 213-473-7869Last EDR Contact: 11/22/2010Next Scheduled EDR Contact: 03/07/2011Data Release Frequency: Varies
Site Mitigation ListIndustrial sites that have had some sort of spill or complaint.
Date of Government Version: 02/09/2010Date Data Arrived at EDR: 02/12/2010Date Made Active in Reports: 03/04/2010Number of Days to Update: 20
Source: Community Health ServicesTelephone: 323-890-7806Last EDR Contact: 10/25/2010Next Scheduled EDR Contact: 02/07/2011Data Release Frequency: Annually
City of El Segundo Underground Storage TankUnderground storage tank sites located in El Segundo city.
Date of Government Version: 10/26/2010Date Data Arrived at EDR: 11/01/2010Date Made Active in Reports: 11/18/2010Number of Days to Update: 17
Source: City of El Segundo Fire DepartmentTelephone: 310-524-2236Last EDR Contact: 10/25/2010Next Scheduled EDR Contact: 02/07/2011Data Release Frequency: Semi-Annually
City of Long Beach Underground Storage TankUnderground storage tank sites located in the city of Long Beach.
Date of Government Version: 03/28/2003Date Data Arrived at EDR: 10/23/2003Date Made Active in Reports: 11/26/2003Number of Days to Update: 34
Source: City of Long Beach Fire DepartmentTelephone: 562-570-2563Last EDR Contact: 11/01/2010Next Scheduled EDR Contact: 02/14/2011Data Release Frequency: Annually
TC2957885.1s Page GR-26
GOVERNMENT RECORDS SEARCHED / DATA CURRENCY TRACKING
C-42

City of Torrance Underground Storage TankUnderground storage tank sites located in the city of Torrance.
Date of Government Version: 10/22/2010Date Data Arrived at EDR: 10/27/2010Date Made Active in Reports: 11/18/2010Number of Days to Update: 22
Source: City of Torrance Fire DepartmentTelephone: 310-618-2973Last EDR Contact: 10/18/2010Next Scheduled EDR Contact: 01/31/2011Data Release Frequency: Semi-Annually
MARIN COUNTY:
Underground Storage Tank SitesCurrently permitted USTs in Marin County.
Date of Government Version: 10/28/2010Date Data Arrived at EDR: 11/16/2010Date Made Active in Reports: 11/18/2010Number of Days to Update: 2
Source: Public Works Department Waste ManagementTelephone: 415-499-6647Last EDR Contact: 10/12/2010Next Scheduled EDR Contact: 01/24/2011Data Release Frequency: Semi-Annually
NAPA COUNTY:
Sites With Reported ContaminationA listing of leaking underground storage tank sites located in Napa county.
Date of Government Version: 07/09/2008Date Data Arrived at EDR: 07/09/2008Date Made Active in Reports: 07/31/2008Number of Days to Update: 22
Source: Napa County Department of Environmental ManagementTelephone: 707-253-4269Last EDR Contact: 12/06/2010Next Scheduled EDR Contact: 03/21/2011Data Release Frequency: No Update Planned
Closed and Operating Underground Storage Tank SitesUnderground storage tank sites located in Napa county.
Date of Government Version: 01/15/2008Date Data Arrived at EDR: 01/16/2008Date Made Active in Reports: 02/08/2008Number of Days to Update: 23
Source: Napa County Department of Environmental ManagementTelephone: 707-253-4269Last EDR Contact: 12/06/2010Next Scheduled EDR Contact: 03/21/2011Data Release Frequency: No Update Planned
ORANGE COUNTY:
List of Industrial Site CleanupsPetroleum and non-petroleum spills.
Date of Government Version: 08/05/2010Date Data Arrived at EDR: 08/23/2010Date Made Active in Reports: 09/29/2010Number of Days to Update: 37
Source: Health Care AgencyTelephone: 714-834-3446Last EDR Contact: 11/16/2010Next Scheduled EDR Contact: 02/28/2011Data Release Frequency: Annually
List of Underground Storage Tank CleanupsOrange County Underground Storage Tank Cleanups (LUST).
Date of Government Version: 08/05/2010Date Data Arrived at EDR: 08/23/2010Date Made Active in Reports: 09/29/2010Number of Days to Update: 37
Source: Health Care AgencyTelephone: 714-834-3446Last EDR Contact: 11/16/2010Next Scheduled EDR Contact: 02/28/2011Data Release Frequency: Quarterly
TC2957885.1s Page GR-27
GOVERNMENT RECORDS SEARCHED / DATA CURRENCY TRACKING
C-43

List of Underground Storage Tank FacilitiesOrange County Underground Storage Tank Facilities (UST).
Date of Government Version: 08/05/2010Date Data Arrived at EDR: 08/23/2010Date Made Active in Reports: 09/30/2010Number of Days to Update: 38
Source: Health Care AgencyTelephone: 714-834-3446Last EDR Contact: 11/16/2010Next Scheduled EDR Contact: 02/28/2011Data Release Frequency: Quarterly
PLACER COUNTY:
Master List of FacilitiesList includes aboveground tanks, underground tanks and cleanup sites.
Date of Government Version: 09/13/2010Date Data Arrived at EDR: 09/14/2010Date Made Active in Reports: 09/29/2010Number of Days to Update: 15
Source: Placer County Health and Human ServicesTelephone: 530-889-7312Last EDR Contact: 12/13/2010Next Scheduled EDR Contact: 03/28/2011Data Release Frequency: Semi-Annually
RIVERSIDE COUNTY:
Listing of Underground Tank Cleanup SitesRiverside County Underground Storage Tank Cleanup Sites (LUST).
Date of Government Version: 10/25/2010Date Data Arrived at EDR: 10/28/2010Date Made Active in Reports: 11/17/2010Number of Days to Update: 20
Source: Department of Environmental HealthTelephone: 951-358-5055Last EDR Contact: 12/09/2010Next Scheduled EDR Contact: 04/11/2011Data Release Frequency: Quarterly
Underground Storage Tank Tank ListUnderground storage tank sites located in Riverside county.
Date of Government Version: 10/25/2010Date Data Arrived at EDR: 10/28/2010Date Made Active in Reports: 11/18/2010Number of Days to Update: 21
Source: Department of Environmental HealthTelephone: 951-358-5055Last EDR Contact: 12/09/2010Next Scheduled EDR Contact: 04/11/2011Data Release Frequency: Quarterly
SACRAMENTO COUNTY:
Toxic Site Clean-Up ListList of sites where unauthorized releases of potentially hazardous materials have occurred.
Date of Government Version: 08/02/2010Date Data Arrived at EDR: 10/19/2010Date Made Active in Reports: 11/17/2010Number of Days to Update: 29
Source: Sacramento County Environmental ManagementTelephone: 916-875-8406Last EDR Contact: 10/12/2010Next Scheduled EDR Contact: 01/24/2011Data Release Frequency: Quarterly
Master Hazardous Materials Facility ListAny business that has hazardous materials on site - hazardous material storage sites, underground storage tanks,waste generators.
Date of Government Version: 08/09/2010Date Data Arrived at EDR: 10/21/2010Date Made Active in Reports: 11/17/2010Number of Days to Update: 27
Source: Sacramento County Environmental ManagementTelephone: 916-875-8406Last EDR Contact: 10/12/2010Next Scheduled EDR Contact: 01/24/2011Data Release Frequency: Quarterly
SAN BERNARDINO COUNTY:
TC2957885.1s Page GR-28
GOVERNMENT RECORDS SEARCHED / DATA CURRENCY TRACKING
C-44

Hazardous Material PermitsThis listing includes underground storage tanks, medical waste handlers/generators, hazardous materials handlers,hazardous waste generators, and waste oil generators/handlers.
Date of Government Version: 09/07/2010Date Data Arrived at EDR: 09/08/2010Date Made Active in Reports: 09/29/2010Number of Days to Update: 21
Source: San Bernardino County Fire Department Hazardous Materials DivisionTelephone: 909-387-3041Last EDR Contact: 11/22/2010Next Scheduled EDR Contact: 02/28/2011Data Release Frequency: Quarterly
SAN DIEGO COUNTY:
Hazardous Materials Management Division DatabaseThe database includes: HE58 - This report contains the business name, site address, business phone number, establishment’H’ permit number, type of permit, and the business status. HE17 - In addition to providing the same informationprovided in the HE58 listing, HE17 provides inspection dates, violations received by the establishment, hazardouswaste generated, the quantity, method of storage, treatment/disposal of waste and the hauler, and informationon underground storage tanks. Unauthorized Release List - Includes a summary of environmental contamination casesin San Diego County (underground tank cases, non-tank cases, groundwater contamination, and soil contaminationare included.)
Date of Government Version: 09/09/2010Date Data Arrived at EDR: 09/15/2010Date Made Active in Reports: 09/29/2010Number of Days to Update: 14
Source: Hazardous Materials Management DivisionTelephone: 619-338-2268Last EDR Contact: 12/21/2010Next Scheduled EDR Contact: 03/28/2011Data Release Frequency: Quarterly
Solid Waste FacilitiesSan Diego County Solid Waste Facilities.
Date of Government Version: 10/01/2009Date Data Arrived at EDR: 12/04/2009Date Made Active in Reports: 01/18/2010Number of Days to Update: 45
Source: Department of Health ServicesTelephone: 619-338-2209Last EDR Contact: 11/01/2010Next Scheduled EDR Contact: 02/14/2011Data Release Frequency: Varies
Environmental Case ListingThe listing contains all underground tank release cases and projects pertaining to properties contaminated withhazardous substances that are actively under review by the Site Assessment and Mitigation Program.
Date of Government Version: 03/23/2010Date Data Arrived at EDR: 06/15/2010Date Made Active in Reports: 07/09/2010Number of Days to Update: 24
Source: San Diego County Department of Environmental HealthTelephone: 619-338-2371Last EDR Contact: 12/21/2010Next Scheduled EDR Contact: 03/28/2011Data Release Frequency: No Update Planned
SAN FRANCISCO COUNTY:
Local Oversite FacilitiesA listing of leaking underground storage tank sites located in San Francisco county.
Date of Government Version: 09/19/2008Date Data Arrived at EDR: 09/19/2008Date Made Active in Reports: 09/29/2008Number of Days to Update: 10
Source: Department Of Public Health San Francisco CountyTelephone: 415-252-3920Last EDR Contact: 11/22/2010Next Scheduled EDR Contact: 02/28/2011Data Release Frequency: Quarterly
TC2957885.1s Page GR-29
GOVERNMENT RECORDS SEARCHED / DATA CURRENCY TRACKING
C-45

Underground Storage Tank InformationUnderground storage tank sites located in San Francisco county.
Date of Government Version: 09/08/2010Date Data Arrived at EDR: 09/10/2010Date Made Active in Reports: 09/30/2010Number of Days to Update: 20
Source: Department of Public HealthTelephone: 415-252-3920Last EDR Contact: 11/29/2010Next Scheduled EDR Contact: 02/28/2011Data Release Frequency: Quarterly
SAN JOAQUIN COUNTY:
San Joaquin Co. USTA listing of underground storage tank locations in San Joaquin county.
Date of Government Version: 10/12/2010Date Data Arrived at EDR: 10/13/2010Date Made Active in Reports: 11/18/2010Number of Days to Update: 36
Source: Environmental Health DepartmentTelephone: N/ALast EDR Contact: 12/23/2010Next Scheduled EDR Contact: 04/11/2011Data Release Frequency: Semi-Annually
SAN MATEO COUNTY:
Business InventoryList includes Hazardous Materials Business Plan, hazardous waste generators, and underground storage tanks.
Date of Government Version: 07/15/2010Date Data Arrived at EDR: 07/16/2010Date Made Active in Reports: 08/12/2010Number of Days to Update: 27
Source: San Mateo County Environmental Health Services DivisionTelephone: 650-363-1921Last EDR Contact: 06/21/2010Next Scheduled EDR Contact: 01/03/2011Data Release Frequency: Annually
Fuel Leak ListA listing of leaking underground storage tank sites located in San Mateo county.
Date of Government Version: 09/20/2010Date Data Arrived at EDR: 09/21/2010Date Made Active in Reports: 09/29/2010Number of Days to Update: 8
Source: San Mateo County Environmental Health Services DivisionTelephone: 650-363-1921Last EDR Contact: 12/17/2010Next Scheduled EDR Contact: 04/04/2011Data Release Frequency: Semi-Annually
SANTA CLARA COUNTY:
HIST LUST - Fuel Leak Site Activity ReportA listing of open and closed leaking underground storage tanks. This listing is no longer updated by the county.Leaking underground storage tanks are now handled by the Department of Environmental Health.
Date of Government Version: 03/29/2005Date Data Arrived at EDR: 03/30/2005Date Made Active in Reports: 04/21/2005Number of Days to Update: 22
Source: Santa Clara Valley Water DistrictTelephone: 408-265-2600Last EDR Contact: 03/23/2009Next Scheduled EDR Contact: 06/22/2009Data Release Frequency: No Update Planned
LOP ListingA listing of leaking underground storage tanks located in Santa Clara county.
Date of Government Version: 05/29/2009Date Data Arrived at EDR: 06/01/2009Date Made Active in Reports: 06/15/2009Number of Days to Update: 14
Source: Department of Environmental HealthTelephone: 408-918-3417Last EDR Contact: 12/06/2010Next Scheduled EDR Contact: 03/21/2011Data Release Frequency: Annually
TC2957885.1s Page GR-30
GOVERNMENT RECORDS SEARCHED / DATA CURRENCY TRACKING
C-46

Hazardous Material FacilitiesHazardous material facilities, including underground storage tank sites.
Date of Government Version: 08/31/2009Date Data Arrived at EDR: 08/31/2009Date Made Active in Reports: 09/18/2009Number of Days to Update: 18
Source: City of San Jose Fire DepartmentTelephone: 408-535-7694Last EDR Contact: 12/13/2010Next Scheduled EDR Contact: 02/28/2011Data Release Frequency: Annually
SOLANO COUNTY:
Leaking Underground Storage TanksA listing of leaking underground storage tank sites located in Solano county.
Date of Government Version: 09/07/2010Date Data Arrived at EDR: 09/10/2010Date Made Active in Reports: 09/29/2010Number of Days to Update: 19
Source: Solano County Department of Environmental ManagementTelephone: 707-784-6770Last EDR Contact: 12/06/2010Next Scheduled EDR Contact: 03/21/2011Data Release Frequency: Quarterly
Underground Storage TanksUnderground storage tank sites located in Solano county.
Date of Government Version: 09/07/2010Date Data Arrived at EDR: 09/14/2010Date Made Active in Reports: 09/30/2010Number of Days to Update: 16
Source: Solano County Department of Environmental ManagementTelephone: 707-784-6770Last EDR Contact: 12/06/2010Next Scheduled EDR Contact: 03/21/2011Data Release Frequency: Quarterly
SONOMA COUNTY:
Leaking Underground Storage Tank SitesA listing of leaking underground storage tank sites located in Sonoma county.
Date of Government Version: 10/04/2010Date Data Arrived at EDR: 10/05/2010Date Made Active in Reports: 11/17/2010Number of Days to Update: 43
Source: Department of Health ServicesTelephone: 707-565-6565Last EDR Contact: 01/03/2011Next Scheduled EDR Contact: 04/18/2011Data Release Frequency: Quarterly
SUTTER COUNTY:
Underground Storage TanksUnderground storage tank sites located in Sutter county.
Date of Government Version: 09/13/2010Date Data Arrived at EDR: 09/14/2010Date Made Active in Reports: 09/30/2010Number of Days to Update: 16
Source: Sutter County Department of AgricultureTelephone: 530-822-7500Last EDR Contact: 12/13/2010Next Scheduled EDR Contact: 03/28/2011Data Release Frequency: Semi-Annually
VENTURA COUNTY:
Business Plan, Hazardous Waste Producers, and Operating Underground TanksThe BWT list indicates by site address whether the Environmental Health Division has Business Plan (B), WasteProducer (W), and/or Underground Tank (T) information.
TC2957885.1s Page GR-31
GOVERNMENT RECORDS SEARCHED / DATA CURRENCY TRACKING
C-47

Date of Government Version: 07/26/2010Date Data Arrived at EDR: 09/01/2010Date Made Active in Reports: 09/29/2010Number of Days to Update: 28
Source: Ventura County Environmental Health DivisionTelephone: 805-654-2813Last EDR Contact: 11/22/2010Next Scheduled EDR Contact: 03/07/2011Data Release Frequency: Quarterly
Inventory of Illegal Abandoned and Inactive SitesVentura County Inventory of Closed, Illegal Abandoned, and Inactive Sites.
Date of Government Version: 08/01/2009Date Data Arrived at EDR: 10/05/2009Date Made Active in Reports: 10/13/2009Number of Days to Update: 8
Source: Environmental Health DivisionTelephone: 805-654-2813Last EDR Contact: 09/27/2010Next Scheduled EDR Contact: 11/15/2010Data Release Frequency: Annually
Listing of Underground Tank Cleanup SitesVentura County Underground Storage Tank Cleanup Sites (LUST).
Date of Government Version: 05/29/2008Date Data Arrived at EDR: 06/24/2008Date Made Active in Reports: 07/31/2008Number of Days to Update: 37
Source: Environmental Health DivisionTelephone: 805-654-2813Last EDR Contact: 11/22/2010Next Scheduled EDR Contact: 03/07/2011Data Release Frequency: Quarterly
Underground Tank Closed Sites ListVentura County Operating Underground Storage Tank Sites (UST)/Underground Tank Closed Sites List.
Date of Government Version: 08/31/2010Date Data Arrived at EDR: 09/21/2010Date Made Active in Reports: 09/30/2010Number of Days to Update: 9
Source: Environmental Health DivisionTelephone: 805-654-2813Last EDR Contact: 12/20/2010Next Scheduled EDR Contact: 04/04/2011Data Release Frequency: Quarterly
YOLO COUNTY:
Underground Storage Tank Comprehensive Facility ReportUnderground storage tank sites located in Yolo county.
Date of Government Version: 10/05/2010Date Data Arrived at EDR: 10/15/2010Date Made Active in Reports: 11/18/2010Number of Days to Update: 34
Source: Yolo County Department of HealthTelephone: 530-666-8646Last EDR Contact: 12/23/2010Next Scheduled EDR Contact: 04/11/2011Data Release Frequency: Annually
OTHER DATABASE(S)
Depending on the geographic area covered by this report, the data provided in these specialty databases may or may not becomplete. For example, the existence of wetlands information data in a specific report does not mean that all wetlands in thearea covered by the report are included. Moreover, the absence of any reported wetlands information does not necessarilymean that wetlands do not exist in the area covered by the report.
CT MANIFEST: Hazardous Waste Manifest DataFacility and manifest data. Manifest is a document that lists and tracks hazardous waste from the generator throughtransporters to a tsd facility.
Date of Government Version: 12/31/2007Date Data Arrived at EDR: 08/26/2009Date Made Active in Reports: 09/11/2009Number of Days to Update: 16
Source: Department of Environmental ProtectionTelephone: 860-424-3375Last EDR Contact: 12/01/2010Next Scheduled EDR Contact: 03/07/2011Data Release Frequency: Annually
TC2957885.1s Page GR-32
GOVERNMENT RECORDS SEARCHED / DATA CURRENCY TRACKING
C-48

NJ MANIFEST: Manifest InformationHazardous waste manifest information.
Date of Government Version: 12/31/2009Date Data Arrived at EDR: 07/22/2010Date Made Active in Reports: 08/26/2010Number of Days to Update: 35
Source: Department of Environmental ProtectionTelephone: N/ALast EDR Contact: 10/19/2010Next Scheduled EDR Contact: 01/31/2011Data Release Frequency: Annually
NY MANIFEST: Facility and Manifest DataManifest is a document that lists and tracks hazardous waste from the generator through transporters to a TSDfacility.
Date of Government Version: 10/28/2010Date Data Arrived at EDR: 11/09/2010Date Made Active in Reports: 12/17/2010Number of Days to Update: 38
Source: Department of Environmental ConservationTelephone: 518-402-8651Last EDR Contact: 11/09/2010Next Scheduled EDR Contact: 02/21/2011Data Release Frequency: Annually
PA MANIFEST: Manifest InformationHazardous waste manifest information.
Date of Government Version: 12/31/2008Date Data Arrived at EDR: 12/01/2009Date Made Active in Reports: 12/14/2009Number of Days to Update: 13
Source: Department of Environmental ProtectionTelephone: 717-783-8990Last EDR Contact: 11/22/2010Next Scheduled EDR Contact: 03/07/2011Data Release Frequency: Annually
RI MANIFEST: Manifest informationHazardous waste manifest information
Date of Government Version: 12/31/2009Date Data Arrived at EDR: 07/19/2010Date Made Active in Reports: 08/26/2010Number of Days to Update: 38
Source: Department of Environmental ManagementTelephone: 401-222-2797Last EDR Contact: 11/29/2010Next Scheduled EDR Contact: 03/14/2011Data Release Frequency: Annually
WI MANIFEST: Manifest InformationHazardous waste manifest information.
Date of Government Version: 12/31/2009Date Data Arrived at EDR: 07/06/2010Date Made Active in Reports: 07/26/2010Number of Days to Update: 20
Source: Department of Natural ResourcesTelephone: N/ALast EDR Contact: 12/16/2010Next Scheduled EDR Contact: 04/04/2011Data Release Frequency: Annually
Oil/Gas Pipelines: This data was obtained by EDR from the USGS in 1994. It is referred to by USGS as GeoData Digital Line Graphsfrom 1:100,000-Scale Maps. It was extracted from the transportation category including some oil, but primarilygas pipelines.
Electric Power Transmission Line DataSource: Rextag Strategies Corp.Telephone: (281) 769-2247U.S. Electric Transmission and Power Plants Systems Digital GIS Data
Sensitive Receptors: There are individuals deemed sensitive receptors due to their fragile immune systems and special sensitivityto environmental discharges. These sensitive receptors typically include the elderly, the sick, and children. While the location of allsensitive receptors cannot be determined, EDR indicates those buildings and facilities - schools, daycares, hospitals, medical centers,and nursing homes - where individuals who are sensitive receptors are likely to be located.
AHA Hospitals:Source: American Hospital Association, Inc.Telephone: 312-280-5991The database includes a listing of hospitals based on the American Hospital Association’s annual survey of hospitals.
TC2957885.1s Page GR-33
GOVERNMENT RECORDS SEARCHED / DATA CURRENCY TRACKING
C-49

Medical Centers: Provider of Services ListingSource: Centers for Medicare & Medicaid ServicesTelephone: 410-786-3000A listing of hospitals with Medicare provider number, produced by Centers of Medicare & Medicaid Services,a federal agency within the U.S. Department of Health and Human Services.
Nursing HomesSource: National Institutes of HealthTelephone: 301-594-6248Information on Medicare and Medicaid certified nursing homes in the United States.
Public SchoolsSource: National Center for Education StatisticsTelephone: 202-502-7300The National Center for Education Statistics’ primary database on elementaryand secondary public education in the United States. It is a comprehensive, annual, national statisticaldatabase of all public elementary and secondary schools and school districts, which contains data that arecomparable across all states.
Private SchoolsSource: National Center for Education StatisticsTelephone: 202-502-7300The National Center for Education Statistics’ primary database on private school locations in the United States.
Daycare Centers: Licensed FacilitiesSource: Department of Social ServicesTelephone: 916-657-4041
Flood Zone Data: This data, available in select counties across the country, was obtained by EDR in 2003 & 2009 from the FederalEmergency Management Agency (FEMA). Data depicts 100-year and 500-year flood zones as defined by FEMA.
NWI: National Wetlands Inventory. This data, available in select counties across the country, was obtained by EDRin 2002 and 2005 from the U.S. Fish and Wildlife Service.
STREET AND ADDRESS INFORMATION
© 2010 Tele Atlas North America, Inc. All rights reserved. This material is proprietary and the subject of copyright protectionand other intellectual property rights owned by or licensed to Tele Atlas North America, Inc. The use of this material is subjectto the terms of a license agreement. You will be held liable for any unauthorized copying or disclosure of this material.
TC2957885.1s Page GR-34
GOVERNMENT RECORDS SEARCHED / DATA CURRENCY TRACKING
C-50

TC2957885.1s Page A-1
geologic strata.of the soil, and nearby wells. Groundwater flow velocity is generally impacted by the nature of theGroundwater flow direction may be impacted by surface topography, hydrology, hydrogeology, characteristics
2. Groundwater flow velocity. 1. Groundwater flow direction, and
Assessment of the impact of contaminant migration generally has two principle investigative components:
forming an opinion about the impact of potential contaminant migration.EDR’s GeoCheck Physical Setting Source Addendum is provided to assist the environmental professional in
1987Most Recent Revision:37121-F1 SALIDA, CAWest Map:
1976Most Recent Revision:37120-G8 ESCALON, CANorth Map:
1987Most Recent Revision:37120-F8 RIVERBANK, CATarget Property Map:
USGS TOPOGRAPHIC MAP
110 ft. above sea levelElevation:4178308.5UTM Y (Meters): 677053.4UTM X (Meters): Zone 10Universal Tranverse Mercator: 120.9907 - 120˚ 59’ 26.5’’Longitude (West): 37.73680 - 37˚ 44’ 12.5’’Latitude (North):
TARGET PROPERTY COORDINATES
MODESTO, CA 95356299 PATERSON ROADMCHENRY SOLAR FARM
TARGET PROPERTY ADDRESS
GEOCHECK - PHYSICAL SETTING SOURCE ADDENDUM®
C-51

TC2957885.1s Page A-2
should be field verified.on a relative (not an absolute) basis. Relative elevation information between sites of close proximitySource: Topography has been determined from the USGS 7.5’ Digital Elevation Model and should be evaluated
SURROUNDING TOPOGRAPHY: ELEVATION PROFILES
Ele
vatio
n (ft
)E
leva
tion
(ft)
TP
TP0 1/2 1 Miles✩Target Property Elevation: 110 ft.
North South
West East
112
117
121
124
123
112
112
111
110
110
111
111
112
102
102
105
1029186104
105
106
107
107
107
107
108
109
110
111
112
112 77 77 78
95
143
147
General WestGeneral Topographic Gradient:TARGET PROPERTY TOPOGRAPHY
should contamination exist on the target property, what downgradient sites might be impacted.assist the environmental professional in forming an opinion about the impact of nearby contaminated properties or,Surface topography may be indicative of the direction of surficial groundwater flow. This information can be used toTOPOGRAPHIC INFORMATION
collected on nearby properties, and regional groundwater flow information (from deep aquifers).sources of information, such as surface topographic information, hydrologic information, hydrogeologic datausing site-specific well data. If such data is not reasonably ascertainable, it may be necessary to rely on otherGroundwater flow direction for a particular site is best determined by a qualified environmental professionalGROUNDWATER FLOW DIRECTION INFORMATION
GEOCHECK - PHYSICAL SETTING SOURCE SUMMARY®
C-52

TC2957885.1s Page A-3
Not Reported
GENERAL DIRECTIONLOCATIONGROUNDWATER FLOWFROM TPMAP ID
hydrogeologically, and the depth to water table.authorities at select sites and has extracted the date of the report, groundwater flow direction as determinedflow at specific points. EDR has reviewed reports submitted by environmental professionals to regulatoryEDR has developed the AQUIFLOW Information System to provide data on the general direction of groundwater
AQUIFLOW®
Search Radius: 1.000 Mile.
Not found Status:1.25 miles Search Radius:
Site-Specific Hydrogeological Data*:
* ©1996 Site−specific hydrogeological data gathered by CERCLIS Alerts, Inc., Bainbridge Island, WA. All rights reserved. All of the information and opinions presented are those of the cited EPA report(s), which were completed undera Comprehensive Environmental Response Compensation and Liability Information System (CERCLIS) investigation.
contamination exist on the target property, what downgradient sites might be impacted.environmental professional in forming an opinion about the impact of nearby contaminated properties or, shouldof groundwater flow direction in the immediate area. Such hydrogeologic information can be used to assist theHydrogeologic information obtained by installation of wells on a specific site can often be an indicatorHYDROGEOLOGIC INFORMATION
YES - refer to the Overview Map and Detail MapRIVERBANK
NATIONAL WETLAND INVENTORYNWI ElectronicData CoverageNWI Quad at Target Property
Not ReportedAdditional Panels in search area:
06099C - FEMA DFIRM Flood dataFlood Plain Panel at Target Property:
YES - refer to the Overview Map and Detail MapSTANISLAUS, CA
FEMA FLOOD ZONEFEMA FloodElectronic DataTarget Property County
and bodies of water).Refer to the Physical Setting Source Map following this summary for hydrologic information (major waterways
contamination exist on the target property, what downgradient sites might be impacted.the environmental professional in forming an opinion about the impact of nearby contaminated properties or, shouldSurface water can act as a hydrologic barrier to groundwater flow. Such hydrologic information can be used to assistHYDROLOGIC INFORMATION
GEOCHECK - PHYSICAL SETTING SOURCE SUMMARY®
C-53

TC2957885.1s Page A-4
Map, USGS Digital Data Series DDS - 11 (1994).of the Conterminous U.S. at 1:2,500,000 Scale - a digital representation of the 1974 P.B. King and H.M. BeikmanGeologic Age and Rock Stratigraphic Unit Source: P.G. Schruben, R.E. Arndt and W.J. Bawiec, Geology
ROCK STRATIGRAPHIC UNIT GEOLOGIC AGE IDENTIFICATION
Stratifed SequenceCategory:CenozoicEra:QuaternarySystem:QuaternarySeries:QCode: (decoded above as Era, System & Series)
at which contaminant migration may be occurring.Geologic information can be used by the environmental professional in forming an opinion about the relative speedGEOLOGIC INFORMATION IN GENERAL AREA OF TARGET PROPERTY
move more quickly through sandy-gravelly types of soils than silty-clayey types of soils.characteristics data collected on nearby properties and regional soil information. In general, contaminant plumesto rely on other sources of information, including geologic age identification, rock stratigraphic unit and soilusing site specific geologic and soil strata data. If such data are not reasonably ascertainable, it may be necessaryGroundwater flow velocity information for a particular site is best determined by a qualified environmental professionalGROUNDWATER FLOW VELOCITY INFORMATION
GEOCHECK - PHYSICAL SETTING SOURCE SUMMARY®
C-54

EDR Inc.EDR Inc.EDR Inc.EDR Inc.EDR Inc.EDR Inc.EDR Inc.EDR Inc.EDR Inc.EDR Inc.EDR Inc.EDR Inc.EDR Inc.EDR Inc.EDR Inc.EDR Inc.EDR Inc.EDR Inc.EDR Inc.EDR Inc.EDR Inc.EDR Inc.EDR Inc.EDR Inc.EDR Inc.EDR Inc.EDR Inc.EDR Inc.EDR Inc.EDR Inc.EDR Inc.EDR Inc.EDR Inc.EDR Inc.EDR Inc.EDR Inc.EDR Inc.EDR Inc.EDR Inc.EDR Inc.
2
1
0 1/16 1/8 1/4 Miles
C-55

TC2957885.1s Page A-6
Somewhat excessively drainedSoil Drainage Class:
excessively drained sands and gravels.Class A - High infiltration rates. Soils are deep, well drained toHydrologic Group:
loamy sandSoil Surface Texture:
TujungaSoil Component Name:
Soil Map ID: 2
Min: 6.1Max: 7.8
Min: 14Max: 42
Silty Sand.Sands with fines,SOILS, Sands,COARSE-GRAINED
Soils.200), Siltypassing No.than 35 pct.Materials (moreSilt-Claysandy loam59 inches11 inches 2
Min: 6.1Max: 7.8
Min: 14Max: 42
Silty Sand.Sands with fines,SOILS, Sands,COARSE-GRAINED
Soils.200), Siltypassing No.than 35 pct.Materials (moreSilt-Claysandy loam11 inches 0 inches 1
Soil Layer Information
Boundary Classification Saturatedhydraulicconductivitymicro m/sec
Layer Upper Lower Soil Texture Class AASHTO Group Unified Soil Soil Reaction(pH)
> 0 inchesDepth to Watertable Min:
> 0 inchesDepth to Bedrock Min:
ModerateCorrosion Potential - Uncoated Steel:
Hydric Status: Not hydric
Well drainedSoil Drainage Class:
textures.moderately well and well drained soils with moderately coarseClass B - Moderate infiltration rates. Deep and moderately deep,Hydrologic Group:
sandy loamSoil Surface Texture:
HanfordSoil Component Name:
Soil Map ID: 1
in a landscape. The following information is based on Soil Conservation Service SSURGO data.for privately owned lands in the United States. A soil map in a soil survey is a representation of soil patternsSurvey (NCSS) and is responsible for collecting, storing, maintaining and distributing soil survey informationThe U.S. Department of Agriculture’s (USDA) Soil Conservation Service (SCS) leads the National Cooperative Soil
DOMINANT SOIL COMPOSITION IN GENERAL AREA OF TARGET PROPERTY
GEOCHECK - PHYSICAL SETTING SOURCE SUMMARY®
C-56

TC2957885.1s Page A-7
> 0 inchesDepth to Watertable Min:
> 0 inchesDepth to Bedrock Min:
ModerateCorrosion Potential - Uncoated Steel:
Hydric Status: Not hydric
Somewhat excessively drainedSoil Drainage Class:
excessively drained sands and gravels.Class A - High infiltration rates. Soils are deep, well drained toHydrologic Group:
sandSoil Surface Texture:
TujungaSoil Component Name:
Soil Map ID: 3
Min: 6.1Max: 7.8
Min: 42Max: 141
Silty Sand.Sands with fines,SOILS, Sands,COARSE-GRAINED
Sand.Gravel andFragments,200), Stonepassing No.pct. or lessmaterials (35Granularloamy sand59 inches 9 inches 2
Min: 6.1Max: 7.8
Min: 42Max: 141
Silty Sand.Sands with fines,SOILS, Sands,COARSE-GRAINED
Sand.Gravel andFragments,200), Stonepassing No.pct. or lessmaterials (35Granularloamy sand 9 inches 0 inches 1
Soil Layer Information
Boundary Classification Saturatedhydraulicconductivitymicro m/sec
Layer Upper Lower Soil Texture Class AASHTO Group Unified Soil Soil Reaction(pH)
> 0 inchesDepth to Watertable Min:
> 0 inchesDepth to Bedrock Min:
ModerateCorrosion Potential - Uncoated Steel:
Hydric Status: Not hydric
GEOCHECK - PHYSICAL SETTING SOURCE SUMMARY®
C-57

TC2957885.1s Page A-8
FEDERAL FRDS PUBLIC WATER SUPPLY SYSTEM INFORMATION
LOCATIONFROM TPWELL IDMAP ID
1/2 - 1 Mile ESEUSGS3205248 81/2 - 1 Mile SEUSGS3205247 41/2 - 1 Mile SouthUSGS3205243 A2
FEDERAL USGS WELL INFORMATION
LOCATIONFROM TPWELL IDMAP ID
1.000State DatabaseNearest PWS within 1 mileFederal FRDS PWS1.000Federal USGS
WELL SEARCH DISTANCE INFORMATION
SEARCH DISTANCE (miles)DATABASE
opinion about the impact of contaminant migration on nearby drinking water wells.professional in assessing sources that may impact ground water flow direction, and in forming anEDR Local/Regional Water Agency records provide water well information to assist the environmental
LOCAL / REGIONAL WATER AGENCY RECORDS
Min: 6.1Max: 7.8
Min: 42Max: 141
Silty Sand.Sands with fines,SOILS, Sands,COARSE-GRAINED
Sand.Gravel andFragments,200), Stonepassing No.pct. or lessmaterials (35Granularloamy sand59 inches 9 inches 2
Min: 6.1Max: 7.8
Min: 42Max: 141
Silty Sand.Sands with fines,SOILS, Sands,COARSE-GRAINED
Sand.Gravel andFragments,200), Stonepassing No.pct. or lessmaterials (35Granularsand 9 inches 0 inches 1
Soil Layer Information
Boundary Classification Saturatedhydraulicconductivitymicro m/sec
Layer Upper Lower Soil Texture Class AASHTO Group Unified Soil Soil Reaction(pH)
GEOCHECK - PHYSICAL SETTING SOURCE SUMMARY®
C-58

TC2957885.1s Page A-9
1/2 - 1 Mile WNW2670 B121/2 - 1 Mile WNW2669 B111/2 - 1 Mile SSWCADW40000038193 101/2 - 1 Mile NW2671 91/2 - 1 Mile ENECADW40000038273 71/2 - 1 Mile ESECADW40000038250 61/2 - 1 Mile West2668 51/2 - 1 Mile SouthCADW40000038220 A31/4 - 1/2 Mile WNWCADW40000038272 1
STATE DATABASE WELL INFORMATION
LOCATIONFROM TPWELL IDMAP ID
Note: PWS System location is not always the same as well location.
No PWS System Found
FEDERAL FRDS PUBLIC WATER SUPPLY SYSTEM INFORMATION
LOCATIONFROM TPWELL IDMAP ID
GEOCHECK - PHYSICAL SETTING SOURCE SUMMARY®
C-59

EDR Inc.EDR Inc.EDR Inc.EDR Inc.EDR Inc.EDR Inc.EDR Inc.EDR Inc.EDR Inc.EDR Inc.EDR Inc.EDR Inc.EDR Inc.EDR Inc.EDR Inc.EDR Inc.EDR Inc.EDR Inc.EDR Inc.EDR Inc.EDR Inc.EDR Inc.EDR Inc.EDR Inc.EDR Inc.EDR Inc.EDR Inc.EDR Inc.EDR Inc.EDR Inc.EDR Inc.EDR Inc.EDR Inc.EDR Inc.EDR Inc.EDR Inc.EDR Inc.EDR Inc.EDR Inc.EDR Inc.
100
1 0 0
100
100
CA
C-60

TC2957885.1s Page A-11
Ground-water levels, Number of Measurements: 0
0Ground water data count:0000-00-00Ground water data end date:Ground water data begin date: 0000-00-003Water quality data count:1966-08-08Water quality data end date:1949-08-12Water quality data begin date:0Peak flow data count:0000-00-00Peak flow data end date:0000-00-00Peak flow data begin date:0Daily flow data count:0000-00-00Daily flow data end date:0000-00-00Daily flow data begin date:0Real time data flag:
479435800Project number:Not ReportedSource of depth data:
150Hole depth:132Well depth:ALLUVIUM OF THE SIERRA NEVADAAquifer:Not ReportedAquifer Type:Single well, other than collector or Ranney typeType of ground water site:YLocal standard time flag:
PSTMean greenwich time offset:Not ReportedDate inventoried:19480701Date construction:Ground-water other than SpringSite type:
Valley flatTopographic:Lower CosumnesLower Mokelumne. California. Area = 747 sq.mi.Hydrologic:National Geodetic Vertical Datum of 1929Altitude datum:2.5Altitude accuracy:Interpolated from topographic mapAltitude method:119.00Altitude:
24000Map scale:RIVERBANKLocation map:Not ReportedLand net:USCountry:099County:06State:06District:NAD83Dec latlong datum:NAD27Latlong datum:SCoor accr:MCoor meth:-120.99049076Dec lon:37.7290952Dec lat:1205922Longitude:USGS3205243EDR Site id:374345Latitude:
002S009E28N001MSite name:374345120592201Site no:USGSAgency cd:
A2South1/2 - 1 MileHigher
USGS3205243FED USGS
CADW40000038272Site id:502202Gwcode:50Countyco:ZWelluseco:8Districtco:02S09E29A001MStwellno:37.7397Latiude:-120.995Longitude:
1WNW1/4 - 1/2 MileHigher
CADW40000038272CA WELLS
Map IDDirectionDistanceElevation EDR ID NumberDatabase
GEOCHECK - PHYSICAL SETTING SOURCE MAP FINDINGS®
C-61

TC2957885.1s Page A-12
Ground-water levels, Number of Measurements: 0
Not ReportedGround water data count:Not ReportedGround water data end date:Ground water data begin date: Not ReportedNot ReportedWater quality data count:Not ReportedWater quality data end date:Not ReportedWater quality data begin date:Not ReportedPeak flow data count:Not ReportedPeak flow data end date:Not ReportedPeak flow data begin date:Not ReportedDaily flow data count:Not ReportedDaily flow data end date:Not ReportedDaily flow data begin date:Not ReportedReal time data flag:
470648500Project number:ownerSource of depth data:
Not ReportedHole depth:123Well depth:ALLUVIUM (QUATERNARY)Aquifer:Unconfined single aquiferAquifer Type:Single well, other than collector or Ranney typeType of ground water site:YLocal standard time flag:
PSTMean greenwich time offset:20011016Date inventoried:Not ReportedDate construction:Ground-water other than SpringSite type:
Flat surfaceTopographic:Not ReportedHydrologic:National Geodetic Vertical Datum of 1929Altitude datum:5Altitude accuracy:Interpolated from topographic mapAltitude method:115Altitude:
24000Map scale:RIVERBANKLocation map:Not ReportedLand net:USCountry:099County:06State:06District:NAD83Dec latlong datum:NAD83Latlong datum:5Coor accr:GCoor meth:-120.98330556Dec lon:37.73113889Dec lat:1205859.9Longitude:USGS3205247EDR Site id:374352.1Latitude:
002S009E28K001MSite name:374352120585901Site no:USGSAgency cd:
4SE1/2 - 1 MileHigher
USGS3205247FED USGS
CADW40000038220Site id:502202Gwcode:50Countyco:ZWelluseco:8Districtco:02S09E28N001MStwellno:37.7289Latiude:-120.9892Longitude:
A3South1/2 - 1 MileHigher
CADW40000038220CA WELLS
Map IDDirectionDistanceElevation EDR ID NumberDatabase
GEOCHECK - PHYSICAL SETTING SOURCE MAP FINDINGS®
C-62
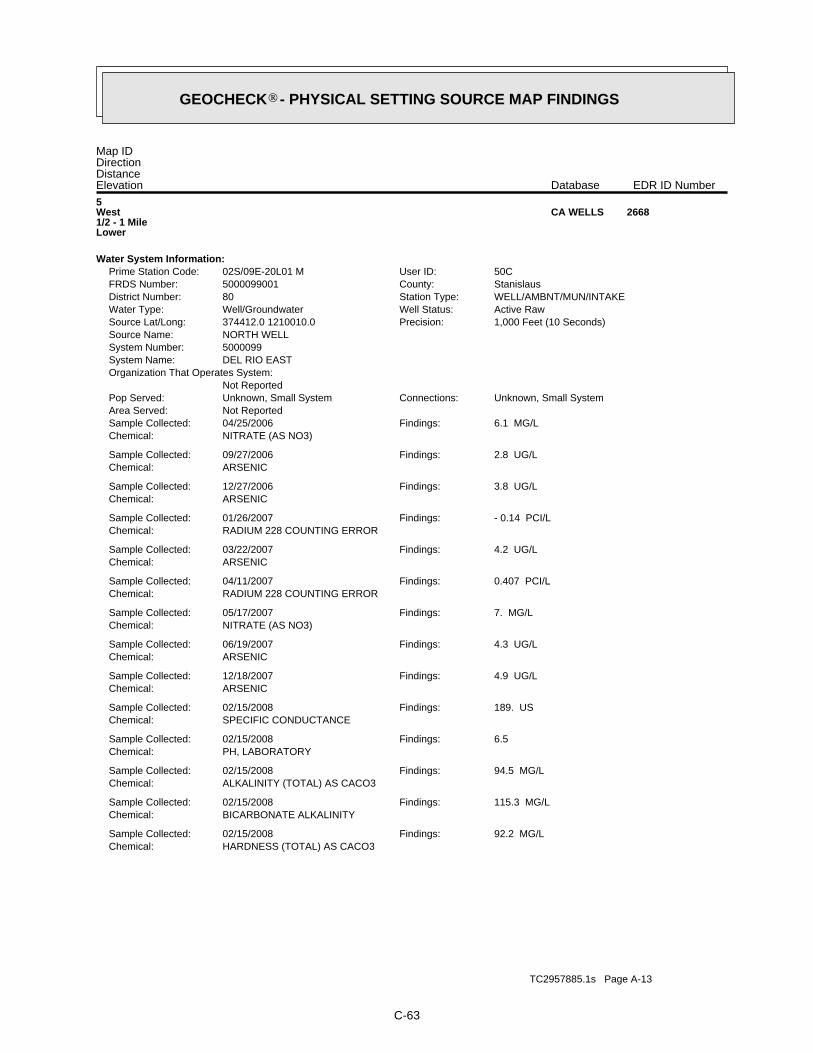
TC2957885.1s Page A-13
HARDNESS (TOTAL) AS CACO3Chemical:92.2 MG/LFindings:02/15/2008Sample Collected:
BICARBONATE ALKALINITYChemical:115.3 MG/LFindings:02/15/2008Sample Collected:
ALKALINITY (TOTAL) AS CACO3Chemical:94.5 MG/LFindings:02/15/2008Sample Collected:
PH, LABORATORYChemical:6.5Findings:02/15/2008Sample Collected:
SPECIFIC CONDUCTANCEChemical:189. USFindings:02/15/2008Sample Collected:
ARSENICChemical:4.9 UG/LFindings:12/18/2007Sample Collected:
ARSENICChemical:4.3 UG/LFindings:06/19/2007Sample Collected:
NITRATE (AS NO3)Chemical:7. MG/LFindings:05/17/2007Sample Collected:
RADIUM 228 COUNTING ERRORChemical:0.407 PCI/LFindings:04/11/2007Sample Collected:
ARSENICChemical:4.2 UG/LFindings:03/22/2007Sample Collected:
RADIUM 228 COUNTING ERRORChemical:- 0.14 PCI/LFindings:01/26/2007Sample Collected:
ARSENICChemical:3.8 UG/LFindings:12/27/2006Sample Collected:
ARSENICChemical:2.8 UG/LFindings:09/27/2006Sample Collected:
NITRATE (AS NO3)Chemical:6.1 MG/LFindings:04/25/2006Sample Collected:
Not ReportedArea Served:Unknown, Small SystemConnections:Unknown, Small SystemPop Served:
Not ReportedOrganization That Operates System:
DEL RIO EASTSystem Name:5000099System Number:NORTH WELLSource Name:
1,000 Feet (10 Seconds)Precision:374412.0 1210010.0Source Lat/Long:Active RawWell Status:Well/GroundwaterWater Type:WELL/AMBNT/MUN/INTAKEStation Type:80District Number:StanislausCounty:5000099001FRDS Number:50CUser ID:02S/09E-20L01 MPrime Station Code:
Water System Information:
5West1/2 - 1 MileLower
2668CA WELLS
Map IDDirectionDistanceElevation EDR ID NumberDatabase
GEOCHECK - PHYSICAL SETTING SOURCE MAP FINDINGS®
C-63

TC2957885.1s Page A-14
6ESE1/2 - 1 MileHigher
CADW40000038250CA WELLS
NITRATE (AS NO3)Chemical:9.5 MG/LFindings:05/21/2010Sample Collected:
NITRATE (AS NO3)Chemical:6. MG/LFindings:05/12/2009Sample Collected:
BICARBONATE ALKALINITYChemical:102.5 MG/LFindings:04/29/2009Sample Collected:
ALKALINITY (TOTAL) AS CACO3Chemical:84. MG/LFindings:04/29/2009Sample Collected:
ARSENICChemical:4.1 UG/LFindings:09/12/2008Sample Collected:
SPECIFIC CONDUCTANCEChemical:180. USFindings:09/12/2008Sample Collected:
ARSENICChemical:2.3 UG/LFindings:06/03/2008Sample Collected:
NITRATE (AS NO3)Chemical:7.4 MG/LFindings:05/05/2008Sample Collected:
ARSENICChemical:4.2 UG/LFindings:03/07/2008Sample Collected:
SPECIFIC CONDUCTANCEChemical:170. USFindings:03/07/2008Sample Collected:
ARSENICChemical:3.9 UG/LFindings:02/15/2008Sample Collected:
POTASSIUMChemical:4.2 MG/LFindings:02/15/2008Sample Collected:
SODIUMChemical:13. MG/LFindings:02/15/2008Sample Collected:
MAGNESIUMChemical:5.8 MG/LFindings:02/15/2008Sample Collected:
NITRATE + NITRITE (AS N)Chemical:1876. UG/LFindings:02/15/2008Sample Collected:
NITRATE (AS NO3)Chemical:8.3 MG/LFindings:02/15/2008Sample Collected:
TOTAL DISSOLVED SOLIDSChemical:172. MG/LFindings:02/15/2008Sample Collected:
CHLORIDEChemical:6.2 MG/LFindings:02/15/2008Sample Collected:
CALCIUMChemical:18.5 MG/LFindings:02/15/2008Sample Collected:
GEOCHECK - PHYSICAL SETTING SOURCE MAP FINDINGS®
C-64

TC2957885.1s Page A-15
0000-00-00Peak flow data end date:0000-00-00Peak flow data begin date:0Daily flow data count:0000-00-00Daily flow data end date:0000-00-00Daily flow data begin date:0Real time data flag:
470648500Project number:drillerSource of depth data:
175Hole depth:165Well depth:ALLUVIUM (QUATERNARY)Aquifer:Unconfined single aquiferAquifer Type:Single well, other than collector or Ranney typeType of ground water site:YLocal standard time flag:
PSTMean greenwich time offset:Not ReportedDate inventoried:19900402Date construction:Ground-water other than SpringSite type:
Valley flatTopographic:Middle San JoaquinLower MercedLower Stanislaus. California. Area = 1830 sq.mi.Hydrologic:National Geodetic Vertical Datum of 1929Altitude datum:2.5Altitude accuracy:Interpolated from topographic mapAltitude method:122Altitude:
24000Map scale:RIVERBANKLocation map:Not ReportedLand net:USCountry:099County:06State:06District:NAD83Dec latlong datum:NAD83Latlong datum:5Coor accr:GCoor meth:-120.97665278Dec lon:37.73229722Dec lat:1205835.95Longitude:USGS3205248EDR Site id:374356.27Latitude:
002S009E28J001MSite name:374356120583701Site no:USGSAgency cd:
8ESE1/2 - 1 MileHigher
USGS3205248FED USGS
CADW40000038273Site id:502202Gwcode:50Countyco:ZWelluseco:8Districtco:02S09E28A001MStwellno:37.7397Latiude:-120.9761Longitude:
7ENE1/2 - 1 MileLower
CADW40000038273CA WELLS
CADW40000038250Site id:502202Gwcode:50Countyco:ZWelluseco:8Districtco:02S09E28H001MStwellno:37.7347Latiude:-120.9764Longitude:
GEOCHECK - PHYSICAL SETTING SOURCE MAP FINDINGS®
C-65

TC2957885.1s Page A-16
SOUTH WELLSource Name:1,000 Feet (10 Seconds)Precision:374438.0 1210014.0Source Lat/Long:Active RawWell Status:Well/GroundwaterWater Type:WELL/AMBNT/MUN/INTAKEStation Type:80District Number:StanislausCounty:5000099002FRDS Number:50CUser ID:02S/09E-20P01 MPrime Station Code:
Water System Information:
B11WNW1/2 - 1 MileHigher
2669CA WELLS
CADW40000038193Site id:502202Gwcode:50Countyco:ZWelluseco:8Districtco:02S09E32A001MStwellno:37.725Latiude:-120.9947Longitude:
10SSW1/2 - 1 MileHigher
CADW40000038193CA WELLS
HILLCRESTArea Served:240Connections:805Pop Served:
MODESTO, CA 95353P.O. BOX 3250
Organization That Operates System:City of Modesto, DE HillcrestSystem Name:5010029System Number:WELL 289 - KRISTINASource Name:
1,000 Feet (10 Seconds)Precision:374438.0 1210008.0Source Lat/Long:Active UntreatedWell Status:Well/GroundwaterWater Type:WELL/AMBNT/MUN/INTAKEStation Type:10District Number:StanislausCounty:5010029004FRDS Number:PTAUser ID:02S/09E-20Q01 MPrime Station Code:
Water System Information:
9NW1/2 - 1 MileHigher
2671CA WELLS
1994-07-26 57.92
DateFeet belowSurface
Feet toSealevel
-------------------------------------------------
Ground-water levels, Number of Measurements: 1
1Ground water data count:1994-07-26Ground water data end date:Ground water data begin date: 1994-07-262Water quality data count:1994-07-26Water quality data end date:1994-07-26Water quality data begin date:0Peak flow data count:
GEOCHECK - PHYSICAL SETTING SOURCE MAP FINDINGS®
C-66

TC2957885.1s Page A-17
Not ReportedArea Served:Unknown, Small SystemConnections:Unknown, Small SystemPop Served:
Not ReportedOrganization That Operates System:
DEL RIO COUNTRY CLUBSystem Name:5000265System Number:CLUBHOUSESource Name:
1,000 Feet (10 Seconds)Precision:374438.0 1210014.0Source Lat/Long:Active RawWell Status:Well/GroundwaterWater Type:WELL/AMBNT/MUN/INTAKEStation Type:80District Number:StanislausCounty:5000265001FRDS Number:50CUser ID:02S/09E-20P02 MPrime Station Code:
Water System Information:
B12WNW1/2 - 1 MileHigher
2670CA WELLS
CHROMIUM, HEXAVALENTChemical:5.3 UG/LFindings:01/09/2002Sample Collected:
Not ReportedArea Served:Unknown, Small SystemConnections:Unknown, Small SystemPop Served:
Not ReportedOrganization That Operates System:
DEL RIO EASTSystem Name:5000099System Number:
GEOCHECK - PHYSICAL SETTING SOURCE MAP FINDINGS®
C-67

TC2957885.1s Page A-18
0%0%100%2.250 pCi/LBasementNot ReportedNot ReportedNot ReportedNot ReportedLiving Area - 2nd Floor0%8%92%1.725 pCi/LLiving Area - 1st Floor
% >20 pCi/L% 4-20 pCi/L% <4 pCi/LAverage ActivityArea
Number of sites tested: 12
Federal Area Radon Information for STANISLAUS COUNTY, CA
: Zone 3 indoor average level < 2 pCi/L. : Zone 2 indoor average level >= 2 pCi/L and <= 4 pCi/L. Note: Zone 1 indoor average level > 4 pCi/L.
Federal EPA Radon Zone for STANISLAUS County: 3
2995356
______________________> 4 pCi/LNum TestsZipcode
Radon Test Results
State Database: CA Radon
AREA RADON INFORMATION
GEOCHECK - PHYSICAL SETTING SOURCE MAP FINDINGSRADON
®
C-68

TOPOGRAPHIC INFORMATION
USGS 7.5’ Digital Elevation Model (DEM)Source: United States Geologic SurveyEDR acquired the USGS 7.5’ Digital Elevation Model in 2002 and updated it in 2006. The 7.5 minute DEM correspondsto the USGS 1:24,000- and 1:25,000-scale topographic quadrangle maps. The DEM provides elevation datawith consistent elevation units and projection.
HYDROLOGIC INFORMATION
Flood Zone Data: This data, available in select counties across the country, was obtained by EDR in 2003 & 2009 from the FederalEmergency Management Agency (FEMA). Data depicts 100-year and 500-year flood zones as defined by FEMA.
NWI: National Wetlands Inventory. This data, available in select counties across the country, was obtained by EDRin 2002 and 2005 from the U.S. Fish and Wildlife Service.
HYDROGEOLOGIC INFORMATION
AQUIFLOW Information SystemRSource: EDR proprietary database of groundwater flow informationEDR has developed the AQUIFLOW Information System (AIS) to provide data on the general direction of groundwater
flow at specific points. EDR has reviewed reports submitted to regulatory authorities at select sites and hasextracted the date of the report, hydrogeologically determined groundwater flow direction and depth to water tableinformation.
GEOLOGIC INFORMATION
Geologic Age and Rock Stratigraphic UnitSource: P.G. Schruben, R.E. Arndt and W.J. Bawiec, Geology of the Conterminous U.S. at 1:2,500,000 Scale - A digitalrepresentation of the 1974 P.B. King and H.M. Beikman Map, USGS Digital Data Series DDS - 11 (1994).
STATSGO: State Soil Geographic DatabaseSource: Department of Agriculture, Natural Resources Conservation ServicesThe U.S. Department of Agriculture’s (USDA) Natural Resources Conservation Service (NRCS) leads the nationalConservation Soil Survey (NCSS) and is responsible for collecting, storing, maintaining and distributing soilsurvey information for privately owned lands in the United States. A soil map in a soil survey is a representationof soil patterns in a landscape. Soil maps for STATSGO are compiled by generalizing more detailed (SSURGO)soil survey maps.
SSURGO: Soil Survey Geographic DatabaseSource: Department of Agriculture, Natural Resources Conservation Services (NRCS)Telephone: 800-672-5559SSURGO is the most detailed level of mapping done by the Natural Resources Conservation Services, mappingscales generally range from 1:12,000 to 1:63,360. Field mapping methods using national standards are used toconstruct the soil maps in the Soil Survey Geographic (SSURGO) database. SSURGO digitizing duplicates theoriginal soil survey maps. This level of mapping is designed for use by landowners, townships and countynatural resource planning and management.
LOCAL / REGIONAL WATER AGENCY RECORDS
FEDERAL WATER WELLS
PWS: Public Water SystemsSource: EPA/Office of Drinking WaterTelephone: 202-564-3750Public Water System data from the Federal Reporting Data System. A PWS is any water system which provides water to at
least 25 people for at least 60 days annually. PWSs provide water from wells, rivers and other sources.
TC2957885.1s Page A-19
PHYSICAL SETTING SOURCE RECORDS SEARCHED
C-69

PWS ENF: Public Water Systems Violation and Enforcement DataSource: EPA/Office of Drinking WaterTelephone: 202-564-3750Violation and Enforcement data for Public Water Systems from the Safe Drinking Water Information System (SDWIS) after
August 1995. Prior to August 1995, the data came from the Federal Reporting Data System (FRDS).
USGS Water Wells: USGS National Water Inventory System (NWIS)This database contains descriptive information on sites where the USGS collects or has collected data on surfacewater and/or groundwater. The groundwater data includes information on wells, springs, and other sources of groundwater.
STATE RECORDS
Water Well DatabaseSource: Department of Water ResourcesTelephone: 916-651-9648
California Drinking Water Quality DatabaseSource: Department of Health ServicesTelephone: 916-324-2319The database includes all drinking water compliance and special studies monitoring for the state of California
since 1984. It consists of over 3,200,000 individual analyses along with well and water system information.
OTHER STATE DATABASE INFORMATION
California Oil and Gas Well LocationsSource: Department of ConservationTelephone: 916-323-1779Oil and Gas well locations in the state.
RADON
State Database: CA RadonSource: Department of Health ServicesTelephone: 916-324-2208Radon Database for California
Area Radon InformationSource: USGSTelephone: 703-356-4020The National Radon Database has been developed by the U.S. Environmental Protection Agency(USEPA) and is a compilation of the EPA/State Residential Radon Survey and the National Residential Radon Survey.The study covers the years 1986 - 1992. Where necessary data has been supplemented by information collected atprivate sources such as universities and research institutions.
EPA Radon ZonesSource: EPATelephone: 703-356-4020Sections 307 & 309 of IRAA directed EPA to list and identify areas of U.S. with the potential for elevated indoorradon levels.
OTHER
Airport Landing Facilities: Private and public use landing facilitiesSource: Federal Aviation Administration, 800-457-6656
Epicenters: World earthquake epicenters, Richter 5 or greaterSource: Department of Commerce, National Oceanic and Atmospheric Administration
California Earthquake Fault Lines: The fault lines displayed on EDR’s Topographic map are digitized quaternary fault lines,prepared in 1975 by the United State Geological Survey. Additional information (also from 1975) regarding activity at specific faultlines comes from California’s Preliminary Fault Activity Map prepared by the California Division of Mines and Geology.
TC2957885.1s Page A-20
PHYSICAL SETTING SOURCE RECORDS SEARCHED
C-70

STREET AND ADDRESS INFORMATION
© 2010 Tele Atlas North America, Inc. All rights reserved. This material is proprietary and the subject of copyright protectionand other intellectual property rights owned by or licensed to Tele Atlas North America, Inc. The use of this material is subjectto the terms of a license agreement. You will be held liable for any unauthorized copying or disclosure of this material.
TC2957885.1s Page A-21
PHYSICAL SETTING SOURCE RECORDS SEARCHED
C-71