mcbc holdings, inc. (form: 10-k, received: 09/07/2018 11
TRANSCRIPT

UNITED STATESSECURITIES AND EXCHANGE COMMISSION
Washington, D.C. 20549
FORM 10-K☑ ANNUAL REPORT PURSUANT TO SECTION 13 OR 15(d) OF THE SECURITIES EXCHANGE ACT OF 1934
For the fiscal year ended: June 30, 2020OR
☐ TRANSITION REPORT PURSUANT TO SECTION 13 OR 15(d) OF THE SECURITIES EXCHANGE ACT OF 1934For the transition period from to
MASTERCRAFT BOAT HOLDINGS, INC.(Exact name of registrant as specified in its charter)
Delaware 001-37502 06-1571747(State or Other Jurisdiction (Commission (I.R.S. Employer
of Incorporation or Organization) File Number) Identification No.)
100 Cherokee Cove Drive, Vonore, TN 37885(Address of Principal Executive Office) (Zip Code)
(423) 884-2221(Registrant�s telephone number, including area code)
Securities registered pursuant to Section 12(b) of the Act:
Title of each classTrading
Symbol(s) Name of each exchange on which registered
Common Stock MCFT NASDAQSecurities registered pursuant to Section 12(g) of the Act:
None
Indicate by check mark if the registrant is a well-known seasoned issuer, as defined in Rule 405 of the Securities Act. ☐ Yes ☑ NoIndicate by check mark if the registrant is not required to file reports pursuant to Section 13 or Section 15(d) of the Act. ☐ Yes ☑ No
Indicate by check mark whether the registrant (1) has filed all reports required to be filed by Section 13 or 15(d) of the Securities Exchange Act of 1934 during the preceding 12 months (or forsuch shorter period that the registrant was required to file such reports), and (2) has been subject to such filing requirements for the past 90 days. ☑ Yes ☐ No
Indicate by check mark whether the registrant has submitted electronically every Interactive Data File required to be submitted pursuant to Rule 405 of Regulation S-T (§229.405 of thischapter) during the preceding 12 months (or for such shorter period that the registrant was required to submit such files).
☑ Yes ☐ No
Indicate by check mark whether the registrant is a large accelerated filer, an accelerated filer, a non-accelerated filer, a smaller reporting company, or an emerging growth company. See thedefinitions of �large accelerated filer,� �accelerated filer,� �smaller reporting company,� and �emerging growth company� in Rule 12b-2 of the Exchange Act.
Large accelerated filer ☐ Accelerated filer ☑Non-accelerated filer ☐ Smaller reporting company ☐
Emerging growth company ☑If an emerging growth company, indicate by check mark if the registrant has elected not to use the extended transition period for complying with any new or revised financial accountingstandards provided pursuant to Section 13(a) of the Exchange Act. ☑Indicate by check mark whether the registrant has filed a report on and attestation to its management�s assessment of the effectiveness of its internal control over financial reporting underSection 404(b) of the Sarbanes-Oxley Act (15 U.S.C. 7262(b)) by the registered public accounting firm that prepared or issued its audit report. ☐Indicate by check mark whether the registrant is a shell company (as defined in Rule 12b-2 of the Act). ☐ Yes ☑ No
The aggregate market value of the outstanding common stock, other than shares held by persons who may be deemed affiliates of the registrant, as of the last business day of the registrant�smost recently completed second fiscal quarter, which ended December 29, 2019 and based on the closing sale price as reported on the NASDAQ Global Select Market system, wasapproximately $286,400,000. As of September 4, 2020, there were 18,872,119 shares of the Registrant�s common stock, par value $0.01 per share, issued and outstanding.
DOCUMENTS INCORPORATED BY REFERENCEPortions of the proxy statement for the 2020 annual meeting of stockholders, which will be filed no later than 120 days after the close of the registrant�s fiscal year ended June 30, 2020, areincorporated by reference into Part III of this report.

ii
MASTERCRAFT BOAT HOLDINGS, INC.
ANNUAL REPORT ON FORM 10-KFOR THE YEAR ENDED JUNE 30, 2020
TABLE OF CONTENTS
Page
CAUTIONARY NOTE REGARDING FORWARD-LOOKING STATEMENTS 1BASIS OF PRESENTATION 1
PART IItem 1. Business 2Item 1A. Risk Factors 12Item 1B. Unresolved Staff Comments 27Item 2. Properties 27Item 3. Legal Proceedings 27Item 4. Mine Safety Disclosures 27
PART IIItem 5. Market for Registrant�s Common Equity and Related Stockholder Matters and Issuer Purchases of Equity
Securities28
Item 6. Selected Financial Data 29Item 7. Management's Discussion and Analysis of Financial Condition and Results of Operations 31Item 7A. Quantitative and Qualitative Disclosures about Market Risk 44Item 8. Financial Statements and Supplementary Data 45Item 9. Changes in and Disagreements With Accountants on Accounting and Financial Disclosure 45Item 9A. Controls and Procedures 45Item 9B. Other Information 45
PART IIIItem 10. Directors, Executive Officers and Corporate Governance 46Item 11. Executive Compensation 46Item 12. Security Ownership of Certain Beneficial Owners and Management and Related Stockholder Matters 46Item 13. Certain Relationships and Related Transactions, and Director Independence 46Item 14. Principal Accountant Fees and Services 46
PART IVItem 15. Exhibits, Financial Statement Schedules 47Item 16. Form 10-K Summary 49

1
CAUTIONARY NOTE REGARDING FORWARD-LOOKING STATEMENTS
This Annual Report on Form 10-K contains forward-looking statements within the meaning of the Private Securities LitigationReform Act of 1995. All statements contained in this Form 10-K that do not relate to matters of historical fact should be consideredforward-looking statements, including but not limited to statements regarding our expected market share, business strategy, dealernetwork, anticipated financial results, and liquidity, as well as statements regarding the ongoing COVID-19 Pandemic. We use wordssuch as �could,� �may,� �might,� �will,� �expect,� �likely,� �believe,� �continue,� �anticipate,� �estimate,� �intend,� �plan,��project,� and other similar expressions to identify some forward-looking statements, but not all forward-looking statements includethese words. All of our forward-looking statements involve estimates and uncertainties that could cause actual results to differmaterially from those expressed in the forward-looking statements. Accordingly, any such statements are qualified in their entirety byreference to the information described under the caption �Risk Factors� and elsewhere in this Form 10-K.
The forward-looking statements contained in this Form 10-K are based on assumptions that we have made in light of our industryexperience and our perceptions of historical trends, current conditions, expected future developments, and other factors we believe areappropriate under the circumstances. You should understand that these statements are not guarantees of performance or results. Theyinvolve risks, uncertainties (many of which are beyond our control), and assumptions. Although we believe that these forward-lookingstatements are based on reasonable assumptions, you should be aware that many important factors could affect our actual operatingand financial performance and cause our performance to differ materially from the performance anticipated in the forward-lookingstatements. We believe these important factors include, but are not limited to, those described under �Risk Factors� and�Management�s Discussion and Analysis of Financial Condition and Results of Operations� in this Form 10-K and our other filingswith the Securities and Exchange Commission (�SEC�). Should one or more of these risks or uncertainties materialize, or should anyof these assumptions prove incorrect, our actual operating and financial performance may vary in material respects from theperformance projected in these forward-looking statements. In addition, new important factors that could cause our business not todevelop as we expect may emerge from time to time.
Further, any forward-looking statement speaks only as of the date on which it is made, and except as required by law, we undertake noobligation to update any forward-looking statement contained in this Form 10-K to reflect events or circumstances after the date onwhich it is made or to reflect the occurrence of anticipated or unanticipated events or circumstances. The forward-looking statementscontained herein should not be relied upon as representing our views as of any date subsequent to the filing date of this Form 10-K.
BASIS OF PRESENTATION
Our fiscal year begins on July 1 and ends on June 30 with the interim quarterly reporting periods consisting of thirteen weeks.Therefore, the quarter end will not always coincide with the date of the end of the calendar month. We refer to our fiscal years basedon the calendar-year in which they end. Accordingly, references to fiscal 2020, fiscal 2019 and fiscal 2018 represent our financialresults for the fiscal years ended June 30, 2020, June 30, 2019 and June 30, 2018, respectively. For ease of reference, we identify ourfiscal years in this Form 10-K by reference to the period from July 1 to June 30 of the year in which the fiscal year ends. For example,�fiscal 2020� refers to our fiscal year ended June 30, 2020.
MasterCraft Boat Holdings, Inc. (the �Company�), a Delaware corporation, operates primarily through its wholly-owned subsidiaries,MasterCraft Boat Company, LLC, MasterCraft Services, LLC, MasterCraft Parts, Ltd., and MasterCraft International SalesAdministration, Inc (collectively �MasterCraft�); Nautic Star, LLC and NS Transport, LLC (collectively �NauticStar�); and CrestMarine, LLC (�Crest�). Unless the context otherwise requires, the Company and its subsidiaries collectively are referred to as the�Company�, �we�, or �us� in this Form 10-K.

2
PART I
ITEM 1. BUSINESS
We are a leading designer, manufacturer, and marketer of recreational powerboats sold under four brands � MasterCraft, NauticStar,Crest, and Aviara. We operate under three operating and reportable segments: MasterCraft, NauticStar, and Crest. The MasterCraftsegment includes both our MasterCraft and Aviara brands.
Our MasterCraft brand is a world-renowned innovator, designer, manufacturer, and marketer of premium performance sport boats,with a leading market position in the U.S., and a strong international presence consisting of dealers in 37 countries around the world.MasterCraft boats are used for water skiing, wakeboarding, wake surfing, as well as general recreational boating. We believe thatMasterCraft is the most recognized brand name in the performance sport boat category.
In October 2017 we acquired NauticStar, a leading manufacturer and distributor of high-quality outboard bay boats, deck boats andoffshore center console boats. NauticStar�s product portfolio provides diversification and expands our direct addressable market intothe outboard category, the largest powerboat industry category in terms of retail units, according to the National Marine ManufacturersAssociation (�NMMA�).
In October 2018 we acquired Crest, a leading manufacturer of pontoon boats, providing us with additional product diversification anddirect addressable market expansion. The pontoon category is also one of the fastest growing segments in the powerboat industry andparticipates in the outboard category.
In February 2019 we introduced a new brand, Aviara, specifically designed, engineered and manufactured to meet the exactingspecifications of consumers seeking the ultimate luxury recreational day boat experience. The brand�s first model, the AV32, beganselling during the first quarter of 2020 and the AV36 began selling during the second quarter of 2020. In February 2020, we launchedthe third Aviara model, the AV40, which we expect to begin selling in the first half of fiscal 2021. With three models ranging from 32� 40 feet in length, using both outboard and sterndrive propulsion, the Aviara brand continues our track record of productdiversification and addressable market expansion, both through acquisitions and utilization of our in-house product developmentcapabilities. Aviara is built in our MasterCraft facility and is part of the MasterCraft reportable segment. Through our four brands, weoperate in three of the fastest growing segments of the powerboat industry � performance sport boats, outboard saltwater fishing andpontoon boats� while entering the large, growing luxury day boat segment.
We are committed to delivering an extraordinary boating experience to our consumers. From pioneering innovations that improveenjoyment on the water to offering products that promote rapid development of skills, our mission is to help our consumers generatememories that will last a lifetime. We utilize a comprehensive product development process in order to build the most relevant andexciting products for our consumers, year after year. We believe that our commitment to quality is unsurpassed, and we engage inoperational excellence to deploy flexible and effective production systems that ensure we design and build the highest quality boats inthe market.
All of our boats, from hull to upholstery, are hand-crafted by our skilled workforce at our corporate headquarters near Knoxville,Tennessee, and our facilities in Amory, Mississippi and Owosso, Michigan. In recent years, we have made significant investments inimproving design, engineering, manufacturing, and operational processes as we strive to be the most efficient boat manufacturer in theindustry.
We believe our MasterCraft facility is the only boat manufacturing plant to achieve compliance with all three of the InternationalStandard for Organization (�ISO�) 9001 (Quality Management Systems), 14001 (Environmental Management Systems), and 18001(International Occupational Health and Safety Management System) standards. MasterCraft�s industry-leading operations result inworld-class quality, which enables us to offer a five-year factory warranty and results in MasterCraft boats typically maintaininghigher aftermarket resale value than our competitors� boats.
We sell our boats through an extensive network of independent dealers in North America and internationally. Our MasterCraft boatsare the exclusive performance sport boats offered by the majority of our dealers. Since the acquisitions of NauticStar and Crest, andthe introduction of our Aviara brand, we have expanded our dealer network over the past years. We devote significant time andresources to find, develop, and improve the performance of our dealers. We continuously cultivate and strengthen our dealerrelationships with marketing, training, and service programs designed to increase our dealers� sales and profitability. We believe thestrength of our dealer network and our proactive efforts to help our dealers improve their businesses give us a distinct competitiveadvantage in our industry.

3
Our History
MasterCraft was founded in 1968 when we built our first custom hull ski boat in a two-stall horse barn on a farm in Maryville,Tennessee. Dissatisfied with the large wakes and pull of other ski boats, we designed a hull that had the smallest wake in the industry:smooth and low at slalom and jump speeds yet well-defined at trick speeds. Our roots in performance water ski boats were reinforcedas we evolved over the next 50 years to produce leading performance-oriented boats in the wakeboarding and wake surfing categories.Today, we continue to produce the industry�s premier competitive water ski, wakeboarding, and wake surfing performance boats thatalso address our consumers� needs for versatility, flexibility, fun, and functionality.
NauticStar, which we acquired in October 2017, was founded in 2002 and is located in Amory, Mississippi. With many years of boatmanufacturing experience, and a 200,000 square-foot manufacturing facility, NauticStar has a reputation for reliability, quality andconsistency, with a loyal network of dealers and consumers including professional and sport fishermen, and recreational and pleasureboating enthusiasts.
Crest, which we acquired in October 2018, was founded in 1957 and is located on approximately 55 acres in Owosso, Michigan. Withnearly 150,000 square feet of manufacturing floor space, Crest is one of the top producers of innovative, high-quality pontoon boatsranging from 20 to 29 feet.
Aviara is a de novo brand, developed in-house, and focused on serving the luxury recreational day boat segment of the powerboatindustry. Introduced at the Miami Boat Show in February 2019, Aviara currently features three models utilizing both outboard andsterndrive propulsion. The brand�s first model, the AV32 began selling during the first quarter of 2020 and the AV36 began sellingduring the second quarter of 2020. In February 2020, we launched the third Aviara model, the AV40, which we expect to begin sellingin the first half of fiscal 2021. Aviara creates an elevated open water experience by fusing progressive style and effortless comfort inits modern luxury vessels.
Our Market Opportunity
During calendar 2019, retail sales of new powerboats in the U.S. totaled $11.0 billion. Of the powerboat categories tracked by theNMMA, our MasterCraft brand corresponds most directly to the inboard ski/wakeboard category, which we refer to as theperformance sport boat category. The category that most directly corresponds to our NauticStar and Crest brand is the outboardcategory. Aviara directly corresponds to the outboard and sterndrive categories. Given our product diversification driven byacquisitions and internal product development, we believe our addressable market also includes similar and adjacent powerboatcategories identified by the NMMA, including inboard cruiser boats and jet boats.
We believe we are well-positioned to benefit from several trends underway in our addressable market, including:
• performance sport boats are taking a greater share of the overall fiberglass powerboat category;
• outboard boats are taking a greater share of the overall powerboat category;
• premium bowriders between 30� � 40� in length, both outboard and sterndrive, are taking a greater share of the overallfiberglass powerboat category; and
• ease-of-use and performance innovations have accelerated product cycles driving consumer demand for new products.In addition, as a result of the COVID-19 Pandemic, consumers have been turning to boating as a safe recreational alternative thatallows for social distancing while enjoying the outdoors. However, our marketplace continues to evolve as a result of the COVID-19Pandemic and could change further in the future. Please see Item 1A, �Risk Factors � Risks Relating to Our Business � The COVID-19 Pandemic has had, and may continue to have, certain negative impacts on our business and those of our consumers, dealers andsuppliers, and such impacts may have a material adverse effect on our operations and business.�
According to the NMMA, new unit sales of performance sport boats in the U.S. increased at a compound annual growth rate(�CAGR�) of 9.7% from calendar 2015 to 2019 while new unit sales of all outboard boats grew at a CAGR of 4.3% in the U.S. overthe same period. Total new unit sales of powerboats in the U.S. (excluding personal watercraft and jet boats) increased at a CAGR of3.9% from 2015 to 2019. We believe the performance sport boat and outboard boat categories have grown at a faster rate than the restof the powerboat industry due to increased innovation in the features, designs, and layouts of performance sport boats and outboardpropulsion boats. These innovations have improved the performance, functionality, and versatility of these boats as compared withother recreational boats, particularly boats in the sterndrive category, which have not experienced the same degree of innovation. Webelieve inboard boats are superior to sterndrive boats for tow sports such as water skiing, wakeboarding, and wake surfing for severalreasons, including (i) the larger and more propulsive wakes that only inboard engine configurations can enable, (ii) enhanced ridersafety as a result of the location of the inboard propeller underneath the boat instead of protruding from the stern, as is generally thecase with boats in the sterndrive category, and (iii) relatively more passenger and storage space due to the location of the inboardengine housing. We believe outboard boats are superior to sterndrive boats for recreational boating uses such as fishing and familyboating for several reasons, including (i) relatively more passenger and storage space due to the location of the outboard enginehousing, (ii) engine noise is significantly reduced in an outboard engine compared to a sterndrive engine, (iii) outboard engines areeasier to access and maintain compared to a sterndrive engine, and (iv) outboard engines perform better and have greater durability insaltwater conditions.

4
The expanding popularity of boating has also contributed to the strong volumes. We believe we are well-positioned to benefit from theincreased popularity of recreational boating and the resulting larger prospective consumer base.
Our Strengths
Iconic MasterCraft Brand Synonymous with Quality, Innovation, and Performance. We believe the MasterCraft brand is well-knownamong boating enthusiasts for high performance, premier quality, and relentless innovation. We believe that the market recognizesMasterCraft as a premier brand in the powerboat industry due to the overall superior value proposition that our boats deliver to ourconsumers. The MasterCraft brand is built on a carefully crafted set of defining principles, including Legacy, Power, Precision andProgression. We work tirelessly every day to maintain our iconic brand reputation relative to our competition. The rigorous attentionto detail with which we design and manufacture our products results in high quality boats that command significant resale premiumsto comparable competitor boats.
Leading Market Share Position in Performance Sport Boat, Outboard, and Pontoon Categories. In recent history, we haveconsistently held a leading market share position in the U.S. among manufacturers of premium performance sport boats based on unitvolume. According to the Statistical Surveys, Inc. (�SSI�), our performance sport boat U.S. market share in December 2019 was21.6%. Per SSI, our U.S. market share for deck boats and saltwater fishing boats in the 15� � 35� segment, sold by our NauticStarbrand, was 4.5%. Per SSI, Crest�s pontoon boat market share was 3.6%. As of December 2019, based on SSI data, MasterCraft has the#1 market share, by brand, in the performance sport boat segment; NauticStar has the #6 market share, by brand, in the highly-fragmented deck and saltwater fishing segment; and Crest has the #8 market share, by brand, in the highly-fragmented pontoonsegment. We believe our sales will grow as dealers and consumers continue to recognize the superior quality, performance, styling,and value of our recently released boats and that we are just starting to realize the market share benefits of the many recent newproduct offerings and product enhancement initiatives that our management team has implemented during the past several years.
Industry-Leading Product Design and Innovation. We believe that our innovation in the design of new boat models and new featureshas been a key to our success, helping us maintain our market share, command higher price points, and generally broaden the appealof our products among recreational and fishing boaters. As a result of the features we have introduced, we believe that our boats areused for an increasingly wide range of activities. Our commitment to consistently developing new boat models and introducing newfeatures is reflected in several notable recent achievements, including NMMA Innovation Awards for our MasterCraft ProStar waterskiing boat, Gen 2 integrated surf system, X24 performance tow boat, and the DockStar Handling System. Our entire MasterCraftproduct portfolio has been renewed in the past five years, giving us the newest overall product offering in the performance sport boatcategory. Since acquiring NauticStar, we have introduced several new models, with future plans to introduce several new models overthe coming years. At Crest, we are designing and engineering new models that we believe will drive innovation in the pontoonsegment. Our Aviara brand, designed and engineered completely in-house, features several new innovations that we plan to introduceto the marketplace over the coming years.
Highly Efficient Product Development and Manufacturing. We believe that a key to our success has been our renewed focus onoperational improvements and world-class business processes. We believe our new product development capabilities are industry-leading and enable us to consistently create unique high-performance hull shapes and product features in shorter design iterations andat lower development costs than our competitors. These capabilities enable us to precisely design custom hulls and performancefeatures that enhance each boat�s unique performance characteristics and increase our speed to market with exciting newproducts. Our acquisition of NauticStar and Crest allows us to leverage this internal product development and manufacturingexpertise to capitalize on operational improvement opportunities at our Amory, Mississippi and Owosso, Michigan facilities. OurAviara brand, which is built in our existing MasterCraft facility, has benefited from the industry-leading quality, safety, andmanufacturing process we have in place there.
Strong Dealer Network. We have worked extensively with our dealers to develop what we believe is one of the strongest dealernetworks in the performance sport boat and outboard categories. We target our distribution to the market segments� highestperforming dealers. We have established operating processes focused on optimizing dealers� financial performance and service, andwith a track record of balancing wholesale inventory and retail sales we are better able to monitor dealer inventory, allowing for moretransparent sales estimates and strong dealer relationships. Transparent and thorough warranty programs encourage consumers tocontinue to visit our dealers for servicing, creating additional opportunities for boat trade-ins and purchases of accessories, therebyimproving our dealers� sales rates and financial health. These actions have strengthened our existing dealer network and are drivingincreased interest from new potential dealers who want to join the MasterCraft, NauticStar and Crest platforms. For our Aviara brand,we have partnered with MarineMax, the largest marine dealership in the U.S., to market our luxury recreational day boats. We believeintroducing a new brand with an established dealer base provides the Aviara brand with instant credibility and the greatest opportunityfor long-term success in the marketplace.

5
Differentiated Sales and Marketing Capabilities. We believe our marketing efforts support each of our brand promises by focusing onsuperior value proposition and differentiating the performance and features of our boats. Our marketing efforts are conducted using anarray of strategies, which include digital advertising, social media engagement, advertisements in endemic media and the sponsorshipof boating and water sport events. To highlight our MasterCraft performance credibility and generate additional brand excitement, wesponsor a number of nationally ranked athletes, and social influencers. We believe our superior sales and marketing capabilitieseffectively communicate our performance, styling, quality, authenticity, and lifestyle, resulting in increased overall consumerengagement.
Highly Experienced Executive Team. We have a highly seasoned and effective executive team. With extensive boating industryexperience, our management team has proven its ability to develop and integrate new product lines, enhance operations, strengthenour distribution network, and recruit industry talent. Senior management additions over the past few years have driven improvementsto our manufacturing, quality, and product development systems and processes, which have collectively accelerated performanceimprovements. Our Chief Executive Officer, Frederick Brightbill, has nearly 20 years of boating industry experience and has served asa member of our Board of Directors since 2009, including as Chairman since 2015. On December 3rd, 2019, Mr. Brightbill wasappointed as the permanent Chief Executive Officer. Mr. Brightbill previously served as President of the Aluminum Boat Group atBrunswick Corporation and in various leadership roles at Mercury Marine, including President of the Outboard Business Unit andIntegrated Operations Division. Tim Oxley, our Chief Financial Officer, has spent 30 years in the boating industry, including 14 yearswith the Company, following 16 years with Brunswick Corporation where he served as Chief Financial Officer of several operatingdivisions. In addition to Messrs. Brightbill and Oxley, the other members of our senior leadership team, collectively, have over 115years of experience in the boating industry.
Our Strategy
Continue to Develop New and Innovative Products. As a leading innovator, designer, manufacturer, and marketer, we strive to designnew and inventive products that appeal to a broad consumer base for all of our premium brands. Since fiscal 2013, we havesuccessfully launched a number of new products and features with best-in-class quality leading to increased sales and significantmargin expansion. Our process involves each department in collaborative full �team� product launches that enable us to releaseseveral new models per year, per brand, while maintaining superior quality and controlling costs. Product development and innovationare the life blood of successful boat manufacturers and we will continue to invest significant resources to ensure a pipeline of newproducts to meet the needs of our consumers.
Capture Additional Share from Adjacent Boating Categories. Our NauticStar, Crest, and Aviara brands provide us with direct accessto the outboard and sterndrive categories, with outboards representing the largest category of the powerboat industry with $7.7 billionof sales in 2019, per the NMMA, and provides diversification from our existing MasterCraft product portfolio. The additions ofNauticStar, Crest, and Aviara, combined with our culture of innovation, enhances our ability to introduce new products with increasedversatility, functionality, and performance to a more expansive consumer base that values boats for competitive and recreationalfishing, and general recreational boating purposes. Ultimately, the versatile boating experience delivered by our brands allows us toattract consumers from other boating categories, most notably from the sterndrive categories. We intend to further enhance theperformance, comfort, and versatility of our products to target additional consumers seeking high performance water sport, fishing andgeneral recreational activity.
Effectively Monitor Dealer Inventory and Further Strengthen Our Dealer Network. Our goal is to achieve and maintain a leadingmarket share in each of the markets in which we operate. We view our dealers as our partners and product champions. Therefore, wedevote significant time and resources to finding high quality dealers and developing and improving their performance over time. Weactively monitor field inventory levels, as demonstrated by healthy and consistent inventory retail turns and balanced wholesale andretail unit sales, which leads to better margins and improved financial health for our dealers. Additionally, our predictable new productdevelopment cycles across our portfolio ensure that our dealers have high quality, compelling, and relevant products to sell to theircustomers. We believe the quality and trust in our dealer relationships are more beneficial to our long-term success than the quantityof dealers. We continue to leverage that dealer base while proactively developing strategies that will strengthen our overall network.For example, we intend to strengthen our current footprint by selectively recruiting market-leading dealers. We believe our targetedinitiatives to enhance and grow our dealer network will increase unit sales in the future.
Continued Focus on Sales in International Markets. We currently have an extensive international dealer network with 66international locations in 37 countries around the world. We believe MasterCraft is the most well-known brand in the performancesport boat category globally, and that NauticStar, Crest, and Aviara have the potential for global growth. Based on our brandrecognition, innovative product offerings, and distribution strengths, we believe we are well positioned to leverage our reputation andcapture additional international sales. Continuing retaliatory tariffs in the European Union and unfavorable exchange rates in otherparts of the world are a current headwind. We believe that we will maintain our international sales by promoting our new products indeveloped markets where we have a well-established dealer base. Net sales outside of North America represented 4.8% of net sales infiscal 2020.

6
Our Products
We design, manufacture, and sell premium recreational performance sport boats, outboard, and sterndrive boats that we believedeliver superior performance for water skiing, wakeboarding, wake surfing, and fishing, as well as general recreational boating. Inaddition, we offer various accessories, including trailers and aftermarket parts. We market our boats under four brands: MasterCraft,NauticStar, Crest, and Aviara.
Our MasterCraft portfolio of ProStar, XStar, X, XT and NXT models are designed for the highest levels of performance, styling, andenjoyment for both recreational and competitive use. The XStar and X models are geared towards the consumer seeking the mostpremium and highest performance boating experience that we offer, and generally command a price premium over our competitors�boats at retail prices ranging from approximately $160,000 to $190,000. The MasterCraft XT models were introduced in July 2016with retail prices ranging from approximately $100,000 to $140,000. Unveiled in January 2014, the MasterCraft NXT modelsintroduced the quality, performance, styling, and innovation of the MasterCraft brand to the entry-level consumer, with retail pricesranging from approximately $ 75,000 to $95,000. We have strategically designed and priced the MasterCraft NXT models to target thefast-growing entry-level consumer group that is distinct from our traditional consumer base, while maintaining our core MasterCraftbrand attributes at profit margins comparable to our other offerings.
Our NauticStar portfolio of Bay Boats, Sport Deck Boats and Offshore Boats are designed for a variety of uses, including recreationaland competitive sport fishing in freshwater lakes or saltwater, and general recreational enjoyment. NauticStar�s Bay Boats andOffshore Boats are geared towards the consumer seeking unmatched quality and features for fishability and family friendly comfort.The Sport Deck Boat line caters to consumers seeking the drive and ride of a V-hull, large capacity, and the styling and efficiency of arunabout. NauticStar�s retail prices range from approximately $35,000 to $300,000. We believe all of the NauticStar models representa tremendous value for consumers.
Our Crest portfolio of pontoon boats are designed for the ultimate in comfort and recreational pleasure boating. Crest has continued togrow market share as it expands its distribution footprint. Crest�s pontoon boats are designed to offer consumers the best in luxury,style and performance without compromise across a diverse product portfolio. Crest�s retail prices range from approximately $30,000to $160,000.
Our Aviara portfolio of luxury recreational day boats was designed in-house with the vision to create pleasure crafts that defycompromise. The Aviara brand drew on MasterCraft�s 50-year legacy of quality and is built in our award-winning MasterCraftfacility. Aviara�s boat designs were inspired by our four product design principles � Progressive Style, Elevated Control, ModernComfort and Quality Details. Aviara�s models consist of the AV32, a 32-foot luxury bowrider, the AV36, a 36-foot luxury bowrider,and the AV40, the brand�s flagship 40-foot luxury bowrider for the ultimate on-the-water experience. All models are available ineither outboard or sterndrive propulsion, and Aviara�s retail prices range from approximately $345,000 to $670,000.
Our Dealer Network
We rely on an extensive network of independent dealers to sell our products in North America and internationally. For MasterCraft,NauticStar, Crest, and Aviara, we target our distribution to the market segment�s highest performing dealers. The majority of ourMasterCraft dealers are exclusive to our MasterCraft product lines within the performance sport boat category, highlighting thecommitment of our key dealers to the MasterCraft brand. We establish performance criteria that our dealers must meet as part of theirdealer agreements to ensure the continued quality of our dealer network. As members of our network, dealers may qualify forwholesale rebates, retail rebates and promotions, floor plan reimbursement or cash discounts, and other allowances.
We consistently review our distribution network to identify opportunities to expand our geographic footprint and improve ourcoverage of the market. We constantly monitor the health and strength of our dealers by analyzing each dealer�s retail sales andinventory and have established processes to identify underperforming dealers in order to assist them in improving their performance orto allow us to switch to a more effective dealer. These processes also allow us to better monitor dealer inventory levels and productturns and contribute to a healthier dealer network that is better able to stock and sell our products. We believe our outstanding dealernetwork and our proactive approach to dealer management allow us to distribute our products more efficiently than our competitorsand will help us capitalize on growth opportunities as our industry volumes continue to increase.
For fiscal 2020 the Company�s top ten dealers accounted for approximately 30% of our net sales and none of our dealers accounted formore than 5% of our total net sales.
North America. In North America, our MasterCraft brand, had a total of 132 dealers across 141 locations as of June 30, 2020. OurNauticStar brand had a total of 67 dealers across 82 locations in North America as of June 30, 2020. Our Crest brand had a total of 116dealers across 130 locations in North America as of June 30, 2020. We do not have a significant concentration of sales among ourMasterCraft, NauticStar or Crest dealers. Our Aviara brand is sold through a distribution network consisting of one dealer with 59locations.

7
Outside of North America. As of June 30, 2020, through our MasterCraft brand, we had a total of 41 international dealers and 41locations and through our NauticStar brand we had eight international dealers in 41 locations. We are present in Europe, Australia,Africa, Asia, including Hong Kong and the Middle East. We generated 4.8%, 5.2%, and 7.5% of our net sales outside of NorthAmerica in fiscal 2020, 2019, and 2018, respectively.
Dealer Relations
We have developed a system of financial incentives for our dealers based on achievement of key benchmarks. In addition, we provideour dealers with comprehensive sales training and a complete set of technology-based tools designed to help dealers maximizeperformance. Our dealer incentive program has been refined through years of experience with some of the key elements includingwholesale rebates, retail rebates and promotions, other allowances, and floor plan reimbursement or cash discounts to encouragebalanced production throughout the year.
Beyond our incentive programs, we have developed a proprietary web-based management tool that is used by our dealers on a day-to-day basis to improve their own businesses as well as enhance communication with our factory and sales management teams. Ourbusiness-to-business application efficiently executes many critical functions, including warranty registrations, warranty claims, boatordering and tracking, parts ordering, technical support, and inventory reporting. This system facilitates communication between oursales team and the dealer network and allows our manufacturing department to review consumer demand in real time.
Sales Cycles and Floor Plan Financing
We manage our annual sales plan through distinct buying periods. Our rebates are tiered so that dealers have a financial incentive totake the stocking risk for boats purchased prior to the traditional retail selling season (April - June). These incentives, accompanied byfloor plan subsidies for up to nine months from the date of invoice, drive �level loading� of production. During this first part of themodel year, many of the dealers� orders are standard configurations for their showrooms. In the second part of the model year, moreboats are customized by retail consumers. Many of these custom orders are placed during boat shows, which typically occur fromJanuary through early April across North America.
We offer our dealers the opportunity to purchase boats with cash or through floor plan financing programs with third-party floor planfinancing providers. The floor plan financing programs allow dealers to establish lines of credit with third-party lenders to purchaseinventory. Upon purchase of a boat, dealers draw on the floor plan facility and the lenders pay the invoice price of the boat directly tous typically within 5 business days. Consistent with industry practice, we offer various manufacturer-sponsored floor plan interestprograms under which we agree to reimburse our dealers for certain floor plan interest costs incurred for up to nine months from thedate of invoice. In some cases, cash discounts are offered as an alternative to floor plan subsidies. These programs encourage dealersto rapidly replenish inventories during the spring and summer retail season, maintain sufficient inventories during the non-peakseason, and balance wholesale purchases throughout the year.
Pursuant to the terms of the floor plan financing, if a dealer defaults on the terms of its credit line, we agree to repurchase newinventory repossessed from dealerships. Our obligation to repurchase such repossessed products for the unpaid balance of our originalinvoice price for the boat is subject to reduction or limitation based on the age and condition of the boat at the time of repurchase, andin certain cases, by an aggregate cap on repurchase obligations associated with a particular floor plan financing program. We incurredno material impact from repurchase events during fiscal 2020, 2019, or 2018.
Marketing and Sales
Marketing
We believe that our differentiated marketing capabilities and our multi-channel, content-driven marketing strategies align with ourstrategic focus on product innovation, performance, and quality to attract aspiring and enthusiast consumers to our brands andproducts. These sales and marketing efforts allow us to more effectively launch and support our products, help drive actionable salesleads for our dealers, and reinforce our MasterCraft, NauticStar, Crest, and Aviara brand and lifestyle attributes.
Our over 50-year history of manufacturing and design leadership has made MasterCraft one of the most well-known and iconic brandsin the boating industry. We believe the MasterCraft brand is widely recognized even among non-enthusiasts. Similarly, Crest�s nearly60-year history has led to the brand being strongly recognized within the boating industry. Our NauticStar brand is relatively youngcompared to MasterCraft but has quickly established itself as a strong brand dedicated to innovation, style and quality. We are focusedon enhancing the power of our brands through a multifaceted marketing strategy. Our addressable market is targeted through a varietyof specialized means, ranging from event sponsorships to far-reaching strategic alliances.

8
We have created a unified print and digital advertising strategy that is refreshed each year, featuring the unique attributes of each ofour products while maintaining focus on the MasterCraft, NauticStar, Crest, and Aviara brands. We maintain a meaningful presencefor our product lines in several endemic water sports and boating publications. Given the prevalence of our products in the marketsthese publications target, we also benefit from significant unpaid impressions in these industry publications, as our boats frequentlyappear in feature stories and advertisements for other products. In addition to these traditional marketing channels, in the last severalyears we have created an active and highly successful digital advertising and social media platform, including the use of Facebook,Twitter, Instagram, YouTube, and Vimeo, among others, to deliver content to our target audience, increase awareness of our brands,foster loyalty, and build a community of MasterCraft, NauticStar, Crest and Aviara enthusiasts. In addition, we benefit from numeroususer-generated videos and photos that are uploaded to these websites and social media platforms. An important component of thisstrategy has been our investment in our own mastercraft.com, nauticstarboats.com, crestpontoonboats.com, and aviaraboats.comwebsites. The sites are designed to allow significant interaction between us and our consumer base through marketing contentdelivery, message boards, news and event postings, and product updates and specifications. Our popular �Design-a-Boat�functionality allows consumers to design a customized boat and request a dealer quote. The custom design can be transmitted directlyto our closest independent dealer as well as our in-house concierge who follows up directly with our dealer leads for MasterCraft andAviara.
Our leading position in the performance sport boat category is further supported by our sponsorship of some of the most recognizableand successful athletes and influencers in water sports, as well as a number of highly visible competitions and events around theworld. Our activities in this area serve to deepen the penetration of our brands within the professional and enthusiast community,while also supporting the growth of watersports. The events which we sponsor and in which we and our dealers participate feature themost popular figures in wakeboarding and water skiing, drawing large audiences of enthusiasts to a variety of sites around the country.Furthermore, we sponsor top ranked professional wakeboarding athletes, water ski jumpers, and water skiers. In addition to theadvertising generated by the athletes� success in their sports, we also leverage our sponsorship of these athletes by having them attendboat shows and dealer events and appear in creative media events, in which they garner public relations interest, build our MasterCraftbrand, and in many cases help sell our products directly to consumers.
Sales
Our sales organization�s primary role is to monitor our network of existing dealers and work with them to increase sales of ourproducts, as well as identifying and recruiting new and replacement dealers that we believe will provide enhanced sales and customerservice for our end consumers. We employ proactive processes to monitor the health and performance of our dealers, and to help themimprove their businesses and their sales of our products. Our strategy is to improve the individual market shares of each of our dealersin their respective markets, and to add new dealers in new markets or replace dealers in existing markets where we believe we canachieve improved market share and customer service. We utilize regular performance reviews to drive improvement inunderperforming dealers and to determine how to transition to new dealers when necessary. In addition, we employ a number of toolsto assist our dealers in improving their performance, including product, sales, and service training, marketing materials and content,and direct interaction with prospective consumers such as our factory concierge service. We encourage and expect our salesrepresentatives to serve as advisors to our dealers, and believe this proactive sales approach leads to better dealer relationships andhigher sales of our products.
Manufacturing
All of our MasterCraft and Aviara boats are designed, manufactured, and lake-tested in our Vonore, Tennessee facility. All of ourNauticStar boats are manufactured in our Amory, Mississippi facility. All of our Crest boats are manufactured in our Owosso,Michigan facility. We believe MasterCraft has the only boat manufacturing facility to achieve compliance with all three of theISO 9001 (Quality Management Systems), 14001 (Environmental Management Systems), and 18001 (International OccupationalHealth and Safety Management System) standards.
The rigorous attention to detail in the design and manufacturing of our products results in boats of high quality which affords ourcustomers a great on water experience across all of our brands. Our dedication to quality allows us to offer some of the longest andmost inclusive warranty terms in the industry allowing our customers to enjoy our products with confidence.
Our boats are built through a continuous flow manufacturing process that encompasses fabrication, assembly, quality management,and testing. We manufacture certain components and subassemblies for our boats, such as upholstery, and procure other componentsfrom third-party vendors and install them on the boat. We have several exclusive supplier partnerships for critical purchasedcomponents, such as aluminum billet, towers, and engine packages. For MasterCraft, we also build custom trailers that match theexact size and color of our boats.

9
Research and Development, Product Development and Engineering
We are strategically and financially committed to innovation, as reflected in our dedicated product development and engineeringgroups and evidenced by our track record of new product introduction. At MasterCraft and Aviara, our product development andengineering group comprises 24 professionals. At NauticStar, our product development and engineering group comprises fiveprofessionals. At Crest, our product development and engineering group comprises five professionals. These individuals bring to ourproduct development efforts significant expertise across core disciplines, including boat design, computer-aided design, navalengineering, electrical engineering, and mechanical engineering. They are responsible for execution of all facets of our new productstrategy, starting with design and development of new boat models and innovative features, engineering these designs formanufacturing, and integrating new boats and innovations into production without disruption, at high quality, on time and on budget.Our product development and engineering functions work closely with our Strategic Portfolio Management Team which includessenior leadership from Sales, Marketing and Finance, all working together to develop our long-term product and innovation strategies.
We take a disciplined approach to the management of our product development strategy. We have structured processes to obtainvoices of the consumer, dealer, and management to guide our long-term product lifecycle and portfolio planning. In addition,extensive testing and coordination with our manufacturing group are important elements of our product development process, whichwe believe enable us to leverage the lessons from past launches and minimize the risk associated with the release of new products. Wehave developed a strategy to launch several new models a year, which will allow us to renew our product portfolio with innovativeofferings at a rate that we believe will be difficult for our competitors to match without significant additional capital investments. Inaddition to our new product strategy, we manage a separate innovation development process which allows us to design innovative newfeatures for our boats in a disciplined manner and to launch these innovations in a more rapid time frame and with higher quality.These enhanced processes have reduced the time to market for our new product pipeline. Our research and product developmentexpense for fiscal 2020, 2019 and 2018 was $5.2 million, $5.6 million, and $4.9 million, respectively.
Intellectual Property
We rely on a combination of patent, trademark, and copyright protection, trade secret laws, confidentiality procedures, and contractualprovisions to protect our rights in our brands, products, and proprietary technology. We also protect our vessel hull designs throughvessel hull design registrations. This is an important part of our business and we intend to continue protecting our intellectual property.We currently hold 34 U.S. patents and six foreign patents, including utility and design patents for our transom surf seating, ourDockStar handling system, and our Gen 2 surf system technology. Provided that we comply with all statutory maintenancerequirements, our patents are expected to expire between 2021 and 2037. We also have 14 pending U.S. patent applications and tenpending foreign patent applications. We also own in excess of 100 trademark registrations in various countries around the world, mostnotably for the MasterCraft, NauticStar, Crest, and Aviara names and/or logos, as well as numerous model names in MasterCraft�sStar Series, X, XT, and NXT product families, and we have several pending applications for additional registrations. Such trademarksmay endure in perpetuity on a country-by-country basis provided that we comply with all statutory maintenance requirements,including continued use of each trademark in each such country. In addition, we own 38 registered U.S. copyrights. Finally, we haveregistered more than 40 vessel hull designs with the U.S. Copyright Office, the most recent of which will remain in force through2027.
From time to time, we are involved in intellectual property litigation, either accusing third parties of infringing our intellectualproperty rights, or defending against third-party claims that we are infringing the intellectual property of others. We are not currentlyinvolved in any outstanding intellectual property litigation that we believe, individually or in the aggregate, will have a materialadverse effect on our business, financial condition, results of operations, or cash flows. However, we cannot predict the outcome ofany pending or future litigation, and an unfavorable outcome could have an adverse impact on our business, financial condition,results of operations, or cash flows.
Suppliers
We purchase a wide variety of raw materials from our supplier base, including resins, fiberglass, aluminum and steel, as well asproduct parts and components such as engines and electronic controls. We maintain long-term contracts with preferred suppliers andinformal arrangements with other suppliers.
We are focused on working with our supply chain partners to enable cost improvement, world-class quality, and continuous productinnovation. We have engaged our key suppliers in collaborative preferred supplier relationships and have developed processesincluding annual cost reduction targets, regular reliability projects, and extensive product testing requirements to ensure that oursuppliers produce at lowest total cost and to the highest levels of quality expected of our brands. These collaborative efforts begin atthe design stage, with our key suppliers integrated into design and development planning well in advance of launch, which allows usto control costs and to leverage the expertise of our suppliers in developing product innovations. We believe these collaborativerelationships with our most important suppliers have contributed to our significant improvements in product quality, innovation, andprofitability.

10
The most significant components used in manufacturing our boats, based on cost, are engine packages. For our MasterCraft brand,Ilmor Engineering, Inc. (�Ilmor�) is MasterCraft�s exclusive engine supplier, and for our NauticStar brand, Yamaha MotorCorporation (�Yamaha�) is our largest engine supplier, while Mercury Marine (�Mercury�) is Crest�s largest engine supplier. Forour Aviara brand, Mercury also provides outboard engines and Ilmor provides sterndrive engines. We maintain strong and long-standing relationships with Ilmor, Yamaha, and Mercury. During the year ended June 30, 2020, Ilmor was our largest overall supplier.In addition to performance sport boat and sterndrive engines, Ilmor�s affiliates produce engines used in a number of leading racingboats and race cars. Ilmor maintains a full-time customer service and warranty representative at our MasterCraft office, resulting inextremely efficient management of all engine-related matters, mitigating potential warranty risk. We work closely with Ilmor toremain at the forefront of engine design, performance, and manufacturing. Engine packages are the most expensive single componentin the MasterCraft, Aviara, NauticStar and Crest boat-building process and we believe our long-term relationship with our enginesupplier partners is a key competitive advantage.
Transportation
We utilize third party logistics and transportation services along with a fleet of leased tractor trailers at NauticStar, to deliver our boatsto our dealer network. A select few dealers near our manufacturing facilities have elected to manage transportation and arrange forboats to be picked up directly from our manufacturing facilities. International shipments are transferred to a third-party logisticsprovider who schedules them for shipment via ocean freight to their destination country.
Information Technology
We continue to make investments in information systems and technology. Our information systems and technology strategy supportautomation and integration of our business processes and strategic planning initiatives, including not only our internal informationmanagement and communications processes but also our marketing and dealer management efforts. Our Information Systems andTechnology team is integral to our marketing and sales front office initiatives, helping us to develop stronger engagement between us,our dealers and our end consumers. We will continue to invest in our information systems and our IT infrastructure in order toleverage current and future technologies to support our product development, operations, and marketing strategies.
Insurance and Product Warranties
We purchase insurance to cover standard risks in our industry, including policies that cover general product liability, workers�compensation, auto liability, and other casualty and property risks. Our insurance rates are based on our safety record as well as trendsin the insurance industry. We also maintain workers� compensation insurance and auto insurance policies that are retrospective in thatthe cost per year will vary depending on the frequency and severity of claims in the policy year.
We face an inherent risk of exposure to product liability claims in the event that, among other things, the use of our products results ininjury. With respect to product liability coverage, we carry customary insurance coverage. Our coverage involves self-insuredretentions with primary and excess liability coverage above the retention amount. We have the ability to refer claims to our suppliersand their insurers to pay the costs associated with any claims arising from such suppliers� products. Our insurance covers claims thatare not adequately covered by a supplier�s insurance and provides for excess secondary coverage above the limits provided by oursuppliers.
We provide product warranties for all of our boat models. During the warranty period, we reimburse dealers and authorized servicefacilities for all or a portion of the cost of repair or replacement performed on the products. Some materials, components or parts ofthe boat that are not covered by our product warranties are separately warranted by their manufacturers or suppliers. These otherwarranties include warranties covering engines, among other components.
Competition
The powerboat industry, including the performance sport boat, outboard, and sterndrive categories, are highly fragmented, resulting inintense competition for consumers and dealers. Competition affects our ability to succeed in both the market segments we currentlyserve and new market segments that we may enter in the future. We compete with several large manufacturers that may have greaterfinancial, marketing, and other resources than we do. We also compete with a wide variety of small privately held independentmanufacturers. Competition in our industry is based primarily on brand name, price, innovative features, design, and productperformance. Please see Item 1A, �Risk Factors� � Risks Related to Our Business� Our industry is characterized by intensecompetition, which affects our sales and profits.

11
Seasonality
Our operating results are subject to annual and seasonal fluctuations resulting from a variety of factors, including:
• seasonal variations in retail demand for boats, with a significant majority of sales occurring during peak boating season,which we attempt to manage by providing incentive programs and floor plan subsidies to encourage dealer purchasesthroughout the year, which may include offering off-season retail promotions to our dealers in seasonally slow months,during and ahead of boat shows, to encourage retail demand;
• product mix, which is driven by boat model mix and higher option order rates; while sales of all our boats generatecomparable margins, sales of larger boats and boats with optional content generally produce higher absolute profits;
• inclement weather, which can affect production at our manufacturing facilities as well as consumer demand;
• competition from other recreational boat manufacturers; and
• general economic conditions.
Environmental, Safety, and Regulatory Matters
Our operations are subject to extensive and frequently changing federal, state, local, and foreign laws and regulations, including thoseconcerning product safety, environmental protection, and occupational health and safety. We believe that our operations and productsare in compliance with these regulatory requirements. Historically, the cost of achieving and maintaining compliance with applicablelaws and regulations has not been material. However, we cannot provide assurance that future costs and expenses required for us tocomply with such laws and regulations, including any new or modified regulatory requirements, or to address newly discoveredenvironmental conditions, will not have a material adverse effect on our business, financial condition, operating results, or cash flows.
We have not been notified of and are otherwise currently not aware of any contamination at our current or former facilities for whichwe could be liable under environmental laws or regulations and we currently are not undertaking any remediation or investigationactivities in connection with any contamination. However, future spills or accidents or the discovery of currently unknown conditionsor non-compliances may give rise to investigation and remediation obligations or related liabilities and damage claims, which mayhave a material adverse effect on our business, financial condition, operating results, or cash flows.
The regulatory programs that impact our business include the following:
Hazardous Substance and Waste Regulations
Certain materials used in our manufacturing, including the resins used in production of our boats, are toxic, flammable, corrosive, orreactive and are classified by the federal and state governments as �hazardous materials.� Control of these substances is regulated bythe Environmental Protection Agency (EPA) and state pollution control agencies under the Federal Resource Conservation andRecovery Act, and related state programs. Storage of these materials must be maintained in appropriately labeled and monitoredcontainers, and disposal of wastes requires completion of detailed waste manifests and recordkeeping requirements. Any failure by usto properly store or dispose of our hazardous materials could result in liability, including fines, penalties, or obligations to investigateand remediate any contamination originating from our operations.
OSHA
The Occupational Safety and Health Administration (OSHA) Act imposes standards of conduct for and regulates workplace safety,including limits on the amount of emissions to which an employee may be exposed without the need for respiratory protection orupgraded plant ventilation. Our facilities are regularly inspected by OSHA and by state and local inspection agencies and departments.We believe that our facilities comply in all material aspects with these regulations. We have made a considerable investment in safetyawareness programs and provide ongoing safety training for all of our employees. We have implemented a program that requiresfrequent safety inspections of our facilities by managers and an internal safety committee. The safety committee, which is led by adedicated health and safety professional, prepares a monthly action plan based on its findings.
Clean Air Act
The Clean Air Act (the �CAA�) and corresponding state rules regulate emissions of air pollutants. Because our manufacturingoperations involve molding and coating of fiberglass materials, which involves the emission of certain volatile organic compounds,hazardous air pollutants, and particulate matter, we are required to maintain and comply with a CAA operating permit (or �Title V�permit). Our Title V Permit requires us to monitor our emissions and periodically certify that our emissions are within specified limits.To date, we have not had material difficulty complying with those limits.

12
In addition to the regulation of our manufacturing operations, the EPA has adopted regulations stipulating that many marinepropulsion engines meet an air emission standard that requires fitting a catalytic converter to the engine. The engines used in ourproducts, all of which are manufactured by third parties, are warranted by the manufacturers to be in compliance with the EPA�semission standards. The additional cost of complying with these regulations has increased our cost to purchase the engines and,accordingly, has increased the cost to manufacture our products.
If we are not able to pass these additional costs along to our consumers, it may have a negative impact on our business and financialcondition.
Boat Safety Standards
Powerboats sold in the U.S. must be manufactured to meet the standards of certification required by the U.S. Coast Guard. In addition,boats manufactured for sale in the European Union must be certified to meet the European Union�s imported manufactured productsstandards. These certifications specify standards for the design and construction of powerboats. We believe that all our boats meetthese standards. In addition, safety of recreational boats is subject to federal regulation under the Boat Safety Act of 1971, whichrequires boat manufacturers to recall products for replacement of parts or components that have demonstrated defects affecting safety.In the past, we have instituted recalls for defective component parts produced by us or certain of our third-party suppliers. None ofthese recalls has had a material adverse effect on the Company.
Employees
We believe we maintain excellent relations with our employees, treating them as business partners and focusing on building theircareers. We have approximately 884 employees as of June 30, 2020, 480 of whom work at our MasterCraft/Aviara facility inTennessee, 218 of whom work at our NauticStar facility in Mississippi, and 186 of whom work at our Crest facility in Michigan. Noneof our employees are represented by a labor union, and since MasterCraft�s founding in 1968, we have never experienced a labor-related work stoppage.
Other Information
We were incorporated under the laws of the State of Delaware under the name MCBC Holdings, Inc. on January 28, 2000. In July2015, we completed an initial public offering of our common stock. Effective November 7, 2018, the name of the Company waschanged from MCBC Holdings, Inc. to MasterCraft Boat Holdings, Inc. We maintain a website with the addresswww.mastercraft.com. We are not including the information contained in our website as part of, or incorporating it by reference into,this Annual Report on Form 10-K. We make available, free of charge through our website, our annual reports on Form 10-K, quarterlyreports on Form 10-Q, current reports on Form 8-K, and amendments to these reports as soon as reasonably practicable after weelectronically file these materials with, or otherwise furnish them to, the SEC.
ITEM 1A. RISK FACTORS.
RISK FACTORS
Investing in our common stock involves a high degree of risk. You should carefully consider the following risk factors, as well as otherinformation in this Form 10-K, before deciding whether to invest in shares of our common stock. The occurrence of any of the eventsdescribed below could harm our business, financial condition, results of operations, and growth prospects. In such an event, thetrading price of our common stock may decline, and you may lose all or part of your investment.
Risks Relating to Our Business
The COVID-19 Pandemic has had, and may continue to have, certain negative impacts on our business and those of ourconsumers, dealers and suppliers, and such impacts may have a material adverse effect on our operations and business.
The COVID-19 Pandemic has significantly impacted worldwide economic conditions and could have a material adverse effect on ouroperations and business and those of our consumers, dealers and suppliers. In response to the COVID-19 Pandemic, governmentalauthorities, including in many of the jurisdictions in which we operate, have taken measures to limit the spread of the outbreak,including mandatory business closures, travel restrictions, quarantines, declarations of states of emergency, �stay-at-home� or�shelter-in-place� orders and social distancing protocols, in addition to seeking voluntary facility closures and other restrictions. Theseactions and the potential resurgence or enhancement of these actions could materially adversely affect our ability, and our consumers�,dealers� and suppliers� ability, to adequately staff, manage and maintain their respective businesses. Furthermore, our future results ofoperations, cash-flows and liquidity could be adversely impacted by the COVID-19 Pandemic due to delays in payments ofoutstanding receivable amounts beyond normal payment terms, supply chain disruptions, uncertain demand and additional goodwilland other intangible asset impairment charges.

13
To balance wholesale production with the then anticipated impacts to retail demand caused by the economic impacts of the COVID-19Pandemic, we reduced production in February 2020 and, in late March 2020, temporarily suspended manufacturing operations at all ofour facilities to protect the health of our employees and comply with governmental mandated shutdowns. As a result of these actions,we temporarily laid off nearly all our hourly workforce. We paid lump sum severance payments to certain of our laid off employeesand provided for the temporary continuation of their healthcare benefits, resulting in charges totaling approximately $1.4 millionduring the fiscal third and fourth quarters (the �COVID-19 Shutdown Costs�). We resumed operations at reduced production levels atour manufacturing facilities by mid-May 2020 and we are continuing to ramp up production. Our facilities resumed operations withnew temperature screening, social distancing, personal protective equipment, and cleaning protocols to protect our employees andmitigate risk of further business interruption.
The COVID-19 Pandemic has impacted our supply chain, particularly as a result of mandatory shutdowns in locations where productsare manufactured. It is also possible that we could experience future disruptions to our supply chain that are significant as well assignificant deterioration in macroeconomic factors that typically affect us, such as consumer spending and demand for our products. Inaddition, we have experienced and are likely to continue to experience disruptions in manufacturing and logistics due to the COVID-19 Pandemic, and we may experience disruptions in manufacturing or logistics in the future due to inconsistent and unanticipatedorder patterns, our inability to develop long-term relationships with key suppliers, other diseases or pandemics or unforeseen naturaldisasters or public health emergencies. Further, if there are future closures we may face obstacles and delays in re-opening ourmanufacturing facilities as we may have to hire and train a substantial number of new employees as some of the employees that wehave temporarily laid off may seek or have found other employment.
The disruptions caused by the COVID-19 Pandemic, including the temporary manufacturing suspension and supplier and workforceconstraints, resulted in a decline in wholesale unit sales volume of nearly 50% during the February 2020 to June 2020 period ascompared to the same prior-year period.
In addition, the COVID-19 Pandemic has caused a significant economic slowdown, which could cause a global recession, which weexpect would negatively impact the sale of our boats. If general economic conditions deteriorate further we cannot predict the durationor strength of an economic recovery, either in the United States or in the specific markets where we sell our products. Further,consumers often finance purchases of our boats from dealers and accordingly, consumer credit market conditions also influencedemand for our boats from dealers. If credit conditions worsen and adversely affect the ability of consumers to finance potentialpurchases at acceptable terms and interest rates, it could result in a decrease in the sales of our products.
On March 19, 2020, we drew $35.0 million on our revolving credit agreement as a precautionary measure in order to increase our cashposition and preserve financial flexibility in light of uncertainty in the global markets resulting from the COVID-19 Pandemic.Additionally, on May 7, 2020, we entered into Amendment No. 3 (the �Amendment�) to the Fourth Amended & Restated Credit andGuarantee Agreement (the �Credit Facility�) to strengthen our financial flexibility. Among other things, the changes effected by theAmendment provide temporary relief under our financial covenants. See Note 8 in Notes to Consolidated Financial Statements formore information regarding these changes. While the performance of the business and our cash management activities provided theflexibility to repay $25.0 million of the Credit Facility as of June 30, 2020, as a result of the COVID-19 Pandemic, we may berequired to raise additional capital and any such additional debt financing that may be needed, beyond the $25.0 million of borrowingavailability on the Credit Facility, may not be available on commercially reasonable terms, if at all.
The severity of the impact of the COVID-19 Pandemic on our business will depend on a number of factors, including, but not limitedto, the duration, spread, severity and impact of the pandemic, the remedial actions and stimulus measures adopted by local and federalgovernments, the effects of the pandemic on our consumers and suppliers, and to the extent normal economic and operating conditionscan resume, all of which are uncertain and cannot be predicted. The inherent uncertainty surrounding COVID-19, due in part torapidly changing governmental directives, public health challenges and progress, and market reactions thereto, also makes it morechallenging for our management to estimate the potential impact and the future performance of our business. Accordingly, theanticipated negative financial impact to our operating results cannot be reasonably estimated at this time, but could be material andlast for an extended period of time.
General economic conditions, particularly in the U.S., affect our industry, demand for our products and our business, and resultsof operations.
Demand for premium sport boats, outboard boats, and sterndrive boats can be, and in the past has been, significantly influenced byweak economic conditions, low consumer confidence, high unemployment, and increased market volatility worldwide, especially inthe U.S. In times of economic uncertainty and contraction, consumers tend to have less discretionary income and tend to defer oravoid expenditures for discretionary items, such as our products. Sales of our products are highly sensitive to personal discretionaryspending levels. Our business is cyclical in nature and its success is impacted by economic conditions, the overall level of consumerconfidence and discretionary income levels. Any substantial deterioration in general economic conditions (including as a result of theCOVID-19 Pandemic) that diminishes consumer confidence or discretionary income may reduce our sales and materially adverselyaffect our business, financial condition and results of operations. Corporate restructurings, layoffs, declines in the value of investmentsand residential real estate, higher fuel and energy prices, higher interest rates, and increases in federal and state taxation may also eachmaterially adversely affect our business, financial condition, and results of operations.

14
Consumers often finance purchases of our products, and as a result, consumer credit market conditions influence demand for ourboats. If credit conditions worsen (including as a result of the COVID-19 Pandemic), and adversely affect the ability of consumers tofinance potential purchases at acceptable terms and interest rates, it could result in a decrease in the sales of our products.
Our annual and quarterly financial results are subject to significant fluctuations depending on various factors, many of which arebeyond our control.
Our sales and operating results can vary significantly from quarter to quarter and year to year depending on various factors, many ofwhich are beyond our control. These factors include, but are not limited to:
• seasonal consumer demand for our products;
• discretionary spending habits;
• changes in pricing in, or the availability of supply in, the used powerboat market;
• failure to maintain a premium brand image;
• disruption in the operation of our manufacturing facilities, including those as a result of the COVID-19 Pandemic;
• variations in the timing and volume of our sales;
• the timing of our expenditures in anticipation of future sales;
• sales promotions by us and our competitors;
• changes in competitive and economic conditions generally;
• consumer preferences and competition for consumers� leisure time, including those as a result of the COVID-19 Pandemic;
• impact of unfavorable weather conditions;
• changes in trade policy or the imposition of additional tariffs;
• civil insurrection or social unrest (such as the recent protests and social movements across several North American cities);
• changes in the cost or availability of our labor; and
• increased fuel prices.
Due to these and other factors, our results of operations may decline quickly and significantly in response to changes in order patternsor rapid decreases in demand for our products. We anticipate that fluctuations in operating results will continue in the future.
Unfavorable weather conditions may have a material adverse effect on our business, financial condition, and results of operations,especially during the peak boating season.
Adverse weather conditions in any year in any particular geographic region may adversely affect sales in that region, especially duringthe peak boating season. Sales of our products are generally stronger just before and during spring and summer, which represent thepeak boating months in most of our markets, and favorable weather during these months generally has a positive effect on consumerdemand. Conversely, unseasonably cool weather, excessive rainfall, reduced rainfall levels, or drought conditions during these periodsmay close area boating locations or render boating dangerous or inconvenient, thereby generally reducing consumer demand for ourproducts. Our annual results would be materially and adversely affected if our net sales were to fall below expected seasonal levelsduring these periods. We may also experience more pronounced seasonal fluctuation in net sales in the future as we continue toexpand our businesses. Additionally, to the extent that unfavorable weather conditions are exacerbated by global climate change orotherwise, our sales may be affected to a greater degree than we have previously experienced. There can be no assurance that weatherconditions will not have a material effect on the sales of any of our products.
Our results after acquisitions may suffer if we do not effectively manage our expanded operations following our recentacquisitions.
The size of our business has increased significantly as a result of our acquisitions. Our future success depends, in part, on our ability tomanage this expanded business, which will pose substantial challenges for management, including challenges related to themanagement and monitoring of additional operations and associated increased costs and complexity. There can be no assurances wewill be successful or that we will realize the expected benefits currently anticipated from these or any other acquisitions.
The acquisitions may underperform relative to our expectations.
We may not be able to maintain the levels of revenue, earnings or operating efficiency as a combined business that MasterCraft,NauticStar, and Crest have previously achieved or might achieve separately. The business and financial performance of the

15
acquisitions are subject to certain risks and uncertainties, including the risk of the loss of, or changes to, its relationships with itsdealers and suppliers, increased product liability and warranty claims, and negative publicity or other events that could diminish thevalue of the NauticStar or Crest brand, which in turn could also adversely affect the MasterCraft brand. If we are unable to achieve thesame growth, revenues and profitability that our acquisitions have achieved in the past, our business, financial condition, results ofoperations, or cash flows could be adversely affected.
In relation to such acquisitions, we recognized significantly higher amounts of intangible assets, including goodwill. These intangibleassets are subject to impairment testing and an impairment of our intangible assets was triggered as of March 29, 2020, due to theeconomic outlook at that time, the significant declines in our share price, market volatility and the disruption in our operations, as aresult of the COVID-19 Pandemic. As a result of the analysis, we recorded impairment charges totaling $56.4 million related to theNauticStar and Crest segments (the �Impairment Charges�). The Impairment Charges were principally a result of a decline, in thefiscal third quarter, in market conditions, including our share price, and the outlook for retail and wholesale sales and operatingperformance, as of March 29, 2020, relative to our acquisition plans and annual impairment test performed as of June 30, 2019. SeeNote 6 in Notes to Consolidated Financial Statements for more information regarding the Impairment Charges. This impairmentcharge, along with the impairment charge recognized in fiscal 2019 related to NauticStar, resulted in the elimination of all goodwillassociated with the NauticStar and Crest acquisitions. However as of June 30, 2020, there was $47.5 million of intangible assets otherthan goodwill remaining on our consolidated balance sheet. We could continue to incur a significant impact to our financial statementsin the form of impairment charges related to these remaining intangible assets if assumptions and expectations related to ouracquisitions are not realized.
We depend on our network of independent dealers and face increasing competition for dealers.
Substantially all of our sales are derived from our network of independent dealers. Our agreements with dealers in our networkstypically provide for one-year terms, although some agreements have longer terms. The loss of one or more of these dealers couldhave a material adverse effect on our financial condition and results of operations. The number of dealers supporting our products andthe quality of their marketing and servicing efforts are essential to our ability to generate sales. Competition for dealers amongperformance sport boat manufacturers continues to increase based on the quality, price, value, and availability of the manufacturers�products, the manufacturers� attention to customer service, and the marketing support that the manufacturer provides to the dealers.We face intense competition from other premium performance sport, outboard, and sterndrive boat manufacturers in attracting andretaining dealers (some of whom also sell products from other premium performance sport, outboard, and sterndrive boatmanufacturers), affecting our ability to attract or retain relationships with qualified and successful dealers. Although our managementbelieves that the quality of our products in the premium performance sport, outboard boat, sterndrive boat industries should permit usto maintain our relationships with our dealers and our market share position, there can be no assurance that we will be able to maintainor improve our relationships with our dealers or our market share position. In addition, independent dealers in the powerboat industryhave experienced significant consolidation in recent years, which could result in the loss of one or more of our dealers in the future ifthe surviving entity in any such consolidation purchases similar products from a competitor. A substantial deterioration in the numberof dealers or quality of our network of dealers would have a material adverse effect on our business, financial condition, results ofoperations, and cash flows.
Our success depends, in part, on the financial health of our dealers and their continued access to financing.
Because we sell nearly all of our products through dealers, their financial health is critical to our success. Our business, financialcondition, and results of operations may be adversely affected if the financial health of the dealers that sell our products suffers. Theirfinancial health may suffer for a variety of reasons, including a downturn in general economic conditions, rising interest rates, higherrents, increased labor costs and taxes, compliance with regulations, and personal financial issues (all of which may be negativelyimpacted by the COVID-19 Pandemic).
In addition, our dealers require adequate liquidity to finance their operations, including purchases of our products. Dealers are subjectto numerous risks and uncertainties that could unfavorably affect their liquidity positions, including, among other things, continuedaccess to adequate financing sources on a timely basis on reasonable terms. These sources of financing are vital to our ability to sellproducts through our distribution network. Access to floor plan financing generally facilitates our dealers� ability to purchase boatsfrom us, and their financed purchases reduce our working capital requirements. If floor plan financing were not available to ourdealers or if the cost of the financing increases, our sales and our working capital levels would be adversely affected. The availabilityand terms of financing offered by our dealers� floor plan financing providers will continue to be influenced by:
• their ability to access certain capital markets and to fund their operations in a cost-effective manner;
• changes in interest rates;
• the performance of their overall credit portfolios;
• their willingness to accept the risks associated with lending to dealers; and
• the overall creditworthiness of those dealers.

16
We may be required to repurchase inventory of certain dealers.
Many of our dealers have floor plan financing arrangements with third-party finance companies that enable the dealers to purchase ourproducts. In connection with these agreements, we may have an obligation to repurchase our products from a finance company undercertain circumstances, and we may not have any control over the timing or amount of any repurchase obligation nor have access tocapital on terms acceptable to us to satisfy any repurchase obligation. This obligation is triggered if a dealer defaults on its debtobligations to a finance company, the finance company repossesses the boat and the boat is returned to us. Our obligation torepurchase a repossessed boat for the unpaid balance of our original invoice price for the boat is subject to reduction or limitationbased on the age and condition of the boat at the time of repurchase, and in certain cases, by an aggregate cap on repurchaseobligations associated with a particular floor plan financing program. In addition, applicable laws regulating dealer relations may alsorequire us to repurchase our products from our dealers under certain circumstances, and we may not have any control over the timingor amount of any repurchase obligation nor have access to capital on terms acceptable to us to satisfy any repurchase obligation. If wewere obligated to repurchase a significant number of units under any repurchase agreement or under applicable dealer laws, ourbusiness, operating results, financial condition and cash flows could be adversely affected.
If we fail to manage our manufacturing levels while still addressing the seasonal retail pattern for our products, our business andmargins may suffer.
The seasonality of retail demand for our products, together with our goal of balancing production throughout the year, requires us tomanage our manufacturing and allocate our products to our dealer network to address anticipated retail demand. Our dealers mustmanage seasonal changes in consumer demand and inventory. If our dealers reduce their inventories in response to weakness in retaildemand, we could be required to reduce our production, resulting in lower rates of absorption of fixed costs in our manufacturing and,therefore, lower margins. As a result, we must balance the economies of level production with the seasonal retail sales patternexperienced by our dealers. In addition, as we navigate the unprecedented confluence of demand and disruption precipitated by theCOVID-19 Pandemic, our production during this ramp up period will depend, in large part, on our suppliers� capacity and our abilityto grow and maintain a high-performing workforce. Failure to adjust manufacturing levels adequately may have a material adverseeffect on our financial condition, results of operations, and cash flows.
Our sales and profitability depend, in part, on the successful introduction of new products.
Market acceptance of our products depends on our technological innovation and our ability to implement technology in our boats. Oursales and profitability may be adversely affected by difficulties or delays in product development, such as an inability to developviable or innovative new products. In February 2019 we introduced a new brand, Aviara, with sales beginning in the first quarter of2020. Our failure to introduce new technologies and product offerings that consumers desire, including our new Aviara models, couldadversely affect our business, financial condition, results of operations, and cash flows. Also, our ability to achieve higher margins, inpart, relies on the introduction of new features or enhancements to our existing boat models. If we fail to introduce new features orthose we introduce fail to gain market acceptance, our margins may suffer.
In addition, some of our direct competitors and indirect competitors may have significantly more resources to develop and patent newtechnologies. It is possible that our competitors will develop and patent equivalent or superior technologies and other products thatcompete with ours. They may assert these patents against us and we may be required to license these patents on unfavorable terms orcease using the technology covered by these patents, either of which would harm our competitive position and may materiallyadversely affect our business.
We also cannot be certain that our products or features have not infringed or will not infringe the proprietary rights of others. Anysuch infringement could cause third parties, including our competitors, to bring claims against us, resulting in significant costs andpotential damages.
We have a fixed cost base that will affect our profitability if our sales decrease.
The fixed cost levels of operating a powerboat manufacturer can put pressure on profit margins when sales and production decline.Our profitability depends, in part, on our ability to spread fixed costs over a sufficiently large number of products sold and shipped,and if we make a decision to reduce our rate of production, gross or net margins could be negatively affected. Consequently, decreaseddemand or the need to reduce production can lower our ability to absorb fixed costs and materially impact our financial condition orresults of operations.

17
Our industry is characterized by intense competition, which affects our sales and profits.
The premium performance sport boat, outboard, and sterndrive boat categories and the powerboat industry as a whole are highlycompetitive for consumers and dealers. We also compete against consumer demand for used boats. Competition affects our ability tosucceed in both the markets we currently serve and new markets that we may enter in the future. Competition is based primarily onbrand name, price, product selection, and product performance. We compete with several large manufacturers that may have greaterfinancial, marketing, and other resources than we do and who are represented by dealers in the markets in which we now operate andinto which we plan to expand. We also compete with a variety of small, independent manufacturers. We cannot provide assurance thatwe will not face greater competition from existing large or small manufacturers or that we will be able to compete successfully withnew competitors. Our failure to compete effectively with our current and future competitors would adversely affect our business,financial condition, and results of operations.
Our sales may be adversely impacted by increased consumer preference for used boats or the supply of new boats by competitors inexcess of demand.
During the economic downturn that commenced in 2008, we observed a shift in consumer demand toward purchasing more usedboats, primarily because prices for used boats are typically lower than retail prices for new boats. If this were to occur again (includingas a result of the COVID-19 Pandemic), it could have the effect of reducing demand among retail purchasers for our new boats. Also,while we have taken steps designed to balance production volumes for our boats with demand, our competitors could choose to reducethe price of their products, which could have the effect of reducing demand for our new boats. Reduced demand for new boats couldlead to reduced sales by us, which could adversely affect our business, results of operations, and financial condition.
Our international markets require significant management attention, expose us to difficulties presented by international economic,political, legal, and business factors, and may not be successful or produce desired levels of sales and profitability.
We currently sell our products throughout the world. International markets have been, and will continue to be, a focus for salesgrowth. We believe many opportunities exist in the international markets, and over time we intend for international sales to comprise alarger percentage of our total revenue. Several factors, including weakened international economic conditions, could adversely affectsuch growth and there can be no assurance that we will be able to sustain our current international sales levels in the future. Theexpansion of our existing international operations and entry into additional international markets require significant managementattention. Some of the countries in which we market, and in which our distributors or licensee(s) sell our products, are subject topolitical, economic, or social instability. Our international operations expose us and our representatives, agents, and distributors torisks inherent in operating in foreign jurisdictions. These risks include, but are not limited to:
• increased costs of customizing products for foreign countries;
• unfamiliarity with local demographics, consumer preferences, and discretionary spending patterns;
• difficulties in attracting consumers due to a reduced level of consumer familiarity with our brand;
• competition with new, unfamiliar competitors;
• the imposition of additional foreign governmental controls or regulations, including rules relating to environmental, health,and safety matters and regulations, and other laws applicable to publicly-traded companies, such as the Foreign CorruptPractices Act, or the FCPA;
• new or enhanced trade restrictions and restrictions on the activities of foreign agents, representatives, and distributors;
• the imposition of increases in costly and lengthy import and export licensing and other compliance requirements, customsduties and tariffs, license obligations, and other non-tariff barriers to trade;
• changes to the U.S.�s participation in, withdrawal out of, renegotiation of certain international trade agreements or othermajor trade related issues including the non-renewal of expiring favorable tariffs granted to developing countries, tariffquotas, and retaliatory tariffs, trade sanctions, new or onerous trade restrictions, embargoes and other stringent governmentcontrols;
• the relative strength of the U.S. dollar compared to local currency, making our products less price-competitive relative toproducts manufactured outside of the U.S.;
• laws and business practices favoring local companies;
• longer payment cycles and difficulties in enforcing agreements and collecting receivables through certain foreign legalsystems;
• difficulties in enforcing or defending intellectual property rights; and
• insurrection or war that may disrupt or limit our relationships with our foreign consumers.

18
Our international operations may not produce desired levels of total sales, or one or more of the foregoing factors may harm ourbusiness, financial condition, or results of operations.
International tariffs could materially and adversely affect our business and results of operations.
The current political landscape has introduced significant uncertainty with respect to future trade regulations and existing internationaltrade agreements, as shown by the recent U.S.-initiated renegotiation of the North America Free Trade Agreement, and Brexit inEurope. This uncertainty includes the possibility of imposing additional tariffs or penalties on products manufactured outside the U.Sand the potential for increased trade barriers between the UK and the European Union. The institution of global trade tariffs carries therisk of negatively affecting global economic conditions, which could have a negative impact on our business and results of operations.
In addition, U.S. initiated tariffs on certain foreign goods, including raw materials, commodities, and products manufactured outsidethe United States that are used in our manufacturing processes may cause our manufacturing cost to rise, which would have a negativeimpact on our business and results of operations.
Fluctuations in foreign currency exchange rates could result in declines in our reported sales and net earnings.
The changing relationships of primarily the U.S. dollar to the Canadian dollar, the Australian dollar, the Euro, the British poundsterling, the Japanese yen, and certain other foreign currencies have from time to time had a negative impact on our results ofoperations. Fluctuations in the value of the U.S. dollar relative to these foreign currencies can adversely affect the price of ourproducts in foreign markets and the costs we incur to import certain components for our products. We will often attempt to offset thesehigher prices with increased discounts, which can lead to reduced net sales per unit.
Our variable rate indebtedness subjects us to interest rate risk, which could cause our debt service obligations to increasesignificantly.
Borrowings under our revolving credit facility and term loans are at variable rates of interest and expose us to interest rate risk.Reference rates used to determine the applicable interest rates for our debt are currently at relatively low levels. If interest ratesincrease, the debt service obligations on our indebtedness will increase even if the amount borrowed remains the same, and our netincome and cash flows, including cash available for servicing our indebtedness, will correspondingly decrease. Please see Part II, Item7A, �Quantitative and Qualitative Disclosures about Market Risk� for discussion of our market risk related to interest rates.
The Chief Executive of the U.K. Financial Conduct Authority (the �FCA�), which regulates LIBOR, has announced that the FCA willno longer persuade or compel banks to submit rates for the calculation of LIBOR after calendar year 2021. That announcementindicates that the continuation of LIBOR on the current basis cannot and will not be guaranteed after calendar year 2021. Moreover, itis possible that LIBOR will be discontinued or modified prior to the end of calendar year 2021. All of our $108.6 million of debtoutstanding under our credit agreement as of June 30, 2020 bears interest at a floating rate that uses either LIBOR or the prime rate asthe reference rate to calculate our interest rate. Our credit agreement provides that, if the administrative agent has determined thatadequate means do not exist for ascertaining LIBOR or that LIBOR does not adequately and fairly reflect the cost to lenders formaking, funding or maintaining their loans, then all of our outstanding loans under the credit agreement will be converted into loansthat accrue interest at the prime rate. Further, the lenders under our credit agreement will no longer be obligated to make loans usingLIBOR as the reference rate.
Uncertainty as to the nature of potential changes to LIBOR, fallback provisions, alternative reference rates or other reforms couldadversely impact our interest expense on our floating rate debt that currently uses LIBOR as the applicable reference rate. Further, thediscontinuance or modification of LIBOR and the use of the prime rate may result in an increase in the cost of future indebtedness,which could have a material adverse effect on our financial condition, cash flow and results of operations. We intend to closelymonitor the financial markets and the use of fallback provisions and alternative reference rates in anticipation of the discontinuance ormodification of LIBOR by the end of calendar year 2021.
We compete with a variety of other activities for consumers� scarce leisure time.
Our boats are used for recreational and sport purposes, and demand for our boats may be adversely affected by competition from otheractivities that occupy consumers� leisure time and by changes in consumer lifestyle, usage pattern, or taste. Similarly, an overalldecrease in consumer leisure time may reduce consumers� willingness to purchase and enjoy our products.

19
Our success depends on the continued strength of our brands and the value of our brands, and sales of our products could bediminished if we, the athletes who use our products, or the sports and activities in which our products are used are associated withnegative publicity.
We believe that our brands are a significant contributor to the success of our business and that maintaining and enhancing our brandsis important to expanding our consumer and dealer base. Failure to continue to protect our brands may adversely affect our business,financial condition, and results of operations.
Negative publicity, including that resulting from severe injuries or death occurring in the sports and activities in which our productsare used, could negatively affect our reputation and result in restrictions, recalls, or bans on the use of our products. Further, actionstaken by athletes associated with our products that harm the reputations of those athletes could also harm our brand image andadversely affect our financial condition. If the popularity of the sports and activities for which we design, manufacture, and sellproducts were to decrease as a result of these risks or any negative publicity, sales of our products could decrease, which could havean adverse effect on our net sales, profitability, and operating results. In addition, if we become exposed to additional claims andlitigation relating to the use of our products, our reputation may be adversely affected by such claims, whether or not successful,including by generating potential negative publicity about our products, which could adversely impact our business and financialcondition.
We may not be able to execute our manufacturing strategy successfully, which could cause the profitability of our products tosuffer.
Our manufacturing strategy is designed to improve product quality and increase productivity, while reducing costs and increasingflexibility to respond to ongoing changes in the marketplace. To implement this strategy, we must be successful in our continuousimprovement efforts, which depend on the involvement of management, production employees, and suppliers. Any inability to achievethese objectives could adversely impact the profitability of our products and our ability to deliver desirable products to our consumers.
Our ability to meet our manufacturing workforce needs is crucial to our results of operations and future sales and profitability.
We rely on the existence of an available hourly workforce to manufacture our boats. We cannot provide assurance that we will be ableto attract and retain qualified employees to meet current or future manufacturing needs at a reasonable cost, or at all. Although none ofour employees are currently covered by collective bargaining agreements, we cannot provide assurance that our employees will notelect to be represented by labor unions in the future, which could increase our labor costs. Additionally, competition for qualifiedemployees could require us to pay higher wages to attract a sufficient number of employees. Significant increases in manufacturingworkforce costs could materially adversely affect our business, financial condition, or results of operations.
We rely on third-party suppliers and, in particular, suppliers of the engine packages used in the manufacturing of our boats.
We depend on third-party suppliers to provide components and raw materials essential to the construction of our boats. While webelieve that our relationships with our current suppliers are sufficient to provide the materials necessary to meet present productiondemand, we cannot provide assurance that these relationships will continue or that the quantity or quality of materials available fromthese suppliers will be sufficient to meet our future needs, irrespective of whether we successfully implement our growth strategy. Oursuppliers� ability to provide the components and raw materials essential to the construction of our boats may also be adverselyimpacted as a result of the COVID-19 Pandemic. As production increases, our need for raw materials and supplies will increase. Oursuppliers must be prepared to ramp up operations and, in many cases, hire additional workers and/or expand capacity in order to fulfillthe orders placed by us and other consumers. Operational and financial difficulties that our suppliers may face in the future couldadversely affect their ability to supply us with the parts and components we need, which could significantly disrupt our operations.
The availability and cost of engines used in the manufacture of our boats are especially critical. For fiscal 2020, we purchased all ofthe inboard engine packages for our MasterCraft brand boats from Ilmor. We also maintain a strong and long-standing relationshipwith our primary supplier of NauticStar engine packages, Yamaha, and our primary supplier of Crest engine packages, Mercury.While we believe that our relationships with these suppliers are sufficient to provide the materials necessary to meet presentproduction demand, there can be no assurance that these relationships will continue or that the quantity or quality of the enginesprovided will be sufficient to meet our future needs, irrespective of whether we successfully implement our growth strategy. If we arerequired to replace these suppliers, it could cause a decrease in products available for sale or an increase in the cost of goods sold,either of which could adversely affect our business, financial condition, and results of operations. In addition to the risk of interruptionof our engine supply, these suppliers could potentially exert significant bargaining power over price, quality, warranty claims, or otherterms relating to the engines we use. We are required to purchase a minimum volume of engines from Ilmor annually. In addition,MasterCraft could be required to pay a penalty to Ilmor in order to maintain exclusivity if annual purchases under the agreement fail tomeet a certain threshold. While these minimums are significantly below our current volumes, there can be no assurance that we willcontinue to meet these minimums in the future.

20
Termination or interruption of informal supply arrangements could have a material adverse effect on our business or results ofoperations.
We have informal supply arrangements with some of our suppliers, including the sole supplier of our gas and ballast tanks. In theevent of a termination of a supply arrangement, there can be no assurance that alternate supply arrangements will be made onsatisfactory terms. If we need to enter into supply arrangements on unsatisfactory terms, or if there are any delays to our supplyarrangements, it could adversely affect our business and operating results.
We depend on key personnel and we may not be able to retain them or attract, assimilate, and retain highly qualified employees inthe future.
Our future success will depend in significant part on the continued service of our senior management team and our continuing abilityto attract, assimilate, and retain highly qualified and skilled managerial, product development, manufacturing, marketing, and otherpersonnel. The loss of the services of any members of our senior management or other key personnel or the inability to hire or retainqualified personnel in the future could adversely affect our business, financial condition, and results of operations.
We may attempt to grow our business through additional acquisitions or strategic alliances and new partnerships, which we maynot be successful in completing or integrating.
We may in the future explore acquisitions and strategic alliances that will enable us to acquire complementary skills and capabilities,offer new products, expand our consumer base, enter new product categories or geographic markets, and obtain other competitiveadvantages. We cannot provide assurance, however, that we will identify acquisition candidates or strategic partners that are suitableto our business, obtain financing on satisfactory terms, complete acquisitions or strategic alliances, or successfully integrate acquiredoperations into our existing operations. Once integrated, acquired operations may not achieve anticipated levels of sales orprofitability, or otherwise perform as expected. Acquisitions also involve special risks, including risks associated with unanticipatedchallenges, liabilities and contingencies, and diversion of management attention and resources from our existing operations. Similarly,our partnership with leading franchises from other industries to market our products or with third-party technology providers tointroduce new technology to the market may not achieve anticipated levels of consumer enthusiasm and acceptance, or achieveanticipated levels of sales or profitability, or otherwise perform as expected.
Our intellectual property rights may be inadequate to protect our business.
We attempt to protect our intellectual property through a combination of patent, trademark, copyright, protected design, and tradesecret laws. We hold patents, trademarks, copyrights, and design rights relating to various aspects of our products and believe thatproprietary technical know-how is important to our business. Proprietary rights relating to our products are protected fromunauthorized use by third parties only to the extent that they are covered by valid and enforceable patents, trademarks, or copyrights,to the extent they are protected designs, or to the extent they are maintained in confidence as trade secrets.
We cannot be certain that we will be issued any patents from any pending or future patent applications owned by or licensed to us, orthat the claims allowed under any issued patents will be sufficiently broad to protect our technology. Further, the patents we owncould be challenged, invalidated, or circumvented by others. Further, we cannot provide assurance that competitors will not infringeour patents, or that we will have adequate resources to enforce our patents.
We also rely on unpatented proprietary technology. It is possible that others will independently develop the same or similartechnology or otherwise obtain access to our unpatented technology. To protect our trade secrets and other proprietary information, werequire employees, consultants, advisors, and collaborators to enter into confidentiality agreements. We cannot provide assurance thatthese agreements will provide meaningful protection for our trade secrets, know-how, or other proprietary information in the event ofany unauthorized use, misappropriation, or disclosure of such trade secrets, know-how, or other proprietary information. If we areunable to maintain the proprietary nature of our technologies, we could be materially adversely affected.
Further, we have attempted to protect certain of our vessel hull designs by seeking to register those designs with the U.S. CopyrightOffice. We cannot provide assurance that our applications will be approved. If approved, protection of the vessel design laststen years. However, our protected vessel hull designs could be challenged, invalidated, or circumvented by others. Further, we cannotprovide assurance that competitors will not infringe our designs, or that we will have adequate resources to enforce our rights.
We rely on our trademarks, trade names, and brand names to distinguish our products from the products of our competitors and haveregistered or applied to register many of these trademarks. We cannot provide assurance that our trademark applications will beapproved. Third parties may also oppose our trademark applications, or otherwise challenge our use of the trademarks. In the eventthat our trademarks are successfully challenged, we could be forced to rebrand our products, which could result in loss of brandrecognition, and could require us to devote resources to advertising and marketing new brands. Further, we cannot provide assurancethat competitors will not infringe our trademarks, or that we will have adequate resources to enforce our trademarks.

21
If third parties claim that we infringe on their intellectual property rights, our financial condition could be adversely affected.
We face the risk of claims that we have infringed third parties� intellectual property rights. Any claims of patent or other intellectualproperty infringement, even those without merit, could be expensive and time consuming to defend, cause us to cease making,licensing, or using products that incorporate the challenged intellectual property, require us to redesign, reengineer, or rebrand ourproducts, if feasible, divert management�s attention and resources, or require us to enter into royalty or licensing agreements in orderto obtain the right to use a third party�s intellectual property. Any royalty or licensing agreements, if required, may not be available tous on acceptable terms or at all. A successful claim of infringement against us could result in our being required to pay significantdamages, enter into costly license or royalty agreements, or stop the sale of certain products, any of which could have a negativeimpact on our business, financial condition, and results of operations. While we are not currently involved in any outstandingintellectual property litigation that we believe, individually or in the aggregate, will have a material adverse effect on our business,financial condition, or results of operations, we cannot predict the outcome of any pending litigation and an unfavorable outcomecould have an adverse impact on our business, financial condition, or results of operations.
Product liability, warranty, personal injury, property damage, and recall claims may materially affect our financial condition anddamage our reputation.
We are engaged in a business that exposes us to claims for product liability and warranty claims in the event our products actually orallegedly fail to perform as expected, or the use of our products results, or is alleged to result, in property damage, personal injury, ordeath. We have in the past incurred such liabilities and may in the future be exposed to liability for such claims. Although we maintainproduct and general liability insurance of the types and in the amounts that we believe are customary for the industry, we are not fullyinsured against all such potential claims. We may experience legal claims in excess of our insurance coverage or claims that are notcovered by insurance, either of which could adversely affect our business, financial condition, and results of operations. Adversedetermination of material product liability and warranty claims made against us could have a material adverse effect on our financialcondition and harm our reputation. In addition, if any of our products are, or are alleged to be, defective, we may be required toparticipate in a recall of that product if the defect or alleged defect relates to safety. These and other claims we may face could becostly to us and require substantial management attention.
Significant product repair and/or replacement due to product warranty claims or product recalls could have a material adverseimpact on our results of operations.
We provide a limited warranty for our products. We may provide additional warranties related to certain promotional programs, aswell as warranties in certain geographical markets as determined by local regulations and market conditions.
Although we employ quality control procedures, sometimes a product is distributed that needs repair or replacement. Our standardwarranties require us or our dealers to repair or replace defective products during such warranty periods at no cost to the consumer.Historically, product recalls have been administered through our dealers and distributors. The repair and replacement costs we couldincur in connection with a recall could adversely affect our business. In addition, product recalls could harm our reputation and causeus to lose consumers, particularly if recalls cause consumers to question the safety or reliability of our products.
The nature of our business exposes us to workers� compensation claims and other workplace liabilities.
Certain materials we use require our employees to handle potentially hazardous or toxic substances. While our employees who handlethese and other potentially hazardous or toxic materials receive specialized training and wear protective clothing, there is still a riskthat they, or others, may be exposed to these substances. Exposure to these substances could result in significant injury to ouremployees and damage to our property or the property of others, including natural resource damage. Our personnel are also at risk forother workplace- related injuries, including slips and falls. We have in the past been, and may in the future be, subject to fines,penalties, and other liabilities in connection with any such injury or damage. Although we currently maintain what we believe to besuitable and adequate insurance in excess of our self-insured amounts, we may be unable to maintain such insurance on acceptableterms or such insurance may not provide adequate protection against potential liabilities.
We may be subject to information technology system failures, network disruptions, and breaches in data security.
We use many information technology systems and their underlying infrastructure to operate our business. In addition to thedisruptions that may occur from interruptions in our information technology systems, cybersecurity threats and sophisticated andtargeted cyberattacks pose a risk to our information technology systems. We have established security policies, processes, anddefenses designed to help identify and protect against intentional and unintentional misappropriation or corruption of our informationtechnology systems and information and disruption of our operations. Despite these efforts, our information technology systems maybe damaged, disrupted, or shut down due to attacks by unauthorized access, malicious software, computer viruses, undetectedintrusion, hardware failures, or other events, and in these circumstances our disaster recovery plans may be ineffective or inadequate.These breaches or intrusions could lead to business interruption, exposure of proprietary or confidential information, data corruption,

22
damage to our reputation, exposure to legal and regulatory proceedings, and other costs. A security breach might also lead toviolations of privacy laws, regulations, trade guidelines or practices related to our customers and associates and could result inpotential claims from customers, associates, shareholders, or regulatory agencies. Such events could adversely impact our reputation,business, financial position, results of operations, and cash flows. In addition, we could be adversely affected if any of our significantcustomers or suppliers experiences any similar events that disrupt their business operations or damage their reputation.
While we maintain monitoring practices and protections of our information technology to reduce these risks and test our systems on anongoing basis for potential threats, there can be no assurance that these efforts will prevent a cyber-attack or other security breach. Wecarry cybersecurity insurance to help mitigate the financial exposure and related notification procedures in the event of intentionalintrusion; however, there can be no assurance that our insurance will adequately protect against potential losses that could adverselyaffect our business.
An increase in energy costs may materially adversely affect our business, financial condition, and results of operations.
Higher energy costs result in increases in operating expenses at our manufacturing facility and in the expense of shipping products toour dealers. In addition, increases in energy costs may adversely affect the pricing and availability of petroleum-based raw materials,such as resins and foams that are used in our products. Also, higher fuel prices may have an adverse effect on demand for our boats, asthey increase the cost of ownership and operation.
We are subject to U.S. and other anti-corruption laws, trade controls, economic sanctions, and similar laws and regulations,including those in the jurisdictions where we operate. Our failure to comply with these laws and regulations could subject us tocivil, criminal, and administrative penalties and harm our reputation.
Doing business on a worldwide basis requires us to comply with the laws and regulations of various foreign jurisdictions. These lawsand regulations place restrictions on our operations, trade practices, partners, and investment decisions. In particular, our operationsare subject to U.S. and foreign anti-corruption and trade control laws and regulations, such as the FCPA, export controls, andeconomic sanctions programs, including those administered by the U.S. Treasury Department�s Office of Foreign Assets Control, orOFAC. As a result of doing business in foreign countries and with foreign partners, we are exposed to a heightened risk of violatinganti-corruption and trade control laws and sanctions regulations.
The FCPA prohibits us from providing anything of value to foreign officials for the purpose of obtaining or retaining business orsecuring any improper business advantage. It also requires us to keep books and records that accurately and fairly reflect ourtransactions.
Economic sanctions programs restrict our business dealings with certain sanctioned countries, persons, and entities. In addition,because we act through dealers and distributors, we face the risk that our dealers, distributors, or consumers might further distributeour products to a sanctioned person or entity, or an ultimate end-user in a sanctioned country, which might subject us to aninvestigation concerning compliance with OFAC or other sanctions regulations.
Violations of anti-corruption and trade control laws and sanctions regulations are punishable by civil penalties, including fines, denialof export privileges, injunctions, asset seizures, debarment from government contracts, and revocations or restrictions of licenses, aswell as criminal fines and imprisonment. We cannot provide assurance that all of our local, strategic, or joint partners will complywith these laws and regulations, in which case we could be held liable for actions taken inside or outside of the U.S., even though ourpartners may not be subject to these laws. Such a violation could materially and adversely affect our reputation, business, results ofoperations and financial condition. Our continued international expansion, including in developing countries, and our development ofnew partnerships and joint venture relationships worldwide increase the risk of FCPA or OFAC violations in the future.
If we are unable to comply with environmental and other regulatory requirements, our business may be exposed to materialliability and/or fines.
Our operations are subject to extensive and frequently changing federal, state, local, and foreign laws and regulations, including thoseconcerning product safety, environmental protection, and occupational health and safety. Some of these laws and regulations requireus to obtain permits and limit our ability to discharge hazardous materials into the environment. If we fail to comply with theserequirements, we may be subject to civil or criminal enforcement actions that could result in the assessment of fines and penalties,obligations to conduct remedial or corrective actions, or, in extreme circumstances, revocation of our permits or injunctions preventingsome or all of our operations. In addition, the components of our boats must meet certain regulatory standards, including stringent airemission standards for boat engines. Failure to meet these standards could result in an inability to sell our boats in key markets, whichwould adversely affect our business. Moreover, compliance with these regulatory requirements could increase the cost of our products,which in turn, may reduce consumer demand.

23
While we believe that we are in material compliance with applicable federal, state, local, and foreign regulatory requirements, andhold all licenses and permits required thereunder, we cannot provide assurance that we will, at all times, be able to continue to complywith applicable regulatory requirements. Compliance with increasingly stringent regulatory and permit requirements may, in thefuture, cause us to incur substantial capital costs and increase our cost of operations, or may limit our operations, all of which couldhave a material adverse effect on our business or financial condition.
As with most boat construction businesses, our manufacturing processes involve the use, handling, storage, and contracting forrecycling or disposal of hazardous substances and wastes. The failure to manage or dispose of such hazardous substances and wastesproperly could expose us to material liability or fines, including liability for personal injury or property damage due to exposure tohazardous substances, damages to natural resources, or for the investigation and remediation of environmental conditions. Underenvironmental laws, we may be liable for remediation of contamination at sites where our hazardous wastes have been disposed or atour current or former facilities, regardless of whether such facilities are owned or leased or whether the environmental conditions werecreated by us, a prior owner or tenant, or a third-party. While we do not believe that we are presently subject to any such liabilities, wecannot assure you that environmental conditions relating to our prior, existing, or future sites or operations or those of predecessorcompanies will not have a material adverse effect on our business or financial condition.
Negative public perception of our products or restrictions on the access or the use of our products in certain locations couldmaterially adversely affect our business or results of operations.
Demand for our products depends in part on their acceptance by the public. Public concerns about the environmental impact of ourproducts or their perceived safety could result in diminished public perception of the products we sell. Government, media, or activistpressure to limit emissions could also negatively impact consumers� perceptions of our products. Any decline in the public acceptanceof our products could negatively impact their sales or lead to changes in laws, rules and regulations that prevent access to certainlocations or restrict use or manner of use in certain areas or during certain times, which could also negatively impact sales. Anymaterial decline in the public acceptance of our products could impact our ability to retain existing consumers or attract new oneswhich, in turn, could have a material adverse effect on our business, results of operations or financial condition.
Natural disasters, environmental disasters, the effects of climate change, pandemics, or other disruptions, or civil insurrection orsocial unrest at our manufacturing facilities or in other regions of the United States could adversely affect our business, financialcondition, and results of operations.
We rely on the continuous operation of our manufacturing facilities in Vonore, Tennessee, Armory, Mississippi, and Owosso,Michigan for the production of our products. Any natural disaster or other serious disruption to our facilities due to fire, snow, flood,earthquake, pandemics, civil insurrection or social unrest or any other unforeseen circumstance could adversely affect our business,financial condition, and results of operations. Changes in climate could adversely affect our operations by limiting or increasing thecosts associated with equipment or fuel supplies. In addition, adverse weather conditions, such as increased frequency and/or severityof storms, or floods could impair our ability to operate by damaging our facilities and equipment or restricting product delivery tocustomers. The occurrence of any disruption at our manufacturing facilities, even for a short period of time, may have an adverseeffect on our productivity and profitability, during and after the period of the disruption. These disruptions may also cause personalinjury and loss of life, severe damage to or destruction of property and equipment, and environmental damage. Although we maintainproperty, casualty, and business interruption insurance of the types and in the amounts that we believe are customary for the industry,we are not fully insured against all potential natural disasters or other disruptions to our manufacturing facilities.
In addition, we have dealers and third-party suppliers located in regions of the United States that have been and may be exposed todamaging storms, such as hurricanes and tornados, floods and environmental disasters. Although preventative measures may help tomitigate damage, the damage and disruption resulting from natural and environmental disasters may be significant. Such disasters candisrupt our consumers, dealers, or suppliers, which can interrupt our operational processes and our sales and profits.
Increases in income tax rates or changes in income tax laws or enforcement could have a material adverse impact on our financialresults.
Changes in domestic and international tax legislation could expose us to additional tax liability. Although we monitor changes in taxlaws and work to mitigate the impact of proposed changes, such changes may negatively impact our financial results. In addition,increases in individual income tax rates would negatively affect our potential consumers� discretionary income and could decrease thedemand for our products.

24
Our credit facilities contain covenants which may limit our operating flexibility; failure to comply with covenants may result in ourlenders restricting or terminating our ability to borrow under such credit facilities.
In the past, we have relied on our existing credit facilities to provide us with adequate liquidity to operate our business. Theavailability of borrowing amounts under our credit facilities is dependent on compliance with the debt covenants set forth in our creditagreement. Violation of those covenants, whether as a result of operating losses or otherwise, could result in our lenders restricting orterminating our borrowing ability under our credit facilities. If our lenders reduce or terminate our access to amounts under our creditfacilities, we may not have sufficient capital to fund our working capital and other needs, and we may need to secure additional capitalor financing to fund our operations or to repay outstanding debt under our credit facilities. We cannot provide assurance that we willbe successful in ensuring the availability of amounts under our credit facilities or in raising additional capital, or that any amount, ifraised, will be sufficient to meet our cash needs or will be on terms as favorable as those which have been available to us historically.If we are not able to maintain our ability to borrow under our credit facilities, or to raise additional capital when needed, our businessand operations will be materially adversely affected.
Risks Relating to Ownership of our Common Stock
Shareholders may be diluted by future issuances of common stock in connection with our incentive plans, acquisitions, orotherwise; future sales of such shares in the public market, or the expectations that such sales may occur, could lower our stockprice.
Our amended and restated certificate of incorporation authorizes us to issue shares of common stock and options, rights, warrants, andappreciation rights relating to common stock for the consideration and on the terms and conditions established by our board ofdirectors in its sole discretion, whether in connection with acquisitions or otherwise.
Any common stock that we issue, including under our 2015 Incentive Award Plan or other equity incentive plans that we may adopt inthe future, would dilute the percentage ownership of holders of our common stock.
Our common stock price may be volatile or may decline regardless of our operating performance.
It is possible that an active trading market for our common stock will not be sustained, which could make it difficult for investors tosell their shares of our common stock at an attractive price or at all.
Volatility in the market price of our common stock may prevent investors from being able to sell their shares at or above the price theypaid for them. Many factors, which are outside our control, may cause the market price of our common stock to fluctuate significantly,including those described elsewhere in this �Risk Factors� section and this Form 10-K, as well as the following:
• our operating and financial performance and prospects;
• our quarterly or annual earnings or those of other companies in our industry compared to market expectations;
• conditions that impact demand for our services;
• future announcements concerning our business or our competitors� businesses;
• the public�s reaction to our press releases, other public announcements, and filings with the SEC;
• coverage by or changes in financial estimates by securities analysts or failure to meet their expectations;
• market and industry perception of our success, or lack thereof, in pursuing our growth strategy;
• strategic actions by us or our competitors, such as acquisitions or restructurings;
• changes in laws or regulations that adversely affect our industry or us;
• changes in accounting standards, policies, guidance, interpretations, or principles;
• changes in senior management or key personnel;
• issuances, exchanges or sales, or expected issuances, exchanges or sales of our capital stock;
• changes in our dividend policy;
• adverse resolution of new or pending litigation against us; and
• changes in general market, economic, and political conditions in the U.S. and global economies or financial markets,including those resulting from the COVID-19 Pandemic, natural disasters, terrorist attacks, acts of war, civil insurrection andsocial unrest, and responses to such events.

25
As a result, volatility in the market price of our common stock may prevent investors from being able to sell their common stock at orabove the price they paid for it or at all. These broad market and industry factors may materially reduce the market price of ourcommon stock, regardless of our operating performance. In addition, price volatility may be greater if the public float and tradingvolume of our common stock is low. As a result, investors may suffer a loss on their investment.
We do not intend to pay dividends on our common stock for the foreseeable future.
While we have paid dividends in the past, we presently have no intention to pay dividends on our common stock at any time in theforeseeable future. Any decision to declare and pay dividends in the future will be made at the discretion of our board of directors andwill depend on, among other things, our results of operations, financial condition, cash requirements, contractual restrictions, andother factors that our board of directors may deem relevant. Certain of our debt instruments contain covenants that restrict the abilityof our subsidiaries to pay dividends to us. In addition, we will be permitted under the terms of our debt instruments to incur additionalindebtedness, which may restrict or prevent us from paying dividends on our common stock. Furthermore, our ability to declare andpay dividends may be limited by instruments governing future outstanding indebtedness we may incur.
Delaware law and certain provisions in our amended and restated certificate of incorporation may prevent efforts by ourstockholders to change the direction or management of our Company.
We are a Delaware corporation, and the anti-takeover provisions of Delaware law impose various impediments to the ability of a thirdparty to acquire control of us, even if a change of control would be beneficial to our existing stockholders. In addition, our amendedand restated certificate of incorporation and our amended and restated by-laws currently contain provisions that may make theacquisition of our company more difficult without the approval of our board of directors, including, but not limited to, the following:
• our board of directors will be classified into three classes until our 2022 annual meeting of stockholders;
• only our board of directors may call special meetings of our stockholders; and
• we require advance notice and duration of ownership requirements for stockholder proposals.
These provisions could discourage, delay, or prevent a transaction involving a change in control of our company. These provisionscould also discourage proxy contests and make it more difficult for stockholders to elect directors of their choosing and cause us totake other corporate actions they desire. In addition, because our board of directors is responsible for appointing the members of ourmanagement team, these provisions could in turn affect any attempt by our stockholders to replace current members of ourmanagement team.
For as long as we are an emerging growth company, we will not be required to comply with certain reporting requirements,including those relating to accounting standards and disclosure about our executive compensation, that apply to other publiccompanies.
We are an �emerging growth company,� as defined in Section 2(a) of the Securities Act, as modified by the JOBS Act. As such, weare eligible to take advantage of certain exemptions from various reporting requirements that are applicable to other public companiesthat are not �emerging growth companies,� including, but not limited to, (i) not being required to comply with the auditor attestationrequirements of Section 404(b) of the Sarbanes-Oxley Act, (ii) reduced disclosure obligations regarding executive compensation inour periodic reports and proxy statements, and (iii) exemptions from the requirements of holding a non-binding advisory vote onexecutive compensation and of stockholder approval of any golden parachute payments not previously approved. We have elected toadopt these reduced disclosure requirements. We cannot predict if investors will find our common stock less attractive as a result ofour taking advantage of these exemptions and as a result, there may be a less active trading market for our common stock and ourstock price may be more volatile.
We will remain an �emerging growth company� until June 30, 2021, which is the last day of our fiscal year following the fifthanniversary of the date of completion of our initial public offering.
The obligations associated with being a public company require significant resources and management attention, which may divertus from our business operations.
As a result of our initial public offering, we are subject to the reporting requirements of the Exchange Act and the Sarbanes-OxleyAct. The Exchange Act requires that we file annual, quarterly, and current reports with respect to our business and financial condition.The Sarbanes-Oxley Act requires, among other things, that we establish and maintain effective internal controls and procedures forfinancial reporting. As a result, we have and will continue to incur significant legal, accounting, and other expenses that we did notpreviously incur.

26
In addition, the need to establish the corporate infrastructure demanded of a public company may divert management�s attention fromimplementing our business strategy, which could prevent us from improving our business, results of operations, and financialcondition. We have made, and will continue to make, changes to our internal controls, including information technology controls, andprocedures for financial reporting and accounting systems to meet our reporting obligations as a public company. However, themeasures we take may not be sufficient to satisfy our obligations as a public company. If we do not continue to develop andimplement the right processes and tools to manage our changing enterprise and maintain our culture, our ability to competesuccessfully and achieve our business objectives could be impaired, which could negatively impact our business, financial condition,and results of operations. In addition, we cannot predict or estimate the amount of additional costs we may incur to comply with theserequirements. We anticipate that these costs will be material to our general and administrative expenses.
Furthermore, as a public company, we have and will continue to incur additional legal, accounting, and other expenses that have notbeen reflected in our historical financial statements. In addition, rules implemented by the SEC and NASDAQ have imposed variousrequirements on public companies, including establishment and maintenance of effective disclosure and financial controls and changesin corporate governance practices. Our management and other personnel will need to devote a substantial amount of time to thesecompliance initiatives. These rules and regulations result in our incurring legal and financial compliance costs and will make someactivities more time-consuming and costly. For example, we expect these rules and regulations to make it more difficult and moreexpensive for us to maintain director and officer liability insurance, and we may be required to accept reduced policy limits andcoverage or incur substantially higher costs to maintain the same or similar coverage. As a result, it may be more difficult for us toattract and retain qualified people to serve on our board of directors, on our board committees, or as executive officers.
Our failure to achieve and maintain effective internal control over financial reporting in accordance with Section 404 of theSarbanes-Oxley Act as a public company could have a material adverse effect on our business and share price.
Prior to the completion of our initial public offering, we had not operated as a public company and were not required to independentlycomply with Section 404(a) of the Sarbanes-Oxley Act. Section 404(a) of the Sarbanes-Oxley Act requires annual managementassessments of the effectiveness of our internal control over financial reporting, starting with the second annual report that we file withthe SEC. We were required to meet these standards in the course of preparing our financial statements as of and for the year endedJune 30, 2016, and our management is required to report on the effectiveness of our internal control over financial reporting for suchyear and annually thereafter. Additionally, once we are no longer an �emerging growth company,� our independent registered publicaccounting firm will be required pursuant to Section 404(b) of the Sarbanes-Oxley Act to attest to the effectiveness of our internalcontrol over financial reporting on an annual basis. The rules governing the standards that must be met for our management to assessour internal control over financial reporting are complex and require significant documentation, testing, and possible remediation.
Internal control over financial reporting is a process designed to provide reasonable assurance regarding the reliability of financialreporting and the preparation of financial statements in accordance with generally accepted accounting principles. We are currently inthe process of reviewing, documenting, and testing our internal control over financial reporting. We may encounter problems or delaysin implementing any changes necessary to make a favorable assessment of our internal control over financial reporting. In addition,we may encounter problems or delays in completing the implementation of any requested improvements and receiving a favorableattestation in connection with the attestation to be provided by our independent registered public accounting firm after we cease to bean emerging growth company. If we cannot favorably assess the effectiveness of our internal control over financial reporting, or if ourindependent registered public accounting firm is unable to provide an unqualified attestation report on our internal controls after wecease to be an emerging growth company, investors could lose confidence in our financial information and the price of our commonstock could decline.
Additionally, the existence of any material weakness or significant deficiency may require management to devote significant time andincur significant expense to remediate any such material weaknesses or significant deficiencies and management may not be able toremediate any such material weaknesses or significant deficiencies in a timely manner. The existence of any material weakness in ourinternal control over financial reporting could also result in errors in our financial statements that could require us to make out ofperiod adjustments, restate our financial statements, cause us to fail to meet our reporting obligations, and cause stockholders to loseconfidence in our reported financial information, all of which could materially and adversely affect our business and share price.
If securities analysts do not publish research or reports about our company, or if they issue unfavorable commentary about us orour industry or downgrade our common stock, the price of our common stock could decline.
The trading market for our common stock depends in part on the research and reports that third-party securities analysts publish aboutour company and our industry. We may be unable or slow to attract research coverage and if one or more analysts cease coverage ofour company, we could lose visibility in the market. In addition, one or more of these analysts could downgrade our common stock orissue other negative commentary about our company or our industry. As a result of one or more of these factors, the trading price ofour common stock could decline.

27
ITEM 1B. UNRESOLVED STAFF COMMENTS.
None.
ITEM 2. PROPERTIES.
As of June 30, 2020, all our MasterCraft and Aviara boats are manufactured and lake-tested at our 250,000-square-foot manufacturingfacility located on approximately 60 acres of lakefront land in Vonore, Tennessee. In addition, we own a 35,000 square-foot facility inVonore where we manufacture trailers, and we lease a 3,000 square-foot warehouse facility in West Yorkshire, England forwarehousing of parts. All our NauticStar boats are manufactured in our 200,000-square-foot manufacturing facility located on 17 acresof land in Amory, Mississippi. All our Crest boats are manufactured in a more than 140,000-square-foot manufacturing facility locatedon approximately 63 acres in Owosso, Michigan.
ITEM 3. LEGAL PROCEEDINGS.
None.
ITEM 4. MINE SAFETY DISCLOSURES.
Not applicable.

28
PART II
ITEM 5. MARKET FOR REGISTRANT�S COMMON EQUITY AND RELATED STOCKHOLDER MATTERS ANDISSUER PURCHASES OF EQUITY SECURITIES.
Market Information
Our common stock has been publicly traded on the NASDAQ Global Market under the symbol �MCFT� since July 17, 2015. Prior tothat time, there was no public market for our common stock. On September 10, 2020, the last reported sale price on the NASDAQGlobal Market of our common stock was $17.91 per share. As of September 4, 2020, we had approximately 6,700 holders of record ofour common stock.
Capital Allocation Policy
We presently intend to retain our earnings, if any, to finance the development and growth of our business and operations and do notanticipate declaring or paying cash dividends on our common stock, or repurchasing stock, in the foreseeable future. Any futuredetermination as to the declaration and payment of dividends, or the repurchase of stock, if any, will be at the discretion of our boardof directors and will depend on then-existing conditions, including our operating results, financial condition, contractual restrictions,capital requirements, business prospects, and other factors our board of directors may deem relevant. See Item 1A �Risk Factors� �Risks Relating to Ownership of Our Common Stock.
Stock Performance Graph
This performance graph shall not be deemed �soliciting material� or to be �filed� with the SEC for purposes of Section 18 of theExchange Act of 1934, or otherwise subject to the liabilities under that section, and shall not be deemed to be incorporated byreference into any filing of ours under the Securities Act or the Exchange Act.
The following stock performance graph illustrates the cumulative total shareholder return on our common stock for the period fromJuly 17, 2015 (the first day of trading for our common stock) to June 30, 2020, as compared to the Russell 2000 Index and the DowJones US Recreational Products Index.

29
The comparison assumes (i) a hypothetical investment of $100 in our common stock and the two above mentioned indices on July 17,2015 and (ii) the full reinvestment of all dividends. The comparisons in the graph are not intended to be indicative of possible futureperformance of our common stock.
$70
$120
$170
$220
$270
Jun-15 Jun-16 Jun-17 Jun-18 Jun-19 Jun-20
Comparison of Five-Year Month Cumulative TotalReturn*
Among MasterCraft, the Russell 2000 Index andthe Dow Jones US Recreational Products Index
MasterCraft Russell 2000 Dow Jones US Recreational Products
* $100 invested on 7/17/15 in stock or index, including reinvestment ofdividends.Fiscal year ending June 30, 2020.
Source: Russell Investment GroupSource: Dow Jones & Company
Securities Authorized for Issuance Under Equity Compensation Plans
For information regarding securities authorized for issuance under our equity compensation plans, see Note 10�Share-BasedCompensation in Item 8 and Item 12: Security Ownership of Certain Beneficial Owners and Management and Related StockholderMatters.
ITEM 6. SELECTED FINANCIAL DATA
The selected historical consolidated financial data and other data of MasterCraft Boat Holdings, Inc. set forth below should be readtogether with �Management�s Discussion and Analysis of Financial Condition and Results of Operations� and our consolidatedfinancial statements and related notes, each of which is included elsewhere in this Form 10-K. In particular, certain matters maysignificantly impact comparability between the years presented, including certain of those matters discussed in the footnotes to thetable below.

30
We derived the consolidated statement of operations for the fiscal years ended June 30, 2020, 2019 and 2018 and our consolidatedbalance sheet data as of June 30, 2020 and 2019 from our audited consolidated financial statements and related notes includedelsewhere in this Form 10-K. We derived the consolidated statement of operations for the fiscal years ended June 30, 2017 and June30, 2016 and our consolidated balance sheet data as of June 30, 2018, June 30, 2017 and June 30, 2016 from audited consolidatedfinancial statements, which are not included in this Form 10-K. Our historical results are not necessarily indicative of the results thatmay be expected in the future.
As of and for the Fiscal Years Ended June 30,(Dollars in thousands, except for per share amounts) 2020 2019 2018 2017 2016Consolidated statements of operations:
NET SALES..................................................................................... $ 363,073 $ 466,381 $ 332,725 $ 228,634 $ 221,600COST OF SALES ............................................................................ 287,717 353,254 242,361 165,158 160,521GROSS PROFIT.............................................................................. 75,356 113,127 90,364 63,476 61,079OPERATING EXPENSES:
Selling and marketing................................................................... 15,981 17,670 13,011 9,380 9,685General and administrative........................................................... 25,557 27,706 19,773 20,474 29,162Amortization of intangible assets ................................................. 3,948 3,492 1,597 107 221Goodwill and other intangible asset impairment (1) ................................... 56,437 31,000 � � �Total operating expenses .............................................................. 101,923 79,868 34,381 29,961 39,068
OPERATING INCOME (LOSS)..................................................... (26,567) 33,259 55,983 33,515 22,011OTHER EXPENSE:
Interest expense ............................................................................ 5,045 6,513 3,474 2,222 1,280Change in common stock warrant fair value ................................ � � � � 3,425Other income ................................................................................ � � � � (1,212)
INCOME (LOSS) BEFORE INCOME TAX EXPENSE ............... (31,612) 26,746 52,509 31,293 18,518INCOME TAX EXPENSE (BENEFIT) .......................................... (7,565) 5,392 12,856 11,723 8,308NET INCOME (LOSS).................................................................... $ (24,047) $ 21,354 $ 39,653 $ 19,570 $ 10,210
WEIGHTED AVERAGE SHARES USED FORCOMPUTATION OF:
Basic................................................................................................. 18,734,482 18,653,892 18,619,793 18,592,885 17,849,319Diluted.............................................................................................. 18,734,482 18,768,207 18,714,531 18,620,708 18,257,007
Net income (loss) per common share:Basic................................................................................................. $ (1.28) $ 1.14 $ 2.13 $ 1.05 $ 0.57Diluted.............................................................................................. (1.28) 1.14 2.12 1.05 0.56
Cash dividends declared per common share .................................. $ � $ � $ � $ � $ 4.30Consolidated balance sheet data:
Total assets....................................................................................... $ 207,923 $ 248,773 $ 176,924 $ 83,321 $ 82,533Total liabilities ................................................................................. 159,053 176,457 124,402 71,560 90,912Current portion of long-term debt.................................................... 8,932 8,725 5,069 3,687 7,885Long-term debt................................................................................. 99,666 105,016 70,087 30,790 44,342
Total debt...................................................................................... 108,598 113,741 75,156 34,477 52,227Total stockholders� equity (deficit) .................................................. 48,870 72,316 52,522 11,761 (8,379)
Additional financial and other data (unaudited):Unit sales volume:
MasterCraft................................................................................... 2,478 3,435 3,068 2,790 2,742NauticStar(2) .................................................................................. 1,191 1,831 1,687 � �Crest(2)........................................................................................... 1,623 2,078 � � �
Consolidated unit sales volume................................................. 5,292 7,344 4,755 2,790 2,742Net sales:
MasterCraft................................................................................... $ 246,455 $ 311,830 $ 266,319 $ 228,634 $ 221,600NauticStar(2) .................................................................................. 54,930 77,995 66,406 � �Crest(2)........................................................................................... 61,688 76,556 � � �
Consolidated net sales ............................................................... $ 363,073 $ 466,381 $ 332,725 $ 228,634 $ 221,600Net sales per unit:
MasterCraft................................................................................... $ 99 $ 91 $ 87 $ 82 $ 81NauticStar(2) .................................................................................. 46 43 39 � �Crest(2)........................................................................................... 38 37 � � �
Consolidated net sales per unit.................................................. 69 64 70 82 81Gross margin.................................................................................... 20.8% 24.3% 27.2% 27.8% 27.6%Adjusted EBITDA(3)......................................................................... $ 44,298 $ 79,323 $ 64,028 $ 43,476 $ 41,227Adjusted Net Income(3) .................................................................... $ 25,077 $ 53,016 $ 40,440 $ 24,335 $ 23,362Adjusted EBITDA margin(3) ............................................................ 12.2% 17.0% 19.2% 19.0% 18.6%
(1) During fiscal 2020, we recognized goodwill and other intangible asset impairment charges in our NauticStar and Crest segments. During fiscal 2019, werecognized goodwill and other intangible asset impairment charges in our NauticStar segment. See Note 6 in Notes to Consolidated Financial Statements.
(2) During fiscal 2019 and 2018, the Company acquired Crest and NauticStar, respectively, as described in Note 3 in Notes to Consolidated Financial Statements.(3) Adjusted EBITDA, Adjusted Net Income and Adjusted EBITDA margin are non-GAAP financial measures. For definitions of our non-GAAP measures and a
reconciliation of each to net income, see Item 7 Management�s Discussion and Analysis of Financial Condition and Results of Operations.

31
ITEM 7. MANAGEMENT'S DISCUSSION AND ANALYSIS OF FINANCIAL CONDITION AND RESULTS OFOPERATIONS.
The following discussion and analysis should be read together with the sections entitled �Risk Factors,� �Selected Financial Data,�and the financial statements and the accompanying notes included elsewhere in this Form 10-K. In addition, the statements in thisdiscussion and analysis regarding industry outlook, our expectations regarding the performance of our business, anticipated financialresults, liquidity and the other non-historical statements are forward-looking statements. These forward-looking statements aresubject to numerous risks and uncertainties, including, but not limited to, the risks and uncertainties described in �Cautionary NoteRegarding Forward-Looking Statements� and in �Risk Factors� above. Our actual results may differ materially from those containedin or implied by any forward-looking statements.
This section generally discusses 2020 and 2019 items and year-to-year comparisons between 2020 and 2019. Discussions of 2018items and year-to-year comparisons between 2019 and 2018 are not included in this Annual Report on Form 10-K and can be foundin Item 7 of the Company�s Annual Report on Form 10-K for the year ended June 30, 2019, which was filed with the SEC onSeptember 13, 2019.
Key Performance Measures
From time to time we use certain key performance measures in evaluating our business and results of operations and we may refer toone or more of these key performance measures in this �Management�s Discussion and Analysis of Financial Condition and Results ofOperations.� These key performance measures include:
• Unit sales volume�We define unit sales volume as the number of our boats sold to our dealers during a period.
• Net sales per unit�We define net sales per unit as net sales divided by unit sales volume.
• Gross margin�We define gross margin as gross profit divided by net sales, expressed as a percentage.
• Adjusted EBITDA� We define Adjusted EBITDA as earnings before interest expense, income taxes, depreciation, andamortization (�EBITDA�), as further adjusted to eliminate certain non-cash charges and unusual items that we do notconsider to be indicative of our core/ongoing operations. For a reconciliation of Adjusted EBITDA to net income, see �Non-GAAP Measures� below.
• Adjusted EBITDA margin� We define Adjusted EBITDA margin as Adjusted EBITDA divided by net sales, expressed as apercentage.
• Adjusted Net Income� We define Adjusted Net Income as net income adjusted to eliminate certain non-cash charges andother items that we do not consider to be indicative of our core/ongoing operations and adjusted for the impact to income taxexpense (benefit) related to non-GAAP adjustments. For a reconciliation of Adjusted Net Income, see �Non-GAAPMeasures� below.
COVID-19 Pandemic
The outbreak of a novel coronavirus throughout the world, including the United States, during early calendar year 2020 causedwidespread business and economic disruption through mandated and voluntary business closings and restrictions on the movementand activities of people (�COVID-19 Pandemic�). We are subject to risks and uncertainties as a result of the COVID-19 Pandemic.The extent of the impact of the COVID-19 Pandemic on our business is highly uncertain and difficult to predict, as the response to theCOVID-19 Pandemic is still evolving in many countries, including the United States and other markets where we operate. Capitalmarkets and economies worldwide have been negatively impacted by the COVID-19 Pandemic, and it has caused economicdownturns or recessions in the United States and other markets where we operate. Policymakers around the world continue to respondwith fiscal and monetary policy actions to support the economy. The magnitude and overall effectiveness of these actions remainsuncertain.
Impact to Operations
To balance wholesale production with the then anticipated impacts to retail demand caused by the economic impacts of the COVID-19Pandemic, we reduced production in February 2020 and, in late March 2020, temporarily suspended manufacturing operations at all ofour facilities to protect the health of our employees and comply with governmental mandates. As a result of these actions, wetemporarily laid off nearly all our hourly workforce. We paid lump sum severance payments to certain of our laid off employees andprovided for the temporary continuation of their healthcare benefits, resulting in charges totaling approximately $1.4 million during

32
the fiscal third and fourth quarters (the �COVID-19 Shutdown Costs�). We also initiated cash management strategies to conserveliquidity during the shutdown period. We resumed operations at reduced production levels at our manufacturing facilities by mid-May2020 and we are continuing to ramp up production. Our facilities resumed operations with new temperature screening, socialdistancing, personal protective equipment, and cleaning protocols to protect our employees and mitigate risk of further businessinterruption. We continue to evaluate and monitor the health and safety of our employees and will adhere to federal and localgovernment mandates and guidelines. The disruptions caused by the COVID-19 Pandemic, including the temporary manufacturingsuspension and supplier and workforce constraints, resulted in a decline in wholesale unit sales volume of nearly 50% during theFebruary 2020 to June 2020 period as compared to the same prior-year period.
An impairment of our goodwill and other intangible assets was triggered as of March 29, 2020, due to the economic outlook at thattime, the significant declines in our share price, market volatility and the disruption in our operations. As a result of the analysis, werecorded impairment charges totaling $56.4 million related to the NauticStar and Crest segments (the �Impairment Charges�). TheImpairment Charges were principally a result of a decline, in the fiscal third quarter, in market conditions, including our share price,and the outlook for retail and wholesale sales and operating performance, as of March 29, 2020, relative to our acquisition plans andannual impairment test performed as of June 30, 2019. See Note 6 in Notes to Consolidated Financial Statements for more informationregarding the Impairment Charges.
As governmental restrictions were lifted, demand in the U.S. retail marine market accelerated in May and through June 2020 resultingin strong retail demand for our boats which we are seeing continue through the key summer selling season. This increase in demand,coupled with our production shutdowns, pushed retail inventory levels for all our brands to record lows as of June 30, 2020. We endedfiscal 2020 with retail inventory levels for our brands between 40 percent to 50 percent lower than at the end of fiscal 2019.
Impact to Liquidity and Capital Resources
On March 19, 2020, we drew $35.0 million on our revolving credit agreement as a precautionary measure in order to increase our cashposition and preserve financial flexibility in light of uncertainty in the global markets resulting from the COVID-19 Pandemic.Additionally, on May 7, 2020, we entered into Amendment No. 3 (the �Amendment�) to the Fourth Amended & Restated Credit andGuarantee Agreement (the �Credit Facility�) to strengthen our financial flexibility. Among other things, the changes effected by theAmendment provide temporary relief under our financial covenants. See Note 8 in Notes to Consolidated Financial Statements formore information regarding these changes. The performance of the business and our cash management activities provided theflexibility to repay $25.0 million of the revolving credit facility as of June 30, 2020 and we ended fiscal 2020 with what we believe tobe a strong liquidity position. As of June 30, 2020, we were in compliance with our financial covenants under the Amendment to theCredit Facility.
Outlook
We believe strong marine retail demand, coupled with record low retail inventory levels for all our brands have created a growthopportunity for fiscal 2021 and potentially into future years. We are continuing to ramp up production at our facilities and we expectthis ramp up phase to continue through fiscal 2021 in order to meet strong wholesale demand as our dealers seek to satisfy currentretail order flow and replenish their stock inventory. As we navigate the unprecedented confluence of demand and disruptionprecipitated by the COVID-19 Pandemic, our production during this ramp up period will depend, in large part, on our suppliers�capacity and our ability to grow and maintain a high-performing workforce.
Although the consumer responses to the COVID-19 Pandemic have thus far resulted in strong demand for our products, significantuncertainty exists in the economy as a result of the unpredictable outlook for the COVID-19 Pandemic. The ultimate severity of theimpact of the COVID-19 Pandemic on our business will depend on a number of factors, including, but not limited to, the duration,spread, severity, and impact of the pandemic, the remedial action and stimulus measures adopted by local and federal governments,the effects of the pandemic on our consumers, dealers, suppliers and workforce, and to the extent normal economic and operatingconditions can resume and be sustained within the general economy, all of which are uncertain and cannot be predicted. Our futureresults of operations, cash flows, and liquidity could be adversely impacted by delays in payments of outstanding receivable amountsbeyond normal payment terms, supply chain or workforce disruptions and uncertain demand, additional manufacturing suspensions,additional other intangible asset impairment charges, and the impact of any initiatives that we may undertake to address financial andoperational challenges faced by us and our consumers, dealers, and suppliers. Please see Item 1A, �Risk Factors � Risks Related toOur Business � The COVID-19 Pandemic has had, and may continue to have, certain negative impacts on our business and those ofour consumers, dealers and suppliers, and such impacts may have a material adverse effect on our operations and business� and ��General economic conditions, particularly in the U.S., affect our industry, demand for our products and our business, and results ofoperations.�
33
Overview of Results of Operations
Net sales were $363.1 million for fiscal 2020, a decrease of 22.2 percent from fiscal 2019, due to lower wholesale unit volumes as aresult of the disruptions caused by the COVID-19 Pandemic, including our temporary manufacturing suspension, our pre- COVID-19Pandemic effort to allow our dealers to right-size pipeline inventory levels, and pre- COVID-19 Pandemic softness in the overallsaltwater fishing category. This decline was partially offset by the inclusion of Crest, which was acquired during the second quarter of2019, higher average wholesale prices for all our reportable segments, fiscal 2020 Aviara sales included in our MasterCraft segment,and lower dealer incentives.
Gross profit for fiscal 2020 decreased 33.4 percent from fiscal 2019, primarily due to lower wholesale unit sales volume for eachreportable segment, higher depreciation expense, and $1.4 million in COVID-19 Shutdown Costs. This decline was partially offset byprice increases for each reportable segment, the inclusion of Crest�s first quarter 2020 results, and lower dealer incentives. Grossmargin decreased by 3.5 percentage points to 20.8 percent for fiscal 2020 from 24.3 percent for fiscal 2019, primarily due to loweroverhead absorption driven by lower wholesale unit sales volume for each reportable segment, and $1.4 million of COVID-19Shutdown Costs.
Net loss was $24.0 million for fiscal 2020, compared to Net income of $21.4 million for fiscal 2019. Diluted net loss per share was$1.28, compared to Diluted net income per share of $1.14 for fiscal 2019. Net loss for fiscal 2020 included Goodwill and otherintangible asset impairment charges of $56.4 million, or $(3.01) per diluted share. Net income for fiscal 2019 included Goodwill andother intangible asset impairment charges of $31.0 million, or $(1.65) per diluted share.
CEO Transition
On October 30, 2019, our Board of Directors appointed Frederick A. Brightbill, Chairman of the Board of Directors, interim ChiefExecutive Officer. On December 2, 2019, Mr. Brightbill was named permanent Chief Executive Officer. Mr. Brightbill replaced TerryMcNew, who resigned on October 30, 2019.
Aviara Brand Launch
We began selling boats under the Aviara brand during the first quarter of fiscal 2020. Aviara boats are designed, engineered, andmanufactured to meet the exacting specifications of consumers seeking the ultimate luxury recreational day boat experience. Thebrand�s first model, the AV32, began selling during the first quarter of fiscal 2020 and the AV36 began selling during the secondquarter of fiscal 2020. In February 2020, we launched the third Aviara model, the AV40, which we expect to begin selling in the firsthalf of fiscal 2021. Aviara is built in our MasterCraft facility and is part of the MasterCraft reportable segment.

34
Results of Operations
The consolidated statements of operations presented below should be read together with �Selected Consolidated Financial Data,� andour consolidated financial statements and related notes included elsewhere in this Form 10-K.
We derived the consolidated statements of operations for the fiscal years ended June 30, 2020 and 2019 from our audited consolidatedfinancial statements and related notes included elsewhere in this Form 10-K. Our historical results are not necessarily indicative of theresults that may be expected in the future.
2020 vs. 20192020 2019 Change % Change
(Dollars in thousands)Consolidated statements of operations:
NET SALES.................................................................................................... $ 363,073 $ 466,381 $ (103,308 ) (22.2%)COST OF SALES ........................................................................................... 287,717 353,254 (65,537..) (18.6%)GROSS PROFIT............................................................................................. 75,356 113,127 (37,771..) (33.4%)OPERATING EXPENSES:
Selling and marketing.................................................................................. 15,981 17,670 (1,689.... ) (9.6%)General and administrative.......................................................................... 25,557 27,706 (2,149.... ) (7.8%)Amortization of other intangible assets ....................................................... 3,948 3,492 456 ........ 13.1%Goodwill and other intangible asset impairment......................................... 56,437 31,000 25,437 ... 82.1%Total operating expenses ............................................................................. 101,923 79,868 22,055 ... 27.6%
OPERATING INCOME (LOSS).................................................................... (26,567) 33,259 (59,826) (179.9%)OTHER EXPENSE:
Interest expense ........................................................................................... 5,045 6,513 (1,468) (22.5%)INCOME (LOSS) BEFORE INCOME TAX EXPENSE .............................. (31,612) 26,746 (58,358) (218.2%)INCOME TAX EXPENSE (BENEFIT) ......................................................... (7,565) 5,392 (12,957) (240.3%)NET INCOME (LOSS)................................................................................... $ (24,047) $ 21,354 $ (45,401) (212.6%)
Additional financial and other data:Unit sales volume:
MasterCraft.................................................................................................. 2,478 3,435 (957) (27.9%)NauticStar .................................................................................................... 1,191 1,831 (640) (35.0%)Crest(a) .......................................................................................................... 1,623 2,078 (455) (21.9%)
Consolidated unit sales volume................................................................ 5,292 7,344 (2,052) (27.9%)Net sales:
MasterCraft.................................................................................................. $ 246,455 $ 311,830 $ (65,375) (21.0%)NauticStar .................................................................................................... 54,930 77,995 (23,065) (29.6%)Crest(a) .......................................................................................................... 61,688 76,556 (14,868) (19.4%)
Consolidated net sales .............................................................................. $ 363,073 $ 466,381 $ (103,308) (22.2%)Net sales per unit:
MasterCraft.................................................................................................. $ 99 $ 91 $ 8 8.8%NauticStar .................................................................................................... 46 43 3 7.0%Crest(a) .......................................................................................................... 38 37 1 2.7%
Consolidated net sales per unit................................................................. 69 64 5 7.8%Gross margin ................................................................................................... 20.8% 24.3% -350 bpts
(a) Crest was acquired on October 1, 2018.
Fiscal 2020 Compared to Fiscal 2019
Net Sales. Net Sales for fiscal 2020 were $363.1 million, a decrease of $103.3 million, or 22.2 percent, compared to $466.4 millionfor fiscal 2019. The decrease was primarily due to:
• A $65.4 million decrease for the MasterCraft segment, primarily due to lower wholesale unit volumes for the MasterCraftbrand as a result of our temporary manufacturing suspension and our pre- COVID-19 Pandemic effort to reduce dealerinventory levels, partially offset by a richer mix of higher-priced and higher-contented models and lower dealer incentives.The lower dealer incentives were primarily related to discounts for our Canadian dealers as the Canadian retaliatory importtariffs on boats, first imposed in July 2018, were rescinded in May 2019 and lower rebates and discounts in the fiscal fourthquarter driven by strong retail demand. Within the MasterCraft segment, the decrease for the MasterCraft brand was alsopartially offset by Aviara sales in fiscal 2020;
• a $23.1 million decrease for the NauticStar segment primarily as a result of our temporary manufacturing suspension, ourpre- COVID-19 Pandemic effort to allow our dealers to right-size pipeline inventory levels, and softness in the overallsaltwater category during the first half of fiscal 2020, partially offset by higher prices;
35
• a net $14.9 million decrease as the Crest acquisition in the second quarter of fiscal 2019 added net sales of $18.9 million forthe first quarter of fiscal 2020 which was offset by a total $33.7 million period-over-period decrease attributable to theremaining quarters in fiscal 2020 primarily as a result of our temporary manufacturing suspension and our pre- COVID-19Pandemic effort to allow our dealers to right-size pipeline inventory levels, and higher pre-pandemic retail rebate discounts,partially offset by higher prices;
Gross Profit and Gross Margin. Gross profit decreased $37.8 million, or 33.4 percent, to $75.4 million compared to $113.1 millionfor the prior year. The decrease was primarily due to lower wholesale unit sales volume for each reportable segment, higherdepreciation expense, and $1.4 million in COVID-19 Shutdown Costs. The higher depreciation expense was largely a result ofinvestment in tooling for Aviara and NauticStar to support recent product launches and lineup expansion. These decreases werepartially offset by price increases for each reportable segment, $2.6 million of gross profit attributable to Crest�s first quarter of fiscal2020 results, and lower dealer incentives.
Gross margin decreased primarily due to lower overhead absorption driven by lower wholesale unit sales volume for each reportablesegment, higher warranty costs as a percentage of sales, and $1.4 million of COVID-19 Shutdown Costs.
Operating Expenses. Operating expenses increased $22.1 million, or 27.6 percent, to $101.9 million for fiscal 2020 compared to $79.9million for fiscal 2019. The increase was primarily driven by additional goodwill and other intangible asset impairment chargesrelated to our NauticStar and Crest segments recorded in fiscal 2020 as compared to fiscal 2019. See Note 6 in Notes to ConsolidatedFinancial Statements for more information on the impairment charges. In addition, the inclusion of Crest�s results for the first quarterof fiscal 2020 added $2.2 million of operating expenses, as Crest was acquired in the second quarter of fiscal 2019. This increase waspartially offset by a $3.9 million decrease at our MasterCraft segment mainly due to lower acquisition-related costs, reduced Sellingand marketing and General and administrative expense resulting from cost management initiatives, lower share-based compensationexpense as a result of our CEO transition and lowered performance estimates related to our incentive-based compensation plan.
Interest Expense. Interest expense decreased $1.5 million, or 22.5 percent, primarily driven by lower effective interest rates duringthe year compared to fiscal 2019.
Income Tax Expense (Benefit). Our consolidated effective income tax rate increased to 23.9 percent for fiscal 2020 from 20.2percent for fiscal 2019, primarily due to favorable adjustments occurring in fiscal 2019, such as permanent benefits and changes invaluation allowances, which reduced the effective tax rate for fiscal 2019.

36
Non-GAAP Measures
EBITDA, Adjusted EBITDA, and Adjusted EBITDA Margin
We define EBITDA as earnings before interest expense, income taxes, depreciation and amortization. We define Adjusted EBITDA asEBITDA further adjusted to eliminate certain non-cash charges or other items that we do not consider to be indicative of our coreand/or ongoing operations. For the periods presented herein, these adjustments include Goodwill and other intangible asset impairmentcharges, Aviara (new brand) startup costs, COVID-19 Shutdown Costs, transaction expenses associated with acquisitions and certainnon-cash items including share-based compensation, an out-of-period adjustment to correct an immaterial error related to our warrantyreserve, and acquisition-related inventory step-up adjustments. We define Adjusted EBITDA margin as Adjusted EBITDA expressedas a percentage of Net sales.
Adjusted Net Income and Adjusted Net Income Per Share
We define Adjusted Net Income and Adjusted Net Income per share as net income adjusted to eliminate certain non-cash charges orother items that we do not consider to be indicative of our core and/or ongoing operations and adjusted for the impact to income taxexpense (benefit) related to non-GAAP adjustments. For the periods presented herein, these adjustments include Goodwill and otherintangible asset impairment charges, Aviara (new brand) startup costs, COVID-19 Shutdown Costs, transaction expenses associatedwith acquisitions, and certain non-cash items including other intangible asset amortization, share-based compensation, out-of-periodadjustment to correct an immaterial error related to our warranty reserve, and acquisition-related inventory step-up adjustments.
EBITDA, Adjusted EBITDA, Adjusted EBITDA margin, Adjusted Net Income, and Adjusted Net Income per share, which we referto collectively as the Non-GAAP Measures, are not measures of net income or operating income as determined under accountingprinciples generally accepted in the United States, or U.S. GAAP. The Non-GAAP Measures are not measures of performance inaccordance with U.S. GAAP and should not be considered as an alternative to net income, net income per share, or operating cashflows determined in accordance with U.S. GAAP. Additionally, Adjusted EBITDA is not intended to be a measure of cash flow. Webelieve that the inclusion of the Non-GAAP Measures is appropriate to provide additional information to investors because securitiesanalysts and investors use the Non-GAAP Measures to assess our operating performance across periods on a consistent basis and toevaluate the relative risk of an investment in our securities. We use Adjusted Net Income and Adjusted Net Income per share tofacilitate a comparison of our operating performance on a consistent basis from period to period that, when viewed in combinationwith our results prepared in accordance with U.S. GAAP, provides a more complete understanding of factors and trends affecting ourbusiness than does U.S. GAAP measures alone. We believe Adjusted Net Income and Adjusted Net Income per share assists ourboard of directors, management, investors, and other users of the financial statements in comparing our net income on a consistentbasis from period to period because it removes certain non-cash items and other items that we do not consider to be indicative of ourcore and/or ongoing operations and adjusts for the impact to income tax expense (benefit) related to non-GAAP adjustments. TheNon-GAAP Measures have limitations as an analytical tool and should not be considered in isolation or as a substitute for analysis ofour results as reported under U.S. GAAP. Some of these limitations are:
• Although depreciation and amortization are non-cash charges, the assets being depreciated and amortized will often haveto be replaced in the future and Adjusted EBITDA does not reflect any cash requirements for such replacements;
• Adjusted EBITDA does not reflect our cash expenditures, or future requirements for capital expenditures or contractualcommitments;
• Adjusted EBITDA does not reflect changes in, or cash requirements for, our working capital needs;
• Adjusted EBITDA does not reflect our tax expense or any cash requirements to pay income taxes;
• Adjusted EBITDA does not reflect interest expense, or the cash requirements necessary to service interest payments onour indebtedness; and
• Adjusted Net Income, Adjusted Net Income per share, and Adjusted EBITDA do not reflect the impact of earnings orcharges resulting from matters we do not consider to be indicative of our core and/or ongoing operations, but maynonetheless have a material impact on our results of operations.
In addition, because not all companies use identical calculations, our presentation of the Non-GAAP Measures may not be comparableto similarly titled measures of other companies, including companies in our industry.

37
The following table presents a reconciliation of net income (loss) as determined in accordance with U.S. GAAP to EBITDA, AdjustedEBITDA and Adjusted EBITDA margin for the periods indicated:
(Dollars in thousands) 2020 2019 2018Net income (loss) ..................................................................................... $ (24,047) $ 21,354 $ 39,653Income tax expense (benefit).................................................................... (7,565) 5,392 12,856Interest expense ........................................................................................ 5,045 6,513 3,474Depreciation and amortization.................................................................. 10,527 7,787 5,086EBITDA ................................................................................................... (16,040) 41,046 61,069Goodwill and other intangible asset impairment(a) ................................... 56,437 31,000 �Aviara start-up costs(b) .............................................................................. 1,446 2,840 561COVID-19 Shutdown Costs(c) .................................................................. 1,394 � �Share-based compensation........................................................................ 1,061 1,678 1,186Warranty adjustment(d).............................................................................. � � (1,033)Transaction expense(e)............................................................................... � 2,377 1,744Inventory step-up adjustment - acquisition related(f) ................................ � 382 501Adjusted EBITDA .................................................................................. $ 44,298 $ 79,323 $ 64,028Adjusted EBITDA margin ..................................................................... 12.2% 17.0% 19.2%
(a) Represents non-cash charges recorded in the NauticStar and Crest segments for impairment of goodwill and trade name intangible assets. See Note 6 in Notes toConsolidated Financial Statements for more information on the impairment charges.
(b) Represents start-up costs associated with Aviara, a completely new boat brand in an industry category previously not served by the Company. We began sellingthe brand�s first two models, the AV32 and the AV36, during the first and second quarters of fiscal 2020, respectively. We expect to begin selling one additionalmodel, the AV40, in the first half of fiscal 2021. Start-up costs presented for fiscal 2020 are related to the AV36 and AV40 models. Start-up costs presented forfiscal 2019 are related to the launch of the Aviara brand and the three initial Aviara models which had not yet begun selling.
(c) Represents lump sum severance payments and costs related to temporary continuation of healthcare benefits for certain laid off employees, in connection with theCOVID-19 Pandemic.
(d) Represents an out-of-period adjustment to correct an immaterial error related to our warranty accrual calculation identified during the fiscal year ended June 30,2018.
(e) Represents acquisition related costs and other integration costs associated with our acquisitions of Crest and NauticStar in fiscal 2019 and 2018, respectively.(f) Represents post-acquisition adjustment to cost of goods sold for the fair value step up of inventory acquired all of which was sold during respective fiscal years.

38
The following table sets forth a reconciliation of net income as determined in accordance with U.S. GAAP to Adjusted Net Income forthe periods indicated:
(Dollars in thousands) 2020 2019 2018Net income (loss).............................................................................. $ (24,047) $ 21,354 $ 39,653Income tax expense (benefit) ............................................................ (7,565) 5,392 12,856Goodwill and other intangible asset impairment(a) ........................... 56,437 31,000 �Amortization of acquisition intangibles ............................................ 3,842 3,385 1,490Aviara start-up costs(b)....................................................................... 1,446 2,840 561COVID-19 Shutdown Costs(c)........................................................... 1,394 � �Share-based compensation ................................................................ 1,061 1,678 1,186Warranty adjustment(d) ...................................................................... � � (1,033)Transaction expense(e) ....................................................................... � 2,377 1,744Inventory step-up adjustment - acquisition related(f) ........................ � 382 501Adjusted Net Income before income taxes.................................... 32,568 68,408 56,958Adjusted income tax expense(g)......................................................... 7,491 15,392 16,518Adjusted Net Income ...................................................................... $ 25,077 $ 53,016 $ 40,440
Adjusted Net Income per share:Basic ............................................................................................... $ 1.34 $ 2.84 $ 2.17Diluted ............................................................................................ $ 1.34 $ 2.82 $ 2.16
Weighted average shares used for the computation of:Basic Adjusted Net Income per share ............................................ 18,734,482 18,653,892 18,619,793Diluted Adjusted Net Income per share(h) ...................................... 18,734,482 18,768,207 18,714,531
(a) Represents non-cash charges recorded in the NauticStar and Crest segments for impairment of goodwill and trade name intangible assets. See Note 6 in Notes toConsolidated Financial Statements for more information on the impairment charges.
(b) Represents start-up costs associated with Aviara, a completely new boat brand in an industry category previously not served by the Company. We began sellingthe brand�s first two models, the AV32 and the AV36, during the first and second quarters of fiscal 2020, respectively. We expect to begin selling one additionalmodel, the AV40, in the first half of fiscal 2021. Start-up costs presented for fiscal 2020 are related to the AV36 and AV40 models. Start-up costs presented forfiscal 2019 are related to the launch of the Aviara brand and the three initial Aviara models which had not yet begun selling.
(c) Represents lump sum severance payments and costs related to temporary continuation of healthcare benefits for certain laid off employees, in connection with theCOVID-19 Pandemic.
(d) Represents an out-of-period adjustment to correct an immaterial error related to our warranty accrual calculation identified during the fiscal year ended June 30,2018.
(e) Represents acquisition related costs and other integration costs associated with our acquisitions of Crest and NauticStar in fiscal 2019 and 2018, respectively.(f) Represents post-acquisition adjustment to cost of goods sold for the fair value step up of inventory acquired all of which was sold during respective fiscal years.(g) Reflects income tax expense at a tax rate of 23.0% for fiscal 2020, 22.5% for fiscal 2019 and 29% for 2018.(h) Represents the Weighted Average Shares Used for the Computation of Basic and Diluted earnings (loss) per share as presented on the Consolidated Statements of
Operations to calculate Adjusted Net Income per diluted share for all periods presented herein.

39
The following table presents the reconciliation of net income (loss) per diluted share to Adjusted net income per diluted share for theperiods presented:
2020 2019 2018Net income (loss) per diluted share ..................................................... $ (1.28) $ 1.14 $ 2.12Impact of adjustments:
Income tax expense (benefit) ............................................................... (0.40) 0.29 0.69Goodwill and other intangible asset impairment(a) .............................. 3.01 1.65 �Amortization of acquisition intangibles............................................... 0.20 0.18 0.08Aviara start-up costs(b) ......................................................................... 0.08 0.15 0.03COVID-19 Shutdown Costs(c).............................................................. 0.07 � �Share-based compensation................................................................... 0.06 0.09 0.06Warranty adjustment(d) ......................................................................... � � (0.06)Transaction expense(e) .......................................................................... � 0.12 0.09Inventory step-up adjustment - acquisition related(f) ........................... � 0.02 0.03
Adjusted Net Income per diluted share before income taxes ........... 1.74 3.64 3.04Impact of adjusted income tax expense on net income per dilutedshare before income taxes(g) ................................................................. (0.40) (0.82) (0.88)
Adjusted Net Income per diluted share .............................................. $ 1.34 $ 2.82 $ 2.16
(a) Represents non-cash charges recorded in the NauticStar and Crest segments for impairment of goodwill and trade name intangible assets. See Note 6 in Notes toConsolidated Financial Statements for more information on the impairment charges.
(b) Represents start-up costs associated with Aviara, a completely new boat brand in an industry category previously not served by the Company. We began sellingthe brand�s first two models, the AV32 and the AV36, during the first and second quarters of fiscal 2020, respectively. We expect to begin selling one additionalmodel, the AV40, in the first half of fiscal 2021. Start-up costs presented for fiscal 2020 are related to the AV36 and AV40 models. Start-up costs presented forfiscal 2019 are related to the launch of the Aviara brand and the three initial Aviara models which had not yet begun selling.
(c) Represents lump sum severance payments and costs related to temporary continuation of healthcare benefits for certain laid off employees, in connection with theCOVID-19 Pandemic.
(d) Represents an out-of-period adjustment to correct an immaterial error related to our warranty accrual calculation identified during the fiscal year ended June 30,2018.
(e) Represents acquisition related costs and other integration costs associated with our acquisitions of Crest and NauticStar in fiscal 2019 and 2018, respectively.(f) Represents post-acquisition adjustment to cost of goods sold for the fair value step up of inventory acquired all of which was sold during respective fiscal years.(g) Reflects income tax expense at a tax rate of 23.0% for fiscal 2020, 22.5% for fiscal 2019 and 29% for 2018.(h) Reflects the impact of rounding in the other adjustments presented.
Change in Non-GAAP Financial Measure
Prior to fiscal year 2020, the Company�s calculation of a diluted per share amount of Adjusted Net Income included an adjustment tofully dilute this non-GAAP measure for all outstanding share-based compensation grants. This additional dilution was incorporated byadjusting the GAAP measure, Weighted Average Shares Used for the Computation of Basic earnings (loss) per share, as presented onthe Consolidated Statements of Operations, to include a dilutive effect for all outstanding RSAs, PSUs, and stock options. Beginningwith the fiscal year 2020 presentation in this Annual Report on Form 10-K for all periods presented, the Company will no longerinclude this additional dilution impact in its calculation of Adjusted Net Income per diluted share. The Company has instead utilizedthe Weighted Average Shares Used for the Computation of Basic and Diluted earnings (loss) per share as presented on theConsolidated Statements of Operations to calculate Adjusted Net Income per diluted share for all periods presented herein.
The Company believes that, because its outstanding share-based compensation grants no longer result in a material amount of dilutionof its earnings as was the case nearer to the date of our IPO, the adjustment methodology previously used no longer providesmeaningful information to management or other users of its financial statements. This change resulted in an increase of $0.02 in theyear ended June 30, 2020 in the amount of Adjusted Net Income per diluted share from what would have been reported using theprevious methodology. The change also resulted in an increase of $0.01 in each of the years ended June 30, 2019 and 2018 in theamount of Adjusted Net Income per diluted share from what was previously reported. In addition, the fiscal 2019 amount forTransaction expense, in the reconciliation of net income (loss) per diluted share to Adjusted net income per diluted share, decreased by$0.01 from what was previously reported as a result of a change in the presentation of the impact of rounding.
40
Liquidity and Capital Resources
Our primary liquidity and capital resource needs are to finance working capital, fund capital expenditures, and service our debt. Ourprincipal sources of liquidity are our cash balance, cash generated from operating activities, our revolving credit agreement and therefinancing and/or new issuance of long-term debt. On March 19, 2020, we drew $35.0 million on our revolving credit agreement as aprecautionary measure in order to increase our cash position and preserve financial flexibility in light of uncertainty in the globalmarkets resulting from the COVID-19 Pandemic. The performance of the business and our cash management activities provided theflexibility to repay $25.0 million of the revolving credit facility on June 30, 2020. As of June 30, 2020, we had a cash balance of $16.3million in addition to $25.0 million of available borrowing capacity under the revolving credit facility.
Additionally, on May 7, 2020, we entered into Amendment No. 3 to the Fourth Amended & Restated Credit and Guarantee Agreement(the �Amendment�) to strengthen our financial flexibility. Among other things, the changes effected by the Amendment providetemporary relief under our financial covenants. See Note 8 in Notes to Consolidated Financial Statements for more informationregarding these changes.
On August 13, 2020, the Company entered into an agreement to purchase certain real and personal property located in Merritt Island,Florida, for $14.0 million (the �Purchase Agreement�). The Purchase Agreement is subject to customary closing conditions andclosing is expected to occur in October 2020. The Company expects to use liquidity sources existing as of June 30, 2020 to fund thispurchase. See Note 7 in Notes to Consolidated Financial Statements for more information regarding the Purchase Agreement.
We believe our cash balance, cash from operations, and our ability to borrow, will be sufficient to provide for our liquidity and capitalresource needs. However, we are continuing to monitor the COVID-19 Pandemic and its impact on our business, dealers, consumersand industry as a whole. Please see Item 1A, �Risk Factors � Risks Related to Our Business � The COVID-19 Pandemic has had, andmay continue to have, certain negative impacts on our business and those of our consumers, dealers and suppliers, and such impactsmay have a material adverse effect on our operations and business.� The following table summarizes the cash flows from operating,investing, and financing activities:
(Dollars in thousands) 2020 2019 2018Total cash provided by (used in):
Operating activities ..................................................................................... $ 30,198 $ 55,886 $ 49,397Investing activities ...................................................................................... (14,218) (95,786) (85,720)Financing activities ..................................................................................... (5,487) 37,817 40,194
Net change in cash........................................................................................ $ 10,493 $ (2,083) $ 3,871
Cash Flow
Our net cash provided by operating activities decreased by $25.7 million, or 46.0%, to $30.2 million for fiscal 2020 from$55.9 million in fiscal 2019. This decrease was primarily due to a decrease in operating income, net of non-cash expense items, andunfavorable working capital usage. Working capital is defined as Accounts receivable, Income tax receivable, Inventories, and Prepaidexpenses and other current assets net of Accounts payable, Income tax payable, and Accrued expenses and other current liabilities aspresented in the consolidated balance sheets, excluding the impact of acquisitions and non-cash adjustments. Cash flows from workingcapital changes decreased primarily due to:
• a $12.1 million decrease related to Accrued expenses and other current liabilities as a result of changes in the timing of dealerincentive payments, higher retail sales in June 2020 as compared to June 2019 which lowered certain accrued dealerincentives, and lower accrued payroll as a result of lower incentive compensation accruals;
• a $3.0 million decrease related to Income tax receivable is primarily due to the decreased taxable income between thecomparable periods;
• a $3.9 million decrease attributable to Accounts payable as a result of lower production levels in June 2020 as compared toJune 2019 and the timing of vendor payments;
• partially offset by a $8.1 million increase related to Accounts receivable primarily due to lower sales volumes in June 2020 ascompared to June 2019 and an improved collection cycle for Crest; and
• a $5.2 million increase attributable to Inventories as high wholesale demand resulted in low finished goods levels, whilelower production rates in June 2020 as compared to June 2019 resulted in lower raw materials and work-in-processinventories.

41
Net cash used in investing activities decreased primarily due to the $81.7 million Crest acquisition being included in our 2019 cashflows. Capital outlays of $14.2 million during the year ended June 30, 2020 included the purchase of the Crest manufacturing facility,expansion activities, molds, and equipment. See Note 11 in Notes to Consolidated Financial Statements for additional informationregarding the Crest facility purchase.
Net financing cash flow decreased primarily as the result of lower proceeds from the issuance of long-term debt. The Crestacquisition, completed during the second quarter of 2019, was funded using $80.0 million of proceeds from the issuance of long-termdebt. On March 20, 2020, we borrowed all available funds under our Revolving Credit Facility, $35.0 million, as a precautionarymeasure in response to the COVID-19 Pandemic and we had repaid $25.0 million as of June 30, 2020. During the year ended June 30,2020, we also made $15.4 million of principal payments on our term loans, including $6.0 million of voluntary prepayments. See Note8 in Notes to Consolidated Financial Statements for more information regarding our debt and liquidity.
Off-Balance Sheet Arrangements
The Company did not have any off-balance sheet financing arrangements as of June 30, 2020.
Contractual Obligations
As of June 30, 2020, the Company�s contractual cash obligations were as follows:
Payments Due by PeriodLess than More than
(Dollars in thousands) Total 1 year 1-3 years 3-5 years 5 yearsLong-Term Debt Obligations(1).............................................. $ 109,993 $ 9,420 $ 24,335 $ 76,238 $ �Interest on Long-Term Debt Obligations(2)............................ 11,843 4,105 6,995 743 �Operating Lease Obligations.................................................. 530 245 284 1 �Purchase Obligations(3) .......................................................... 82,848 16,325 31,365 35,158 �Other ...................................................................................... 315 183 132 � �
Total Contractual Obligations(4) ...................................... $ 205,529 $ 30,278 $ 63,111 $ 112,140 $ �
(1) See Note 8 in Notes to Consolidated Financial Statements for additional information regarding the Company's debt. �Long-Term Debt Obligations� refers tofuture cash principal payments.
(2) Interest payments on variable rate debt instruments were calculated using June 30, 2020 interest rates and holding them constant for the life of the instruments.(3) Purchase obligations represent agreements with suppliers and vendors entered into as part of the normal course of business, including engine purchase
commitments.(4) Unrecognized tax benefits of $3.7 million are not reflected in this table because the Company cannot predict when open income tax years will close with
completed examinations. See Note 9 in Notes to Consolidated Financial Statements.
Repurchase Obligations � The Company has reserves to cover potential losses associated with repurchase obligations based onhistorical experience and current facts and circumstances. We incurred no material impact from repurchase events during fiscal 2020,2019, or 2018. An adverse change in retail sales, however, could require us to repurchase boats repossessed by floor plan financingcompanies upon an event of default by any of our dealers, subject in some cases to an annual limitation. See Note 11 in Notes toConsolidated Financial Statements included elsewhere in this Form 10-K for more information related to our obligations under floorplan financing agreements.
Emerging Growth Company
We are an emerging growth company, as defined in the JOBS Act. For as long as we are an emerging growth company, we may takeadvantage of certain exemptions from various reporting requirements that are applicable to other public companies that are notemerging growth companies, including, but not limited to, not being required to comply with the auditor attestation requirements ofSection 404(b) of the Sarbanes-Oxley Act, reduced disclosure obligations regarding executive compensation in our periodic reportsand proxy statements, and exemptions from the requirements of holding stockholder advisory �say-on-pay� votes on executivecompensation and stockholder advisory votes on golden parachute compensation.
The JOBS Act also provides that an emerging growth company can utilize the extended transition period provided inSection 7(a)(2)(B) of the Securities Act for complying with new or revised accounting standards. Pursuant to Section 107 of the JOBSAct, we have irrevocably chosen to opt out of such extended transition period and, as a result, we will comply with new or revisedaccounting standards on the relevant dates on which adoption of such standards is required for companies that are not �emerginggrowth companies.�

42
We will continue to be an emerging growth company until June 30, 2021, which is the last day of our fiscal year following the fifthanniversary of the date of completion of our initial public offering.
Inflation
The market prices of certain materials and components used in manufacturing our products, especially resins that are made withhydrocarbon feedstocks, copper, aluminum, and stainless steel, can be volatile. Historically, however, inflation has not had a materialeffect on our results of operations. Significant increases in inflation, particularly those related to wages and increases in the cost of rawmaterials, could have an adverse impact on our business, financial condition, and results of operations.
New boat buyers often finance their purchases. Inflation typically results in higher interest rates that could translate into an increasedcost of boat ownership. Should inflation and increased interest rates occur, prospective consumers may choose to forego or delay theirpurchases or buy a less expensive boat in the event credit is not available to finance their boat purchases.
Critical Accounting Policies
A �critical accounting policy� is one which is both important to the understanding of our financial condition and results of operationsand requires management�s most difficult, subjective, or complex judgments, often of the need to make estimates about the effect ofmatters that are inherently uncertain. Actual results could differ from those estimates and cause our reported net income (loss) to varysignificantly from period to period.
We believe that the policies listed below involve the greatest degree of judgment and complexity. Accordingly, we believe these arethe most critical to understand in order to evaluate fully our financial condition and results of operations. For additional informationregarding these policies, see Note 1� Significant Accounting Policies in Notes to Consolidated Financial Statements.
Goodwill and Other Intangible Assets� The Company does not amortize goodwill and other purchased intangible assets withindefinite lives. All of the Company�s goodwill and other intangible assets relate to our MasterCraft, NauticStar, or Crest reportingunits (see Note 13 in Notes to Consolidated Financial Statements). The Company�s intangible assets with finite lives consist primarilyof dealer networks and are carried at their estimated fair values at the time of acquisition, less accumulated amortization. Amortizationis recognized on a straight-line basis over the estimated useful lives of the respective assets (see Note 6 in Notes to ConsolidatedFinancial Statements). Intangible assets that are subject to amortization are evaluated for impairment using a process similar to thatused to evaluate long-lived assets described below.
Goodwill
Goodwill results from the excess of purchase price over the net assets of businesses acquired. The Company reviews goodwill forimpairment annually, at fiscal yearend, and whenever events or changes in circumstances indicate that the fair value of a reporting unitmay be below its carrying value. As part of the annual test, the Company may perform a qualitative, rather than quantitative,assessment to determine whether the fair values of its reporting units are �more likely than not� to be greater than their carryingvalues. In performing this qualitative analysis, the Company considers various factors, including the effect of market or industrychanges and the reporting units' actual results compared to projected results.
If the fair value of a reporting unit does not meet the "more likely than not" criteria discussed above, the impairment test for goodwillis a quantitative test. This test involves comparing the fair value of the reporting unit with its carrying value. If the fair value exceedsthe carrying value, goodwill is not considered impaired. If the carrying amount exceeds the fair value then the goodwill is consideredimpaired and an impairment loss is recognized in an amount by which the carrying value exceeds the reporting unit�s fair value, not toexceed the carrying amount of the goodwill allocated to that reporting unit.
The Company calculates the fair value of its reporting units considering both the income approach and market approach. The incomeapproach calculates the fair value of the reporting unit using a discounted cash flow approach. Internally forecasted future cash flows,which the Company believes reasonably approximate market participant assumptions, are discounted using a weighted average cost ofcapital (�Discount Rate�) developed for each reporting unit. The Discount Rate is developed using market observable inputs, as wellas considering whether or not there is a measure of risk related to the specific reporting unit�s forecasted performance. Fair valueunder the market approach is determined for each unit by applying market multiples for comparable public companies to the unit�sfinancial results. The key uncertainties in these calculations are the assumptions used in determining the reporting unit�s forecastedfuture performance, including revenue growth and operating margins, as well as the perceived risk associated with those forecasts indetermining the Discount Rate, along with selecting representative market multiples.

43
As of June 30, 2020, only the Mastercraft reporting unit has a goodwill balance. The fair value of this reporting unit substantiallyexceeds its carrying value. However, it is possible that the Company�s assumptions regarding the key uncertainties in this fair valuecalculation could change in the near term. If actual results differ from the Company�s assumptions, it is possible that the MasterCraftreporting unit could incur goodwill impairment charges in future periods.
Other Intangible Assets
The Company's primary intangible assets other than goodwill are dealer networks and trade names acquired in business combinations.These intangible assets are initially valued using a methodology commensurate with the intended use of the asset. The dealer networkswere valued using an income approach, which requires an estimate or forecast of the expected future cash flows from the dealernetwork through the application of the multi-period excess earnings approach. The fair value of trade names is measured using arelief-from-royalty approach, a variation of the income approach, which requires an estimate or forecast of the expected future cashflows. This method assumes the value of the trade name is the discounted cash flows of the amount that would be paid to third partieshad the Company not owned the trade name and instead licensed the trade name from another company. The basis for future salesprojections for these methods are based on internal revenue forecasts by reporting unit, which the Company believes representreasonable market participant assumptions. The future cash flows are discounted using an applicable Discount Rate as well as anypotential risk premium to reflect the inherent risk of holding a standalone intangible asset.
The key uncertainties in these fair value calculations, as applicable, are: assumptions used in developing internal revenue growth anddealer expense forecasts, assumed dealer attrition rates, the selection of an appropriate royalty rate, as well as the perceived riskassociated with those forecasts in determining the Discount Rate.
The costs of amortizable intangible assets, including dealer networks, are recognized over their expected useful lives, approximatelyten years for the dealer networks, using the straight-line method. Intangible assets that are subject to amortization are evaluated forimpairment using a process similar to that used to evaluate long-lived assets described below. Intangible assets not subject toamortization are assessed for impairment at least annually and whenever events or changes in circumstances indicate that it is morelikely than not that an asset may be impaired. The impairment test for indefinite-lived intangible assets consists of a comparison of thefair value of the intangible asset with its carrying amount. An impairment loss is recognized for the amount by which the carryingvalue exceeds the fair value of the asset.
During the third quarter of fiscal 2020, impairment charges were incurred for the NauticStar and Crest trade name-related intangibleassets. As of our fiscal year end, which is our annual impairment testing date under ASC 360, there have been favorable changes incircumstances as compared to those existing as of the end of the third quarter, such as strong marine retail demand coupled withrecord low retail inventory levels that have created a growth opportunity in the near term, which we believe indicates that it is notmore likely than not that the current carrying values of these assets are higher than the fair values. Changes in assumptions andestimates such as declines in projected results, however, may affect the fair value of our intangible assets and could result in additionalimpairment charges in future periods.
Income Taxes�We are subject to income taxes in the United States of America and the United Kingdom. Our effective tax ratesdiffer from the statutory rates, primarily due to changes in the valuation allowance and non-deductible expenses, as further describedin Note 9 in Notes to Consolidated Financial Statements.
Significant judgment is required in evaluating our uncertain tax positions and determining our provision for income taxes. Althoughwe believe our reserves are reasonable, we cannot provide assurance that the final tax outcome of these matters will not be differentfrom that which is reflected in our historical income tax provisions and accruals. We adjust these reserves in light of changing factsand circumstances, such as the closing of a tax audit or the refinement of an estimate. To the extent that the final tax outcome of thesematters is different than the amounts recorded, such differences will impact the provision for income taxes in the period in which suchdetermination is made. The provision for income taxes includes the impact of reserve provisions and changes to reserves that areconsidered appropriate, as well as the related net interest.
Significant judgment is also required in determining any valuation allowance recorded against deferred tax assets. In assessing theneed for a valuation allowance, we consider all available evidence, including past operating results, estimates of future taxableincome, and the feasibility of tax planning strategies. In the event that we change our determination as to the amount of deferred taxassets that can be realized, we will adjust our valuation allowance with a corresponding impact to the provision for income taxes in theperiod in which such determination is made.
Realization of our deferred tax assets is dependent on generating sufficient taxable income in future periods. If future events cause usto conclude that it is not more likely than not that we will be able to recover the value of our deferred tax assets, we are required toestablish a valuation allowance on deferred tax assets at that time.

44
Revenue Recognition� The Company�s revenue is derived primarily from the sale of boats and trailers, marine parts, andaccessories to its independent dealers. The Company recognizes revenue when obligations under the terms of a contract are satisfiedand control over promised goods is transferred to a customer. For the majority of sales, this occurs when the product is released to thecarrier responsible for transporting it to a customer. The Company typically receives payment within 5 business days of shipment.Revenue is measured as the amount of consideration it expects to receive in exchange for a product. The Company offers dealerincentives that include wholesale rebates, retail rebates and promotions, floor plan reimbursement or cash discounts, and otherallowances that are recorded as reductions of revenues in Net sales in the consolidated statements of operations. The considerationrecognized represents the amount specified in a contract with a customer, net of estimated incentives the Company reasonably expectsto pay. The estimated liability and reduction in revenue for dealer incentives is recorded at the time of sale. Subsequent adjustments toincentive estimates are possible because actual results may differ from these estimates if conditions dictate the need to enhance orreduce sales promotion and incentive programs or if dealer achievement or other items vary from historical trends. Accrued dealerincentives are included in Accrued expenses and other current liabilities in the accompanying consolidated balance sheets.
Rebates and Discounts
Dealers earn wholesale rebates based on purchase volume commitments and achievement of certain performance metrics. TheCompany estimates the amount of wholesale rebates based on historical achievement, forecasted volume, and assumptions regardingdealer behavior. Rebates that apply to boats already in dealer inventory are referred to as retail rebates. The Company estimates theamount of retail rebates based on historical data for specific boat models adjusted for forecasted sales volume, product mix, dealer andconsumer behavior, and assumptions concerning market conditions. The Company also utilizes various programs whereby it offerscash discounts or agrees to reimburse its dealers for certain floor plan interest costs incurred by dealers for limited periods of time,generally ranging up to nine months.
Other Revenue Recognition Matters
Dealers generally have no right to return unsold boats. Occasionally, the Company may accept returns in limited circumstances and atthe Company�s discretion under its warranty policy. The Company may be obligated, in the event of default by a dealer, to acceptreturns of unsold boats under its repurchase commitment to floor financing providers, who are able to obtain such boats throughforeclosure. The repurchase commitment is on an individual unit basis with a term from the date it is financed by the lendinginstitution through the payment date by the dealer, generally not exceeding 30 months. The Company accounts for these arrangementsas guarantees and recognizes a liability based on the estimated fair value of the repurchase obligation. The estimated fair value takesinto account our estimate of the loss we will incur upon resale of any repurchases. The Company accrues the estimated fair value ofthis obligation based on the age of inventory currently under floor plan financing and estimated credit quality of dealers holding theinventory. Inputs used to estimate this fair value include significant unobservable inputs that reflect the Company�s assumptions aboutthe inputs that market participants would use and, therefore, this liability is classified within Level 3 of the fair value hierarchy.
Product Warranties � The Company offers warranties on the sale of certain products for periods of between one and five years.These warranties require us or our dealers to repair or replace defective products during the warranty period at no cost to theconsumer. We estimate the costs that may be incurred under our basic limited warranty and record as a liability the amount of suchcosts at the time the product revenue is recognized. The key uncertainties that affect our estimate for warranty liability includeanticipated rates of warranty claims and cost per claim. We periodically assess the adequacy of the recorded warranty liabilities andadjust the amounts as actual claims are determined or as changes in the obligations become reasonably estimable.
Repurchase Agreements � In connection with our dealers� wholesale floor plan financing of boats, we have entered into repurchaseagreements with various lending institutions. The repurchase commitment is on an individual unit basis with a term from the date it isfinanced by the lending institution through payment date by the dealer, generally not exceeding 30 months. Such agreements arecustomary in the industry and our exposure to loss under such agreements is limited by the resale value of the inventory which isrequired to be repurchased. We incurred no material impact from repurchase events during fiscal 2020, 2019, or 2018.
ITEM 7A. QUANTITATIVE AND QUALITATIVE DISCLOSURES ABOUT MARKET RISK.
Market risk represents the risk of changes in the value of market risk sensitive instruments caused by fluctuations in foreign exchangerates, interest rates, and commodity prices. Changes in these factors could cause fluctuations in the results of our operations and cashflows. In the ordinary course of business, we are primarily exposed to interest rate risks.
As of June 30, 2020, we had $108.6 million of long-term debt outstanding, bearing interest at the effective interest rate of 3.75%. SeeNote 8 in Notes to Consolidated Financial Statements for more information regarding our long-term debt.
A hypothetical 1% increase or decrease in interest rates would have resulted in a $1.8 million change to our interest expense for fiscal2020.

45
ITEM 8. FINANCIAL STATEMENTS AND SUPPLEMENTARY DATA.
The financial statements and supplementary financial information required to be filed under this Item 8 are presented in Part IV, Item15 of this Form 10-K.
ITEM 9. CHANGES IN AND DISAGREEMENTS WITH ACCOUNTANTS ON ACCOUNTING AND FINANCIALDISCLOSURE.
None.
ITEM 9A. CONTROLS AND PROCEDURES
Evaluation of Disclosure Controls and Procedures
We maintain disclosure controls and procedures (as defined in Rule 13a-15(e) of the Exchange Act) that are designed to ensure thatinformation required to be disclosed by us in the reports that we file or submit under the Exchange Act is recorded, processed,summarized and reported within the time periods specified in the SEC's rules and forms, and that such information is accumulated andcommunicated to our management, including our chief executive officer and chief financial officer, as appropriate, to allow timelydecisions regarding required disclosures. Any controls and procedures, no matter how well designed and operated, can provide onlyreasonable assurance of achieving the desired control objectives.
As of the end of the period covered by this Form 10-K Annual Report, we carried out an evaluation under the supervision and with theparticipation of our management, including our chief executive officer and chief financial officer, of the effectiveness of ourdisclosure controls and procedures. Based on this evaluation, our chief executive officer and chief financial officer have concludedthat our disclosure controls and procedures were effective at a reasonable assurance level as of June 30, 2020.
Management�s Report on Internal Control over Financial Reporting
Our management is responsible for establishing and maintaining adequate internal control over financial reporting as defined inRule 13a-15(f) under the Exchange Act. Internal control over financial reporting is a process to provide reasonable assuranceregarding the reliability of our financial reporting for external purposes in accordance with accounting principles generally accepted inthe United States. Because of its inherent limitations, internal control over financial reporting may not prevent or detect misstatements.Projections of any evaluation of effectiveness to future periods are subject to the risk that controls may become inadequate because ofchanges in conditions, or that the degree of compliance with the policies or procedures may deteriorate.
Our management, including our chief executive officer and chief financial officer, assessed the effectiveness of our internal controlover financial reporting as of June 30, 2020. In making this assessment, we used the criteria set forth by the Committee of SponsoringOrganizations of the Treadway Commission ("COSO") in Internal Control-Integrated Framework (2013) . Based on such assessmentour management has concluded that, as of June 30, 2020, our internal control over financial reporting is effective based on thosecriteria.
This annual report does not include an attestation report from our registered public accounting firm regarding internal control overfinancial reporting. Management's assessment of the effectiveness of internal controls over financial reporting was not subject toattestation by our registered public accounting firm pursuant to rules of the SEC that permit emerging growth companies, which weare, to provide only management's assessment in this annual report.
Changes in Internal Control Over Financial Reporting
There have been no changes in our internal control over financial reporting, as defined in Exchange Act Rule 13a-15(f), during theperiod covered by this report that have materially affected, or are reasonably likely to materially affect, our internal control overfinancial reporting.
ITEM 9B. OTHER INFORMATION
None.

46
PART III
ITEM 10. DIRECTORS, EXECUTIVE OFFICERS AND CORPORATE GOVERNANCE.
The information required by this Item 10 will be included in the Proxy Statement and is incorporated herein by reference.
ITEM 11. EXECUTIVE COMPENSATION
The information required by this Item 11 will be included in the Proxy Statement and is incorporated herein by reference.
ITEM 12. SECURITY OWNERSHIP OF CERTAIN BENEFICIAL OWNERS AND MANAGEMENT AND RELATEDSTOCKHOLDER MATTERS
The information required by this Item 12 will be included in the Proxy Statement and is incorporated herein by reference.
ITEM 13. CERTAIN RELATIONSHIPS AND RELATED PARTY TRANSACTIONS, AND DIRECTOR INDEPENDENCE
The information required by this Item 13 will be included in the Proxy Statement and is incorporated herein by reference.
ITEM 14. PRINCIPAL ACCOUNTANT FEES AND SERVICES.
The information required by this Item 14 will be included in the Proxy Statement and is incorporated herein by reference.

47
PART IV
ITEM 15. EXHIBITS, FINANCIAL STATEMENT SCHEDULES.
a. Documents included in this report:
1. Financial Statements
Reports of Independent Registered Public Accounting Firms F-1Consolidated Balance Sheets F-3Consolidated Statements of Operations F-4Consolidated Statements of Stockholders' Equity F-5Consolidated Statements of Cash Flows F-6Notes to Consolidated Financial Statements F-7
1. Financial Statement Schedules
Financial statement schedules have been omitted because they are either not required, not applicable or the informationrequired to be presented is included in our financial statements and related notes.
2. Exhibits
The following documents are filed as a part of this annual report on Form 10-K or are incorporated by reference toprevious filings, if so indicated:
ExhibitNo. Description Form File No. Exhibit Filing Date
FiledHerewith
2.1 Membership Interest Purchase Agreement, dated October2, 2017 among MCBC Holdings, Inc., Nautic Star, LLCand each of the other parties thereto
8-K 001!37502 2.1 10/2/17
2.2 Membership Interest Purchase Agreement, datedSeptember 10, 2018 among MCBC Holdings, Inc., all ofthe Members of Crest Marine, LLC and Patrick Fenton,as Representative for the Members of Crest Marine, LLC
8-K 001-37502 2.1 10/1/18
3.1 Amended and Restated Certificate of Incorporation ofMCBC Holdings, Inc.
10-K 001-37502 3.1 9/18/15
3.2 Certificate of Amendment to Amended and RestatedCertificate of Incorporation of MasterCraft BoatHoldings, Inc.
10-Q 001-37502 3.2 11/9/18
3.3 Certificate of Amendment to Amended and RestatedCertificate of Incorporation of MasterCraft BoatHoldings, Inc.
8-K 001-37502 3.1 10/25/19
3.4 Fourth Amended and Restated By-laws of MasterCraftBoat Holdings, Inc.
8-K 001-37502 3.2 10/25/19
4.1 Common stock certificate of MasterCraft BoatHoldings, Inc.
S-1/A 333-203815 4.1 7/15/15
4.2 Description of Registrant�s Securities RegisteredPursuant to Section 12 of the Securities Exchange Act of1934
*
10.1� MCBC Holdings, Inc. 2010 Equity Incentive Plan S-1/A 333-203815 10.2 6/25/15
10.2� MCBC Holdings, Inc. 2015 Incentive Award Plan S-1/A 333-203815 10.4 7/15/15
10.3� Form of Restricted Stock Award Agreement and GrantNotice under 2015 Incentive Award Plan (employee)
S-1/A 333-203815 10.10 7/1/15

48
10.4� Form of Stock Option Agreement and Grant Noticeunder 2015 Incentive Award Plan (employee)
S-1/A 333-203815 10.12 7/7/15
10.5� Form of Restricted Stock Award Grant Notice under2015 Incentive Award Plan (director)
S-1/A 333-203815 10.13 7/7/15
10.6� Senior Executive Incentive Bonus Plan 10-K 001-37502 10.8 9/18/15
10.7� Non-Employee Director Compensation Policy 10-K 001-37502 10.7 9/13/19
10.8� Employment Agreement between MasterCraft BoatCompany, LLC and Terry McNew, effective as of July 1,2018
8-K 001-37502 10.1 7/2/18
10.9� Employment Agreement between MasterCraft BoatCompany, LLC and Timothy M. Oxley, effective as ofJuly 1, 2018
8-K 001-37502 10.2 7/2/18
10.10� Employment Agreement Between Crest Marine, LLCand Patrick May
10-K 001-37502 10.10 9/13/19
10.11� Form of Indemnification Agreement for directors andofficers
S-1/A 333-203815 10.9 7/7/15
10.12� Form of Performance Stock Unit Award Agreementunder 2015 Incentive Award Plan
8-K 001-37502 10.1 8/26/16
10.13 Fourth Amended and Restated Credit and GuarantyAgreement, dated October 1, 2018, by and amongMasterCraft Boat Holdings, Inc. as a guarantor,MasterCraft Boat Company, LLC, MasterCraft Services,LLC, MasterCraft International Sales Administration,Inc., Nautic Star, LLC, NS Transport, LLC, and CrestMarine LLC as borrowers, Fifth Third Bank as the agentand letter of credit issuer, and the lenders party thereto
8-K 001-37502 10.1 10/1/18
10.14 Amendment No. 3 to the Fourth Amended and RestatedCredit and Guaranty Agreement
10-Q 001-37502 10.1 5/8/20
10.15� Letter Agreement, dated October 30, 2019 8-K 001-37502 10.1 10/30/19
10.16� Offer Letter, dated December 2, 2019 8-K 001-37502 10.1 12/3/19
10.17� Offer Letter, dated July 16, 2020 8-K 001-37502 10.1 8/3/20
10.18� Form of PSU Award Agreement 8-K 001-37502 10.1 7/22/20
21.1 List of subsidiaries of MasterCraft Boat Holdings, Inc . *
23.1 Consent of Deloitte & Touche LLP, independentregistered public accounting firm *
23.2 Consent of BDO USA, LLP, independent registeredpublic accounting firm *
31.1 Rule 13a-14(a)/15d-14(a) Certification of PrincipalExecutive Officer *
31.2 Rule 13a-14(a)/15d-14(a) Certification of PrincipalFinancial Officer *
32.1 Section 1350 Certification of Chief Executive Officer **
32.2 Section 1350 Certification of Chief Financial Officer **
101.INS XBRL Instance Document *
101.SCH XBRL Taxonomy Extension Schema Document *
49
101.CAL XBRL Taxonomy Extension Calculation LinkbaseDocument *
101.DEF XBRL Taxonomy Extension Definition LinkbaseDocument *
101.LAB XBRL Taxonomy Extension Label Linkbase Document *
101.PRE XBRL Taxonomy Extension Presentation LinkbaseDocument *
� Indicates management contract or compensatory plan.* Filed herewith.** Furnished herewith.
ITEM 16. FORM 10-K SUMMARY.
Not Applicable.

50
SIGNATURES
Pursuant to the requirements of Section 13 or 15(d) of the Securities Exchange Act of 1934, the registrant has duly caused this reportto be signed on its behalf by the undersigned, thereunto duly authorized.
Date: September 11, 2020 MASTERCRAFT BOAT HOLDINGS, INC.
By: /s/ FREDERICK A. BRIGHTBILLChief Executive Officer (Principal Executive Officer) andChairman of the Board
Pursuant to the requirements of the Securities Exchange Act of 1934, this report has been signed below by the following persons onbehalf of the registrant and in the capacities and on the dates indicated.
Signature Title Date
/s/ FREDERICK A. BRIGHTBILLChief Executive Officer (Principal Executive Officer) andChairman of the Board
Frederick A. Brightbill September 11, 2020
/s/ TIMOTHY M. OXLEYChief Financial Officer (Principal Financial and AccountingOfficer), Treasurer and Secretary
Timothy M. Oxley September 11, 2020
/s/ W. PATRICK BATTLE DirectorW. Patrick Battle September 11, 2020
/s/ JACLYN BAUMGARTEN DirectorJaclyn Baumgarten September 11, 2020
/s/ DONALD C. CAMPION DirectorDonald C. Campion September 11, 2020
/s/ TJ CHUNG DirectorTJ Chung September 11, 2020
/s/ ROCH LAMBERT DirectorRoch Lambert September 11, 2020
/s/ PETER G. LEEMPUTTE DirectorPeter G. Leemputte September 11, 2020

F-1
REPORT OF INDEPENDENT REGISTERED PUBLIC ACCOUNTING FIRM
To the stockholders and the Board of Directors of MasterCraft Boat Holdings, Inc.
Opinion on the Financial Statements
We have audited the accompanying consolidated balance sheet of MasterCraft Boat Holdings, Inc. and subsidiaries (the "Company")as of June 30, 2020, the related consolidated statements of operations, stockholders' equity, and cash flows, for the year ended June 30,2020, and the related notes (collectively referred to as the "financial statements"). In our opinion, the financial statements presentfairly, in all material respects, the financial position of the Company as of June 30, 2020, and the results of its operations and its cashflows for the year ended June 30, 2020, in conformity with accounting principles generally accepted in the United States of America.
Basis for Opinion
These financial statements are the responsibility of the Company's management. Our responsibility is to express an opinion on theCompany's financial statements based on our audit. We are a public accounting firm registered with the Public Company AccountingOversight Board (United States) (PCAOB) and are required to be independent with respect to the Company in accordance with theU.S. federal securities laws and the applicable rules and regulations of the Securities and Exchange Commission and the PCAOB.
We conducted our audit in accordance with the standards of the PCAOB. Those standards require that we plan and perform the auditto obtain reasonable assurance about whether the financial statements are free of material misstatement, whether due to error or fraud.The Company is not required to have, nor were we engaged to perform, an audit of its internal control over financial reporting. As partof our audit, we are required to obtain an understanding of internal control over financial reporting but not for the purpose ofexpressing an opinion on the effectiveness of the Company�s internal control over financial reporting. Accordingly, we express nosuch opinion.
Our audit included performing procedures to assess the risks of material misstatement of the financial statements, whether due to erroror fraud, and performing procedures that respond to those risks. Such procedures included examining, on a test basis, evidenceregarding the amounts and disclosures in the financial statements. Our audit also included evaluating the accounting principles usedand significant estimates made by management, as well as evaluating the overall presentation of the financial statements. We believethat our audit provides a reasonable basis for our opinion.
/s/ Deloitte & Touche LLP
Nashville, TennesseeSeptember 11, 2020
We have served as the Company's auditor since 2019.

F-2
REPORT OF INDEPENDENT REGISTERED PUBLIC ACCOUNTING FIRM
Board of Directors and StockholdersMasterCraft Boat Holdings, Inc. and Subsidiaries
Opinion on the Consolidated Financial Statements
We have audited the accompanying consolidated balance sheet of MasterCraft Boat Holdings, Inc. and subsidiaries (the �Company�)as of June 30, 2019, the related consolidated statements of operations, stockholders� equity, and cash flows for each of the two years inthe period ended June 30, 2019, and the related notes (collectively referred to as the �consolidated financial statements�). In ouropinion, the consolidated financial statements present fairly, in all material respects, the financial position of the Company at June 30,2019, and the results of their operations and their cash flows for each of the two years in the period ended June 30, 2019, inconformity with accounting principles generally accepted in the United States of America.
Basis for Opinion
These consolidated financial statements are the responsibility of the Company�s management. Our responsibility is to express anopinion on the Company�s consolidated financial statements based on our audits. We are a public accounting firm registered with thePublic Company Accounting Oversight Board (United States) (�PCAOB�) and are required to be independent with respect to theCompany in accordance with the U.S. federal securities laws and the applicable rules and regulations of the Securities and ExchangeCommission and the PCAOB.
We conducted our audits in accordance with the standards of the PCAOB. Those standards require that we plan and perform the auditto obtain reasonable assurance about whether the consolidated financial statements are free of material misstatement, whether due toerror or fraud. The Company is not required to have, nor were we engaged to perform, an audit of its internal control over financialreporting. As part of our audits we are required to obtain an understanding of internal control over financial reporting but not for thepurpose of expressing an opinion on the effectiveness of the Company�s internal control over financial reporting. Accordingly, weexpress no such opinion.
Our audits included performing procedures to assess the risks of material misstatement of the consolidated financial statements,whether due to error or fraud, and performing procedures that respond to those risks. Such procedures included examining, on a testbasis, evidence regarding the amounts and disclosures in the consolidated financial statements. Our audits also included evaluating theaccounting principles used and significant estimates made by management, as well as evaluating the overall presentation of theconsolidated financial statements. We believe that our audits provide a reasonable basis for our opinion.
/s/ BDO USA, LLP
Atlanta, Georgia
September 13, 2019

F-3
MASTERCRAFT BOAT HOLDINGS, INC. AND SUBSIDIARIESCONSOLIDATED BALANCE SHEETS
As of June 30(Dollar amounts in thousands, except per share data) 2020 2019ASSETSCURRENT ASSETS:
Cash and cash equivalents............................................................................................................................. $ 16,319 $ 5,826Accounts receivable, net of allowances of $247 and $281, respectively...................................................... 6,145 12,463Income tax receivable ................................................................................................................................... 4,924 951Inventories, net (Note 4) ............................................................................................................................... 25,636 30,660Prepaid expenses and other current assets .................................................................................................... 3,719 4,464
Total current assets..................................................................................................................................... 56,743 54,364Property, plant and equipment, net (Note 5) .................................................................................................... 40,481 33,636Goodwill (Note 6) ............................................................................................................................................ 29,593 74,030Other intangible assets, net (Note 6) ................................................................................................................ 63,849 79,799Deferred income taxes (Note 9) ....................................................................................................................... 16,080 6,240Deferred debt issuance costs, net ..................................................................................................................... 425 451Other long-term assets...................................................................................................................................... 752 253Total assets ....................................................................................................................................................... $ 207,923 $ 248,773LIABILITIES AND STOCKHOLDERS' EQUITYCURRENT LIABILITIES:
Accounts payable .......................................................................................................................................... $ 10,510 $ 17,974Income tax payable ....................................................................................................................................... � 426Accrued expenses and other current liabilities (Note 7) ............................................................................... 35,985 41,421Current portion of long-term debt, net of unamortized debt issuance costs (Note 8)................................... 8,932 8,725
Total current liabilities ............................................................................................................................... 55,427 68,546Long term debt, net of unamortized debt issuance costs (Note 8) ................................................................ 99,666 105,016Unrecognized tax positions (Note 9) ............................................................................................................ 3,683 2,895Other long-term liabilities ............................................................................................................................. 277 �
Total liabilities ................................................................................................................................................. 159,053 176,457COMMITMENTS AND CONTINGENCIES (Note 11)STOCKHOLDERS' EQUITY:
Common stock, $.01 par value per share � authorized, 100,000,000 shares; issued and outstanding,18,871,637 shares at June 30, 2020 and 18,764,037 shares at June 30, 2019 .............................................. 189 188Additional paid-in capital.............................................................................................................................. 116,182 115,582Accumulated deficit ...................................................................................................................................... (67,501) (43,454)
Total stockholders' equity .......................................................................................................................... 48,870 72,316Total liabilities and stockholders' equity.......................................................................................................... $ 207,923 $ 248,773
The Notes to Consolidated Financial Statements are an integral part of these consolidated financial statements.

F-4
MASTERCRAFT BOAT HOLDINGS, INC. AND SUBSIDIARIESCONSOLIDATED STATEMENTS OF OPERATIONS
For the Years Ended June 302020 2019 2018
(Dollar amounts in thousands, except per share data)NET SALES........................................................................................................................... $ 363,073 $ 466,381 $ 332,725COST OF SALES.................................................................................................................. 287,717 353,254 242,361GROSS PROFIT.................................................................................................................... 75,356 113,127 90,364OPERATING EXPENSES:
Selling and marketing ......................................................................................................... 15,981 17,670 13,011General and administrative ................................................................................................. 25,557 27,706 19,773Amortization of other intangible assets .............................................................................. 3,948 3,492 1,597Goodwill and other intangible asset impairment ................................................................ 56,437 31,000 �Total operating expenses .................................................................................................... 101,923 79,868 34,381
OPERATING INCOME (LOSS)........................................................................................... (26,567) 33,259 55,983OTHER EXPENSE:
Interest expense................................................................................................................... 5,045 6,513 3,474INCOME (LOSS) BEFORE INCOME TAX EXPENSE (BENEFIT) ................................. (31,612) 26,746 52,509INCOME TAX EXPENSE (BENEFIT)................................................................................ (7,565) 5,392 12,856NET INCOME (LOSS).......................................................................................................... $ (24,047) $ 21,354 $ 39,653
EARNINGS (LOSS) PER SHARE:Basic................................................................................................................................. $ (1.28) $ 1.14 $ 2.13Diluted ............................................................................................................................. $ (1.28) $ 1.14 $ 2.12
WEIGHTED AVERAGE SHARES USED FOR COMPUTATION OF:Basic earnings (loss) per share......................................................................................... 18,734,482 18,653,892 18,619,793Diluted earnings (loss) per share ..................................................................................... 18,734,482 18,768,207 18,714,531
The Notes to Consolidated Financial Statements are an integral part of these consolidated financial statements.

F-5
MASTERCRAFT BOAT HOLDINGS, INC. AND SUBSIDIARIESCONSOLIDATED STATEMENTS OF STOCKHOLDERS� EQUITY
AdditionalCommon Stock Paid-in Accumulated
(Dollar amounts in thousands, except share data) Shares Amount Capital Deficit TotalBalance at June 30, 2017 ......................................................................... 18,637,445 $ 186 $ 112,945 $ (101,370) $ 11,761Share-based compensation activity............................................................ 44,893 1 1,107 � 1,108Net income................................................................................................. � � � 39,653 39,653Balance at June 30, 2018 ......................................................................... 18,682,338 187 114,052 (61,717) 52,522Adoption of accounting standards ............................................................. � � � (3,091) (3,091)Share-based compensation activity............................................................ 81,699 1 1,530 � 1,531Net income................................................................................................. � � � 21,354 21,354Balance at June 30, 2019 ......................................................................... 18,764,037 188 115,582 (43,454) 72,316Share-based compensation activity (Note 10) ........................................... 107,600 1 600 � 601Net income (loss) ....................................................................................... � � � (24,047) (24,047)Balance at June 30, 2020 ......................................................................... 18,871,637 $ 189 $ 116,182 $ (67,501) $ 48,870
The Notes to Consolidated Financial Statements are an integral part of these consolidated financial statements.

F-6
MASTERCRAFT BOAT HOLDINGS, INC. AND SUBSIDIARIESCONSOLIDATED STATEMENTS OF CASH FLOWS
For the Years Ended June 30(Dollar amounts in thousands) 2020 2019 2018CASH FLOWS FROM OPERATING ACTIVITIES:Net income (loss) ............................................................................................................................ $ (24,047) $ 21,354 $ 39,653Adjustments to reconcile net income (loss) to net cash provided by operating activities:
Depreciation and amortization ..................................................................................................... 10,527 7,787 5,086Share-based compensation ........................................................................................................... 1,061 1,678 1,186Deferred income taxes.................................................................................................................. (9,840) (6,734) 557Unrecognized tax benefits............................................................................................................ 788 913 (1,199)Amortization of debt issuance costs............................................................................................. 572 553 496Goodwill and other intangible asset impairment ......................................................................... 56,437 31,000 �Changes in certain operating assets and liabilities .......................................................................
Accounts receivable .................................................................................................................. 6,291 (1,835) (211)Inventories................................................................................................................................. 4,752 (449) (2,754)Prepaid expenses and other current assets ................................................................................ 695 (1,464) (763)Income tax receivable ............................................................................................................... (3,973) (951) �Accounts payable ...................................................................................................................... (6,874) (2,995) 2,847Accrued expenses and other current liabilities.......................................................................... (5,527) 6,609 4,720
Other, net...................................................................................................................................... (664) 420 (221)Net cash provided by operating activities .............................................................................. 30,198 55,886 49,397
CASH FLOWS FROM INVESTING ACTIVITIES:Payments for acquisitions, net of cash acquired .......................................................................... � (81,729) (80,511)Purchases of property, plant and equipment ................................................................................ (14,241) (14,064) (5,305)Proceeds from disposal of property, plant and equipment ........................................................... 23 7 96
Net cash used in investing activities ...................................................................................... (14,218) (95,786) (85,720)
CASH FLOWS FROM FINANCING ACTIVITIES:Proceeds from issuance of long-term debt ................................................................................... � 80,000 80,832Principal payments on long-term debt ......................................................................................... (15,357) (41,306) (39,320)Borrowings on revolving credit facility ....................................................................................... 35,000 � �Principal payments on revolving credit facility ........................................................................... (25,000) � �Proceeds from insurance premium financing............................................................................... 1,130 � �Principal payments on insurance premium financing .................................................................. (468) � �Other, net...................................................................................................................................... (792) (877) (1,318)
Net cash provided (used) by financing activities ................................................................... (5,487) 37,817 40,194NET CHANGE IN CASH AND CASH EQUIVALENTS ............................................................ 10,493 (2,083) 3,871
CASH AND CASH EQUIVALENTS � BEGINNING OF PERIOD........................................... 5,826 7,909 4,038CASH AND CASH EQUIVALENTS � END OF PERIOD......................................................... $ 16,319 $ 5,826 $ 7,909SUPPLEMENTAL DISCLOSURES OF CASH FLOW INFORMATION:
Cash payments for interest ........................................................................................................... $ 4,841 $ 5,526 $ 2,976Cash payments for income taxes.................................................................................................. 6,146 12,437 13,549
SIGNIFICANT NON-CASH INVESTING AND FINANCING ACTIVITIES:Capital expenditures in accounts payable and accrued expenses................................................. 318 908 733
The Notes to Consolidated Financial Statements are an integral part of these consolidated financial statements.

F-7
MASTERCRAFT BOAT HOLDINGS, INC. AND SUBSIDIARIESNOTES TO CONSOLIDATED FINANCIAL STATEMENTS
(Unless otherwise noted, dollars in thousands, except per share data and per unit data)
1. SIGNIFICANT ACCOUNTING POLICIES
Organization � MasterCraft Boat Holdings, Inc. (�Holdings�) was formed on January 28, 2000, as a Delaware holding company andoperates primarily through its wholly owned subsidiaries, MasterCraft Boat Company, LLC; MasterCraft Services, LLC; MasterCraftParts, Ltd.; and MasterCraft International Sales Administration, Inc. (collectively �MasterCraft�); Nautic Star, LLC and NS Transport,LLC (collectively �NauticStar�); and Crest Marine, LLC (�Crest�). The Company acquired NauticStar on October 2, 2017 and Creston October 1, 2018. Holdings and its subsidiaries collectively are referred to herein as the �Company.�
Segment Information� Operating segments are identified as components of an enterprise about which discrete financial informationis available for evaluation by the chief operating decision maker in making decisions on how to allocate resources and assessperformance. The Company views its operations in three operating segments based on its operations and management structures:MasterCraft, NauticStar, and Crest (see Note 13).
Basis of Presentation � The accompanying financial statements are prepared in accordance with accounting principles generallyaccepted in the United States of America (�U.S. GAAP�). The consolidated financial statements include the accounts of the Companyand its wholly owned subsidiaries from the dates of their acquisitions.
Principles of Consolidation� The consolidated financial statements include the accounts of the Company and its wholly ownedsubsidiaries. All significant intercompany accounts and transactions have been eliminated in consolidation.
Holdings has no independent operations and no material assets, other than its wholly owned equity interests of MasterCraft,NauticStar, and Crest, which totaled $163.0 million as of June 30, 2020 and 2019, and no material liabilities. As of June 30, 2020,Holdings had no material contingencies, long-term obligations, or guarantees other than a guarantee of the Company�s subsidiaries�long-term debt (see Note 8).
Use of Estimates � The preparation of the Company�s consolidated financial statements in conformity with U.S. GAAP requiresmanagement to make estimates and assumptions that affect the reported amounts of assets, liabilities, revenues, and expenses andrelated disclosures. The Company bases these estimates on historical results and various other assumptions believed to be reasonable.The Company�s most significant financial statement estimates include warranty liability, dealer incentives liability, fair value of share-based compensation, inventory repurchase contingent obligation, unrecognized tax positions, impairment of long-lived assets andintangible assets subject to amortization, impairment of goodwill and indefinite-lived intangible assets, and potential litigation claimsand settlements. Actual results could differ from those estimates.
Reclassifications � Certain historical amounts have been reclassified in the accompanying consolidated financial statements toconform to the current presentation.
Revenue Recognition� The Company�s revenue is derived primarily from the sale of boats and trailers, marine parts, andaccessories to its independent dealers. The Company recognizes revenue when obligations under the terms of a contract are satisfiedand control over promised goods is transferred to a customer. For the majority of sales, this occurs when the product is released to thecarrier responsible for transporting it to a customer. The Company typically receives payment within 5 business days of shipment.Revenue is measured as the amount of consideration it expects to receive in exchange for a product. The Company offers dealerincentives that include wholesale rebates, retail rebates and promotions, floor plan reimbursement or cash discounts, and otherallowances that are recorded as reductions of revenues in Net sales in the consolidated statements of operations. The considerationrecognized represents the amount specified in a contract with a customer, net of estimated incentives the Company reasonably expectsto pay. The estimated liability and reduction in revenue for dealer incentives is recorded at the time of sale. Subsequent adjustments toincentive estimates are possible because actual results may differ from these estimates if conditions dictate the need to enhance orreduce sales promotion and incentive programs or if dealer achievement or other items vary from historical trends. Accrued dealerincentives are included in Accrued expenses and other current liabilities in the accompanying consolidated balance sheets.

F-8
Rebates and Discounts
Dealers earn wholesale rebates based on purchase volume commitments and achievement of certain performance metrics. TheCompany estimates the amount of wholesale rebates based on historical achievement, forecasted volume, and assumptions regardingdealer behavior. Rebates that apply to boats already in dealer inventory are referred to as retail rebates. The Company estimates theamount of retail rebates based on historical data for specific boat models adjusted for forecasted sales volume, product mix, dealer andconsumer behavior, and assumptions concerning market conditions. The Company also utilizes various programs whereby it offerscash discounts or agrees to reimburse its dealers for certain floor plan interest costs incurred by dealers for limited periods of time,generally ranging up to nine months.
Shipping and Handling Costs
Shipping and handling costs includes those costs incurred to transport product to customers and internal handling costs, which relate toactivities to prepare goods for shipment. The Company has elected to account for shipping and handling costs associated withoutbound freight after control over a product has transferred to a customer as a fulfillment cost. The Company includes shipping andhandling costs, including costs billed to customers, in Cost of sales in the consolidated statements of operations.
Contract Liabilities
A contract liability is created when customers prepay for goods prior to the Company transferring those goods to the customer. Thecontract liability is reduced once control of the goods is transferred to the customer. The difference between the opening and closingbalances of the Company�s contract liabilities primarily results from the timing difference between the Company�s performance andthe point at which it receives pre-payment from the customer.
Other Revenue Recognition Matters
Dealers generally have no right to return unsold boats. Occasionally, the Company may accept returns in limited circumstances and atthe Company�s discretion under its warranty policy. The Company may be obligated, in the event of default by a dealer, to acceptreturns of unsold boats under its repurchase commitment to floor financing providers, who are able to obtain such boats throughforeclosure. The repurchase commitment is on an individual unit basis with a term from the date it is financed by the lendinginstitution through the payment date by the dealer, generally not exceeding 30 months. The Company accounts for these arrangementsas guarantees and recognizes a liability based on the estimated fair value of the repurchase obligation. The estimated fair value takesinto account our estimate of the loss we will incur upon resale of any repurchases. The Company accrues the estimated fair value ofthis obligation based on the age of inventory currently under floor plan financing and estimated credit quality of dealers holding theinventory. Inputs used to estimate this fair value include significant unobservable inputs that reflect the Company�s assumptions aboutthe inputs that market participants would use and, therefore, this liability is classified within Level 3 of the fair value hierarchy.
The Company has excluded sales and other taxes assessed by a governmental authority in connection with revenue-producingactivities from the determination of the transaction price for all contracts. The Company has not adjusted Net sales for the effects of asignificant financing component because the period between the transfer of the promised goods and the customer's payment isexpected to be one year or less.
Accounts Receivable� Accounts receivable represents amounts billed to customers under credit terms customary in its industry. TheCompany normally does not charge interest on its accounts receivable. The Company determines its allowance for doubtful accountsby considering a number of factors, including the length of time trade accounts receivable are past due, the Company�s previous losshistory, the customer�s current ability to pay its obligation to the Company, and the condition of the general economy and the industryas a whole. The Company writes-off accounts receivable when they become uncollectible, and payments subsequently received onsuch receivables are credited to bad debt recovery. Amounts recorded as bad debt expense, write-offs, and recoveries were notmaterial for the years ended June 30, 2020, 2019, and 2018.
Cash and Cash Equivalents� The Company considers all highly-liquid investments with an original maturity of three months or lessto be cash and cash equivalents. The Company�s cash deposits may at times exceed federally insured amounts. The Company had nocash equivalents at June 30, 2020 and 2019.
Concentrations of Credit and Business Risk� Financial instruments that potentially subject the Company to concentrations of creditrisk primarily consist of trade receivables. Credit risk on trade receivables is mitigated as a result of the Company�s use of trade lettersof credit, dealer floor plan financing arrangements, and the geographically diversified nature of the Company�s customer base.

F-9
Supplier Concentrations
The Company is dependent on the ability of its suppliers to provide products on a timely basis and on favorable pricing terms. Theloss of certain principal suppliers or a significant reduction in product availability from principal suppliers could have a materialadverse effect on the Company. Business risk insurance is in place to mitigate the business risk associated with sole suppliers forsudden disruptions such as those caused by natural disasters.
The Company is dependent on third-party equipment manufacturers, distributors, and dealers for certain parts and materials utilized inthe manufacturing process. During the years ended June 30, 2020, 2019, and 2018 the Company purchased all engines for itsMasterCraft performance sport boats under a supply agreement with a single vendor. Total purchases to this vendor were $27.6million, $39.3 million, and $34.7 million for the years ended June 30, 2020, 2019, and 2018, respectively. During the years ended June30, 2020 and 2019, the Company purchased a majority of engines for its NauticStar boats under a supply agreement with one vendor.Total purchases from this vendor were $15.2 million, $23.7 million, and $19.7 million for the years ended June 30, 2020. 2019, and2018, respectively. During the years ended June 30, 2020 and 2019, the Company purchased a majority of the engines for its Crestboats under a supply agreement with a single vendor. Total purchases from this vendor were $15.5 million and $20.4 million for theyears ended June 30, 2020 and 2019, respectively.
Inventories� Inventories are valued at the lower of cost or net realizable value and are shown net of an inventory allowance in theconsolidated balance sheet. Inventory cost includes material, labor, and manufacturing overhead and is determined based on the first-in, first-out (FIFO) method. Provisions are made as necessary to reduce inventory amounts to their net realizable value or to providefor obsolete inventory.
Property, Plant, and Equipment� Property, plant, and equipment are recorded at historical cost less accumulated depreciation andare depreciated on a straight-line basis over the estimated useful lives. Repairs and maintenance are charged to operations as incurred,and expenditures for additions and improvements that increase the asset�s useful life are capitalized.
Ranges of asset lives used for depreciation purposes are:
Buildings and improvements ................................................................................................................................ 7 - 40yearsMachinery and equipment..................................................................................................................................... 3 - 7yearsFurniture and fixtures............................................................................................................................................ 3 - 7years
Goodwill and Other Intangible Assets� The Company does not amortize goodwill and other purchased intangible assets withindefinite lives. The Company�s intangible assets with finite lives consist primarily of dealer networks and are carried at theirestimated fair values at the time of acquisition, less accumulated amortization. Amortization is recognized on a straight-line basis overthe estimated useful lives of the respective assets (see Note 6). Intangible assets that are subject to amortization are evaluated forimpairment using a process similar to that used to evaluate long-lived assets described below. All of the Company�s goodwill andother intangible assets relate to our MasterCraft, NauticStar, or Crest reporting units (see Note 13).
Goodwill
Goodwill results from the excess of purchase price over the net identifiable assets of businesses acquired. The Company reviewsgoodwill for impairment annually, at fiscal yearend, and whenever events or changes in circumstances indicate that the fair value of areporting unit may be below its carrying value. As part of the annual test, the Company may perform a qualitative, rather thanquantitative, assessment to determine whether the fair values of its reporting units are �more likely than not� to be greater than theircarrying values. In performing this qualitative analysis, the Company considers various factors, including the effect of market orindustry changes and the reporting units' actual results compared to projected results.
If the fair value of a reporting unit does not meet the "more likely than not" criteria discussed above, the impairment test for goodwillis a quantitative test. This test involves comparing the fair value of the reporting unit with its carrying value. If the fair value exceedsthe carrying value, goodwill is not considered impaired. If the carrying amount exceeds the fair value then the goodwill is consideredimpaired and an impairment loss is recognized in an amount by which the carrying value exceeds the reporting unit�s fair value, not toexceed the carrying amount of the goodwill allocated to that reporting unit.
The Company calculates the fair value of its reporting units by considering both the income approach and market approach. Theincome approach calculates the fair value of the reporting unit using a discounted cash flow method. Internally forecasted future cashflows, which the Company believes reasonably approximate market participant assumptions, are discounted using a weighted averagecost of capital (�Discount Rate�) developed for each reporting unit. The Discount Rate is developed using observable market inputs,

F-10
as well as considering whether or not there is a measure of risk related to the specific reporting unit�s forecasted performance. Fairvalue under the market approach is determined for each unit by applying market multiples for comparable public companies to theunit�s financial results. The key uncertainties in these calculations are the assumptions used in determining the reporting unit�sforecasted future performance, including revenue growth and operating margins, as well as the perceived risk associated with thoseforecasts in determining the Discount Rate, along with selecting representative market multiples.
During the years ended June 30, 2020 and 2019, the Company performed quantitative impairment tests for all three reporting units anddetermined that goodwill attributable to the NauticStar and Crest reporting units was impaired. As a result, the Company recognizedassociated impairment charges during each of those fiscal years (see Note 6). The Company recognized no impairments related togoodwill for the year ended June 30, 2018.
Other Intangible Assets
The Company's primary intangible assets other than goodwill are dealer networks and trade names acquired in business combinations.These intangible assets are initially valued using a methodology commensurate with the intended use of the asset. The dealer networkswere valued using an income approach, which requires an estimate or forecast of the expected future cash flows from the dealernetwork through the application of the multi-period excess earnings approach. The fair value of trade names is measured using arelief-from-royalty approach, a variation of the income approach, which requires an estimate or forecast of the expected future cashflows. This method assumes the value of the trade name is the discounted cash flows of the amount that would be paid to third partieshad the Company not owned the trade name and instead licensed the trade name from another company. The basis for future salesprojections for these methods are based on internal revenue forecasts by reporting unit, which the Company believes representreasonable market participant assumptions. The future cash flows are discounted using an applicable Discount Rate as well as anypotential risk premium to reflect the inherent risk of holding a standalone intangible asset.
The key uncertainties in these fair value calculations, as applicable, are: assumptions used in developing internal revenue growth anddealer expense forecasts, assumed dealer attrition rates, the selection of an appropriate royalty rate, as well as the perceived riskassociated with those forecasts in determining the Discount Rate.
The costs of amortizable intangible assets, including dealer networks, are recognized over their expected useful lives, approximatelyten years for the dealer networks, using the straight-line method. Intangible assets that are subject to amortization are evaluated forimpairment using a process similar to that used to evaluate long-lived assets described below. Intangible assets not subject toamortization are assessed for impairment at least annually and whenever events or changes in circumstances indicate that it is morelikely than not that an asset may be impaired. The impairment test for indefinite-lived intangible assets consists of a comparison of thefair value of the intangible asset with its carrying amount. An impairment loss is recognized for the amount by which the carryingvalue exceeds the fair value of the asset.
During the years ended June 30, 2020 and 2019, the Company performed quantitative impairment tests for intangible assets anddetermined that trade names attributable to the NauticStar and Crest were impaired. As a result, the Company recognized associatedimpairment charges during each of those fiscal years (see Note 6). The Company recognized no impairments related to otherintangible assets for the year ended June 30, 2018.
Long-Lived Assets Other than Intangible Assets � The Company assesses the potential for impairment of its long-lived assets iffacts and circumstances, such as declines in sales, earnings, or cash flows or adverse changes in the business climate, suggest that theymay be impaired. The Company performs its review by comparing the book value of the assets to the estimated future undiscountedcash flows associated with the assets. If any impairment in the carrying value of its long-lived assets is indicated, the assets would beadjusted to an estimate of fair value. The Company incurred no such impairments during the years ended June 30, 2020, 2019, and2018.
Income Taxes� Income tax expense is the total of the current year income tax due or refundable and the change in deferred taxassets and liabilities. The Company records its global tax provision based on the respective tax rules and regulations for thejurisdictions in which it operates. Deferred tax assets and liabilities are the expected future tax amounts for the temporary differencesbetween carrying amounts and tax bases of assets and liabilities, computed using enacted tax rates.
Valuation allowances are recorded to reduce deferred tax assets when it is more likely than not that a tax benefit will not berealized. Significant judgment is required in evaluating the need for and magnitude of appropriate valuation allowances againstdeferred tax assets. The realization of these assets is dependent on generating future taxable income.

F-11
A tax position is recognized as a benefit only if it is �more likely than not� that the tax position would be sustained in a taxexamination, with a tax examination being presumed to occur. The amount recognized is the largest amount of tax benefit that isgreater than 50% likely of being realized on examination. For tax positions not meeting the �more likely than not� test, no tax benefitis recorded.
The Company recognizes interest and/or penalties related to income tax matters in income tax expense.
In determining the amount of current and deferred tax the Company takes into account the impact of uncertain tax positions andwhether additional taxes, interest and penalties may be due. The Company believes that its accruals for tax liabilities are adequate forall open tax years based on its assessment of many factors, including interpretations of tax law and prior experience. This assessmentrelies on estimates and assumptions and may involve a series of judgments about future events. New information may becomeavailable that causes the Company to change its judgment regarding the adequacy of existing tax liabilities; such changes to taxliabilities will have an impact on tax expense in the period that such a determination is made. The income tax effects of the differenceswe identify are classified as deferred tax assets and liabilities in our consolidated balance sheets.
Product Warranties� The Company offers warranties on the sale of certain products for periods of between one and five years.These warranties require us or our dealers to repair or replace defective products during the warranty period at no cost to theconsumer. We estimate the costs that may be incurred under our basic limited warranty and record as a liability the amount of suchcosts at the time the product revenue is recognized. Factors that affect our warranty liability include the number of units sold,historical and anticipated rates of warranty claims, and cost per claim. We periodically assess the adequacy of the recorded warrantyliabilities and adjust the amounts as actual claims are determined or as changes in the obligations become reasonably estimable.
Research and Development� Research and development expenditures are expensed as incurred. Research and development expensefor the years ended June 30, 2020, 2019, and 2018 was $5.2 million, $5.6 million, and $4.9 million, respectively, and is included inOperating expenses in the consolidated statements of operations.
Self-Insurance� The Company is self-insured for certain losses relating to product liability claims and employee medical claims.The Company has purchased stop-loss coverage in order to limit its exposure to any significant levels under these plans. Losses areaccrued based on the Company�s estimates of the aggregate liability for self-insured claims incurred using certain actuarialassumptions followed in the insurance industry and the Company�s historical experience.
Deferred Debt Issuance Costs � Certain costs incurred to obtain financing are capitalized and amortized over the term of the relateddebt using the effective interest method. For the years ended June 30, 2020, 2019, and 2018 the Company incurred deferred financingcosts of $0.3 million, $0.7 million, and $1.2 million, respectively. For the years ended June 30, 2020, 2019, and 2018 the Companyrecorded related amortization expense of $0.6 million, $0.6 million, and $0.5 million, respectively.
Share-Based Compensation � The Company records amounts for all share-based compensation, including grants of restricted stockawards, performance stock units, and nonqualified stock options over the vesting period in the consolidated statements of operationsbased on their fair values at the date of the grant. Forfeitures of share-based compensation, if any, are recognized as they occur. Share-based compensation costs are included in Selling, general and administrative expense in the consolidated statements of Operations.See Note 10 � Share-Based Compensation for a description of the Company's accounting for share-based compensation plans.
Advertising� Advertising costs are expensed when the advertising first takes place. Advertising expense recognized during the yearsended June 30, 2020, 2019, and 2018, was $7.0 million, $9.3 million, and $6.8 million, respectively, and is included in Selling andmarketing expenses in the consolidated statements of operations.
Fair Value Measurements � The Company measures certain of its financial assets and liabilities at fair value and utilizes theestablished framework for measuring fair value and disclosing information about fair value measurements. Fair value is the exchangeprice that would be received for an asset or paid to transfer a liability (exit price) in the principal or most advantageous market for theasset or liability in an orderly transaction between market participants on the measurement date. There are three levels of inputs thatmay be used to measure fair values:
Level 1� Quoted prices (unadjusted) for identical assets or liabilities in active markets that the entity has the ability to access as ofthe measurement date.
Level 2� Significant other observable inputs other than Level 1 prices such as quoted prices for similar assets or liabilities; quotedprices in markets that are not active; or other inputs that are observable or can be corroborated by observable market data.
F-12
Level 3� Significant unobservable inputs that reflect a company�s own assumptions about the inputs that market participants woulduse in pricing an asset or liability.
When measuring fair value, the Company considers the principal or most advantageous market in which it would transact andconsiders assumptions that market participants would use when pricing the asset or liability. When possible, the Company looks toactive and observable markets to price identical assets. When identical assets are not traded in active markets, the Company looks tomarket observable data for similar assets. The Company�s most significant financial asset or liability measured at fair value on arecurring basis is its inventory repurchase contingent obligation (see �Revenue Recognition - Other Revenue Recognition Matters�and Note 11).
Fair Value of Financial Instruments� The carrying amounts of the Company�s financial instruments, consisting of cash and cashequivalents, accounts receivable, accounts payable and other liabilities, approximate their estimated fair values due to the relativeshort-term nature of the amounts. The carrying amount of debt approximates fair value due to variable interest rates at customaryterms and rates the Company could obtain in current financing.
Earnings Per Common Share� Basic earnings per common share reflects reported earnings divided by the weighted averagenumber of common shares outstanding during the reporting period. Diluted earnings per common share include the effect of dilutivestock options and restricted share awards, unless inclusion would not be dilutive.
Postretirement Benefits � The Company has a defined contribution plan and makes contributions including matching anddiscretionary contributions which are based on various percentages of compensation, and in some instances are based on the amountof the employees' contributions to the plans. The expense related to the defined contribution plans was $1.2 million, $1.2 million, and$0.8 million for the years ended June 30, 2020, 2019, and 2018, respectively. Comparability between the years ended June 30, 2019and 2018 was impacted, primarily, by the acquisition of Crest and NauticStar during the years ended June 30, 2019 and 2018,respectively (See Note 3).
COVID-19 Pandemic� The outbreak of a novel coronavirus throughout the world, including the United States, during early calendaryear 2020 has caused widespread business and economic disruption through mandated and voluntary business closings and restrictionson the movement and activities of people (�COVID-19 Pandemic�). We are subject to risks and uncertainties as a result of theCOVID-19 Pandemic. The extent of the impact of the COVID-19 Pandemic on the Company's business is highly uncertain anddifficult to predict, as the response to the COVID-19 Pandemic is rapidly evolving in many countries, including the United States andother markets where the Company operates. It is expected that many of the Company's consumers, dealers, and suppliers could beimpacted by these closings and restrictions which could materially and adversely affect demand for our products, our ability to obtainor deliver inventory, and our ability to collect accounts receivables as our dealers and financing counterparties face higher liquidityand solvency risk. Furthermore, capital markets and economies worldwide have also been negatively impacted by the COVID-19Pandemic, and it has caused economic downturns or recessions in the U.S. and other markets where the Company operates. Sucheconomic disruption could have a material adverse effect on our business as retail demand for our products could decline which wouldin-turn reduce wholesale demand from our dealers. Policymakers around the world have responded with fiscal and monetary policyactions to support the economy. The magnitude and overall effectiveness of these actions remains uncertain.
To balance wholesale production with the then anticipated impacts to retail demand caused by the economic impacts of the COVID-19Pandemic, we reduced production in February 2020 and, in late March 2020, temporarily suspended manufacturing operations at all ofour facilities to protect the health of our employees and comply with governmental mandates. As a result of this action, the Companytemporarily laid off nearly all of its hourly workforce. We resumed operations at all our manufacturing facilities by mid-May 2020.Our facilities resumed operations with new temperature screening, social distancing, personal protective equipment, and cleaningprotocols to protect our employees and mitigate risk of further business interruption. The Company continues to evaluate and monitorthe health and safety of its employees and will adhere to federal and local government mandates and guidelines.
The severity of the impact of the COVID-19 Pandemic on the Company's business will depend on a number of factors, including, butnot limited to, the duration, spread, severity, and impact of the pandemic, the remedial actions and stimulus measures adopted by localand federal governments, the effects of the pandemic on the Company's consumers, dealers, suppliers and workforce, and to the extentnormal economic and operating conditions can resume, all of which are uncertain and cannot be predicted. The Company's futureresults of operations, cash flows, and liquidity could be adversely impacted by delays in payments of outstanding receivable amountsbeyond normal payment terms, supply chain or workforce disruptions and uncertain demand, additional goodwill and other intangibleasset impairment charges (see Note 6), and the impact of any initiatives that the Company may undertake to address financial andoperational challenges faced by it and its consumers, dealers, and suppliers. As of the date of issuance of these consolidated financialstatements, the extent to which the COVID-19 Pandemic may materially impact the Company's financial condition, liquidity, orresults of operations is uncertain.

F-13
New Accounting Pronouncements Issued And Adopted
Leases � In February 2016, the Financial Accounting Standards Board (�FASB�) issued ASU 2016-02, Leases, (�ASC 842�) which,among other things, requires lessees to recognize assets and liabilities on the balance sheet for all operating leases. On July 1, 2019,the Company adopted ASC 842 and all related amendments. The Company elected the optional transition method provided by theFASB in ASU 2018-11, Leases (Topic 842): Targeted Improvements, and as a result, has not restated its consolidated financialstatements for prior periods presented. The Company has elected the package of practical expedients upon transition which allowedthe Company to retain the lease classification for any leases that existed prior to adoption, to not reassess whether any contractsentered into prior to adoption are leases, and to not reassess initial direct costs for any leases that existed prior to adoption. In addition,the Company elected not to record on the consolidated balance sheet any lease with a term of twelve months or less.
ASC 842 did not have a material impact on the Company's consolidated statements of operations. The cumulative effect of thechanges made to the Company's consolidated balance sheet as of July 1, 2019 for the adoption of ASC 842 was as follows:
Balance as of Adjustments Balance as ofJune 30, 2019 Due to ASC 842 July 1, 2019
AssetsOther long-term assets........................................................................... $ 253 $ 3,931 $ 4,184
Current liabilitiesAccrued expenses and other current liabilities...................................... 41,421 547 41,968
Long-term liabilitiesOther long-term liabilities ..................................................................... � 3,384 3,384
The Company leases various equipment under operating lease arrangements. The Company determines if an arrangement is a lease atlease inception. Operating lease right-of-use (�ROU�) assets and operating lease liabilities are recognized based on the present valueof the future minimum lease payments over the lease term at the commencement date. Because the rates implicit in the Company'slease contracts are not readily determinable, the Company uses its incremental borrowing rate based on information available at thecommencement date in determining the present value of future payments. The incremental borrowing rate is estimated to approximatethe interest rate on a collateralized basis with similar terms and payments, and in economic environments where the leased asset islocated. The operating lease ROU asset also includes any initial direct costs and lease payments made prior to lease commencementand excludes lease incentives incurred.
The Company's lease terms may include options to extend or terminate the lease when it is reasonably certain that we will exercisethat option. Operating lease expense is recognized on a straight-line basis over the lease term. The Company may enter into leaseagreements that contain both lease and non-lease components, which it has elected to account for as a single lease component for allasset classes. See Note 11 for information regarding the Company�s leases.
Share-Based Compensation � In June 2018, the Financial Accounting Standards Board issued ASU 2018-07, Compensation�StockCompensation (Topic 718): Improvements to Nonemployee Share-Based Payment Accounting. This guidance provides clarity andreduces complexity when applying the guidance in Topic 718, Compensation�Stock Compensation to the term or condition of share-based payments to nonemployees. ASU 2018-07 is effective for annual reporting periods, and interim periods therein, beginning afterDecember 15, 2018. The Company adopted this guidance for its fiscal year beginning July 1, 2019. The adoption of this standard didnot have a material impact on the consolidated financial statements.
New Accounting Pronouncements Issued But Not Yet Adopted
Fair Value Measurements � In August 2018, the FASB issued ASU 2018-13, Fair Value Measurement (Topic 820): DisclosureFramework�Changes to the Disclosure Requirements for Fair Value Measurement. This guidance modifies the disclosurerequirements on fair value measurements in Topic 820 by removing disclosures regarding transfers between Level 1 and Level 2 ofthe fair value hierarchy, by modifying the measurement uncertainty disclosure, and by requiring additional disclosures for Level 3 fairvalue measurements, among others. The amendments are effective for all entities for fiscal years, and interim periods within thosefiscal years, beginning after December 15, 2019. The Company does not expect the adoption of this new guidance to have a materialimpact on the consolidated financial statements.

F-14
Current Expected Credit Loss � In June 2016, the FASB issued ASU 2016-13, Measurement of Credit Losses on FinancialInstruments, which updated the ASC to use an impairment model that is based on expected losses rather than incurred losses. TheCompany will adopt this guidance for its fiscal year beginning July 1, 2020. Our evaluation of this guidance is substantially complete,and the adoption of this standard is not expected to have a material impact on the consolidated financial statements.
2. REVENUE RECOGNITION
The following table presents the Company�s revenue by major product category for each reportable segment.
Year Ended June 30, 2020 Year Ended June 30, 2019MasterCraft NauticStar Crest(a) Total MasterCraft NauticStar Crest(a) Total
Major Product Categories:Boats and trailers .............................. $ 236,108 $ 54,473 $ 60,888 $ 351,469 $ 301,010 $ 77,896 $ 75,742 $ 454,648Parts .................................................. 9,731 448 591 10,770 9,471 85 498 10,054Other revenue ................................... 616 9 209 834 1,349 14 316 1,679
Total .................................................... $ 246,455 $ 54,930 $ 61,688 $ 363,073 $ 311,830 $ 77,995 $ 76,556 $ 466,381
(a) Crest was acquired on October 1, 2018.
Sales outside of North America accounted for 4.8%, 5.2%, and 7.5% of the Company�s net sales for the years ended June 30, 2020,2019, and 2018, respectively. The Company had no significant concentrations of sales to individual dealers or in countries outside ofNorth America during the years ended June 30, 2020, 2019, and 2018.
Contract Liabilities
As of June 30, 2019, the Company had $0.8 million of contract liabilities associated with customer deposits. During the year endedJune 30, 2020, all of this amount was recognized as revenue. As of June 30, 2020, total contract liabilities were $0.6 million, werereported in Accrued expenses and other current liabilities on the consolidated balance sheet and are expected to be recognized asrevenue during the year ended June 30, 2021.
See Note 1 for a description of the Company�s significant revenue recognition policies.
3. ACQUISITIONS
Fiscal 2019 Acquisition
On October 1, 2018, the Company completed its acquisition of Crest for $81.7 million. Crest, a manufacturer of pontoons, expands theCompany�s product portfolio. Proceeds from the $80.0 term loan (see Note 8) were used to fund this acquisition.
The following table is a summary of the assets acquired, liabilities assumed, and net cash consideration paid for Crest during fiscal2019:
Fair ValueAccounts receivable ......................................................................................................................................... $ 5,215Inventories ........................................................................................................................................................ 9,853Other current assets .......................................................................................................................................... 179Property, plant and equipment ......................................................................................................................... 1,840Identifiable intangible assets(a) ......................................................................................................................... 35,245Current liabilities.............................................................................................................................................. (6,841)Fair value of assets acquired and liabilities assumed....................................................................................... 45,491Goodwill(a) ........................................................................................................................................................ 36,238
Net cash consideration paid ........................................................................................................................ $ 81,729
(a) The goodwill and other intangible assets recorded for the Crest acquisition are deductible for tax purposes.

F-15
Fair ValueEstimated Useful
Life (in years)Definite-lived intangible assets:
Dealer network............................................................................................................... $ 18,000 10Software ......................................................................................................................... 245 5
Indefinite-lived intangible asset:Trade name..................................................................................................................... 17,000
Total identifiable intangible assets .......................................................................... $ 35,245
Related Party Transactions
In connection with the operations of Crest, the Company made rental payments to Crest Marine Real Estate LLC (�Real Estate�) for amanufacturing facility, storage and office building (the �Crest Facility�). One of the minority owners of Real Estate is a member of theCrest management team. The lease was to expire on September 30, 2028, and was subject to four consecutive, five-year renewalperiods. The lease terms included an option for the Company to purchase the Crest Facility for an amount equal to its fair marketvalue, as determined by appraisals and negotiation between the Company and Real Estate (the �Purchase Option�). The annual rentunder the lease was $0.3 million for the first five years of the lease term, and was to increase to $0.4 million for the remaining fiveyears. Additionally, at the beginning of each of the optional renewal terms the rent was to be adjusted based on the change in theConsumer Price Index. In accordance with the Purchase Option, on October 24, 2019 the Company purchased the Crest Facility for$4.1 million. See Note 11 for additional information regarding the purchase.
Crest purchases fiberglass component parts from a supplier whose minority owner was the same member of the Crest managementteam that has a minority ownership interest in Real Estate. On January 31, 2020 this minority ownership interest was divested and thissupplier ceased being a related party. During the period beginning July 1, 2019 and ending January 31, 2020, the Company purchased$1.8 million of products from the supplier. During the year ended June 30, 2019, the Company purchased $2.8 million of productsfrom the supplier.
Pro Forma Financial Information
The following unaudited pro forma consolidated results of operations for the fiscal years ended June 30, 2019 and 2018, assumes thatthe acquisition of NauticStar (acquired on October 2, 2017) and Crest (acquired on October 1, 2018) occurred as of the beginning ofthe earliest period presented in the consolidated financial statements. The unaudited pro forma financial information combineshistorical results of MasterCraft, NauticStar, and Crest with adjustments for depreciation and amortization attributable to fair valueestimates on acquired tangible and intangible assets for the respective periods. Non-recurring pro forma adjustments associated withthe fair value step up of inventory were included in the reported pro forma cost of sales and earnings. The unaudited pro formafinancial information is not indicative of the results of operations that would have been achieved if the acquisitions had taken place atthe beginning of fiscal year 2018, or the results that may occur in the future:
Fiscal Years Ended2019 2018
Net sales ...........................................................................................................................$ 487,374 $ 423,630Net income .......................................................................................................................$ 21,619 $ 38,269Basic earnings per share ...................................................................................................$ 1.16 $ 2.06Diluted earnings per share................................................................................................$ 1.15 $ 2.04
4. INVENTORIES
Inventories consisted of the following:As of June 30,
2020 2019Raw materials and supplies ............................................................................................ $ 18,318 $ 20,034Work in process.............................................................................................................. 3,866 4,571Finished goods................................................................................................................ 4,876 7,207Obsolescence reserve ..................................................................................................... (1,424) (1,152)
Total inventories .......................................................................................................... $ 25,636 $ 30,660

F-16
5. PROPERTY, PLANT, AND EQUIPMENT
Property, plant, and equipment, net consisted of the following:
As of June 30,2020 2019
Land and improvements ............................................................................................... $ 3,030 $ 1,901Buildings and improvements........................................................................................ 22,366 15,652Machinery and equipment ............................................................................................ 38,262 29,804Furniture and fixtures ................................................................................................... 2,229 1,719Construction in progress............................................................................................... 1,312 4,866
Total property, plant, and equipment......................................................................... 67,199 53,942Less accumulated depreciation..................................................................................... (26,718) (20,306)
Property, plant, and equipment, net........................................................................... $ 40,481 $ 33,636
Depreciation expense for the years ended June 30, 2020, 2019, and 2018 was $6.6 million, $4.3 million, and $3.5 million,respectively.
Subsequent Event
On August 13, 2020, the Company entered into an agreement to purchase certain real and personal property located in Merritt Island,Florida, including a 140,000 sq. ft. boat manufacturing facility, (the �Property�) for $14.0 million (the �Purchase Agreement�). TheCompany plans to use the Property to expand its boat building capacity. The Purchase Agreement is subject to customary closingconditions and closing is expected to occur in October 2020. The Company expects to use liquidity sources existing as of June 30,2020 to fund this purchase.
6. GOODWILL AND OTHER INTANGIBLE ASSETS
Goodwill and Other Intangible Asset Impairment
The current economic environment, including the significant share price and market volatility, as well as disruptions to supply chainsresulting from the COVID-19 Pandemic, triggered an interim impairment analysis for the Company�s intangible assets includinggoodwill. As a result of this analysis, the Company recorded impairment charges totaling $56.4 million during the three months endedMarch 29, 2020 related to the NauticStar and Crest segments. As of June 30, 2020, our annual impairment test date, the Companyperformed a qualitative assessment and identified no events or circumstances that indicated that there existed a more likely than notprobability of impairment of goodwill and other intangible assets.
The impairment charges recorded for each segment are detailed below and are included in Goodwill and other intangible assetimpairment on the consolidated statement of operations. The impairment recorded in fiscal 2020 was principally a result of a decline,in the fiscal third quarter, in market conditions, including our share price, and the then current outlook for sales and operatingperformance relative to the Company�s acquisition plans and impairment test performed as of June 30, 2019.
During our fiscal 2019 annual assessment of intangible assets including goodwill, the Company recorded impairment charges of $31.0million related to the NauticStar segment. The impairment was principally a result of a decline, in the fiscal fourth quarter, in theoutlook for sales and operating performance relative to our acquisition plan.
See Note 1 for a discussion of the methods used to determine the fair value of goodwill and other intangible assets. In assessing theneed for goodwill and intangible impairment, management utilizes a number of estimates, including operating results, business plans,economic projections, anticipated future cash flows, transactions and marketplace data. Accordingly, these fair value measurementsfall in Level 3 of the fair value hierarchy.

F-17
Goodwill and other intangible asset impairment charges for the years ended June 30, 2020 and 2019 were as follows:
2020 2019NauticStar Crest Consolidated NauticStar Consolidated
Goodwill ....................................................................... $ 8,199 $ 36,238 $ 44,437 $ 28,000 $ 28,000Trade name ................................................................... 5,000 7,000 12,000 3,000 3,000
Total........................................................................ $ 13,199 $ 43,238 $ 56,437 $ 31,000 $ 31,000
While the extent and duration of the economic impact from the COVID-19 pandemic remain unclear, changes in assumptions andestimates may affect the fair value of goodwill and other intangible assets and could result in additional impairment charges in futureperiods.
Goodwill
The carrying amounts of goodwill as of June 30, 2020 and 2019, attributable to each of the Company�s reportable segments, were asfollows:
2020 2019
GrossAmount
AccumulatedImpairment
Losses TotalGross
Amount
AccumulatedImpairment
Losses TotalMasterCraft ......................................................... $ 29,593 $ - $ 29,593 $ 29,593 $ - $ 29,593NauticStar ........................................................... 36,199 (36,199) - 36,199 (28,000) 8,199Crest .................................................................... 36,238 (36,238) - 36,238 - 36,238
Total.............................................................. $ 102,030 $ (72,437) $ 29,593 $ 102,030 $ (28,000) $ 74,030
Other Intangible Assets
The following table presents the carrying amount of Other intangible assets, net as of June 30, 2020 and 2019.
2020 2019
GrossAmount
AccumulatedAmortization/ Impairment
Otherintangibleassets, net
GrossAmount
AccumulatedAmortization/ Impairment
Otherintangibleassets, net
Amortized intangible assets ................................Dealer networks ............................................ $ 39,500 $ (9,810) $ 29,690 $ 39,500 $ (5,909) $ 33,591Software........................................................ 245 (86) 159 245 (37) 208
39,745 (9,896) 29,849 39,745 (5,946) 33,799
Unamortized intangible assetsTrade names.................................................. 49,000 (15,000) 34,000 49,000 (3,000) 46,000
Total other intangible assets ............................... $ 88,745 $ (24,896) $ 63,849 $ 88,745 $ (8,946) $ 79,799
Amortization expense related to Other intangible assets, net for years ended June 30, 2020, 2019 and 2018 was $3.9, $3.5, and $1.6million, respectively.

F-18
The following table presents estimated future amortization expense for the next five fiscal years and thereafter.
Fiscal years ending June 30,2021 .................................................................................................................................................................... $ 3,9502022 .................................................................................................................................................................... 3,9502023 .................................................................................................................................................................... 3,9502024 .................................................................................................................................................................... 3,8062025 .................................................................................................................................................................... 3,793and thereafter ...................................................................................................................................................... 10,400
Total ................................................................................................................................................................. $ 29,849
7. ACCRUED EXPENSES AND OTHER CURRENT LIABILITIES
Accrued expenses and other current liabilities consisted of the following:
As of June 30,2020 2019
Warranty......................................................................................................................... $ 20,004 $ 17,205Dealer incentives ............................................................................................................ 8,448 12,623Compensation and related accruals ................................................................................ 1,488 3,494Floor plan interest........................................................................................................... 732 2,060Inventory repurchase contingent obligation ................................................................... 1,132 1,936Self-insurance................................................................................................................. 704 606Debt interest ................................................................................................................... � 405Other............................................................................................................................... 3,477 3,092
Total accrued expenses and other current liabilities.................................................... $ 35,985 $ 41,421
Accrued warranty liability activity was as follows:
For the Years Ended June 30,2020 2019
Balance at the beginning of the period........................................................................... $ 17,205 $ 13,077Provisions ....................................................................................................................... 7,039 8,056Additions for Crest acquisition ...................................................................................... � 990Payments made............................................................................................................... (7,634) (7,198)Aggregate changes for preexisting warranties ............................................................... 3,394 2,280
Balance at the end of the period .................................................................................. $ 20,004 $ 17,205
Insurance Premium Financing
On March 27, 2020, the Company executed an insurance premium financing agreement of $1.1 million with a premium financecompany in order to finance certain of its annual insurance premiums. Beginning on April 1, 2020, the financing agreement is payablein eleven monthly installments of principal and interest of approximately $0.1 million. The agreement bears interest at 3.6%. Thebalance of the insurance premium financing as of June 30, 2020 was $0.7 million and is recorded in Accrued expenses and othercurrent liabilities.

F-19
8. LONG-TERM DEBT
Long-term debt outstanding was as follows:
As of June 30,2020 2019
Revolving credit facility................................................................................................. $ 10,000 $ �Term loans...................................................................................................................... 99,993 115,349Debt issuance costs on term loans.................................................................................. (1,395) (1,608)
Total debt..................................................................................................................... 108,598 113,741Less current portion of long-term debt........................................................................... 9,420 9,167Less current portion of debt issuance costs on term loans ............................................. (488) (442)
Long-term debt, net of current portion ........................................................................ $ 99,666 $ 105,016
Previously Existing Credit Facility
On October 2, 2017, the Company entered into a Third Amended and Restated Credit and Guaranty Agreement with a syndicate ofcertain financial institutions (the �Third Amended Credit Agreement�). The Third Amended Credit Agreement replaced and paid offthe Company�s Prior Credit Agreement, dated May 27, 2016. The Third Amended Credit Agreement provided the Company with a$145.0 million senior secured credit facility, consisting of a $115.0 million term loan and a $30.0 million revolving credit facility. Aportion of the proceeds from the Third Amended Credit Agreement were used for the Company�s acquisition of NauticStar.
The Third Amended Credit Agreement bore interest, at the Company�s option, at either the prime rate plus an applicable marginranging from 0.75% to 1.75% or at an adjusted LIBOR plus an applicable margin ranging from 1.75% to 2.75%, in each case based onthe Company�s Total Net Leverage Ratio.
Current Credit Facility
On October 1, 2018, the Company entered into a Fourth Amended and Restated Credit and Guaranty Agreement with a syndicate ofcertain financial institutions (the �Fourth Amended Credit Agreement�), which replaced the credit facility discussed above. TheFourth Amended Credit Agreement provides the Company with a $190.0 million senior secured credit facility, consisting of a $75.0million term loan, and an $80.0 million term loan (together, the �Term Loans�), and a $35.0 million revolving credit facility (the�Revolving Credit Facility�). Proceeds from the $80.0 million term loan were used to fund the Crest acquisition. The Fourth AmendedCredit Agreement is secured by substantially all the assets of the Company. Holdings is a guarantor on the Fourth Amended CreditAgreement and the Fourth Amended Credit Agreement contains covenants that restrict the ability of Holdings� subsidiaries to makedistributions to Holdings. The Term Loans will mature and all remaining amounts outstanding thereunder will be due and payable onOctober 1, 2023.

F-20
Amendment to Fourth Amended Credit Agreement
On May 7, 2020, the Company entered into Amendment No. 3 to the Fourth Amended Credit Agreement (the �Amendment�). Thechanges effected by the Amendment include, among others, the temporary removal and replacement of the Company�s financialcovenants, the addition of a 50 basis point floor on LIBOR, modifications to the range of applicable LIBOR and prime interest ratemargins, and a revision of the Total Net Leverage Ratio calculation. Under the Amendment, the Total Net Leverage Ratio covenantand Fixed Charge Coverage Ratio covenant of the Fourth Amended Credit Agreement are temporarily replaced with three separatecovenants: (i) an Interest Coverage Ratio, (ii) a Minimum Liquidity threshold, and (iii) a Maximum Unfinanced Capital Expenditureslimitation (the �Package of Financial Covenants�). The Package of Financial Covenants are in place through the quarter ended March31, 2021, at which time the Total Net Leverage Ratio covenant and Fixed Charge Coverage Ratio covenant will be reinstated and thePackage of Financial Covenants will sunset, and with the minimum liquidity covenant being tested on the last day of each fiscal monththrough May 31, 2021. In addition, the Total Net Leverage Ratio calculation was temporarily revised to include all unrestricted cashbalances, without limitation, until June 30, 2021.
Pursuant to the Amendment, the Company�s debt bore interest at LIBOR, subject to a 50 basis point floor, plus 3.25% through June30, 2020. Beginning on July 1, 2020, the applicable margin, at the Company�s option, is at either the prime rate plus an applicablemargin ranging from 0.5% to 2.25% or at an adjusted LIBOR rate plus an applicable margin ranging from 1.5% to 3.25%, in each casebased on the Company�s Total Net Leverage Ratio.
As of June 30, 2020 and 2019, the effective interest rate on borrowings outstanding was 3.75% and 4.48%, respectively.
Revolving Credit Facility
On March 19, 2020, the Company drew $35.0 million on its Revolving Credit Facility as a precautionary measure in order to increaseits cash position and preserve financial flexibility in light of uncertainty in the global markets resulting from the COVID-19 Pandemic.As of June 30, 2020, the Company had $10.0 million of borrowings outstanding on its Revolving Credit Facility and the availabilityunder the Revolving Credit Facility was $25.0 million.
All amounts outstanding under the Revolving Credit Facility mature in October 2023. As of June 30, 2020, the Company was incompliance with its financial covenants under the Amendment to the Fourth Amended Credit Agreement.
Maturities for the Term Loans and Revolving Credit Facility subsequent to June 30, 2020 are as follows:
2021............................................................................................................................................................... $ 9,4202022............................................................................................................................................................... 11,7752023............................................................................................................................................................... 12,5602024............................................................................................................................................................... 76,238
Total............................................................................................................................................................ $ 109,993
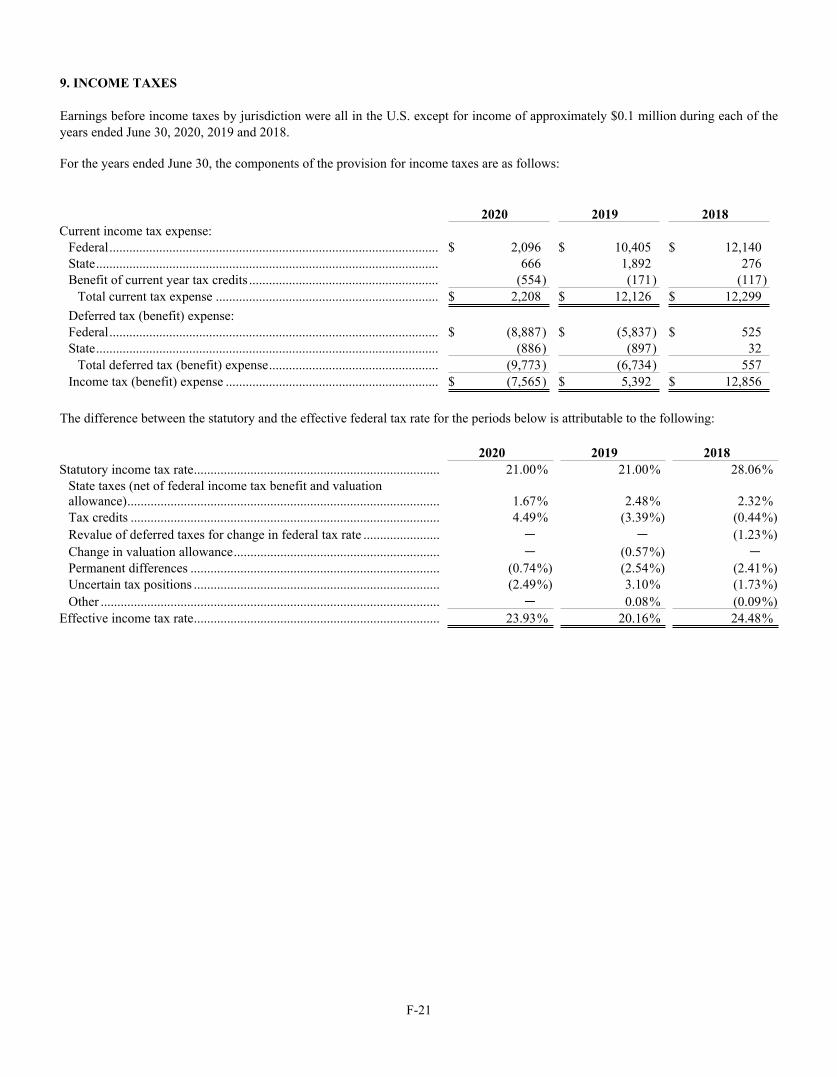
F-21
9. INCOME TAXES
Earnings before income taxes by jurisdiction were all in the U.S. except for income of approximately $0.1 million during each of theyears ended June 30, 2020, 2019 and 2018.
For the years ended June 30, the components of the provision for income taxes are as follows:
2020 2019 2018Current income tax expense:
Federal................................................................................................... $ 2,096 $ 10,405 $ 12,140State....................................................................................................... 666 1,892 276Benefit of current year tax credits ......................................................... (554) (171) (117)
Total current tax expense ................................................................... $ 2,208 $ 12,126 $ 12,299Deferred tax (benefit) expense:Federal................................................................................................... $ (8,887) $ (5,837) $ 525State....................................................................................................... (886) (897) 32
Total deferred tax (benefit) expense................................................... (9,773) (6,734) 557Income tax (benefit) expense ................................................................ $ (7,565) $ 5,392 $ 12,856
The difference between the statutory and the effective federal tax rate for the periods below is attributable to the following:
2020 2019 2018Statutory income tax rate.......................................................................... 21.00% 21.00% 28.06%
State taxes (net of federal income tax benefit and valuationallowance).............................................................................................. 1.67% 2.48% 2.32%Tax credits ............................................................................................. 4.49% (3.39%) (0.44%)Revalue of deferred taxes for change in federal tax rate ....................... � � (1.23%)Change in valuation allowance.............................................................. � (0.57%) �Permanent differences ........................................................................... (0.74%) (2.54%) (2.41%)Uncertain tax positions .......................................................................... (2.49%) 3.10% (1.73%)Other ...................................................................................................... � 0.08% (0.09%)
Effective income tax rate.......................................................................... 23.93% 20.16% 24.48%

F-22
As of June 30, 2020, and 2019, a summary of the significant components of the Company�s deferred tax assets and liabilities was asfollows:
2020 2019Deferred tax assets:
Goodwill and other intangible asset basis difference .................................................. $ 13,776 $ 2,306Warranty reserves ........................................................................................................ 4,616 3,848Accrued selling ............................................................................................................ 850 1,354Unrecognized tax benefits ........................................................................................... 566 520Stock compensation..................................................................................................... 402 704Repurchase agreements ............................................................................................... 261 427State net operating loss ................................................................................................ 14 144Foreign net operating loss ........................................................................................... 63 79Credits.......................................................................................................................... 65 48Other ............................................................................................................................ 570 �Valuation allowance .................................................................................................... (65) (81)
Total deferred tax assets ................................................................................................. 21,118 9,349Deferred tax liabilities:
Depreciation................................................................................................................. (4,839) (3,037)Other ............................................................................................................................ (199) (72)
Total deferred tax liabilities ........................................................................................... (5,038) (3,109)Net deferred tax assets.................................................................................................... $ 16,080 $ 6,240
On March 27, 2020, President Trump signed into law the Coronavirus Aid, Relief, and Economic Security Act (H.R. 748) (the�CARES Act�). Among the changes to the U.S. federal income tax rules, the CARES Act included a revision to depreciation rulesenacted as part of the Tax Cuts and Jobs Act of 2017. In addition to impacting the current fiscal year, the CARES Act results in theability to retroactively apply these regulations to certain assets placed in service during the years ended June 30, 2018 and 2019. TheCompany has evaluated the impacts of the aforementioned provisions and incorporated the necessary changes to tax depreciationmethods. We have not identified any material effect on results of operations, financial condition, or cash flows.
The Tax Cuts and Jobs Act (�Tax Reform Act�), which became effective December 22, 2017, overhauled U.S. corporate income taxlaw by lowering the U.S. federal corporate income tax rate from 35% to 21% (blended rate in year one for fiscal year filers),implementing a territorial tax system, imposing a one time �deemed repatriation� tax on all untaxed offshore earnings, andadding/modifying/deleting several major tax deductions significant to the Company.
As of June 30, 2020, the Company has state net operating loss (NOL) carryforwards of $0.3 million that expire in varying yearsranging from June 30, 2024 to June 30, 2029, and foreign NOL carryforwards of $0.3 million that can be carried forward indefinitely.However, the Company determined that it is more likely than not that the benefit from certain state and foreign NOL carryforwardswill not be realized. In recognition of this risk, the Company has provided a partial valuation allowance on the deferred tax assetsrelating to these state and foreign NOL carryforwards.
Unrecognized Tax Benefits
A reconciliation of the beginning and ending amount of unrecognized tax benefits, excluding accrued amounts for interest andpenalties, is as follows:
2020 2019Balance at July 1............................................................................................................. $ 2,504 $ 1,711
Additions based on tax positions related to the current year ....................................... 110 889Additions for tax positions of prior years .................................................................... 713 473Reductions for tax positions of prior years .................................................................. (164) (25)Settlements of tax positions from prior years .............................................................. (170) (544)
Balance at June 30 .......................................................................................................... $ 2,993 $ 2,504

F-23
Of this total, $2.1 million and $1.9 million as of June 30, 2020 and 2019, respectively, represent the amount of unrecognized taxbenefits that, if recognized, would favorably affect the effective income tax rate in future periods. The total amount of interest andpenalties recorded in the consolidated statements of operations for the years ended June 30, 2020, and 2019 was an expense of $0.3million and $0.1 million, respectively. The amounts accrued for interest and penalties at June 30, 2020 and 2019 were $0.7 million and$0.4 million respectively and is presented in unrecognized tax positions on the accompanying consolidated balance sheets.
In general, it is the practice and intention of the Company to reinvest the earnings of its non-U.S. subsidiaries in those operations. Asof June 30, 2020, the Company has not made a provision for U.S. or additional foreign withholding taxes on investments in foreignsubsidiaries that are indefinitely reinvested. Generally, such amounts become subject to U.S. taxation upon the remittance of dividendsand under certain other circumstances.
The Company and its subsidiaries are subject to U.S. federal income tax, as well as various other state income taxes and foreignincome taxes. The Company is no longer subject to examination by taxing authorities for years before June 30, 2017. The Companyexpects the total amount of unrecognized benefits to increase by approximately $0.2 million in the next twelve months. The Companyrecords unrecognized tax benefits as liabilities and adjusts these liabilities when its judgment changes as a result of the evaluation ofnew information not previously available. Because of the complexity of some of these uncertainties, the ultimate resolution may resultin a payment that is materially different from our current estimate of the unrecognized tax benefit liabilities. These differences will bereflected as increases or decreases to income tax expense in the period in which new information is available.
10. SHARE-BASED COMPENSATION
The 2015 Incentive Award Plan (�2015 Plan�) provides for the grant of stock options, including incentive stock options, andnonqualified stock options (�NSOs�), restricted stock, dividend equivalents, stock payments, restricted stock units, restricted stockawards (�RSAs�), deferred stock, deferred stock units, performance awards, stock appreciation rights, performance stock units(�PSUs�), and cash awards. As of June 30, 2020, there were 1,485,683 shares available for issuance under the 2015 Plan.
The following table presents the components of share-based compensation expense by award type for the years ended June 30, 2020,2019 and 2018.
2020 2019 2018Restricted stock awards ............................................................................ $ 1,285 $ 913 $ 616Performance stock units............................................................................ (233) 563 355Stock options ............................................................................................ 9 201 215
Share-based compensation expense ....................................................... $ 1,061 $ 1,677 $ 1,186
Adjustment to Share-Based Compensation
In conjunction with the resignation of an executive officer in October 2019, approximately $0.5 million of share-based compensationexpense recognized in prior periods was reversed during fiscal 2020 for RSAs and PSUs that were forfeited. Additionally, based uponcurrent economic trends, the probability of attaining the performance criteria of the PSUs has been lowered. The amount ofcompensation cost the Company recognizes over the requisite service period is based on the Company�s best estimate of theachievement of the performance conditions. The amount of compensation expense is adjusted on a cumulative basis; therefore, thisadjustment lowered the amount of share-based compensation expense recognized during the year ended June 30, 2020.
The following table presents the income tax benefit related to share-based compensation expense recognized by award type.
2020 2019 2018Restricted stock awards ............................................................................ $ 290 $ 217 $ 190Performance stock units............................................................................ (53) 134 110Stock options ............................................................................................ 2 48 66
Share-based compensation expense ....................................................... $ 239 $ 399 $ 366

F-24
Restricted Stock Awards
Beginning in the year ended June 30, 2018, all RSAs granted to non-employee directors vest over the remainder of that fiscal year,and all RSAs granted to employees vest over a period of between one to three years. Generally, non-vested RSAs are forfeited ifemployment is terminated prior to vesting. RSAs are granted at a per share fair value equal to the market value of the Company�scommon stock on the grant date. The Company recognizes the cost of non-vested RSAs ratably over the requisite service period.The total grant date fair value of RSAs vested during the years ended June 30, 2020, 2019, and 2018 was $1.0 million , $0.7 millionand $0.4 million, respectively.
A summary of RSA activity for the years ended June 30, 2020, 2019 and 2018, is as follows:
Number of RestrictedStock Awards
Weighted AverageGrant Date Fair
ValueTotal Non-vested Restricted Stock Awards at June 30, 2017 ........................................ 26,417 $ 12.22
Granted ........................................................................................................................ 47,651 19.88Vested .......................................................................................................................... (25,870) 16.79Forfeited ...................................................................................................................... (4,888) 15.89
Total Non-vested Restricted Stock Awards at June 30, 2018 ........................................ 43,310 17.28Granted ........................................................................................................................ 51,995 26.79Vested .......................................................................................................................... (33,093) 21.54Forfeited ...................................................................................................................... (8,408) 23.08
Total Non-vested Restricted Stock Awards at June 30, 2019 ........................................ 53,804 22.94Granted ........................................................................................................................ 138,457 17.41Vested .......................................................................................................................... (50,570) 20.09Forfeited ...................................................................................................................... (34,797) 20.24
Total Non-vested Restricted Stock Awards at June 30, 2020 ........................................ 106,894 18.01
As of June 30, 2020, there was $1.2 million of total unrecognized compensation expense related to non-vested RSAs. The Companyexpects this expense to be recognized over a weighted average period of 1.71 years.
Performance Stock Units
During the years ended June 30, 2020, 2019, and 2018, the Company granted performance shares to certain employees. The awardswill be earned based on the Company�s achievement of certain performance criteria over a three-year performance period. Theperformance period for the awards commence on July 1 of the fiscal year in which they were granted and continue for a three-yearperiod, ending on June 30 of the applicable year. The probability of achieving the performance criteria is assessed quarterly.Following the determination of the Company�s achievement with respect to the performance criteria, the amount of shares awardedwill be subject to adjustment based on the application of a total shareholder return (�TSR�) modifier. The grant date fair value isdetermined based on both the assessment of the probability of the Company�s achieving the performance criteria and an estimate ofthe expected TSR modifier. The TSR modifier estimate is determined by using a Monte Carlo Simulation model, which considers thelikelihood of all possible outcomes of long-term market performance. The amount of compensation cost the Company recognizesover the requisite service period is based on management�s best estimate of the achievement of the performance criteria.
The fair value of PSUs vested during the year ended June 30, 2020 and 2019 was $0.2 million and $0.4 million. No PSUs vestedduring the years ended June 30, 2018.

F-25
A summary of PSU activity for the years ending June 30, 2020, 2019 and 2018, is as follows:
Number ofPerformance Stock
Units
Weighted AverageGrant Date Fair
ValueTotal Non-vested Performance Stock Units at June 30, 2017........................................ 40,612 $ 11.85
Granted ........................................................................................................................ 26,416 19.62Forfeited ...................................................................................................................... (7,700) 14.42
Total Non-vested Performance Stock Units at June 30, 2018........................................ 59,328 14.98Granted ........................................................................................................................ 35,122 25.70Vested .......................................................................................................................... (32,373) 11.85Forfeited ...................................................................................................................... (11,456) 19.73
Total Non-vested Performance Stock Units at June 30, 2019........................................ 50,621 23.34Granted ........................................................................................................................ 72,048 18.18Vested .......................................................................................................................... (8,383) 19.40Forfeited ...................................................................................................................... (46,882) 20.82
Total Non-vested Performance Stock Units at June 30, 2020........................................ 67,404 20.02
As of June 30, 2020, there was $0.2 million of total unrecognized compensation expense related to non-vested PSUs. The Companyexpects this expense to be recognized over a weighted average period of 2.0 years.
Nonqualified Stock Options
In July 2015, the Company granted 137,786 NSOs to certain employees. As of July 2019, all outstanding options were fully vestedand exercisable. The fair value of NSOs vested during each of the years ended June 30, 2020, 2019, and 2018 was $0.2 million.
A summary of NSO activity for the years ending June 30, 2020, 2019, and 2018 is as follows:
WeightedWeighted AverageAverage Remaining AggregateExercise Contractual Intrinsic
Shares Price Term (Yrs.) ValueOutstanding at June 30, 2017 ................................................... 116,328 $ 10.70 8.1 $ 1,030
Granted .................................................................................. -Exercised ............................................................................... (10,905) 10.70Forfeited or expired ............................................................... (12,298) 10.70
Outstanding at June 30, 2018 ................................................... 93,125 10.70 7.1 1,700Granted .................................................................................. -Exercised ............................................................................... (10,563) 10.70Forfeited or expired ............................................................... (1,703) 10.70
Outstanding at June 30, 2019 ................................................... 80,859 10.70 6.1 719Granted .................................................................................. -Exercised ............................................................................... (48,467) 10.70Forfeited or expired ............................................................... - -
Outstanding at June 30, 2020 ................................................... 32,392 10.70 5.1 270
Fully vested and exercisable at June 30, 2020 ......................... 32,392 10.70 5.1 270

F-26
11. COMMITMENTS AND CONTINGENCIES
Operating Leases
The Company has lease agreements for certain personal and real property. Leases with an initial lease term of 12 months or less arenot recorded on the balance sheet. Our lease agreements do not include any significant renewal options. Our lease agreements do notcontain any material residual value guarantees or material restrictive covenants.
Upon adoption of ASC 842 on July 1, 2019, the Company�s most significant lease was for the Crest manufacturing facility, which wasclassified as an operating lease. This lease included a purchase option for the Company to acquire the premises. During the threemonths ended September 29, 2019, the decision was made to exercise the purchase option which resulted in $2.8 million of operatinglease assets and liabilities being reclassified to finance lease assets and liabilities on the September 29, 2019 condensed consolidatedbalance sheet. In addition, the decision to exercise the purchase option resulted in the remeasurement of the related lease balanceswhich added $1.3 million of additional finance lease assets and finance lease liabilities to the September 29, 2019 condensedconsolidated balance sheet.
In accordance with the purchase option, on October 24, 2019 the Company completed the purchase of the Crest manufacturing facilityfor $4.1 million. Upon completion of this purchase, the Company recognized approximately $4.1 million in Property, plant andequipment, net and derecognized approximately $4.1 million of both Finance lease assets and Accrued expenses and other currentliabilities. The purchase price of the Crest Facility was determined by appraisal and negotiation between the Company and the seller,whose minority ownership included a member of the Crest management team. The Company funded the purchase by utilizing cashfrom operations.
Total lease cost, including immaterial amounts of variable and short-term lease cost, for the year ended June 30, 2020 was $0.5million and was primarily recognized in Cost of sales. As of June 30, 2020, the total weighted-average discount rate and remaininglease term for the Company's operating leases were 4.73% and 2.26 years, respectively. For the year ended June 30, 2020, totaloperating cash flows related to operating leases were $0.5 million. As of June 30, 2020, future payments due under the Company�soperating leases total $0.5 million and are immaterial in each of the next five years.
Prior to the adoption of ASC 842, future minimum rental payments under all non-cancelable operating leases with remaining leaseterms in excess of one year at June 30, 2019, were as follows:
2020...................................................................................................................................................................... $ 7032021...................................................................................................................................................................... 6902022...................................................................................................................................................................... 6282023...................................................................................................................................................................... 4022024...................................................................................................................................................................... 402Thereafter............................................................................................................................................................. 1,806
Total .................................................................................................................................................................. $ 4,631
Repurchase Obligations
Under certain conditions, the Company is obligated to repurchase new inventory repossessed from dealerships by financial institutionsthat provide credit to the Company�s dealers. See Note 1 for more information regarding the terms and accounting policies related tothis obligation. The maximum obligation of the Company under such floor plan agreements totaled approximately $131.4 million as ofJune 30, 2020. We incurred no material impact from repurchase events during the years ended June 30, 2020, 2019, and 2018. TheCompany recorded a repurchase liability of $1.1 million and $1.9 million as of June 30, 2020 and 2019, respectively.
Purchase Commitments
The Company is engaged in an exclusive contract with a single vendor to provide engines for its MasterCraft performance sport boats.This contract makes this vendor the only supplier to MasterCraft for in-board engines and expires June 30, 2023. The Company isobligated to purchase a minimum number of engines for each model year under this contract. The Company could also be required topay a penalty to this vendor in order to maintain exclusivity if annual purchases under the agreement fail to meet a certain volumethreshold.
Legal Proceedings

F-27
The Company is involved in certain claims and legal actions arising in the ordinary course of business. In the opinion of management,the ultimate disposition of these matters is not expected to have a material adverse effect on the Company�s financial condition, resultsof operations or cash flows.
12. EARNINGS PER SHARE
The factors used in the earnings per share computation are as follows:
2020 2019 2018Net income (loss) ...................................................................................... $ (24,047) $ 21,354 $ 39,653Weighted average shares � basic............................................................. 18,734,482 18,653,892 18,619,793Dilutive effect of assumed exercises of stock options .............................. � 45,799 38,835Dilutive effect of assumed restricted share awards/units.......................... � 68,516 55,904Weighted average outstanding shares � diluted ...................................... 18,734,482 18,768,207 18,714,531Basic net income (loss) per share.............................................................. $ (1.28) $ 1.14 $ 2.13Diluted net income (loss) per share........................................................... $ (1.28) $ 1.14 $ 2.12
For the year ended June 30, 2020, the dilutive effect of approximately 45,000 outstanding RSAs, PSUs and NSOs have been excludedfrom the calculation of diluted earnings per share as the effect would have been anti-dilutive because of the net loss for the year endedJune 30, 2020. For the years ended June 30, 2019 and 2018, an immaterial number of shares were excluded from the computation ofdiluted earnings per share as the effect would have been anti-dilutive.
13. SEGMENT INFORMATION
The Company designs, manufactures, and markets recreational performance sport boats, luxury day boats, and outboard boats underthree operating and reportable segments: MasterCraft, NauticStar, and Crest. The Company�s segments are defined by the Company�soperational and reporting structures.
• The MasterCraft segment produces boats under two product brands, MasterCraft and Aviara, at its Vonore, Tennesseefacility. MasterCraft boats are premium recreational performance sport boats primarily used for water skiing,wakeboarding, wake surfing, and general recreational boating. Aviara boats are luxury day boats primarily used for generalrecreational boating. Production of Aviara boats began during the year ended June 30, 2019 and the Company began sellingthese boats in July 2019.
• The NauticStar segment produces boats at its Amory, Mississippi facility. NauticStar�s boats are primarily used for saltwaterfishing and general recreational boating.
• The Crest segment produces pontoon boats at its Owosso, Michigan facility. Crest�s boats are primarily used for generalrecreational boating.
Each segment distributes its products through its own dealer network. The Company�s chief operating decision maker (�CODM�)regularly reviews the operating performance of each segment including measures of performance based on operating income. Eachsegment has its own management structure which is responsible for the operations of the segment and which is directly accountable tothe CODM. The Company files a consolidated income tax return and does not allocate income taxes and other corporate-levelexpenses, including interest, to operating segments. All material corporate costs are allocated to the MasterCraft segment.
Selected financial information for the Company�s reportable segments was as follows:
For the Year Ended June 30, 2020MasterCraft NauticStar Crest(a) Consolidated
Net sales.......................................................................... $ 246,455 $ 54,930 $ 61,688 $ 363,073Operating income (loss).................................................. 33,229 (17,681) (42,115) (26,567)Depreciation and amortization........................................ 4,679 3,454 2,394 10,527Goodwill and other intangible asset impairment ............ � 13,199 43,238 56,437Purchases of property, plant and equipment................... 6,193 2,804 5,244 14,241

F-28
For the Year Ended June 30, 2019MasterCraft NauticStar Crest(a) Consolidated
Net sales.......................................................................... $ 311,830 $ 77,995 $ 76,556 $ 466,381Operating income (loss).................................................. 53,989 (27,785) 7,055 33,259Depreciation and amortization........................................ 3,481 2,684 1,622 7,787Goodwill and other intangible asset impairment ............ � 31,000 � 31,000Purchases of property, plant and equipment................... 11,730 2,069 265 14,064
For the Year Ended June 30, 2018MasterCraft NauticStar(b) Crest Consolidated
Net sales.......................................................................... $ 266,319 $ 66,406 $ � $ 332,725Operating income (loss).................................................. 49,363 6,620 � 55,983Depreciation and amortization........................................ 3,283 1,803 � 5,086Purchases of property, plant and equipment................... 4,234 1,071 � 5,305
(a) Crest was acquired on October 1, 2018.(b) NauticStar was acquired on October 2, 2017.
The following table presents total assets for the Company�s reportable segments as of June 30, 2020, and 2019.
2020 2019Assets:
MasterCraft ...................................................................................................... $ 294,139 $ 273,046NauticStar ........................................................................................................ 36,720 52,761Crest ................................................................................................................. 40,077 85,979Eliminations ..................................................................................................... (163,013) (163,013)
Total assets.......................................................................................................... $ 207,923 $ 248,773
14. QUARTERLY FINANCIAL REPORTING (UNAUDITED)
The Company maintains its financial records on the basis of a fiscal year ending on June 30, with the fiscal quarters equaling thirteenweeks. The following tables set forth summary quarterly financial information for the years ended June 30, 2020 and 2019. Due toeffects of rounding, the quarterly results presented may not sum to the fiscal year results presented.
Fiscal Quarter EndedFiscal Year
EndedJune 30, March 29, December 29, September 29, June 30,
2020 2020 2019 2019 2020Net sales......................................................................... $ 51,094 $ 102,562 $ 99,628 $ 109,789 $ 363,073Gross profit .................................................................... 7,407 21,274 21,142 25,533 75,356Goodwill and other intangible asset impairment(a)........ � 56,437 � � 56,437Operating income (loss) ................................................ (2,422) (47,177) 10,335 12,697 (26,567)Net income (loss)........................................................... $ (2,836) $ (36,713) $ 6,879 $ 8,623 $ (24,047)Basic earnings (loss) per common share ....................... $ (0.15) $ (1.96) $ 0.37 $ 0.46 $ (1.28)Diluted earnings (loss) per common share .................... $ (0.15) $ (1.96) $ 0.37 $ 0.46 $ (1.28)Weighted average shares used for computation of:
Basic earnings per common share .............................. 18,743,915 18,739,480 18,730,688 18,723,845 18,734,482Diluted earnings per common share ........................... 18,743,915 18,739,480 18,770,783 18,770,756 18,734,482

F-29
Fiscal Quarter EndedFiscal Year
EndedJune 30, March 31, December 30, September 30, June 30,
2019 2019 2018(b) 2018 2019Net sales......................................................................... $ 122,809 $ 128,390 $ 121,541 $ 93,641 $ 466,381Gross profit .................................................................... 31,493 31,357 27,074 23,203 113,127Goodwill and other intangible asset impairment(a)........ 31,000 � � � 31,000Operating income (loss) ................................................ (11,538) 18,464 14,722 11,611 33,259Net income (loss)........................................................... $ (10,062) $ 12,763 $ 10,188 $ 8,465 $ 21,354Basic earnings (loss) per common share ....................... $ (0.54) $ 0.68 $ 0.55 $ 0.45 $ 1.14Diluted earnings (loss) per common share .................... $ (0.54) $ 0.68 $ 0.54 $ 0.45 $ 1.14Weighted average shares used for computation of:
Basic earnings per common share .............................. 18,658,701 18,657,719 18,653,111 18,646,039 18,653,892Diluted earnings per common share ........................... 18,658,701 18,756,605 18,772,322 18,768,764 18,768,207
(a) Goodwill and other intangible asset impairment charges are discussed in Note 6.(b) Crest was acquired on October 1, 2018.


