mcas results report to school committee 2003 mcas results october 21, 2003
TRANSCRIPT

Report to School Committee
2003 MCAS Results MCAS ResultsOctober 21, 2003

New Baseline
Changes in the Testing Program
Results by Performance Category for the District and Individual Schools
Comparable Communities
Next Steps

Changes in Testing ProgramNo Average Scaled ScoresNew Testing Requirement for LEP Students
BHS tested 102 LEP students, 81 of whom would have been previously exempt!
EJH tested 148 LEP students, 127 of whomwould have been previously exempt!
There were 164 students in grades 3, 4, & 6 who would have been previously exempt!

MCAS Testing Program
High Stakes/High Standards
Grades tested: 3, 4, 6, 7, 8, and 10
Tonight’s focus: English/Language Arts Mathematics

Performance Categories
Category
AdvancedProficientNeeds ImprovementFailing/Warning
Score Range
260-280240-259 [240 = proficientproficient]
220-239 [220 = passingpassing]200-219

MCAS 2003
Changes in Performance Categories by Grade

Percentage of Students in Warning/Failing Category
ELA MATH year 98 99 00 01 02 03 98 99 00 01 02 03
Grade 3 14 14 15 [13]State 7 6 7
Grade 4 29 25 22 19 19 18 [15] 39 35 29 27 35 28 [26] State 15 12 16 11 10 10 23 19 18 19 19 16
Grade 6 46 39 37 [36]State 33 30 26
Grade 7 24 19 15 [13] State 12 9 7
Grade 8 69 67 67 48 54 59 [57] State 42 40 39 31 33 33
Grade 10 44 42 42 24 14 19 [14] 76 76 64 35 38 36 [33]BHS 44 41 41 23 13 18 [13] 75 76 64 34 36 35 [32] State 28 32 34 18 14 12 52 53 45 25 25 21

Percentage of Students in Advanced /Proficient Category
ELA MATH year 98 99 00 01 02 03 98 99 00 01 02 03
Grade 3 36 42 42 [44]State 62 67 63
Grade 4 6 8 8 33 32 38 [40] 17 18 23 23 20 22 [23]State 20 21 49 51 54 55 34 36 40 34 39 40
Grade 6 23 29 27 [27]State 36 41 42
Grade 7 31 38 36 [37] State 55 64 65
Grade 8 14 8 12 18 14 13 [14] State 31 28 34 34 34 37
Grade 10 22 24 27 42 61 52 [57] 7 9 16 29 27 33 [36]BHS 22 24 27 43 63 54 [59] 7 9 16 30 29 34 [37]State 38 34 36 51 59 61 24 24 33 45 44 51

Individual School Results
Changes in Performance Categories

Grade 3 Percentage of students in warning categoryGrade 3 Percentage of students in warning categoryELAELA
yearyear 01 01 0202 03 03
Angelo Angelo 1313 1919 25 25 [17][17] 16% 16% ArnoneArnone 1818 2121 16 16 [14][14] 29%29%AshfieldAshfield 3 3 9 9 5 5Belmont St. 13Belmont St. 13 1111 11 11 [ 3][ 3] 18%18%BrookfieldBrookfield 7 7 6 6 6 6DavisDavis 2121 2222 16 16 [14][14] 15%15%DowneyDowney 2222 1616 25 25FranklinFranklin 1010 1111 11 11GilmoreGilmore 1111 1818 16 16 [12][12] 28%28%HancockHancock 7 7 1010 10 10HuntingtonHuntington 1111 8 8 13 13KennedyKennedy 8 8 1010 13 13 [4][4] 15%15%PlouffePlouffe 2828 1919 5 5RaymondRaymond 1818 1717 27 27WhitmanWhitman 6 6 0 0 5 5
LEPLEP

Grade 3 Percentage of students in adv/prof categoryGrade 3 Percentage of students in adv/prof categoryELAELA
yearyear 01 01 0202 03 03
AngeloAngelo 29 29 3636 37 37 [43][43] 16%16%ArnoneArnone 34 34 4040 35 35 [39][39] 29%29%AshfieldAshfield 41 41 4646 45 45Belmont St.Belmont St. 26 26 42 42 51 51 [61][61] 18%18%BrookfieldBrookfield 4141 5555 62 62DavisDavis 2626 2828 38 38 [40][40] 15%15%DowneyDowney 3333 4747 37 37FranklinFranklin 48 48 4040 57 57GilmoreGilmore 3838 3636 20 20 [21][21] 28%28%HancockHancock 5252 5353 53 53HuntingtonHuntington 3737 35 35 36 36KennedyKennedy 37 37 5454 46 46 [52][52] 15%15%PlouffePlouffe 36 36 3333 62 62RaymondRaymond 36 36 44 44 28 28WhitmanWhitman 29 29 3737 38 38
LEPLEP

Grade 4 Percentage of students in warning categoryGrade 4 Percentage of students in warning categoryELAELA MATHMATH
yearyear 98 98 99 00 01 02 0399 00 01 02 03 98 99 00 01 02 0398 99 00 01 02 03 AngeloAngelo 6%6% 23 17 15 16 20 11 23 17 15 16 20 11 [9][9] 50 23 25 24 39 19 50 23 25 24 39 19 [17][17] ArnoneArnone 17%17% 43 31 29 14 22 26 43 31 29 14 22 26 [19][19] 53 46 35 2253 46 35 22 33 32 33 32 [30][30] AshfieldAshfield 40 13 18 15 9 14 40 13 18 15 9 14 46 14 16 15 46 14 16 15 27 15 27 15 Belmont St. Belmont St. 33%33% 18 31 33 21 22 25 18 31 33 21 22 25 [18][18] 42 42 36 2342 42 36 23 37 47 37 47 [42][42] BrookfieldBrookfield 26 33 12 18 12 826 33 12 18 12 8 34 48 21 27 30 11 34 48 21 27 30 11 DavisDavis 13%13% 36 33 34 28 31 24 36 33 34 28 31 24 [23][23] 53 49 46 53 54 26 53 49 46 53 54 26 [25][25] DowneyDowney 27 30 40 32 37 2127 30 40 32 37 21 25 43 41 40 25 43 41 40 52 36 52 36 FranklinFranklin 35 35 15 9 13 6 35 35 15 9 13 6 37 49 22 1137 49 22 11 31 17 31 17 GilmoreGilmore 22%22% 39 29 26 21 11 42 39 29 26 21 11 42 [35][35] 49 44 26 2649 44 26 26 27 56 27 56 [47][47] HancockHancock 19 15 10 7 18 1719 15 10 7 18 17 14 19 17 17 14 19 17 17 31 25 31 25 HuntingtonHuntington 24 13 21 14 5 5 24 13 21 14 5 5 27 17 25 22 24 25 27 17 25 22 24 25 KennedyKennedy 24%24% 9 7 15 18 10 21 9 7 15 18 10 21 [ 9][ 9] 12 21 26 20 20 27 12 21 26 20 20 27 [16][16] PlouffePlouffe 47 25 18 24 28 947 25 18 24 28 9 63 38 28 36 37 28 63 38 28 36 37 28 RaymondRaymond 27 30 22 24 23 1527 30 22 24 23 15 48 37 39 30 48 37 39 30 36 32 36 32 WhitmanWhitman 22 19 16 24 7 422 19 16 24 7 4 63 38 26 31 63 38 26 31 18 8 18 8
LEPLEP

Grade 4 Percentage of students in adv/prof categoryGrade 4 Percentage of students in adv/prof categoryELAELA MATHMATH
yearyear 98 98 99 00 01 02 0399 00 01 02 03 98 99 00 01 02 0398 99 00 01 02 03
Angelo Angelo 6%6% 8 27 18 52 38 54 8 27 18 52 38 54 [56][56] 10 41 42 39 29 40 10 41 42 39 29 40 [41][41]ArnoneArnone 17%17% 12 9 8 44 39 39 12 9 8 44 39 39 [43][43] 20 12 23 36 27 18 20 12 23 36 27 18 [20] [20] AshfieldAshfield 1 5 5 27 33 40 1 5 5 27 33 40 16 28 16 31 23 26 16 28 16 31 23 26 Belmont St. Belmont St. 33%33% 3 6 4 30 34 23 3 6 4 30 34 23 [25][25] 16 12 10 13 12 10 16 12 10 13 12 10 [11][11] BrookfieldBrookfield 4 2 5 28 19 40 4 2 5 28 19 40 19 7 23 16 13 34 19 7 23 16 13 34 DavisDavis 13%13% 5 1 3 19 13 31 5 1 3 19 13 31 [32][32] 11 8 10 11 8 14 11 8 10 11 8 14 [14][14] DowneyDowney 2 4 2 18 12 30 2 4 2 18 12 30 19 10 14 13 11 23 19 10 14 13 11 23 FranklinFranklin 0 2 2 40 35 52 0 2 2 40 35 52 6 11 28 35 24 27 6 11 28 35 24 27 GilmoreGilmore 22%22% 8 2 4 15 46 13 8 2 4 15 46 13 [16][16] 18 3 18 8 29 6 18 3 18 8 29 6 [ 8] [ 8] HancockHancock 8 11 10 50 26 36 8 11 10 50 26 36 29 32 29 23 19 20 29 32 29 23 19 20 HuntingtonHuntington 12 7 8 35 40 40 12 7 8 35 40 40 23 25 32 29 24 15 23 25 32 29 24 15 KennedyKennedy 24%24% 15 15 19 43 54 51 15 15 19 43 54 51 [59][59] 36 27 33 23 32 32 36 27 33 23 32 32 [38] [38] PlouffePlouffe 0 19 13 35 36 40 0 19 13 35 36 40 2 21 26 28 30 25 2 21 26 28 30 25 RaymondRaymond 4 3 4 23 26 37 4 3 4 23 26 37 5 10 14 17 17 12 5 10 14 17 17 12 WhitmanWhitman 0 7 8 26 46 62 0 7 8 26 46 62 13 9 28 21 28 3213 9 28 21 28 32
LEPLEP

Grade 6 Percentage of students in warning categoryGrade 6 Percentage of students in warning categoryMATHMATH
yearyear 01 01 02 02 03 03
AngeloAngelo 47 47 40 40 33 33 [32][32] 7% 7%ArnoneArnone 33 33 30 30 33 33 [30][30] 11%11%AshfieldAshfield 54 54 48 48 29 29Belmont St. Belmont St. 59 59 31 31 45 45 [41][41] 18%18%BrookfieldBrookfield 45 45 28 28 32 32DavisDavis 73 73 66 66 52 52DowneyDowney 46 46 38 38 34 34FranklinFranklin 35 35 25 25 26 26GilmoreGilmore 52 52 39 39 53 53 [49][49] 21%21%HancockHancock 30 30 2929 19 19HuntingtonHuntington 46 46 41 44 41 44 KennedyKennedy 33 33 25 40 25 40 [31][31] 16%16%PlouffePlouffe 54 54 50 50 43 43RaymondRaymond 53 53 5050 42 42WhitmanWhitman 27 27 2929 25 25
LEPLEP

Grade 6 Percentage of students in adv/prof categoryGrade 6 Percentage of students in adv/prof categoryMATHMATH
yearyear 01 01 02 02 03 03
AngeloAngelo 28 28 39 39 46 46 [48][48] 7% 7% ArnoneArnone 3232 4242 39 39 [43][43] 11%11%AshfieldAshfield 18 18 18 18 21 21 Belmont St.Belmont St. 18 18 28 28 14 14 [16][16] 18%18%BrookfieldBrookfield 20 20 3838 17 17 DavisDavis 5 5 8 8 14 14 DowneyDowney 22 22 25 25 32 32 FranklinFranklin 28 28 5050 51 51 GilmoreGilmore 10 10 23 23 11 11 [ 9] [ 9] 21%21%HancockHancock 37 37 30 30 33 33 HuntingtonHuntington 23 23 21 21 15 15 KennedyKennedy 32 32 52 52 27 27 [31][31] 16% 16% PlouffePlouffe 23 23 25 25 30 30 RaymondRaymond 12 12 15 15 21 21 WhitmanWhitman 27 27 41 41 34 34
LEPLEP

Grade 7 Percentage of students in warning categoryGrade 7 Percentage of students in warning categoryELAELA
yearyear 01 01 02 02 0303
NorthNorth 2424 13 13 7 7
SouthSouth 2626 18 18 1313
EastEast 2323 26 26 27 27 [11][11] 20%20%
WestWest 2020 14 14 1111
LEPLEP

Grade 7 PGrade 7 Percentage of students in adv/prof categoryercentage of students in adv/prof category
ELAELA yearyear 01 01 02 02 0303
NorthNorth 2424 39 39 3939
SouthSouth 3030 36 36 3636
EastEast 3434 28 28 27 27 [35][35] 20%20%
WestWest 3636 4848 4343
LEPLEP

Grade 8 Percentage of Students in Warning Category
MATH year 98 99 00 01 02 03
NJH 73 73 63 44 49 54
SJH 68 64 64 50 54 58
EJH 72 69 71 52 52 65 [58] 21%
WJH 63 60 65 41 59 53
LEPLEP

Grade 8 Percentage of Students in Adv/Prof Category
MATH year 98 99 00 01 02 03
NJH 10 5 13 21 17 16
SJH 12 11 11 16 13 15
EJH 12 6 10 15 12 9 [11] 21%
WJH 18 10 15 22 15 16
LEPLEP
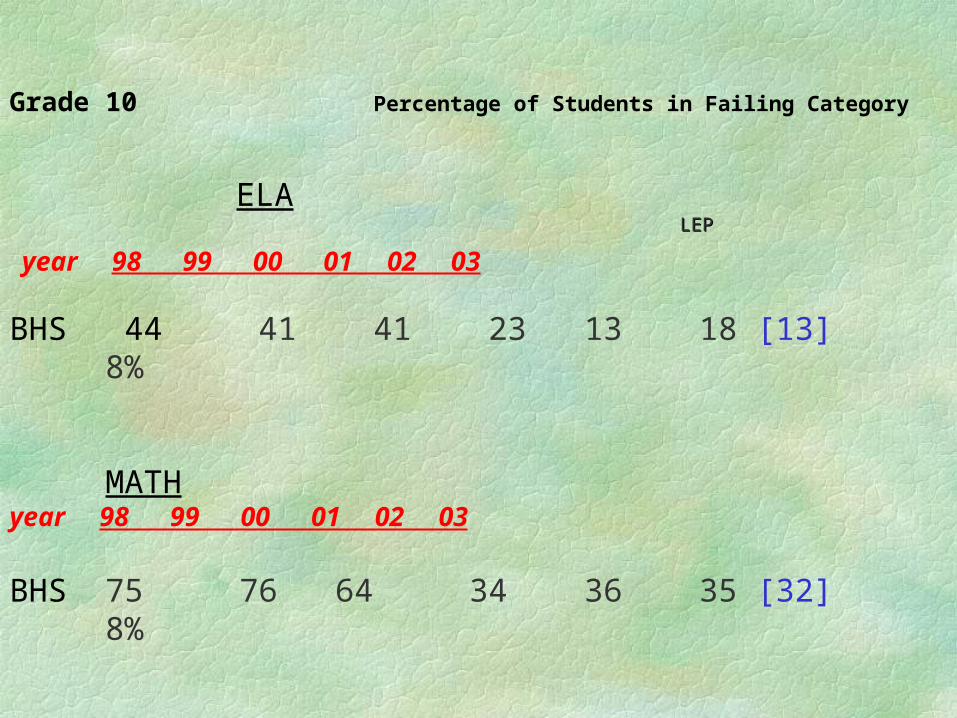
Grade 10 Percentage of Students in Failing Category
ELA year 98 99 00 01 02 03
BHS 44 41 41 23 13 18 [13] 8%
MATHyear 98 99 00 01 02 03
BHS 75 76 64 34 36 35 [32] 8%
LEPLEP

Grade 10 Percentage of Students in Adv/Prof Category
ELA year 98 99 00 01 02 03
BHS 22 24 27 43 63 54 [59] 8%
MATH year 98 99 00 01 02 03
BHS 7 9 16 30 29 34 [37] 8%
LEPLEP

Comparable Communities

Percent of All Students in Warn/Fail Category Grade 3 4 7 10 4 6 8 10
ELA ELA ELA ELA Math Math Math Math
Brockton 15 18 15 20 28 37 59 37
Boston 21 28 16 30 38 50 53 36
Chelsea 11 20 17 41 20 43 64 53
Chicopee 10 15 15 15 25 48 51 28
Fall River 8 13 13 24 22 51 68 50
Holyoke 28 36 30 40 42 63 77 55
Lawrence 27 35 25 37 52 64 72 53
Lowell 19 25 15 22 33 51 57 36
Lynn 11 16 10 21 25 37 52 33
New Bedford 9 15 18 27 24 41 62 42
Pittsfield 6 8 13 12 17 49 44 24
Revere 7 15 12 20 19 25 49 32
Springfield 17 22 23 34 34 62 72 53
Taunton 6 9 9 14 13 31 52 27
Worcester 10 14 19 24 21 34 60 38

Percent of All Students in Adv/Prof Category Grade 3 4 7 10 4 6 8 10
ELA ELA ELA ELA Math Math Math Math
Brockton 42 38 36 52 22 27 13 33
Boston 32 27 42 36 16 20 21 37
Chelsea 41 34 33 27 32 26 15 21
Chicopee 48 37 47 45 24 17 15 38
Fall River 47 36 40 41 25 15 9 22
Holyoke 26 19 20 28 12 11 4 19
Lawrence 25 20 28 28 10 9 9 18
Lowell 38 29 41 43 21 17 15 34
Lynn 47 38 53 42 25 27 17 32
New Bedford 46 34 30 36 21 20 10 27
Pittsfield 62 47 52 50 27 19 24 41
Revere 49 45 46 49 30 35 25 22
Springfield 42 32 30 30 21 10 7 18
Taunton 61 52 52 51 40 29 22 41
Worcester 49 44 37 38 28 31 15 32

Next Steps

Next StepsRevision of School Improvement Plans
Development of Individual Student Success Plans
Increased professional development in literacy instruction
Professional development in teaching vocabulary
Increased application of classroom assessment

Next StepsIncreased professional development in test-taking
strategies
Continued emphasis on Collins Writing Program
Expanded professional development in the instruction of English Language Learners
Next StepsIncreased implementation of standards-based
math program
Collegial sharing of best practices
